Embed Size (px)
Citation preview
MARY RIVER CATCHMENT
COORDINATING COMMITTEE
Cost Benefit Study of Riparian Restoration on the Mary River
Interim Report
Prepared by
Sillar Associates
And
Kingston Rural Management
11 August,1998

CONTENTS
Acronyms Definitions of Terms Used in this Report Map of Mary River Catchment
1. INTRODUCTION............................................................................................................ 5 1.1 Background........................................................................................................... 5 1.2 Study Area............................................................................................................ 5 1.3 Study Approach.................................................................................................... 8
2. THE RIVERBANK RESTORTION GRANTS SCHEME.............................................. 9
2.1 Raison d’Etre & Expenditure to Date................................................................... 9 2.2 Who’s Participating.............................................................................................. 9 2.3 Types & Efficacy of Riparian Works................................................................... 11
3. THE BENEFIT STREAM............................................................................................... 14
3.1 Linkages............................................................................................................... 14 3.2 On Farm Benefits................................................................................................. 14
3.2.1 Nutrient Recycling via Animal Waste................................................... 14 3.2.2 Better Feed Management & Production................................................ 16 3.2.3 Reduced Cattle Mortality by Misadventure........................................... 19 3.3.4 Reduced Cattle Disease......................................................................... 20 3.2.5 Time Saved Mustering & Inspection..................................................... 21
3.2.6 Erosion Loss Avoided............................................................................ 21 3.2.7 Better Quality & Accessibility of Stock Water ..................................... 23 3.2.8 Improved Animal Heat Load Management............................................ 24 3.3.9 Carbon Sequestration............................................................................. 25 3.3.10 Enhanced Environmental Value (TBC) ................................................. 25
3.3 Externality Benefits (TBC)................................................................................... 25 3.3.1 Overview 3.3.2 Reduced Sediment in Downstream Impoundments 3.3.3 Reduced Water Purification Costs Downstream 3.3.4 Lower Terrestrial Weed Recruitment Downstream 3.3.5 Fewer Water Weeds 3.3.6 Improved Fresh Water Fish Habitat 3.3.7 Improved Marine Fishery 3.3.8 Downstream Flood Mitigation & Erosion Loss Avoided 3.3.9 Enhanced Environmental Value
4. THE COST STREAM...................................................................................................... 26
4.1 On Farm Costs...................................................................................................... 26 4.1.1 Investment Costs.................................................................................. 26 4.1.2 Incremental Operating Cost.................................................................. 26 4.1.3 Value of Production Foregone.............................................................. 26
4.2 Externality Costs (TBC)........................................................................................ 26
5. COST BENEFIT ANALYSIS......................................................................................... 27 5.1 Results.................................................................................................................. 27 5.2 Discussion of Results........................................................................................... 28 5.3 Sensitivity Tests................................................................................................... 30
6. CONCLUSIONS AND RECOMMENDATIONS........................................................... 31
ATTACHMENTS

A. Copy of Terms of Reference B. Participants in the Riverbank Restoration Grant Scheme C. Linkages: Riparian Works by Potential Benefits and Costs D. Map of Mary River Catchment E. Study Contacts F. References G. Financial Analysis Inputs and Budgets H. Revenue Generating Ideas I. Mary River Hydrological Data
ACRONYMS
AAER
average annual erosion rate
AE
adult equivalent, a 450 kg animal
CCC
Caloundra City Council
CSC
Cooloola Shire Council
DLP
Drought Landcare Project
DNR
Department of Natural Resources
DoE
Department of Environment
DPI
Department of Primary Industries
ICM
Integrated Catchment Management
KSC
Kilkivan Shire Council
MRCCC
Mary River Catchment Coordinating Committee
MSC
Maroochy Shire Council
NHT
National Heritage Trust
RBS
riverbank stabilisation
RRGS
Riverbank Restoration Grants Scheme
SEQ
South East Queensland
TAG
Technical Advisory Committee
thi
temperature humidity index
TSC
Tiaro Shire Council
DEFINITIONS OF TERMS USED IN THIS REPORT

hard restoration
restoration involving instream rock placement & earthworks
soft restoration
restoration involving riparian revegetation & fencing
dynamic reach
where the river bank is actively eroding
stream bank repose
naturally formed river bank slope
riffle
low rock works in stream bed
toe stabilisation
usually rock works at the toe of a steep riverbank erosion scar
Farm & O Mary River Sillar Associates page 5
verall Costs & Benefits of Riparian Restoration on the
1. INTRODUCTION 1.1 Background The Mary River Catchment Coordinating Committee (MRCCC) commissioned Kingston Rural Management (KRM): “To measure the effects on farm or enterprise profitability, and the overall costs and benefits, of riparian restoration”. (see Attachment A for study terms of reference). This is an economic study which slots into the overall Mary River Catchment Strategy as a part of the Riverbank Stabilisation (RBS) sub program 1 the goal of which is to: “Develop broad scale awareness of riparian areas in the catchment, and seek community participation in developing solutions to prevent further degradation”. Since 1995/96, sixty-five landowners have undertaken riparian restoration works along the Mary River or its tributaries with financial assistance through the Riverbank Restoration Grant Scheme (RRGS). Funding input for the RRGS over three years has been sourced variously from Drought Landcare, Corridors of Green, Natural Heritage Trust and the Cooloola Council and other local government authorities covering the Mary River catchment. This study is one of a suite of similar studies which have been, or are being conducted throughout Australia. Other catchments currently being studied include the Johnstone River catchment (North Qld), the Blackwood catchment (WA), the Berowra catchment (NSW) and the Bega River catchment (NSW). 1.2 Study Area The Mary River catchment covers an area just under a million hectares, extending from Maleny in the south to Maryborough in the north. The length of the Mary River is 305 km but but when the major tributaries are added the total stream length amounts to 2,946 km1.(See Figure 1.1) The catchment covers 12 local government areas, including, from the top of the catchment: Caboolture, Caloundra, Maroochy, Kilcoy, Cooloola, Noosa, Kilkivan, Tiaro, Woocoo, Biggenden, Maryborough, and Hervey Bay. Some 75,000 people live in the catchment and gross annual agricultural production is valued at $200 million2. Beef, dairy, forestry, sugarcane & other field crops, horticulture and sand and gravel mining comprise the main primary industries. The breakdown of catchment land use is shown in Table 1.1.
1 D.P.Johnson (1997) “State of the Rivers - Mary R and Major Tributaries” DNR, Resource Science Centre
2 DNR (1997) “Mary River Catchment Strategy”
Table 1.1 Land Use
Area % of

Farm & Overall Costs & Benefits of Riparian Restoration on the Mary River Sillar Associates page 6
(ha) Catchment Beef farms
455,841
48.49%
Dairy farms
28,667
3.04%
Forestry, National Parks, Local Gov. Areas
364,348
38.77%
Horticulture (pineapples, fruit trees, vegetables)
7,717
0.82%
Sugarcane & other field crops
17,414
1.85%
Residential infrastructure
64,835
6.89%
Mining & other livestock
1,342
0.14%
Total
940,164
100.00%
It is noteworthy that location of dairy farms in the catchment is strongly skewed with an estimated 90 percent located with Mary River or tributary frontage. About two-thirds of the land used for dairying and beef production has been cleared of the original forest vegetation as shown by Table 1.2. Table 1.2 Vegetation Class
On Dairy Farms
(ha)
On Beef Farms
(ha)
Improved pastures/crops
7,044
25%
3,964
1%
Native pasture (few or no trees)
20,730
72%
313,711
69%
Open forest/grazing
893
3%
138,166
30%
Total
28,667
100%
455,841
100%
In the south eastern part of the catchment, rural residential development has expanded over recent years consistent with declining agricultural profitability and now represents the third largest land use. Hydrologically, the Mary River is characterised by an average annual stream flow of 2,309,000 megalitres for the entire catchment with low flow rates for most of the year, rapidly rising to high flow rates in high rainfall events. Current annual known consumption of water is 55,380 ML3 in addition to which there is an unknown useage for stock and farm
3 From Mary R. Catchment Strategy (1997) comprising: (a) a population of 161,000 using townwater
30,000 ML(including inter-basin transfers), (b) irrigation 25,000 ML, and (c ) industry 380 ML

Farm & Overall Costs & Benefits of Riparian Restoration on the Mary River Sillar Associates page 7
household purposes and unregulated irrigation. It is considered that water demand has already become excessive in some tributaries (e.g. Scrubby, Three Mile, Glastonbury, Calico, Widgee and Eel Creeks)4. There are eleven impoundments with a total storage capacity of more than 126,000 megalitres as shown in Table 1.3.
Table 1.3 Storage Name
Stream
Capacity (megalitres)
Baroon Pocket Dam
Obi Obi Ck
62,000
Borumba Dam
Yabba Ck
33,300
Mary R. Barrage
Mary R
11,700
Lake McDonald
Six Mile Ck
9,300
Tinana Barrage
Tinana Ck
4,750
Teddington Weir
Tinana Ck
4,100
Cedar Pocket Dam
Deep Ck
730
Tallegalla Weir
Tinana Ck
460
Maleny Weir
Obi Obi Ck
57
Imbil Weir
Yabba Ck
46
Goomeri Weir
Kinbombi Ck
22
Total Storage
126,465
source: Mary R. Mapping Program Data In the last decade, two big floods (Feb.’92 and Apr.’89) have occurred in the Mary River at the Miva gauging station but, interestingly, all tributaries did not have significant floods at these dates as shown in Table 1.4. DNR’s long standing gauging station at Miva, which dates back to 1910, indicates that five major floods (i.e. > 1:35 year return period) have occurred since 1910, all of these in the last 43 years (i.e. 1955, 1968, 1974, 1989, 1992).
4 From Mary R. Catchment Strategy (1997) page 25
Table 1.4 Annual Exceedence Probability of Recent Flood Events at Selected Gauging Stations
Recent
DNR Gauging Station at:

Farm & Overall Costs & Benefits of Riparian Restoration on the Mary River Sillar Associates page 8
Bellbird
Dagun
Miva
Marodian Flood Events
(Mary R)
(Mary R)
(Mary R)
(Munna Ck)
1992, February
1:5
1:16
1:50
1:3
1992, March
1:5
1:7
1:7
1:4
1989, April
1:35
1:15
1:35
1:3
1988, June
1:7
1:3
1:3
no flood
1988, December
1:4
1:3
1:4
1:3
1974, January
1:3
1:16
1:52
1:8
1968, January
1:9
1:8
1:36
1:3
Source: DNR hydrographs - refer Attachment I 1.2 Study Approach The approach to this on-farm cost/benefit analysis of riparian restoration has comprised the following steps: (1) establish a long list of potential bio/physical benefits (on-farm and external) and linkages with the types of riparian restoration works being undertaken on the Mary R.; (2) quantify potential incremental bio/physical benefit for each type of riparian restoration works; (3) using market prices, standard gross margins and production coefficients ascribe a monetary value to the bio/physical benefit; (4) case study a range of commercial farm participants in the RRGS; (5) for each case study generate a cost stream at market prices using the participants actual outlays and a benefit stream over 20 years based on the type of riparian works undertaken and standard bio/physical outcomes and prices; (6) for each case study generate a benefit/cost ratio and internal rate of return for the incremental investment in riparian restoration works and sensitivity test uncertain parameters.

Farm & O erall Co tion on the Mary River Sillar Associates page 9
v sts & Benefits of Riparian Restora
2. THE RIVERBANK RESTORATION GRANT SCHEME 2.1 Raison d’Etre & Expenditure to Date The basic philosophy attaching to the RRGS initiative is that, “landowners can manage riparian zones on behalf of the broader community and that the broader community is prepared to assist in paying for this management”.5 The scheme is voluntary and landowners are the proactive party in application for grant assistance. In the two and a half effective years of operation to June,1998, approximately $275,000 of grant funds had been disbursed for this work complemented by an investment of about $205,000 by the land owner. RRGS administration and supervision costs amounts to 16% of grant funds6, so progressive total expenditure under the RRGS scheme as at 30 June,1998 amounts to $524,000. In any one year, expenditure (grant + landholder) on an individual landholder project may range from less than $1,000 to, rarely, more than $20,000. Attachment B lists the sixty-five riparian landowners who have undertaken river restoration works under the scheme, the type of work and expenditure. In some instances, landowners have undertaken riparian works in successive years with RRGS assistance. Some landholders have continued the work in subsequent years without further assistance from the scheme. It is noteworthy that an unknown amount of riparian restoration work is going on outside the RRGS which may be landholder funded or supported by other grants. 2.2 Who’s Participating The land-use profile of participants shows that dairy farmers and beef producers are the dominant users of the scheme, comprising 75 percent of participants (see Table 2.2).
5DNR(1997) “Mary River Catchment Strategy” p90
6Based on 1995/96 data in which Grant disbursements for works amounted to $148,194 and administration and supervision cost $23,307.
Table 2.1 Industry Profile of Participants

Farm & Overall Costs & Benefits of Riparian Restoration on the Mary River Sillar Associates page 10
Dominant Industry
Number of
Riparian Projects Funded 7
% of
Participants
Beef
28
38%
Dairy
27
37%
Horticulture
11
15%
Residential
5
7%
Sugar
1
1%
Other (deer/tourism)
1
1%
Total
73
100%
The size of the landholding of the participants varies widely but, in many cases, is small and would be a non-viable area for the dominant land use as indicated from Table 2.3.
Table 2.3 Size of Farmer Participants’ Landholding by Enterprise
Number of Participants whose main enterprise is:
Farm Size (ha)
Dairy
Beef
Horticulture
Total
1-25
1
4
6
11
26-50
1
5
6
51-75
6
2
1
8
76-100
2
3
5
101-150
4
4
1
9
151-200
2
3
5
201-300
1
2
1
4
> 300
2
3
5
7 Of the sixty-five participants, 4 have undertaken riparian work on two years to to give73 “projects”.
2.3 The Type & Efficacy of Riparian Works

Farm & Overall Costs & Benefits of Riparian Restoration on the Mary River Sillar Associates page 11
Seven categories of work are accepted under the RRGS, including ‘soft’ categories: (A) vegetation planting, (B) fencing off the watercourse, (C ) off stream watering points, (D) woody weed control, and ‘hard’ categories: (E) instream works, (F) gully stabilisation works, and (G) stream bank stabilisation works. Rarely is one category of work undertaken in isolation (e.g. fencing-off the watercourse is commonly associated with off stream watering points and tree planting). Watercourse fencing is the dominant type of works, with tree planting and installation of off stream watering points also common.(Table 2.1)
Table 2.1 Frequency of Projects with Different Types of Riparian Works Type of Riparian Works
Number of Landholder
Projects which include:
% of
Landholders
Fencing-off watercourse
52
34%
Vegetation planting
38
25%
Off stream watering points
33
21%
Woody weed control
15
10%
Instream works
8
5%
Stream bank stabilisation
5
3%
Gully stabilisation
3
2%
Total over 2 years
154
100%
Vegetation planting includes trees and herbaceous plants such as Lomandra sp. Off-stream planting of trees for cattle shade has been undertaken in some instances and is an important complementary investment if shade is not available on the farm away from the watercourse. To date, no grant funds have been made available for artificial shade, but logically this should be considered as a part of the RRGS, if shade denial is a penalty cost of riparian restoration. Watercourse fencing varies considerably in its potential to impact on on-farm management depending upon how much is fenced out, whether cattle are allowed into the fenced area for periodic grazing after fencing or, whether the river bank is totally or partially fenced out. Offstream watering points usually involves the creation of water troughs to which water is pumped although small farm dams have also been approved under the RRGS. The distinction between dam or troughed water is important because of production benefits from cleaner troughed water. The number, and placement, of the watering point in relation to feed supply

Farm & Overall Costs & Benefits of Riparian Restoration on the Mary River Sillar Associates page 12
is also likely to impact on the efficiency of grazing. Woody weed control in the riparian zone may involve poisoning or mechanical removal. Instream works comprise rock based riffles to moderate and redirect low channel flows, stabilising of cattle and vehicle crossings and stock watering access points. Stream bank stabilisation is defined as rock works to toe stabilise steep erosion banks, although in effect vegetation planting and stream fencing also achieves bank stabilisation. Gully stabilisation refers to treatment of on-farm erosion gullies by various techniques. The goals of riparian restoration, in environmental and physical terms, are generally stated to comprise: (a) stabilising the riverbank, (b) helping to achieving channel integrity and terrestrial biodiversity and (c )to assist instream habitat maintenance. Preference is given to ‘soft’ solutions (e.g. vegetation planting & fencing) rather than ‘hard’ solutions (e.g. rock works) with a view to achieving a better environmental outcome and to be cost effective. From the point of view of analysing the financial benefit, the efficacy of the type of works to achieve the above goals is critical. Germane to a cost/benefit analysis is quantification of riparian attributes ‘with’ intervention compared to stream attributes ‘without’ intervention. The efficacy of the riparian works will determine the incremental benefit. From a benefit/cost perspective, the optimum financial investment (e.g. on river bank stabilisation) may not totally prevent some future damage occurring in big flood events. The “best bet” solution, (the optimum trade-off between amount of dollars invested and efficacy), is not always known but, in general, experience has shown that low cost, well designed intervention will give a better benefit/cost outcome. Some issues on the Mary R. which confound the efficacy of a particular riparian restoration endeavour are: • without a coordinated, stream reach approach, riparian works by individual farmers
may be ineffective, or considerably compromised by neighbour inaction or inappropriate upstream actions which transfer the problem downstream;
• in ‘dynamic’, highly vulnerable areas (e.g. river bends, banks along impoundments)
the ‘best bet’ solutions are likely to require a higher investment and it is in these situations where the trade-off between dollars invested and efficacy is likely to be most acute and often raises the question of public good vs private good and who should pay;
• the soil types of the riparian and adjacent zones vary in their predisposition to
erosion and some (e.g. sodic dispersible clays) may need management techniques outside the array of works now undertaken to significantly arrest sediment discharge;
• different riparian restoration objectives may not be compatible (e.g. optimising bank
stabilisation using the best species for this purpose is foregone to achieve biodiversity and focus on Australian natives);

Farm & Overall Costs & Benefits of Riparian Restoration on the Mary River Sillar Associates page 13
• because the RRGS does not prioritise works on the basis of potential benefit and
because there are major contributing factors to ‘externality’ environmental damage not being addressed under the scheme, external benefits of individual projects in relatively stable parts of the catchment contribute little.

ver Sillar Associates page 14
Farm & Overall Costs & Benefits of Riparian Restoration on the Mary Ri
3. THE BENEFIT STREAM A long list of potential benefits (both ‘on-farm’ and ‘externalities’ 8) arising from different types of riparian works funded by under the RRGS has been generated. In this section these potential benefits are described, their significance evaluated and, where possible, quantified. The evaluation is based on interviews with, and questionnaire response from, riparian landowners, consultation with technical experts in various fields, literature search and our own experience in other catchments. The output of the evaluation hereunder provides the necessary inputs into a cost/benefit model applicable to any specific riparian restoration work on the Mary River . It is noteworthy, because of the short life of the RRBS, only a small proportion of the overall river has so far been restored under the RRBS. Also, no major floods have occurred since the restoration work commenced to test the beneficial impacts of riparian works (particularly relating to riverbank erosion). 3.1 Linkages Establishing linkages between types of riverbank restoration works (viz. those listed in Section 2.3) and possible ‘on-farm’ and ‘externality’ bio/physical benefits is the first step towards elucidating the financial justification of specific riparian restoration works. Attachment-C conceptualises the linkages between specific types of riparian works and specific on-farm dairy and beef enterprise benefits and specific externality benefits. This conceptualisation highlights that in general tangible, although in some cases not large, on-farm bio/physical benefits are derived from riverbank restoration. On the other hand, linkage between riparian works and externality benefits is difficult to quantify and, it is postulated, due to the smallness of individual riparian works, likely to be limited until collectively a significant area has been restored. 3.2 On-Farm Benefits 3.2.1 Nutrient Recycling via Animal Waste
8 In economic terms, “externalities” concern the beneficial (or harmful) consequences of a resource use (or
restoration) which falls on those who do not pay for, or receive income from, its use. Externalities are seldom traded in the market making the task of their measurement more complex.
Denying cattle access to the stream by fencing off the riparian zone ensures that dung and urine are deposited on land and not in the stream and thus could be expected to increase soil fertility and pasture production. There are, however, some qualifiers to this statement as discussed below.

Benefits of Riparian Restoration on the Mary River Sillar Associates page 15
Farm & Overall Costs &
The major plant nutrients (nitrogen, phosphorus and potassium) excreted in manure annually by an adult dairy cow has been estimated (e.g. Fulhage & Pfost9). This research has indicated that of the total nitrogen in manure , approximately two-thirds occurs as ammonium nitrogen and one-third as organic nitrogen. Most of the ammonium nitrogen is lost to the air and about 70 percent of the organic nitrogen is available to the plant after mineralisation. On the other hand, nearly all of the phosphorus and potassium is available to the plant. Table 3.1 summarises the potential nutrient supply from a 450 kg dairy cow over 12 months.
Table 3.1 Nutrient
Annual production
in manure (kg/head/year)
Net annual return of
nutrients (kg/head/year)
Nitrogen
75
17
Phosphorus
16
16
Potassium
48
48
Source: adapted from Fulhage & Pfost However, a number of other critical factors are likely to affect the beneficial impact on soil fertility and pasture productivity, including (a) the base line soil fertility and type of the pasture and its ability to respond to added nutrition (e.g. added nutrient may be surplus to requirements for optimum growth), (b) the use of pasture management procedures to optimise nutrient recycling (e.g. use of pasture harrows), (c ) the proportion of beneficial defecation actually falling on productive pasture land (and not, for example, in laneways, milking sheds & cattle camps etc), and (d) the amount of animal waste unproductively deposited in the riparian zone before fence construction and thus, the incremental benefit. While it is generally accepted that 90% of animal waste is deposited away from the milking shed, it is difficult to estimate the incremental increase in nutrients being added to pastures as a result of forcing the cows to spend more time on the pasture, as a consequence of riparian fencing.
9 Fulhage,C.D. & Pfost, D.L. (1993) “Fertilizer Nutrients in Dairy Manure” Department of Agricultural
Engineering, University of Missouri-Columbia (http://muextension.missouri.edu/xplor/waterq/wq037.htm) - based on a 455 kg animal
Irrigated, nitrogen-fertilized rye grass is the most common pasture system for dairy farms in the winter, reverting to kikuyu in the summer. Cows usually graze this pasture, on a full-time, rotational basis at 5 cows/ha stocking rate. High levels of nitrogen fertilizer (up to 800kg urea/ha/year) are required to maintain the system and potassium deficiency is common, particularly under irrigation; superphosphate is periodically applied. To ascribe economic benefit, it is assumed that 5% of animal manure and urine which was previously deposited directly in the stream is, post stream-fencing, deposited on rye grass pasture (see Figure 3.1) . At farmgate fertilizer substitution prices for nitrogen, potassium and phosphorus (see Attachment G) the long term annual value of nutrient recycling via

animal waste amounts to $616 for a 100 cow herd. Figure 3.1 Assumed Dairy Cow Waste Distribution - Before and After Stream Fencing
Before
After
3.2.2 Better Feed Management & Production The types of RRGS riparian restoration works which may give rise to better feed management and production are: (a) fencing off the water course and, (b) off stream
Farm & Overall Costs & Benefits of Riparian Restoration on the Mary River Sillar Associates page 16

Farm & Overall Costs & Benefits of Riparian Restoration on the Mary River Sillar Associates page 17
watering points. Better feed management, and production there from, can occur on both dairy and beef farms because a more efficient rotational grazing system can be implemented as a results of having more stock watering points available. Sometimes, however, the farmer already has in place an optimum rotational grazing system and incremental improvement in forage utilisation in these cases is likely to be small. The greatest benefit occurs where the farmer, following the installation of RRGS-supported off stream watering points, constructs further subdivisional fencing to enable improved rotational grazing around the new watering points. From a cost/benefit analysis viewpoint the critical point is what would have happened without the trigger of the RRGS investment. In the case where the RRGS has stimulated an investment which would otherwise not have taken place, all the incremental production benefits accruing there from can legitimately be brought to account provided all the incremental costs in fencing and watering facilities are also accounted for in the benefit/cost equation. However, if the farmer would have done the work anyway in the same timeframe, no benefit can be ascribed to the RRBS project. Another possibility is that the catalyst of a RRGS grant may cause the farmer to bring forward an investment in a superior rotational grazing system which would have undertaken anyway, but at a later date. In this latter situation, an improvement in the cash flow occurs and a benefit can legitimately ascribed to the RRGS, and consequential, investment. What is the quantum and value of better feed production arising from this type of riparian restoration? To answer this question for the Mary River we use two case studies: (a) a dairy farmer (JG Watson) on the upper Mary R and, (b) a beef producer (N&J Viner) on Glastonbury Creek. In both these case studies additional fencing & other investment to that funded under the RRGS had occurred. (a) Dairy farmer (JG Watson). The following key parameters refer: Type of pasture (with & without)...........................................
: irrigated rye grass fertilized; grazed for 150 days per year
Area of pasture (ha)(with and without)..................................
: 30 ha
“Without” Production Coefficients
Pasture management system ... . . . . . . . . . . . . ......................
: 2 paddocks, half-on, half-off grazing; stock water in stream
Size of grazed cell..................................................................
: 15 ha
Annual inputs .......................................................................
: rye grass seed, 500 units N/ha, 100 units P & K, 5ML/ha irrigation
Annual cost of inputs ($/ha) ...................................................
: $1,000

Farm & Overall Costs & Benefits of Riparian Restoration on the Mary River Sillar Associates page 18
Annual lime equivalents required to stop long term acidification (kg/ha/yr)
: 240 kg
Avg. annual cost of lime for sustainability @ $70/t ($/ha/yr)
: $16.80
Forage harvested by grazing animals (tonnes dry matter/ha) ..
: 8 tonnes
Milk production per year (@ 1 litre milk per 1 kg dry matter)
: 8,000 kg x 30ha = 240,000 litres
Gross margin excluding pasture inputs (@ 24c/litre average)
: $57,600
(A) Annual gross margin ($/enterprise)
: $57,600 - $30,000 - $500 = $27,100
“With” Production Coefficients
Pasture management system ... . . . . . . . . . . . . ......................
: 24 paddocks, 21- day rotation; stock water at 2 off-stream watering points
Size of grazed cell..................................................................
: 1.25 ha
Annual inputs .......................................................................
: rye grass seed, 500 units N/ha, 100 units P & K, 5ML/ha irrigation
Annual cost of inputs ($/ha)..................................................
: $1,000
Annual lime equivalents required to stop long term acidification (kg/ha/yr)
: 360 kg (= 8 cwt/ha)
Avg. annual cost of lime for sustainability @ $70/t ($/ha/yr)
: $25.20
Forage harvested by grazing animals (tonnes dry matter/ha) ..
: 15 tonnes
Milk production per year (@ 1 litre milk per 1 kg dry matter)
: 15000 kg x 30ha = 450,000 litres
Gross margin excluding pasture inputs (@ 24c/litre average)
: $108,000
(B) Annual gross margin ($/enterprise)
: $108,000 - $30,000 - $760 = $77,240
Incremental capital investment : - RRGS (grant + farmer input) 2 off stream watering points, including materials & labour for troughs, reservoir, pipe reticulation .......................................................................... - further subdivision fencing(9000 m @ $1.29/m), farmer input.................................................................................... - Total investment (grant + farmer input).............................
: $8,530 : $13,100 : $21,630
Annual incremental operating costs:- fence maintenance & operating (materials R&M) - labour.................................................................................
: $200 : $ zero
Annual Incremental Gross Margin ($) (B-A)
:$50,140
(b) Beef Producer (N&J Viner). The following key parameters refer:

Farm & Overall Costs & Benefits of Riparian Restoration on the Mary River Sillar Associates page 19
Type of pasture..................................................................... : mixture native & introduced pasture Area of pasture (whole cell grazing full system) (ha)
: 729
“Without” System Pasture management system.....................................................
: continuous grazing
Carrying capacity (Ha/AE; AE).............................................
: 2.03 359
Average annual liveweight gain (kg/head/day) .....................
: 0.4
(A) Annual gross margin ($/enterprise)...............................
: $62,444
“With” System
Pasture management system ..................................................
: cell grazing; stocking density = 50 AE/ha; total no. cells = 64
Average size of grazed cell....................................................
: 13 ha (grazed for 0.2 to 1.0 days
Carrying capacity (Ha/AE; AE).........................................
: 1.70; 429
Average annual liveweight gain (kg/head/day) ....................
: 0.7
(B)Annual gross margin ($/enterprise) ..............................
: $131,650
Incremental Capital Investment
- RRGS riparian fencing & watering (grant + farmer input)..
: $14,839
- Further investment fencing, ‘Dosetron’ etc (farmer input)..
:$ 97,908
- Total investment (grant + farmer input).............................
:$112,747
Annual Incremental operating cost not in gross margin
- fence operating (electricity & materials R&M)....................
:$200
- labour (@ $12.50/hr)...........................................................
: zero 10
- Total incremental operating cost..........................................
:-$200
Winter/Summer management variation..................................
: Summer - “tickguard”; Winter nothing
Annual incremental gross margin ($) (B-A).......................
: $69,200
3.2.3 Reduced Cattle Mortality by Misadventure Steep and eroded riverbank strewn with logs can be hazardous for grazing animals. However
10 Without cell grazing mustering comprised 4 times/yr @ 18md/muster = 72md/yr; with cell grazing 4 musters/yr @3 md/muster =
12md/yr. Howevert more time is required for fence maintenance and bookwork as a consequence the project is assumed to be labour neutral

Farm & Overall Costs & Benefits of Riparian Restoration on the Mary River Sillar Associates page 20
the degree of hazard varies widely. Our farmer survey shows this factor to account for zero to 0.5% of overall herd mortality in dairy herds and to be negligible in beef herds. This loss is avoided by fencing-off the watercourse. This loss is valued at the farm gate replacement cost of a dry dairy cow with district average production potential, estimated to be $800. For a herd comprising 100 head, the average loss avoided would therefore be $400/year. 3.2.4 Reduced Cattle Disease Dairy and beef enterprises differ in the potential for riparian restoration works to reduce cattle disease. Dairy Enterprise A dairy enterprise may suffer higher chronic mastitis in the milking herd due to the cow habit of standing udder-deep in the stream to drink or, in the summer, to simply cool-off. The potential for the stream to cause mastitis will be influenced by the quality of the water in the stream - flowing water less likely to cause a problem than stagnant water. Also, mastitis is more likely to be caused by other pre-disposing factors such as a muddy bale exit area & muddy laneways, access to stagnant off-stream dams and poor milking shed hygiene. On the other hand, cooling in the stream can enhance milk production (see Section 3.2.8), particularly in the summer, and thus offset the potential mastitis penalty. Assigning a mastitis reduction benefit to stream fencing is complex. Because many other factors, more likely to cause mastitis, are operating it is concluded that in most situations in the Mary River catchment, the mastitis avoiding benefit of stream fencing is likely to be small. For the purpose of the economic analysis mastitis reduction from fencing off the water course is assumed to be zero. Beef Enterprise Mastitis is generally not a problem in beef cattle. However the incidence of internal parasites (worms) and external parasites (cattle ticks) may be reduced by a rotational grazing system which breaks the life cycle of the parasite. Thus riparian restoration works which, in the first instance, includes watercourse fencing and off-stream watering points in conjunction with subsequent on-farm development of more sub-division fencing and the attendant implementation of a rotational grazing system may beneficially reduce the burden of internal and external parasites. However, any incremental increase in beef cattle production through parasite control from a rotational grazing system is confounded by the intrinsic genetic resistance of the particular beef herd to cattle ticks and worms. Cattle ticks (Boophilus microplus), the tick borne diseases (Babesiosis) and internal parasites are endemic to the Mary River catchment. For cattle-tick control, the normal simple management practice is to run a herd which is

Farm & Overall Costs & Benefits of Riparian Restoration on the Mary River Sillar Associates page 21
genetically resistant to cattle tick (e.g. by cross-breeding with Bos indicus cattle). This eliminates dipping or reduces dipping to infrequent seasonal treatments in time of stress. In this situation the incremental benefit from decreasing the tick challenge by rotational grazing is likely to be small and, in the majority of cases, can be ignored as a potential benefit from riparian restoration work. Furthermore, because tick larvae can survive on pastures for 3 to 5 months, the short rotational grazing cycles (usually less than one month) on intensive beef management systems, adopted as a consequence of riparian zone fencing, are too short to have a beneficial effect of reducing tick challenge. Developing a herd with intrinsic genetic worm resistance has, up until now, been more elusive11 and most beef herds in the catchment could be expected to include enough animals in the herd susceptible to worms to require, under optimum management, some drenching of young cattle but usually not adult cattle. Where applicable, we have assumed that a rotational grazing system reduces the need for one drenching of weaner cattle. The financial cost of worm drench currently amounts to $3.30/weaner. 3.2.5 Time Saved Mustering & Inspection Riparian works most likely to save time in mustering and periodic herd inspection are the combination of fencing off the water course, installing off-stream watering points and additional subdivisional fencing. The amount of time saved is quite variable but is most likely to be a factor on dairy farms because the cow herd is mustered twice a day. Time saved has been estimated at between zero and 20 minutes per day on dairy farms depending upon such things as the completeness of the riparian zone fencing and whether the cattle are still given access to the riparian zone after fencing. On some farms, mustering time saving benefits are offset by increase demands on time (e.g. extra time to shift cattle in a rotational grazing system), and thus may be time neutral for both dairy and beef enterprises. Where a time saving is expressed by a farmer, the annual incremental benefit is priced on the basis of farm labour at $12.50 per hour. 3.2.6 Erosion Loss Avoided Riparian works which may contribute to arresting river bank erosion comprise the ‘soft’ works of tree planting and protection of the riparian zone by fencing as well as the ‘hard’ instream and bank stabilising structures. To assign erosion abatement benefits to a particular type of works requires the generation of average annual erosion rate (AAER) ‘with’ and ‘without’ intervention. Ideally this requires
11New technology using gene markers (e.g. at Belmont Research Station) to identify worm resistance is
likely to give producers a tool for worm resistance selection in the future.

Farm & Overall Costs & Benefits of Riparian Restoration on the Mary River Sillar Associates page 22
knowledge of: (a) The efficacy of the particular type of works to achieve a quantifiable level of
protection for the particular site; and (b) Quantification of a damage/probability curve for the site. With respect to point (a) it is noteworthy, particularly where the stream is dynamic, “soft” types of riverbank protection may not be absolute and long term erosion will continue, albeit at a reduced rate. In the absence of documented data it has been assumed that “soft” protection achieves 50% future loss avoidance in dynamic and 100% in non dynamic situations. “Hard’ riparian restoration works are assumed to achieve 100% loss avoidance in both dynamic and non dynamic situations with the qualification that where “toe stabilisation” only has been undertaken, final bank stability will take several sequential years until natural contouring is completed. The State of the River12 survey found that the two predominant in situ man-induced factors affecting bank stability were stock (57% of sites) and clearing of vegetation (43% of sites) suggesting, prima facie, that riparian restoration which involved removal of stock and revegetation would mitigate erosion loss. For the whole catchment the State of the River survey rated 17% of the stream length ‘very unstable’ to ‘moderately stable’ and 83% ‘stable’ to ‘very stable’. In particular, the ‘very unstable’ rating applied to ponded reaches of the Mary River above the barrage and on parts of Munna Creek. The next most erosion-prone sub-catchment was the upper reaches of Mary River itself which rated ‘unstable’ to ‘moderately stable’. The majority of the other tributaries were ranked as ‘stable’. Notwithstanding these generalisations, bank erosion may occur anywhere and particularly at bends and seepage points. With respect to point (b), establishing damage/probability curves requires further study. Land owners are generally unable to say with any degree of confidence how much land was eroded for each past flood event over the recent past, although they are generally able to say, for example, “so many acres has been lost since 1960". Our preliminary attempt to generate a generic damage/probability curve for Mary River tends to suggest that a different shape to the curve exists for dynamic and non dynamic situations. In the dynamic situation the curve tends to be flat, reflecting relatively significant damage for small floods as well as for large flood events. In non dynamic situations small floods cause relatively little damage. However our preliminary data is not robust enough to differentially apply these damage/probability curves and average annual loss from erosion, ‘without’ intervention, is assumed to equal total land area eroded divided by the number of years over which the observation was made for a particular farm. Avoidance of productive land loss from bank erosion can be a significant tangible on-farm
12 D.P.Johnson (1997) “State of the Rivers - Mary R and Major Tributaries” DNR, Resource Science
Centre
Farm & Overall Costs & Benefits of Riparian Restoration on the Mary River Sillar Associates page 23
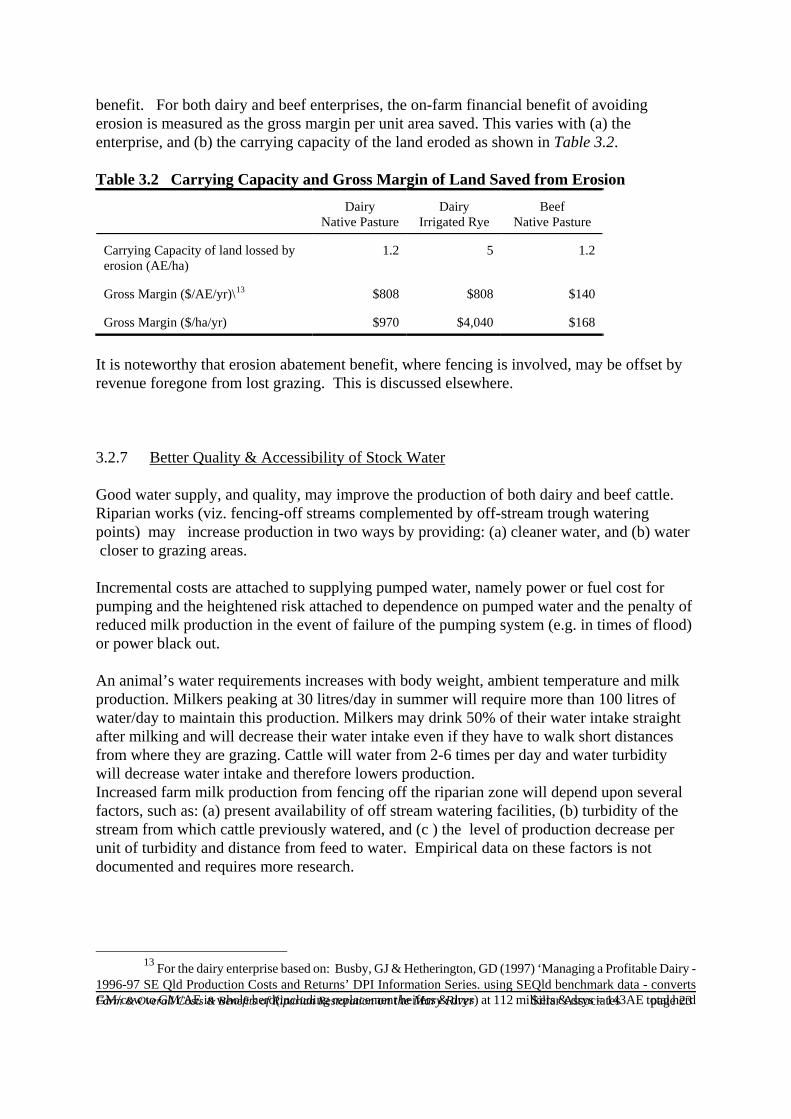
benefit. For both dairy and beef enterprises, the on-farm financial benefit of avoiding erosion is measured as the gross margin per unit area saved. This varies with (a) the enterprise, and (b) the carrying capacity of the land eroded as shown in Table 3.2. Table 3.2 Carrying Capacity and Gross Margin of Land Saved from Erosion
Dairy
Native Pasture
Dairy
Irrigated Rye
Beef
Native Pasture Carrying Capacity of land lossed by erosion (AE/ha)
1.2
5
1.2
Gross Margin ($/AE/yr)\13
$808
$808
$140
Gross Margin ($/ha/yr)
$970
$4,040
$168
It is noteworthy that erosion abatement benefit, where fencing is involved, may be offset by revenue foregone from lost grazing. This is discussed elsewhere. 3.2.7 Better Quality & Accessibility of Stock Water Good water supply, and quality, may improve the production of both dairy and beef cattle. Riparian works (viz. fencing-off streams complemented by off-stream trough watering points) may increase production in two ways by providing: (a) cleaner water, and (b) water closer to grazing areas. Incremental costs are attached to supplying pumped water, namely power or fuel cost for pumping and the heightened risk attached to dependence on pumped water and the penalty of reduced milk production in the event of failure of the pumping system (e.g. in times of flood) or power black out. An animal’s water requirements increases with body weight, ambient temperature and milk production. Milkers peaking at 30 litres/day in summer will require more than 100 litres of water/day to maintain this production. Milkers may drink 50% of their water intake straight after milking and will decrease their water intake even if they have to walk short distances from where they are grazing. Cattle will water from 2-6 times per day and water turbidity will decrease water intake and therefore lowers production. Increased farm milk production from fencing off the riparian zone will depend upon several factors, such as: (a) present availability of off stream watering facilities, (b) turbidity of the stream from which cattle previously watered, and (c ) the level of production decrease per unit of turbidity and distance from feed to water. Empirical data on these factors is not documented and requires more research.
13 For the dairy enterprise based on: Busby, GJ & Hetherington, GD (1997) ‘Managing a Profitable Dairy -
1996-97 SE Qld Production Costs and Returns’ DPI Information Series. using SEQld benchmark data - converts GM/cow to GM/AE in whole herd(including replacement heifers & drys) at 112 milkers & drys = 143AE total herd

Farm & O Sillar Associates page 24
verall Costs & Benefits of Riparian Restoration on the Mary River
Farmers views varied on the subject. The majority considered that cleaner water from off stream troughs was not an issue because, in general, good quality was available from the stream and animals rarely drank water made turbid when drinking. A good supply of water closer to good quality pasture was considered more important. A survey on the Atherton Tablelands14 suggests that clean, readily available, water could increase milk production by 0.5 litre/cow/day. We have adopted this as the model default value where the farmer believes a benefit is derived. Thus, at a gross margin of 20c/L, for a 100 cow herd the maximum annual incremental benefit of troughed water would be $3650.
3.2.8 Improved Animal Heat Load Management
Heat stress can significantly decrease production of dairy cows and the higher the productivity of the cow the greater the effect. When the temperature humidity index (THI) goes above 75 and the milking herd is averaging more than 15 litres/cow/day, production losses will begin to occur unless provision is made for cooling cows. Genetic heat tolerance in the cows and good heat load management strategies on the farm can reduce the impact of high THI. 15
Climatic data for Gympie (see Figure 3.2) shows that THI median value is above 75 for four months (Dec/Mar) and above 78 for 3 days per month over 5 months and therefore there is a prima facie case to provide cooling of milking cows in the summer if production is not to be adversely affected.
Access to the riparian zone can provide a convenient relief from summer heat for dairy cows through shade from riverbank trees and by standing in running water. Fencing off the riparian zone may deny the cooling effect of the riparian zone and could result in a decline in milk production and actually be a negative benefit of such works unless offsetting off-stream cooling was provided by either planting tree shelters or construction of artificial shade structures, the effectiveness of which can be further enhanced with the use of cooling sprinklers.
Planting trees as off stream shade belts is not effective until the trees are at least 3 to 4 years old. On the other hand, artificial shade (e.g galvanised iron roof-only shelter plus sprinklers) has the advantage of being immediate and research at Mutdapilly Research Station has shown such shade is, in any case, more effective, and preferred by cows to trees. The distance cows have to walk to find shade is another factor contributing to heat stress.
14 Anonymous (1998) “Cool Cows: Benefits of Riparian Restoration to Dairy Farmers” School of Field
Studies
15 Davison et al (1996) “Managing Hot Cows in Australia” QDPI
Figure 3.2 Temperature Humidity Index Values for Gympie The financial impact can be calculated using a computer model developed as an adjunct to the ‘Managing Hot Cows’ research. The assumption is made that natural riverbank shade provides ‘average’ (i.e. partial) heat relief. For Gympie, this translates into a gross margin

loss of $1100 per 100 cow herd per year, assuming an average daily milk loss of 0.4
litres/cow/THI value above 75 and a gross margin of 20 cents/litre. For three possible riparian intervention scenarios, the changes in the gross margin loss from heat stress are shown in Table 3.3.
Farm & Overall Costs & Benefits of Riparian Restoration on the Mary River Sillar Associates page 25

Farm & Overall Costs & Benefits of Riparian Restoration on the Mary River Sillar Associates page 26
Table 3.3 Gross Margin Change for a 100 Cow Herd under Different Scenarios for Riparian Restoration & Attendant On-farm Works
Gross Margin/100 Cows per Year
Scenario
“Without”
“With”
Increment
Total riparian zone fence-off; poor off-stream shade which is not corrected regressing heat load management from “avg.” to “poor”
-$1100
-$2400
-$1300
Total riparian zone fence-off; timber planted to provide off-stream shade which maintains heat load management at “avg.” after year 4: - year 1 to 4 - after year 4
-$1100
-$2400 -$1100
-$1300 nil
Total riparian zone fence-off; artificial shade and sprinklers installed immediately lifting heat management from “avg.” to “best” at additional investment of $20,000/100 cow herd
-$1100
-$130
+$970
3.3.9 Carbon Sequestration
In the future, a trade in carbon credits is likely to develop , whereby greenhouse gas polluters buy the right to pollute by renting land growing trees which absorb carbon dioxide and sequester carbon. This trade is only just emerging and one hectare of trees is reported to command a rent from between $80 and $300. How the world trade will develop in carbon credits and the commercial value of the relatively small areas involved in Mary River riparian restoration is unknown. It is possible that in the future, revegetation of the riparian zone with plant species of higher carbon sequestration potential could command such rent. For this analysis, we have sensitivity tested the impact of carbon credits becoming a reality 10 years from now at an assumed rent of $80/ha.
3.3.10 Enhanced Environmental Value This requires a different approach to other components. One approach may be to use property value as a surrogate market for natural resource restoration under the RRGS. It is speculated that the willingness to pay will be greater amongst rural residential riparian landowners. 3.3 Externality Benefits TO BE COMPLETED

Farm & Overall Costs & Benefits of Riparian Restoration on the Mary River Sillar Associates page 27
4. THE COST STREAM 4.1 On-Farm Costs 4.1.1 Investment Costs On-farm investment in riparian restoration works include outlays on materials (e.g. fencing wire, fence posts, energisers, polythene water pipe, pipe fittings, water troughs, water pumps, quarry rock ), labour and equipment hire. Materials, labour and equipment hire are accounted for at actual market price. Farmer’s labour is brought to account at average hired labour rate of $12.50/hour and farmer-owned machinery inputs are brought to account at RRBS standard rates covering operator wages, fuel, oil, repairs and maintenance (see Attachment G). Outlays cover total project costs regardless of source of funds (viz. RRGS grant or farmer) and where the investment takes place over more than one year, the investment is dissected by the year of investment. 4.1.2 Incremental Operating Cost On-going incremental operating cost which apply include labour and materials for repairs and maintenance and fuel for pumping stock water. Generally these are small. 4.1.3 Value of Production Foregone The value of production foregone, or opportunity cost, applies to situations where the riparian zone is fenced and livestock are permanently denied access. Opportunity cost is calculated as:
(area fenced off) x (AE/unit area) x (gross margin/AE) The AE/unit area varies with the type of pasture and rainfall. For naturalised pasture along the riverbank in the upper Mary R. catchment the carrying capacity is assumed to be 1.2AE/ha and for irrigated rye grass pasture 5.0AE/ha. A standard gross margin/AE/year is applied being $808 for dairy herd and $140 for a beef herd. Production foregone only applied when the riparian zone is permanently fenced off. The area permanently fenced off on a particular farm may be the total riparian zone or a part of the riparian zone. 4.2 Externality Costs TO BE COMPLETED
Farm & Overall Costs & Benefits of Riparian Restoration on the Mary River Sillar Associates page 28
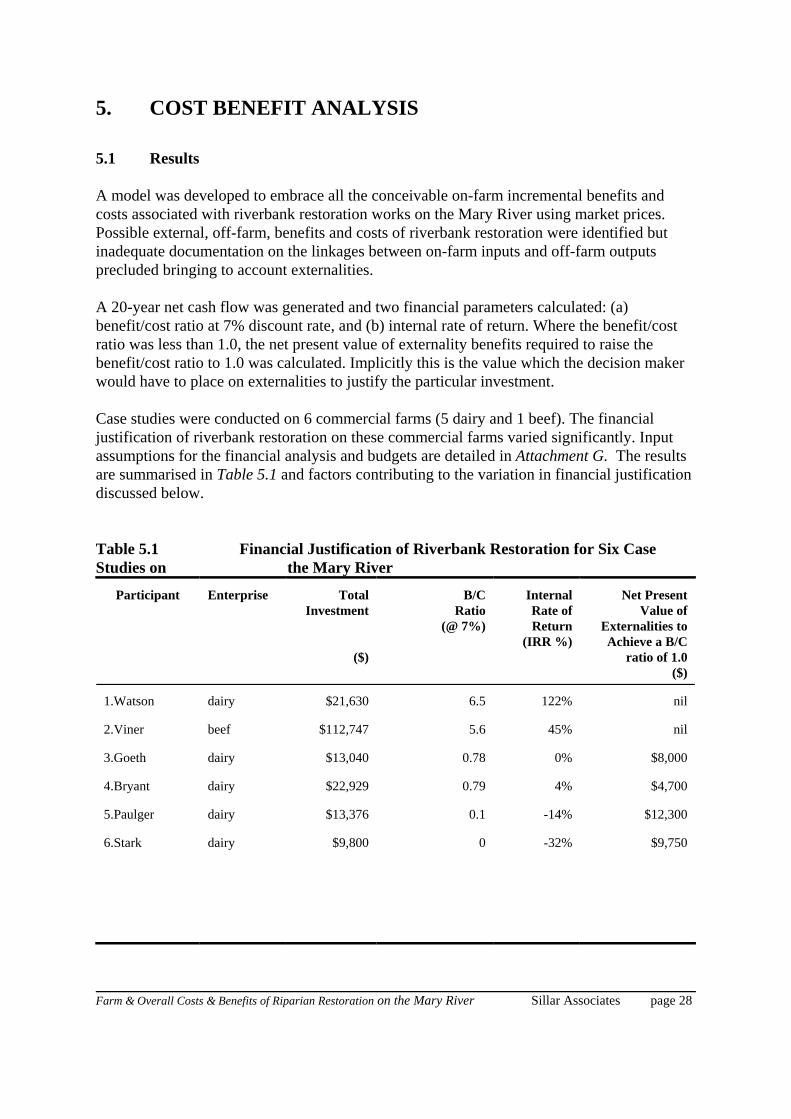
5. COST BENEFIT ANALYSIS 5.1 Results A model was developed to embrace all the conceivable on-farm incremental benefits and costs associated with riverbank restoration works on the Mary River using market prices. Possible external, off-farm, benefits and costs of riverbank restoration were identified but inadequate documentation on the linkages between on-farm inputs and off-farm outputs precluded bringing to account externalities. A 20-year net cash flow was generated and two financial parameters calculated: (a) benefit/cost ratio at 7% discount rate, and (b) internal rate of return. Where the benefit/cost ratio was less than 1.0, the net present value of externality benefits required to raise the benefit/cost ratio to 1.0 was calculated. Implicitly this is the value which the decision maker would have to place on externalities to justify the particular investment. Case studies were conducted on 6 commercial farms (5 dairy and 1 beef). The financial justification of riverbank restoration on these commercial farms varied significantly. Input assumptions for the financial analysis and budgets are detailed in Attachment G. The results are summarised in Table 5.1 and factors contributing to the variation in financial justification discussed below. Table 5.1 Financial Justification of Riverbank Restoration for Six Case Studies on the Mary River
Participant Enterprise
Total
Investment
($)
B/C
Ratio (@ 7%)
Internal Rate of Return
(IRR %)
Net Present
Value of Externalities to Achieve a B/C
ratio of 1.0 ($)
1.Watson
dairy
$21,630
6.5
122%
nil
2.Viner
beef
$112,747
5.6
45%
nil
3.Goeth
dairy
$13,040
0.78
0%
$8,000
4.Bryant
dairy
$22,929
0.79
4%
$4,700
5.Paulger
dairy
$13,376
0.1
-14%
$12,300
6.Stark
dairy
$9,800
0
-32%
$9,750

Farm & Overall Costs & Benefits of Riparian Restoration on the Mary River Sillar Associates page 29
5.2 Discussion of Results The exceptional result on Farms (1) and (2) has occurred because investment under the RRGS triggered further investment in farm development by the respective participants. It is arguable whether the sequential investment would have taken place without the trigger of the RRGS. For this analysis the assumption is made that the sequential investment would not have taken place without the RRGS trigger and the total benefit is attributable to investment under the scheme plus sequential funding. In both cases the strong financial justification stems from more intensive land use through rotational grazing made possible from additional paddocks and watering points. It is considered that most riparian dairy farms already have in place a relatively intensive rotational grazing system and do not have the capacity to incrementally increase production as was experienced on Farm (1). On the other hand, most beef properties do not have in place intensive land use practices and would have the opportunity to intensify production with further capital investment. The interesting extension implication of this result is that more intensive off-river land use is the handmaiden of riparian restoration. For sustainability of such intensive land use systems, it is likely that regular liming will be necessary to prevent acidification. More technical research is required in this area. Farm (3) achieves a relatively strong financial justification because the riparian zone is completely fenced and cattle are permanently denied access. The model generates significant benefit from mustering time saved and on paddock nutrient recycling but both these aspects need validation with further research. Because a good rotational grazing system already existed there is no feed production benefit. Mastitis reduction by denial of access to the stream is assumed to zero, although there is some suggestion that mastitis might increase on this farm as cows seek out mastitis predisposing muddy waterholes to cool off rather than the relatively disease free water of the stream. Because the stream bank on this farm is relatively stable, erosion loss avoided through riparian restoration is small. Denial of summer shade for milking cows16 and loss of grazing in the riparian zone are penalty costs of fencing off the watercourse. Our model factored in loss of production due to increased heat stress for cows in summer, an impact which was assumed to decrease as off-stream shade trees matured. Animal welfare concerns are raised by this model and it begs the question whether RRGS funds might be extended to cover immediate artificial off-stream shade, at least until natural off-stream timber belts can be developed.
16 On this farm cows broke the riparian zone fence last summer seeking shade
Farm (4) is located in a dynamic bank erosion situation, the financial implications of the problem exacerbated by the high productivity of the land being lost from stream bank erosion. The erosion prone segments of the creek bank have been toe stabilised with in-stream rock works and the stabilised segments of the stream bank fenced to exclude the participants cattle. The participant’s cattle continue to have access to other parts of the river and the neighbour’s cattle, from across the stream, are able to access the toe stabilised sector.

Farm & Overall Costs & Benefits of Riparian Restoration on the Mary River Sillar Associates page 30
The interesting point raised by the model for this farm is that, notwithstanding the apparent erosion proneness of parts of the stream bank, the average annual loss avoided is not sufficient by itself to financially justify the level of expenditure incurred; the main benefit being derived from the assumed mustering time saved. While the steep vertical bank of the erosion scar has been toe stabilised, further loss of productive land will occur as the bank continues to repose against the stabilised toe, effectively delaying the achievement of ultimate bank stability. To account for this effect, the model assumes active erosion will continue for 5 years post toe stabilisation with erosion loss avoidance not being realised until year 6. This analysis relied on a rapid appraisal of average annual erosion rate (AAER) and begs the question whether such a rapid appraisal is a valid substitute for more robust erosion/probability data. This aspect requires further research. Because stock continue to have part access to the river, nutrient recycling and disease avoiding benefits are assumed not to occur. Conversely, the penalty cost of shade denial is not incurred. Feed production is not enhanced because a relatively good rotational grazing system was already in existence. Farm (5) has become an unstable river bank situation with large erosion bites being taken out during the 1989 and 1992 big flood events. Under the restoration program, the erosion scars have been fenced off and natural revegetation is progressing; some instream riffle works has been undertaken. The only benefit brought to account in this situation is erosion loss avoided. Future AAER ‘without’ intervention is assumed to be high on the basis of damage incurred since the onset of instability in the early 1980s. Notwithstanding the high AAER, the land being eroded is growing native pasture with a relatively lower gross margin than irrigated rye grass pastures. Also, because “soft” intervention has been adopted on a relatively dynamic bank erosion situation, the model assumes only 50% reduction in AAER post intervention. No other benefits are ascribed to riparian works since cattle can continue to access the stream and a good feed production system is already in place away from the stream. The key question raised by this case study is what is the most appropriate intervention strategy in a dynamic stream situation. Farm (6) occurs in a moderately stable river bank environment. AAER over the past 30 years has been low, although significant scarring occurred in the 1989 flood event. High cost toe stabilisation works have been undertaken to prevent erosion of low gross margin native pasture land. The full benefit of toe stabilisation is not realised until year 6 when natural reposition of the bank is assumed to be completed. No other benefits are ascribed to riparian works since cattle can continue to access the stream. The issue for this farm has been a judgement as to what the future AAER would have been without intervention. By undertaking this expensive riparian restoration works the farmer has judged the future threat to be larger than historical records suggest. 5.3 Sensitivity Test The financial analysis model developed in this study to measure the benefit/costs of riparian restoration has made a number of assumptions relating to the intermediate bio/physical

Farm & Overall Costs & Benefits of Riparian Restoration on the Mary River Sillar Associates page 31
outputs. Further research is required to improve the rigour of these assumptions in some cases. A sensitivity test, on those factors to which there is attached some uncertainty, has been conducted and results presented in Table 5.2. Farm (3) was selected for the sensitivity test because the nature of the riparian works on that farm brings into play a relatively wide range of potential production benefit factors. Table 5.2 Sensitivity of Financial Parameters to Variation in
Bio/Physical Output Assumptions on Farm (3) Bio/Physical Output Assumption
Benefit/Cost Ratio
IRR (%)
Base case
0.78
0%
Base case plus carbon sequestration benefits commencing in year 10
0.80
1%
Base case plus 0.5L/cow/day production benefit from cleaner water closer to grazing area
2.12
34%
Base case but area fenced off in riparian zone increases by 10% from 2.2 ha to 2.42 ha
0.73
-3%
Base case plus artificial shade immediately constructed for $20,000/100 cows to compensate loss of riparian zone shade
0.68
-1%

6. INTERIM CONCLUSIONS AND RECOMMENDATIONS A financial model for measuring the benefits and costs of riparian restoration on the Mary River has been developed. As at the time of presenting this interim report, the model had been applied to six case studies involving commercial dairy and beef farms. A wide range in the benefit/cost ratio was found to exist for riparian restoration works undertaken in these six case studies.
It is recommended that, over the balance of this study, the model be further refined, and a more comprehensive picture of the on-farm benefits of riparian restoration on the Mary River be established by applying the model to an additional six commercial farms specifically selected for differences in location and type of riparian works.
To generate the benefit stream the model uses standardised market prices for inputs and outputs for both dairy and beef enterprises. For the dairy industry the Near North Coast average values17 for dairy herd structure and gross margin have been applied. The model has developed default values for bio/physical output (to which standardised market prices were applied) for the full range of riparian restoration works being undertaken on the Mary River. These default values have been based on documented research results, personal consultation with industry advisers and researchers, and opinions of individual farmers interviewed during the study. For the cost stream, the model uses the project costs incurred as a grant under the RRGS plus participants own funded input costs. Where sequential investments in riparian works by the participant occurred, their stated input costs were applied to the analysis. In some situations information was not available to generate robust linkages between bio/physical consequences and riparian works inputs. In this study, where soft assumptions
Farm & Overall Costs & Benefits of Riparian Restoration on the Mary River Sillar Associates page 32
17 From Busby, GJ & Hetherington, GD (1997) “Managing a Profitable Dairy - 1996-97 SE Qld Production
Costs and Returns”

Farm & Overall Costs & Benefits of Riparian Restoration on the Mary River Sillar Associates page 33
have been necessary, sensitivity tests have been applied for a range of variables. There is a need for further research, beyond the scope of the current study, to improve the robustness of the model as a tool for analysing on-farm benefit costs of riparian restoration and thereby enhancing the quality and acceptance by farmers of the most appropriate type of riparian works for their particular situation.

It is recommended that the following future research be undertaken: • Determine paddock nutrient recycling benefit achieved by denying cattle stream access, in
particular the proportion of dairy cattle waste (urine and faeces) which is beneficially deposited on productive pastures, with particular attention being given to delineating waste distribution between cattle camps, laneways and high and low value pasture with and without river access. This is seen as essentially an animal behaviour study.
• Establish generic riverbank erosion-loss/ probability relationships at sentinel points along the
Mary R., particularly in the dynamic, unstable reaches such as around Kenilworth, along the ponded area above the tidal barrage and in the tidal reach of the river. It is envisaged that this research would involve historical aerial photography interpretation and should establish on-going surveyed datum points to quantify the impact of various types of intervention as well as monitoring loss in undefended sites.
• The handmaiden of responsible riparian zone management on commercial farms may be more
intensive grazing of off-stream land. This would seem to be a financially attractive proposition, particularly for dairy farmers and perhaps also, for beef farmers. Ways of managing intensive off-stream systems for sustainability on the Mary R. over the long term (e.g. preventing soil acidification) need to be researched.
• Some configurations of riparian restoration have low on-farm financial benefit as they are
now proposed and ways of enhancing the financial returns from the riparian zone, consistent with undiminished community benefit from riparian restoration need to be researched and positively promoted as a part of the RRGS package. One way of achieving this objective is to plant trees which generate income, particularly species with short financial payback periods (e.g. floral eucalypts). The feasibility of this proposition needs to be assessed, including a review of suitable species, establishment of demonstration plots in the riparian zone and perhaps market research for the product.
• The availability of clean stock water and having water available close to the grazed paddocks
is reported to increase cattle production significantly. A thorough literature review on this point needs to be carried out and, if necessary, research conducted on the Mary River to quantify the production increase from cattle drinking troughed water rather than stream water.
• The community, or externality, benefits of riparian restoration works for the Mary River
largely remain an act of faith but, concomitantly, the fundamental justification for the RRGS. In terms of externality benefits, such as reduction of sediment generation, defence of public infrastructure (e.g. bridges), improved aquatic habitat (marine and freshwater) it is axiomatic that some parts of the catchment are predisposed to causing more damage than others. A study which takes a global view of the river and identifies the major causes of environmental damage needs to be undertaken with a view to identifying & prioritising major riparian restoration work and thereby achieving the best return for the public dollar invested.
• Around Tiaro sodic soils with dispersible clay B horizons are common. The predisposition of
these soils to ‘pipe’ and deposit large amounts of sediment in the stream are a particular concern to maintaining a healthy river environment. Research into special management techniques to minimise erosion on these soils is needed.
Farm & Overall Costs & Benefits of Riparian Restoration on the Mary River Sillar Associates page 34

Farm & Overall Costs & Benefits of Riparian Restoration on the Mary River Sillar Associates page 35
The unfinished chapters in this report will be completed in the balance of the study. When all the case studies are completed recommendations will be made on the type of riparian works most likely to generate financial on-farm benefit.

Farm & Overall Costs & Benefits of Riparian Restoration on the Mary River Sillar Associates page 36