Embed Size (px)
Citation preview
[email protected] • Kansas • Missouri • Nebraska • North Dakota • South Dakota • Wyoming
Cost-Effectiveness, Cost-Feasibility, and Cost-Benefit Methods
What Are These Methods? And How Can School Districts Benefit from Using Them?
Dale DeCesare and Mark Fermanich
[email protected] • Kansas • Missouri • Nebraska • North Dakota • South Dakota • Wyoming
Who We AreThe Regional Educational Laboratory (REL)
Central at Marzano Research serves the applied education research needs of
Colorado, Kansas, Missouri, Nebraska, North Dakota, South Dakota, and Wyoming.
[email protected] • Kansas • Missouri • Nebraska • North Dakota • South Dakota • Wyoming
Agenda
1. Background of cost analyses2. Review of three key cost-analysis methods (there will be a
quiz!)3. Cost-benefit example
[email protected] • Kansas • Missouri • Nebraska • North Dakota • South Dakota • Wyoming
Activity
Using the Zoom Q&A function, please tell us:• What your role is in your organization.• Why you are interested in these cost-analysis methods.
[email protected] • Kansas • Missouri • Nebraska • North Dakota • South Dakota • Wyoming
Overview
• Education leaders and policymakers constantly operate in restricted fiscal environments.
• Gaps in data from traditional education research:• Cost details• Value of benefits (ROI)
• Key for replication. • IES emphasizing and attempting to build more cost analyses
into rigorous research.
[email protected] • Kansas • Missouri • Nebraska • North Dakota • South Dakota • Wyoming
Cost Analysis Approaches
The three approaches to cost analysis we will discuss are:1. Cost-Effectiveness2. Cost-Feasibility3. Cost-Benefit
[email protected] • Kansas • Missouri • Nebraska • North Dakota • South Dakota • Wyoming
Cost-Effectiveness Analysis
• Used to compare several program alternatives.• Need a common outcome measure.• Combine the common outcome measure with robust cost
analysis to determine which alternative achieves the greatest outcome unit increase per dollar spent.
• Most “effective” approach is not always most cost-effective.
[email protected] • Kansas • Missouri • Nebraska • North Dakota • South Dakota • Wyoming
Which Program to Choose?
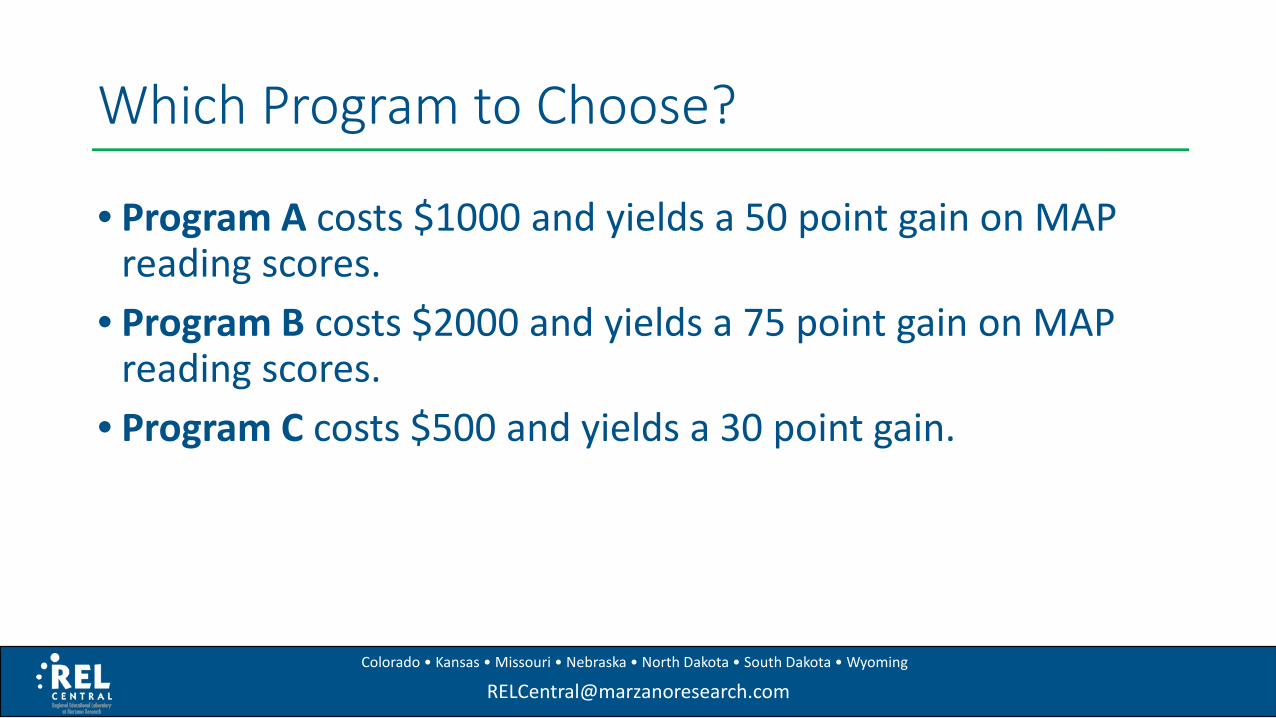
• Program A costs $1000 and yields a 50 point gain on MAP reading scores.
• Program B costs $2000 and yields a 75 point gain on MAP reading scores.
• Program C costs $500 and yields a 30 point gain.
[email protected] • Kansas • Missouri • Nebraska • North Dakota • South Dakota • Wyoming
Which Is Most Cost Effective?
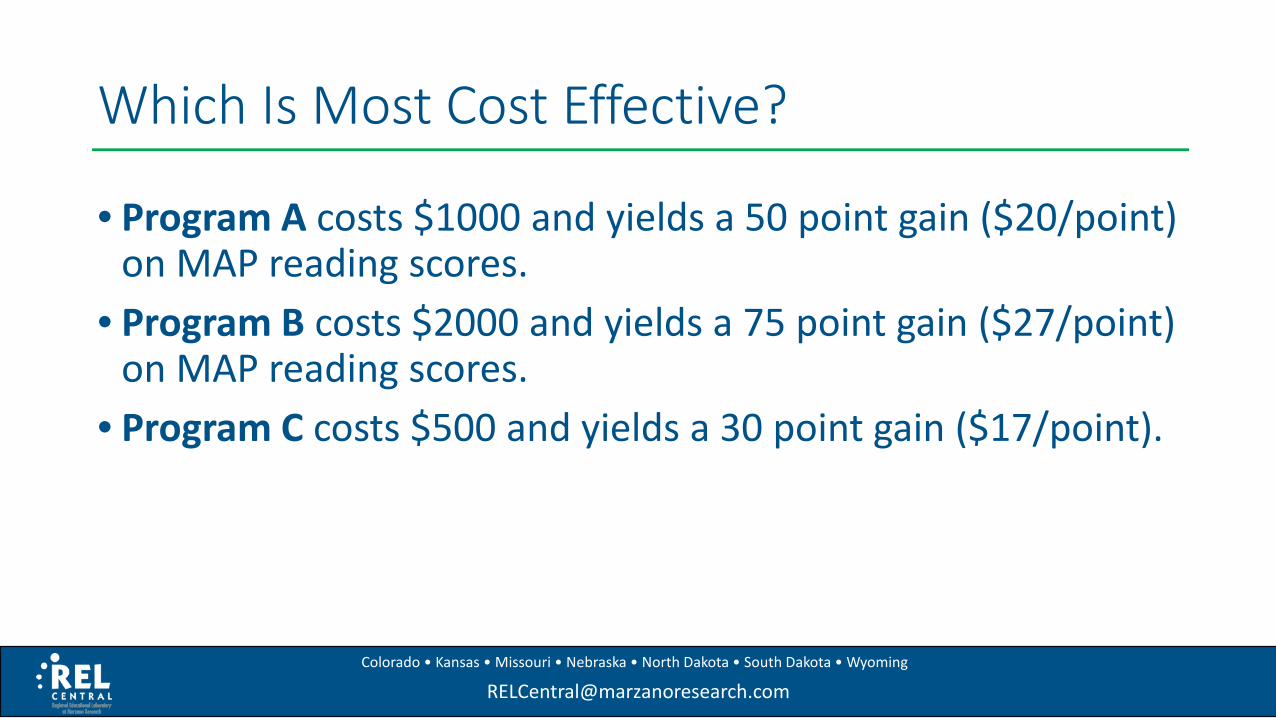
• Program A costs $1000 and yields a 50 point gain ($20/point) on MAP reading scores.
• Program B costs $2000 and yields a 75 point gain ($27/point) on MAP reading scores.
• Program C costs $500 and yields a 30 point gain ($17/point).
[email protected] • Kansas • Missouri • Nebraska • North Dakota • South Dakota • Wyoming
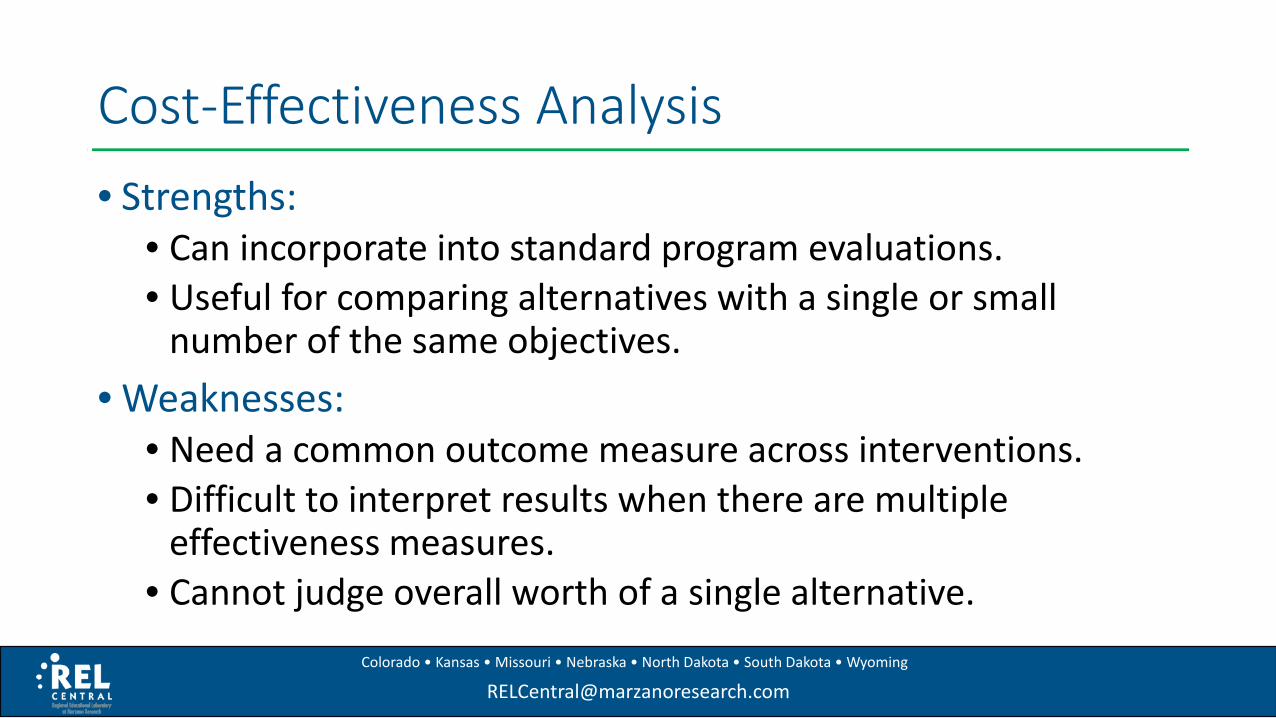
Cost-Effectiveness Analysis• Strengths:
• Can incorporate into standard program evaluations.• Useful for comparing alternatives with a single or small
number of the same objectives.• Weaknesses:
• Need a common outcome measure across interventions.• Difficult to interpret results when there are multiple
effectiveness measures.• Cannot judge overall worth of a single alternative.
[email protected] • Kansas • Missouri • Nebraska • North Dakota • South Dakota • Wyoming
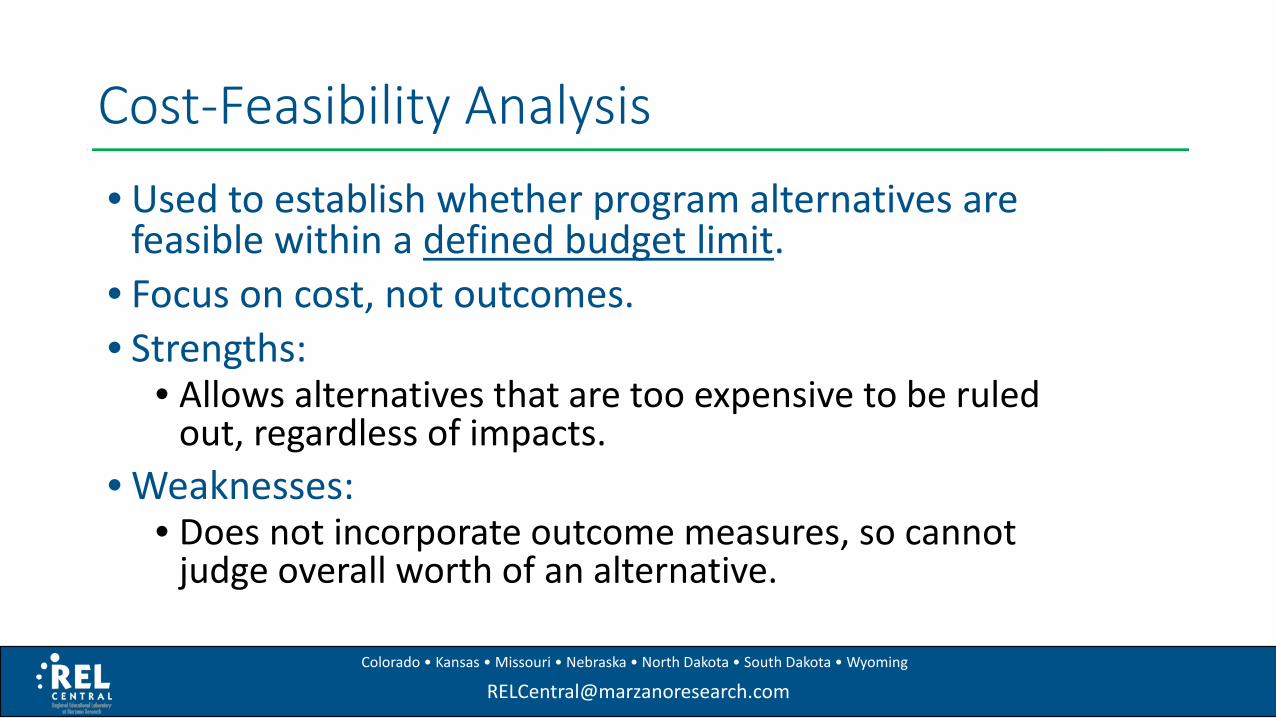
Cost-Feasibility Analysis• Used to establish whether program alternatives are
feasible within a defined budget limit.• Focus on cost, not outcomes.• Strengths:
• Allows alternatives that are too expensive to be ruled out, regardless of impacts.
• Weaknesses:• Does not incorporate outcome measures, so cannot
judge overall worth of an alternative.
[email protected] • Kansas • Missouri • Nebraska • North Dakota • South Dakota • Wyoming
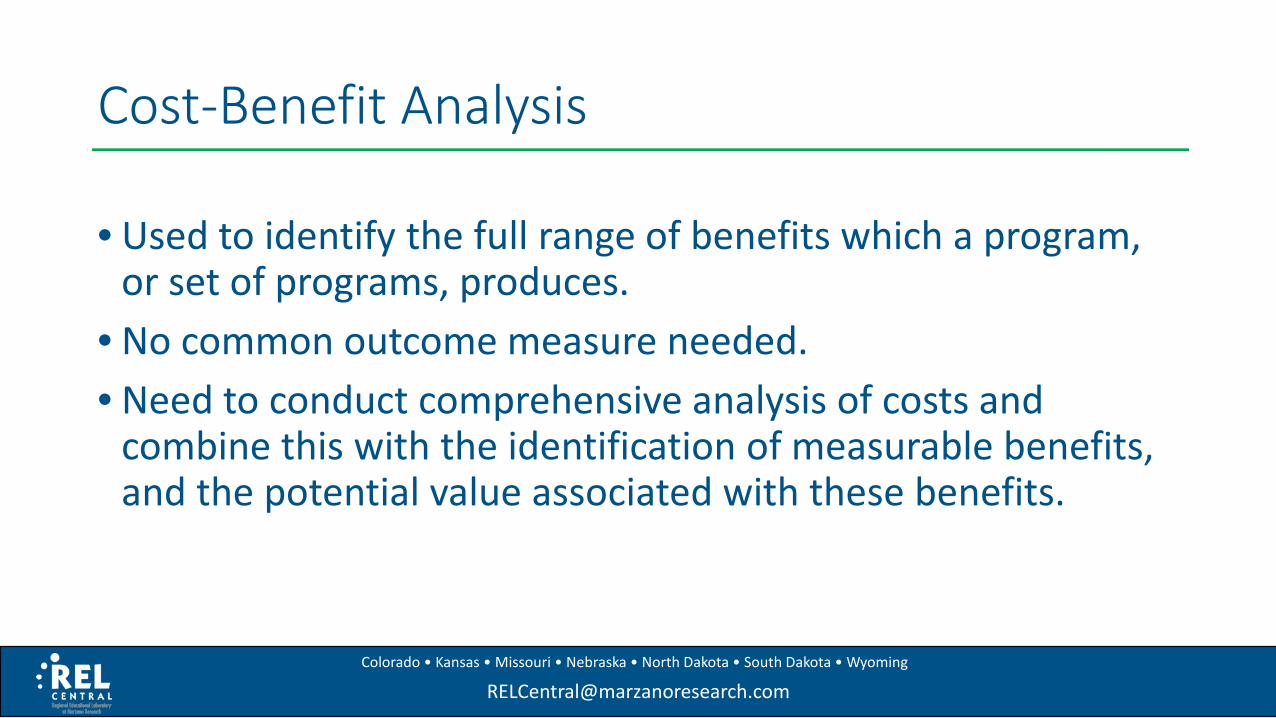
Cost-Benefit Analysis
• Used to identify the full range of benefits which a program, or set of programs, produces.
• No common outcome measure needed.• Need to conduct comprehensive analysis of costs and
combine this with the identification of measurable benefits, and the potential value associated with these benefits.
[email protected] • Kansas • Missouri • Nebraska • North Dakota • South Dakota • Wyoming
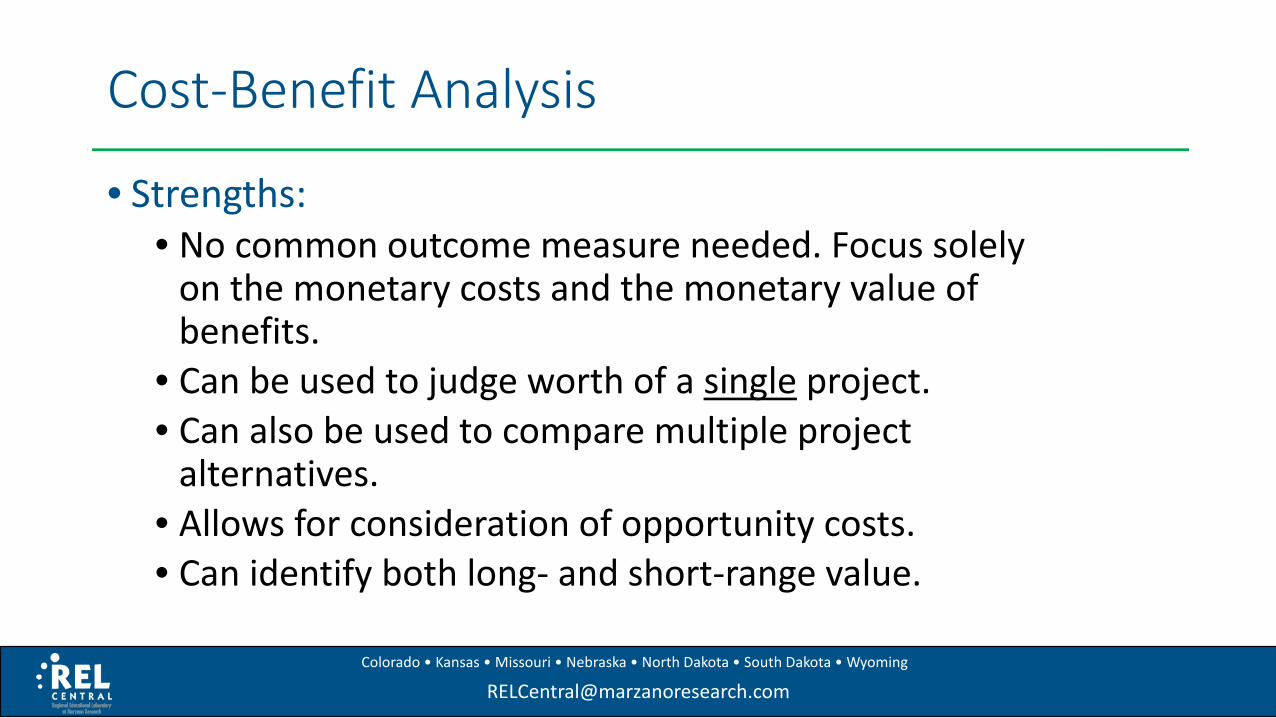
Cost-Benefit Analysis
• Strengths:• No common outcome measure needed. Focus solely
on the monetary costs and the monetary value of benefits.
• Can be used to judge worth of a single project.• Can also be used to compare multiple project
alternatives.• Allows for consideration of opportunity costs.• Can identify both long- and short-range value.
[email protected] • Kansas • Missouri • Nebraska • North Dakota • South Dakota • Wyoming
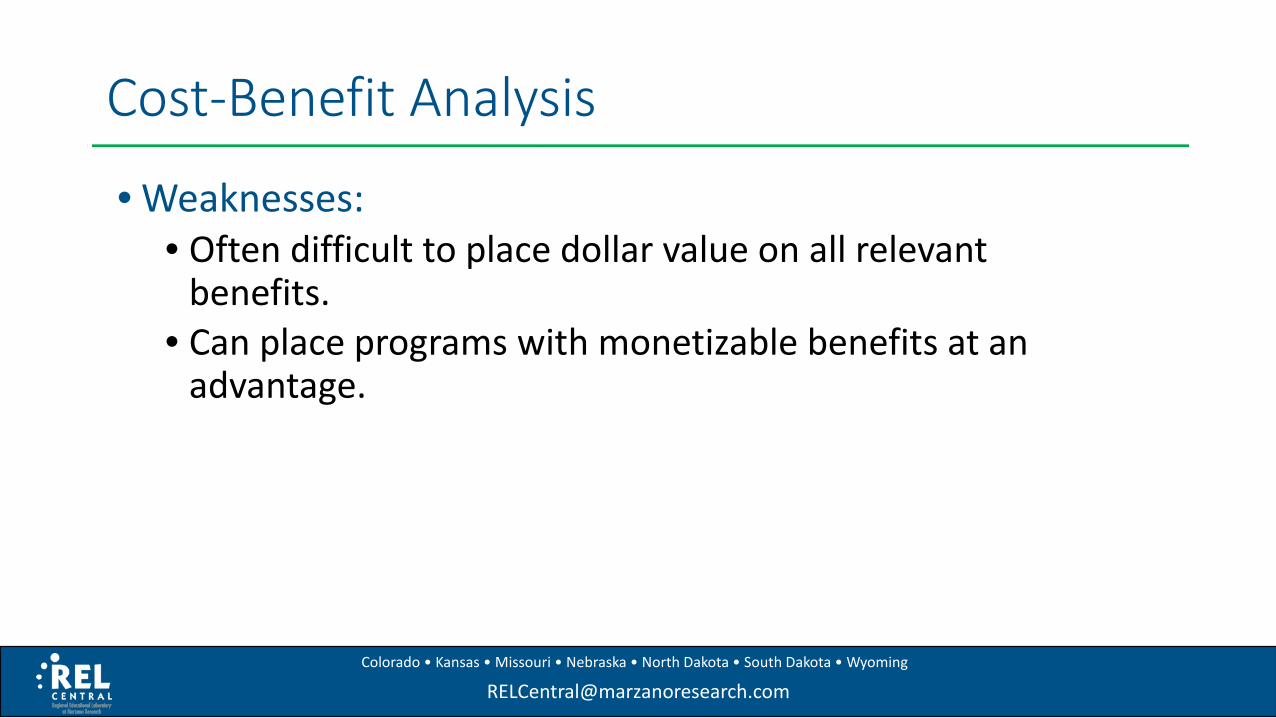
Cost-Benefit Analysis
• Weaknesses:• Often difficult to place dollar value on all relevant
benefits.• Can place programs with monetizable benefits at an
advantage.
[email protected] • Kansas • Missouri • Nebraska • North Dakota • South Dakota • Wyoming
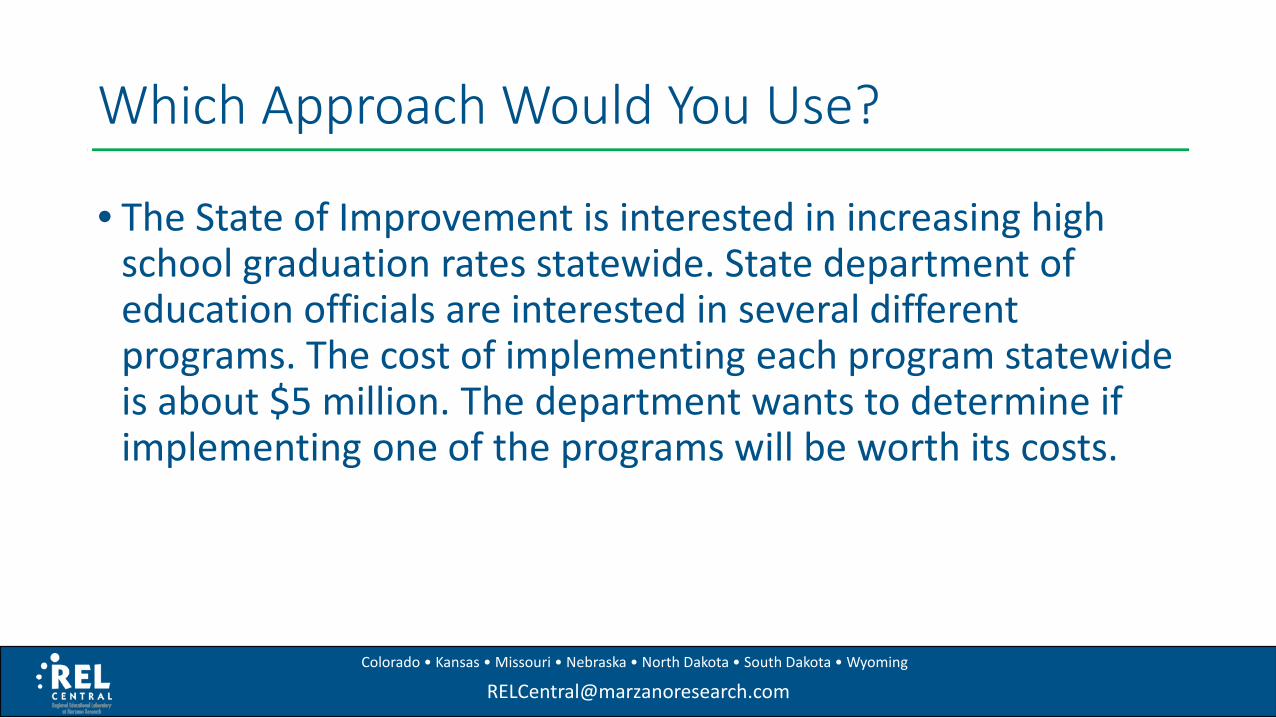
Which Approach Would You Use?
• The State of Improvement is interested in increasing high school graduation rates statewide. State department of education officials are interested in several different programs. The cost of implementing each program statewide is about $5 million. The department wants to determine if implementing one of the programs will be worth its costs.
[email protected] • Kansas • Missouri • Nebraska • North Dakota • South Dakota • Wyoming
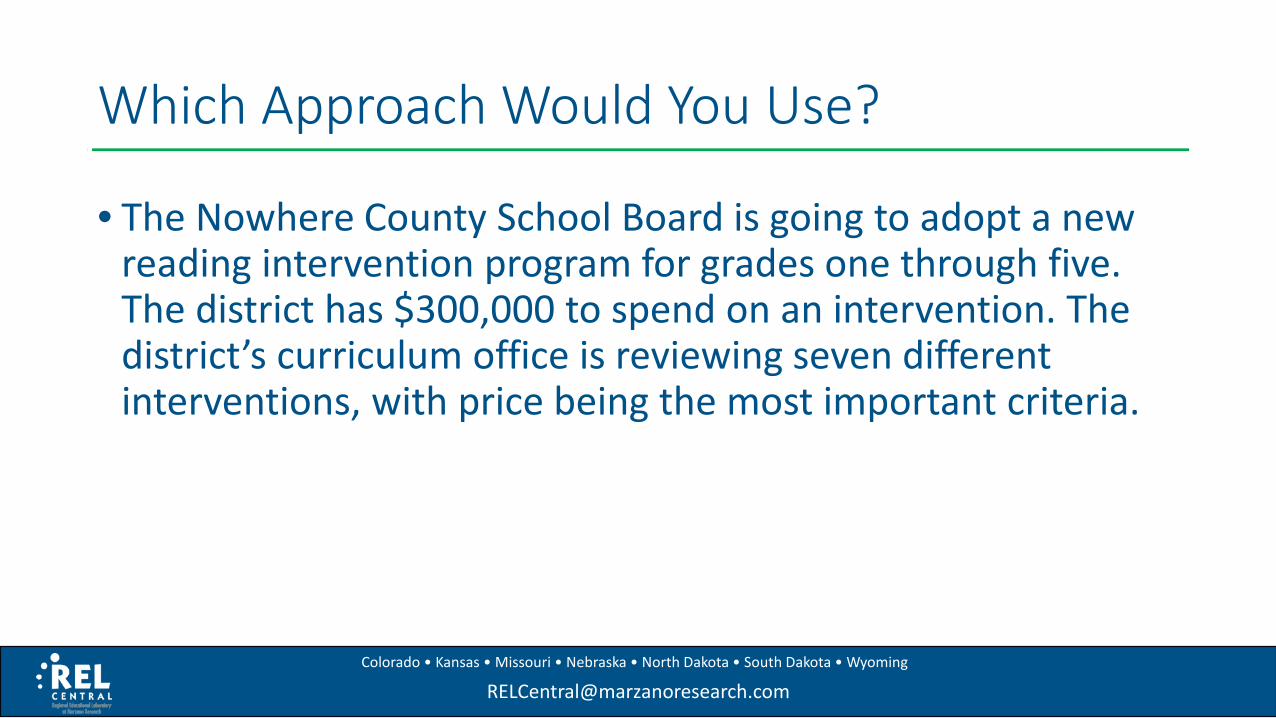
Which Approach Would You Use?
• The Nowhere County School Board is going to adopt a new reading intervention program for grades one through five. The district has $300,000 to spend on an intervention. The district’s curriculum office is reviewing seven different interventions, with price being the most important criteria.
[email protected] • Kansas • Missouri • Nebraska • North Dakota • South Dakota • Wyoming
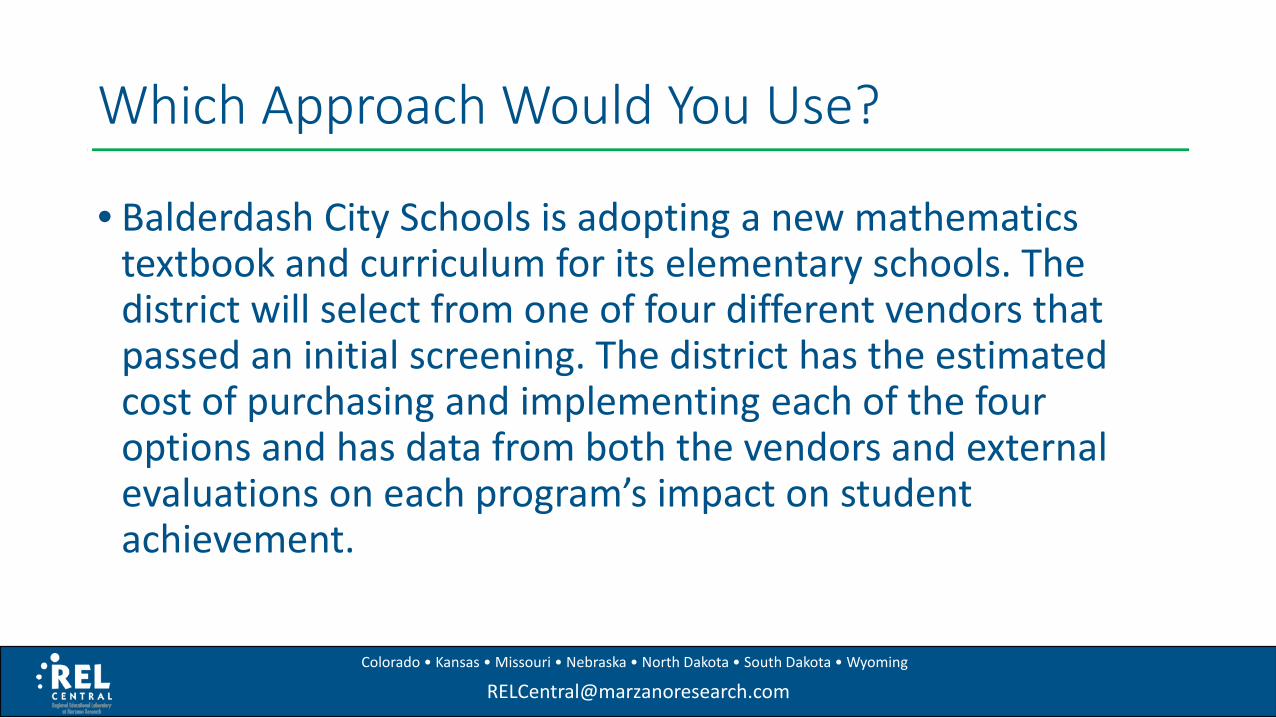
Which Approach Would You Use?
• Balderdash City Schools is adopting a new mathematics textbook and curriculum for its elementary schools. The district will select from one of four different vendors that passed an initial screening. The district has the estimated cost of purchasing and implementing each of the four options and has data from both the vendors and external evaluations on each program’s impact on student achievement.
[email protected] • Kansas • Missouri • Nebraska • North Dakota • South Dakota • Wyoming
Which Approach Would You Use?
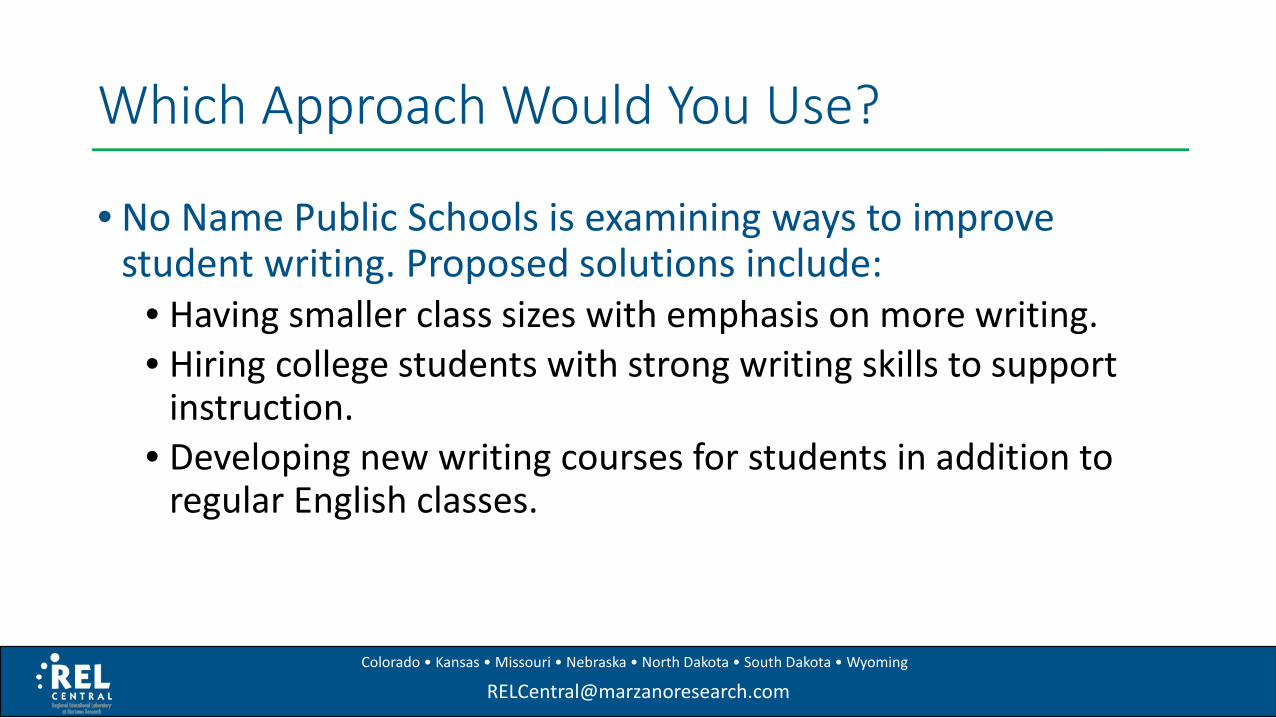
• No Name Public Schools is examining ways to improve student writing. Proposed solutions include:
• Having smaller class sizes with emphasis on more writing.• Hiring college students with strong writing skills to support
instruction.• Developing new writing courses for students in addition to
regular English classes.
[email protected] • Kansas • Missouri • Nebraska • North Dakota • South Dakota • Wyoming
Assessing Cost: Ingredients Approach
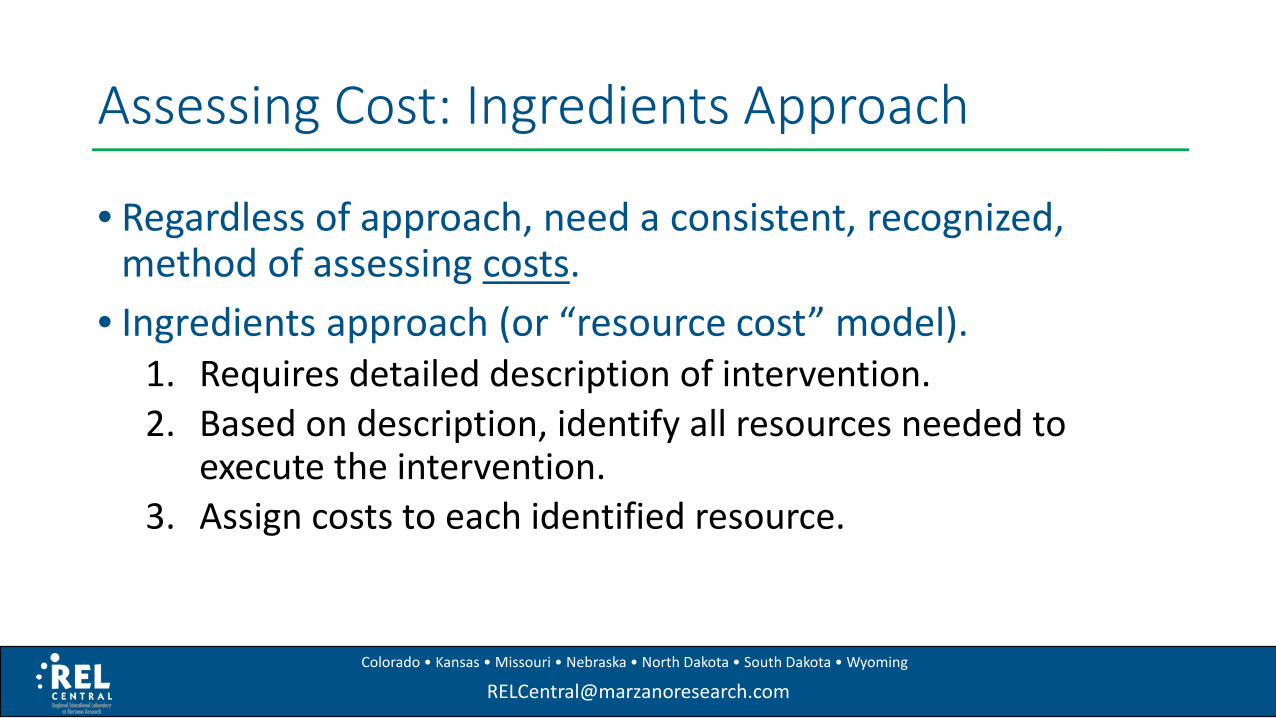
• Regardless of approach, need a consistent, recognized, method of assessing costs.
• Ingredients approach (or “resource cost” model).1. Requires detailed description of intervention.2. Based on description, identify all resources needed to
execute the intervention.3. Assign costs to each identified resource.
[email protected] • Kansas • Missouri • Nebraska • North Dakota • South Dakota • Wyoming
Assessing Cost: Ingredients Approach
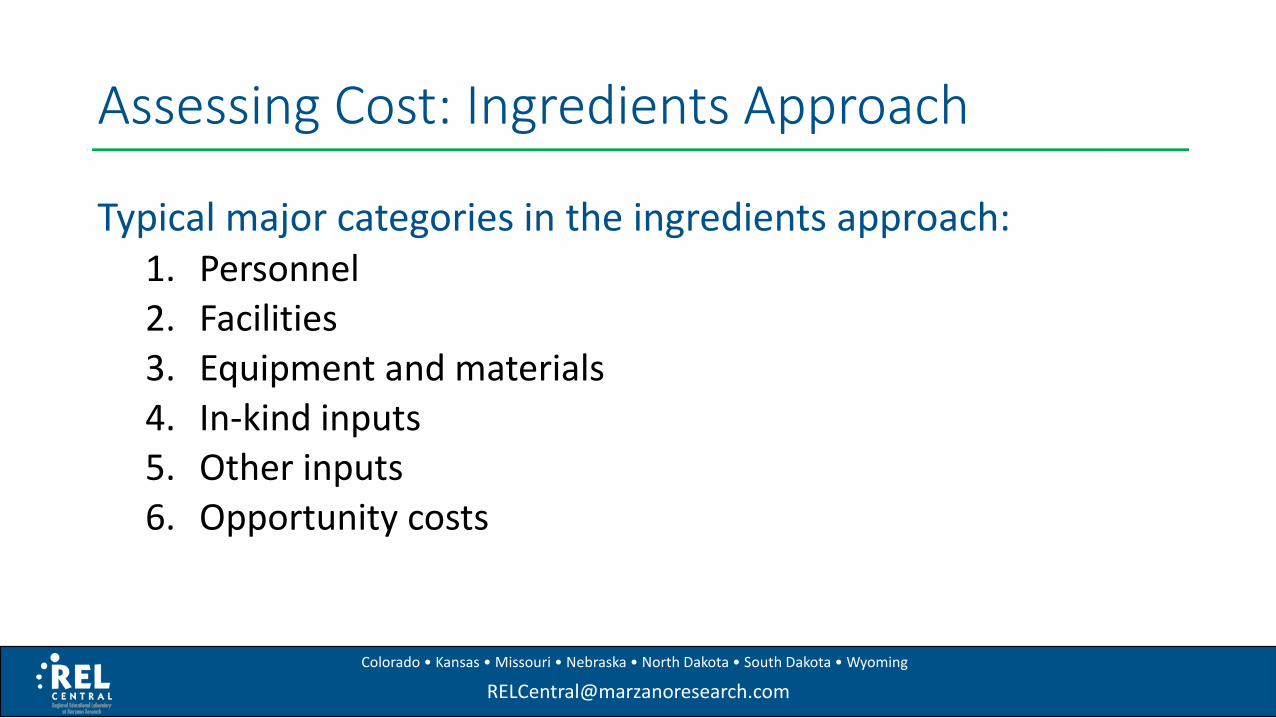
Typical major categories in the ingredients approach:1. Personnel2. Facilities3. Equipment and materials4. In-kind inputs5. Other inputs6. Opportunity costs
[email protected] • Kansas • Missouri • Nebraska • North Dakota • South Dakota • Wyoming
Identifying and Valuing Benefits
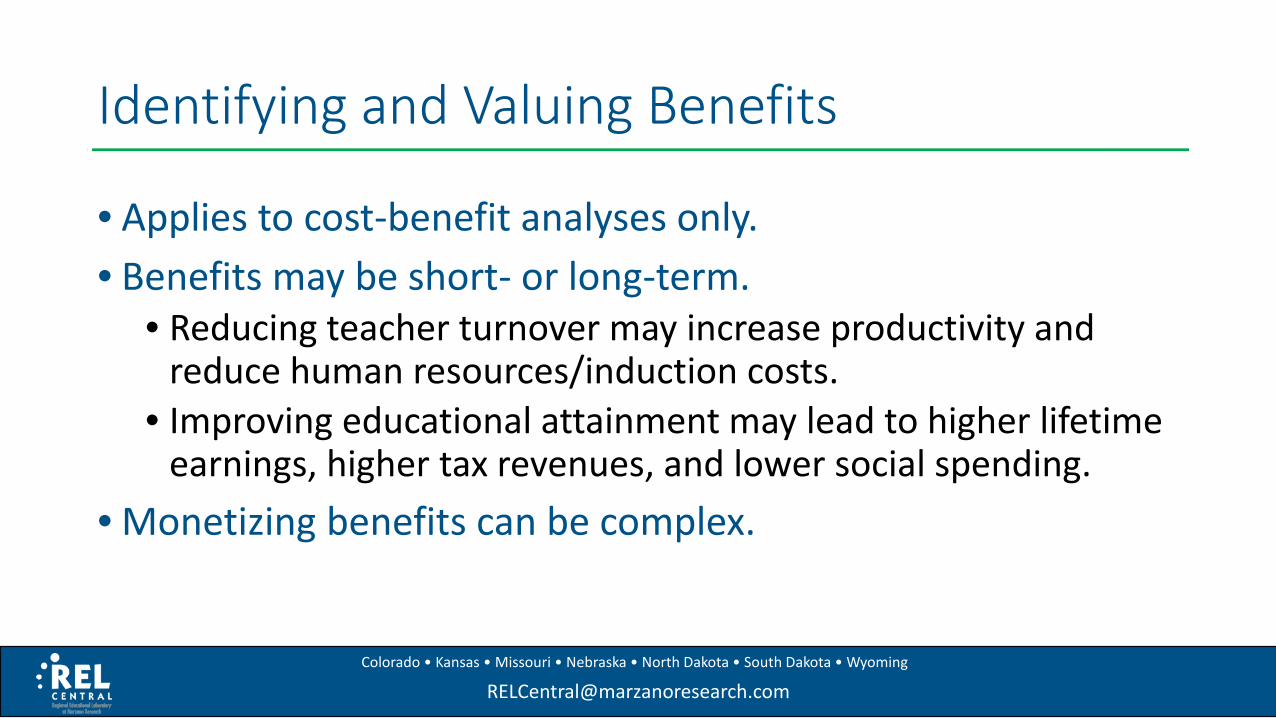
• Applies to cost-benefit analyses only.• Benefits may be short- or long-term.
• Reducing teacher turnover may increase productivity and reduce human resources/induction costs.
• Improving educational attainment may lead to higher lifetime earnings, higher tax revenues, and lower social spending.
• Monetizing benefits can be complex.
[email protected] • Kansas • Missouri • Nebraska • North Dakota • South Dakota • Wyoming
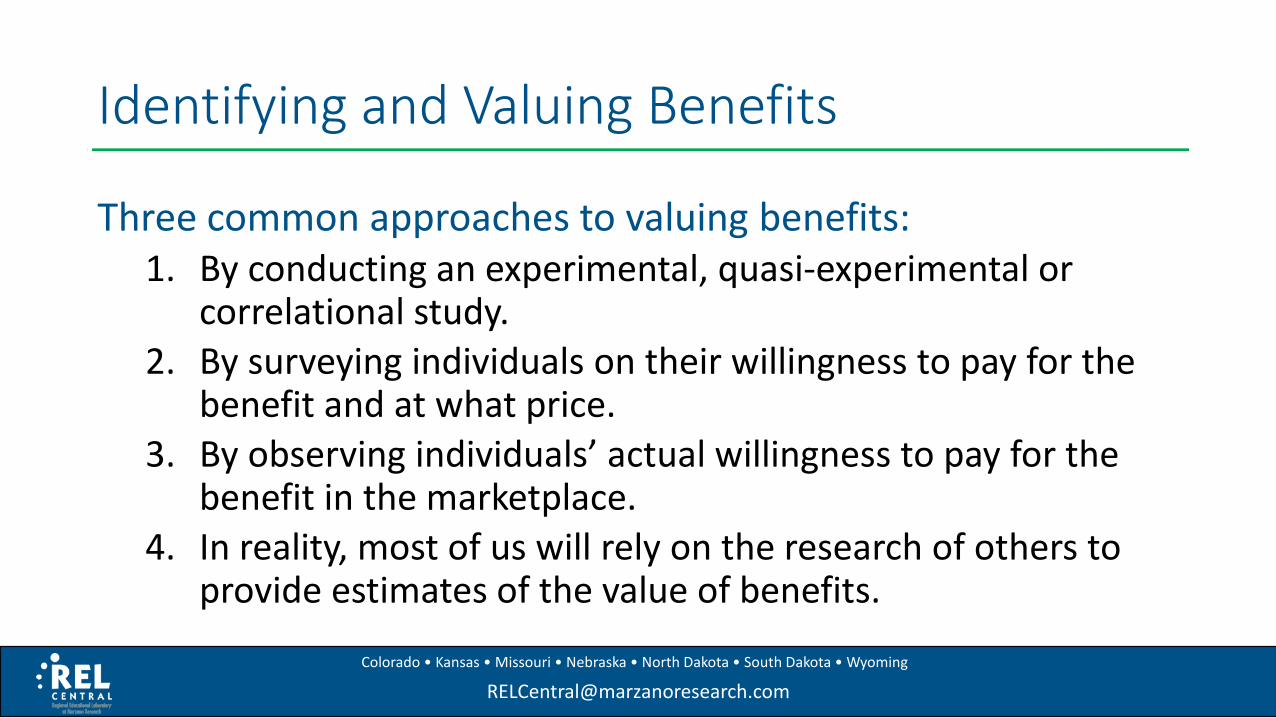
Identifying and Valuing Benefits
Three common approaches to valuing benefits:1. By conducting an experimental, quasi-experimental or
correlational study. 2. By surveying individuals on their willingness to pay for the
benefit and at what price.3. By observing individuals’ actual willingness to pay for the
benefit in the marketplace.4. In reality, most of us will rely on the research of others to
provide estimates of the value of benefits.
[email protected] • Kansas • Missouri • Nebraska • North Dakota • South Dakota • Wyoming
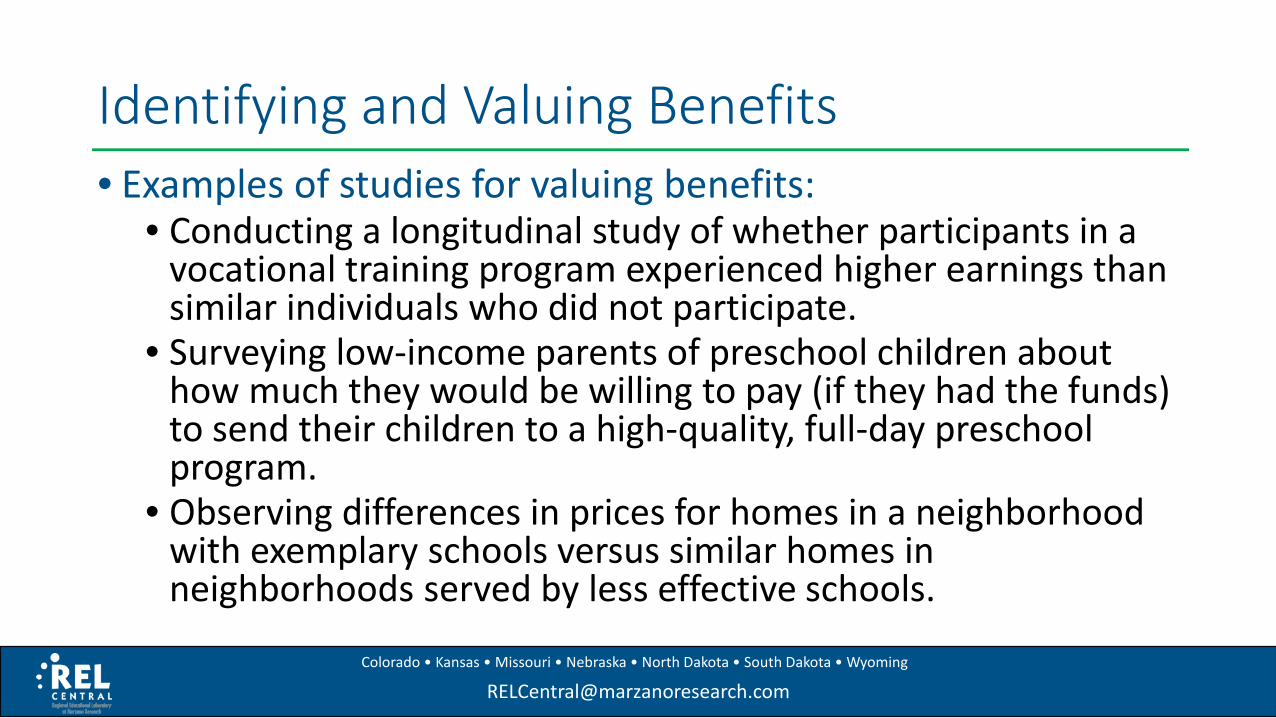
Identifying and Valuing Benefits• Examples of studies for valuing benefits:
• Conducting a longitudinal study of whether participants in a vocational training program experienced higher earnings than similar individuals who did not participate.
• Surveying low-income parents of preschool children about how much they would be willing to pay (if they had the funds) to send their children to a high-quality, full-day preschool program.
• Observing differences in prices for homes in a neighborhood with exemplary schools versus similar homes in neighborhoods served by less effective schools.
[email protected] • Kansas • Missouri • Nebraska • North Dakota • South Dakota • Wyoming
What We’ve Covered So Far
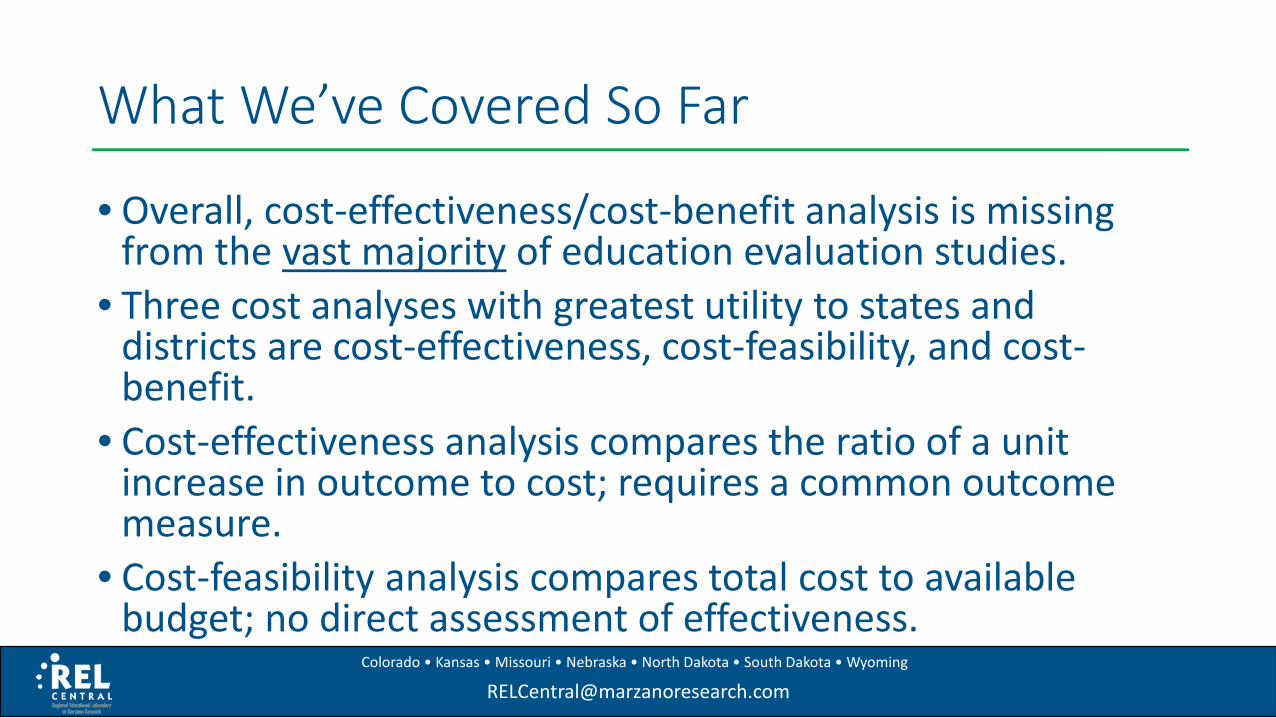
• Overall, cost-effectiveness/cost-benefit analysis is missing from the vast majority of education evaluation studies.
• Three cost analyses with greatest utility to states and districts are cost-effectiveness, cost-feasibility, and cost-benefit.
• Cost-effectiveness analysis compares the ratio of a unit increase in outcome to cost; requires a common outcome measure.
• Cost-feasibility analysis compares total cost to available budget; no direct assessment of effectiveness.
[email protected] • Kansas • Missouri • Nebraska • North Dakota • South Dakota • Wyoming
What We’ve Covered So Far
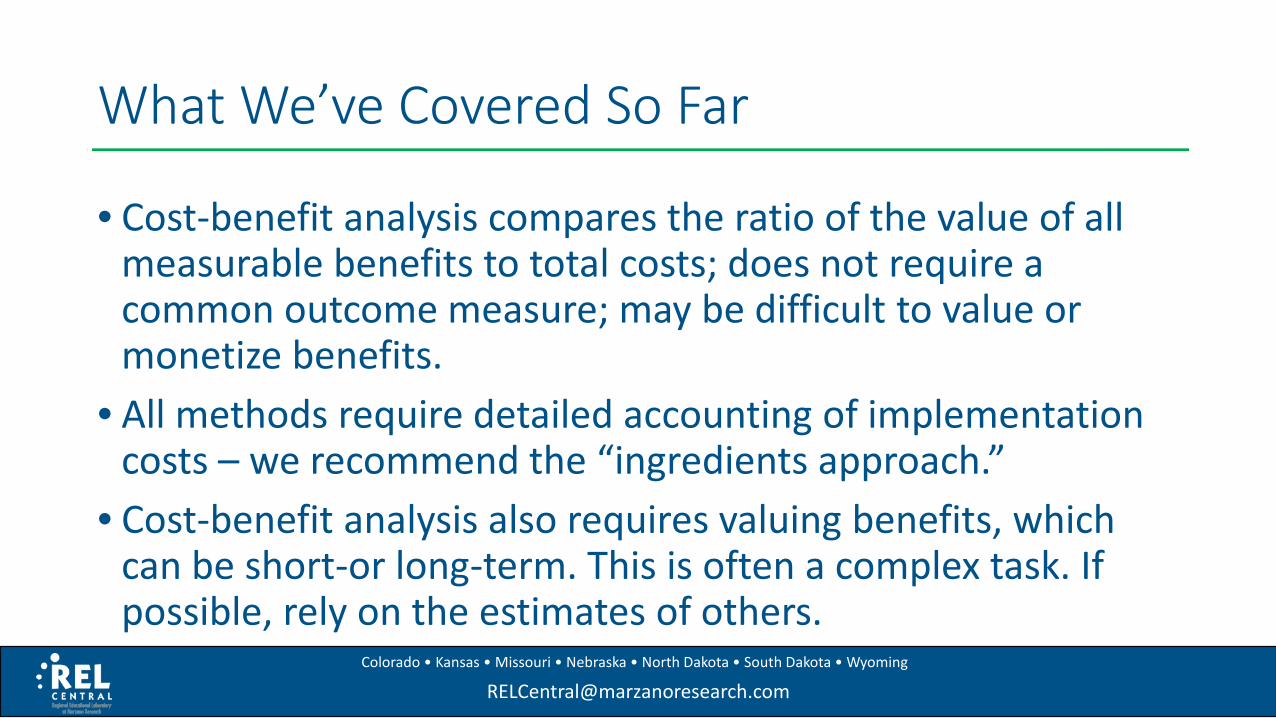
• Cost-benefit analysis compares the ratio of the value of all measurable benefits to total costs; does not require a common outcome measure; may be difficult to value or monetize benefits.
• All methods require detailed accounting of implementation costs – we recommend the “ingredients approach.”
• Cost-benefit analysis also requires valuing benefits, which can be short-or long-term. This is often a complex task. If possible, rely on the estimates of others.
[email protected] • Kansas • Missouri • Nebraska • North Dakota • South Dakota • Wyoming
Cost-Benefit Analysis ExampleStudy published in spring 2017https://nces.ed.gov/pubsearch/pubsinfo.asp?pubid=REL2017225
[email protected] • Kansas • Missouri • Nebraska • North Dakota • South Dakota • Wyoming
Cost-Benefit Analysis Example
• Impacts of the Retired Mentors for New Teachers Program• Two-year randomized controlled trial study.• 77 classroom teachers across 11 schools randomly assigned,
half to “business-as-usual” program, half to retired mentors program.
• Compared impacts on (1) new teachers mentored by retired, highly effective educators with long term experience teaching in the district, and (2) new teachers participating in district’s business-as-usual mentoring program.
[email protected] • Kansas • Missouri • Nebraska • North Dakota • South Dakota • Wyoming
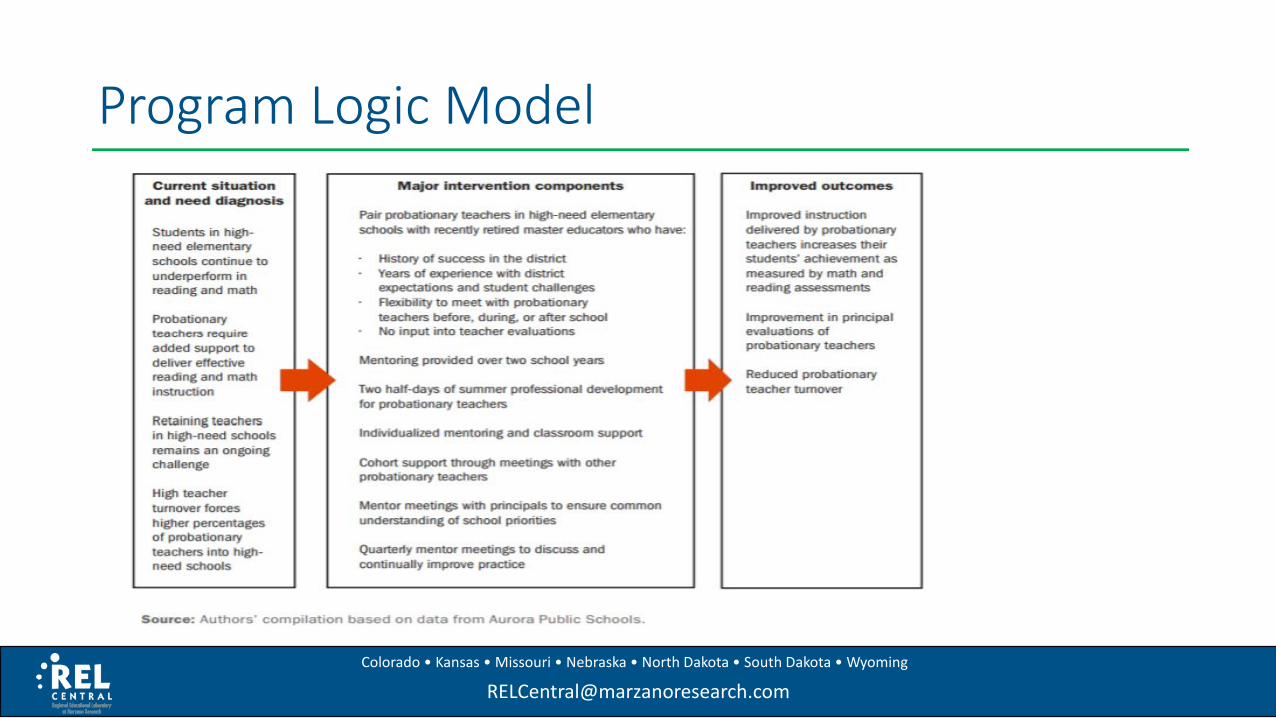
Program Logic Model
[email protected] • Kansas • Missouri • Nebraska • North Dakota • South Dakota • Wyoming
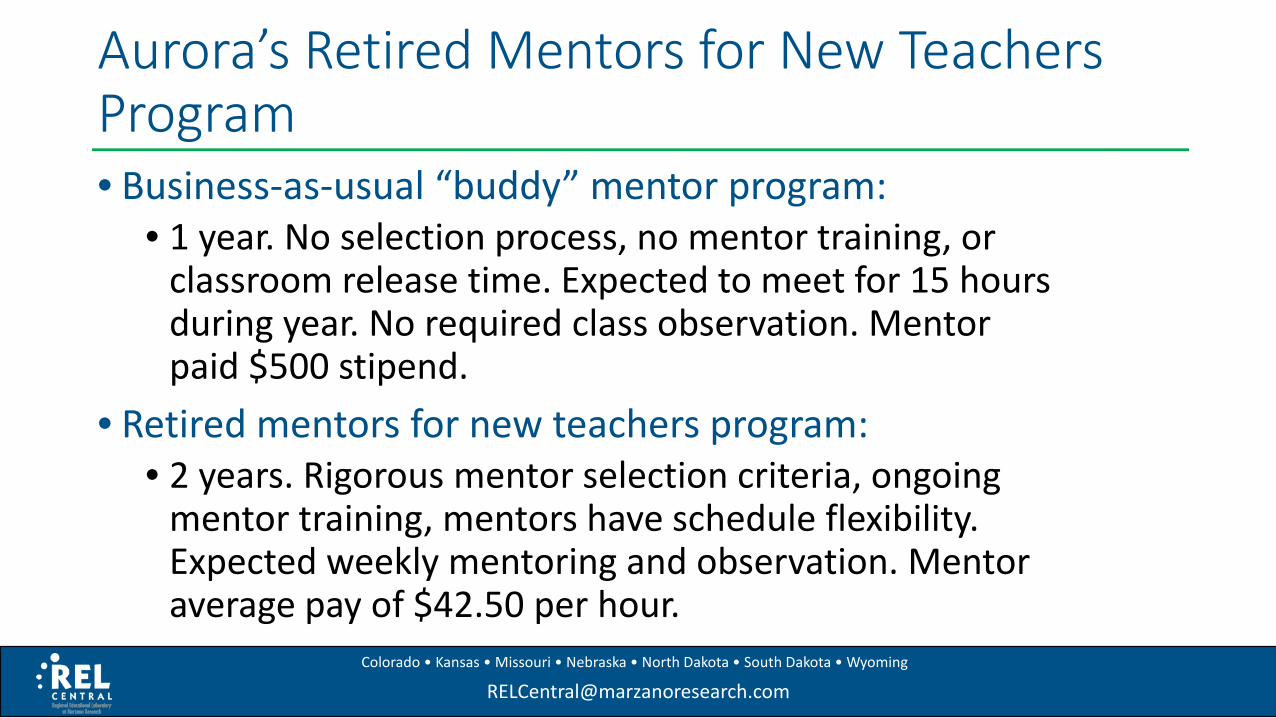
Aurora’s Retired Mentors for New Teachers Program• Business-as-usual “buddy” mentor program:
• 1 year. No selection process, no mentor training, or classroom release time. Expected to meet for 15 hours during year. No required class observation. Mentor paid $500 stipend.
• Retired mentors for new teachers program:• 2 years. Rigorous mentor selection criteria, ongoing
mentor training, mentors have schedule flexibility. Expected weekly mentoring and observation. Mentor average pay of $42.50 per hour.
[email protected] • Kansas • Missouri • Nebraska • North Dakota • South Dakota • Wyoming
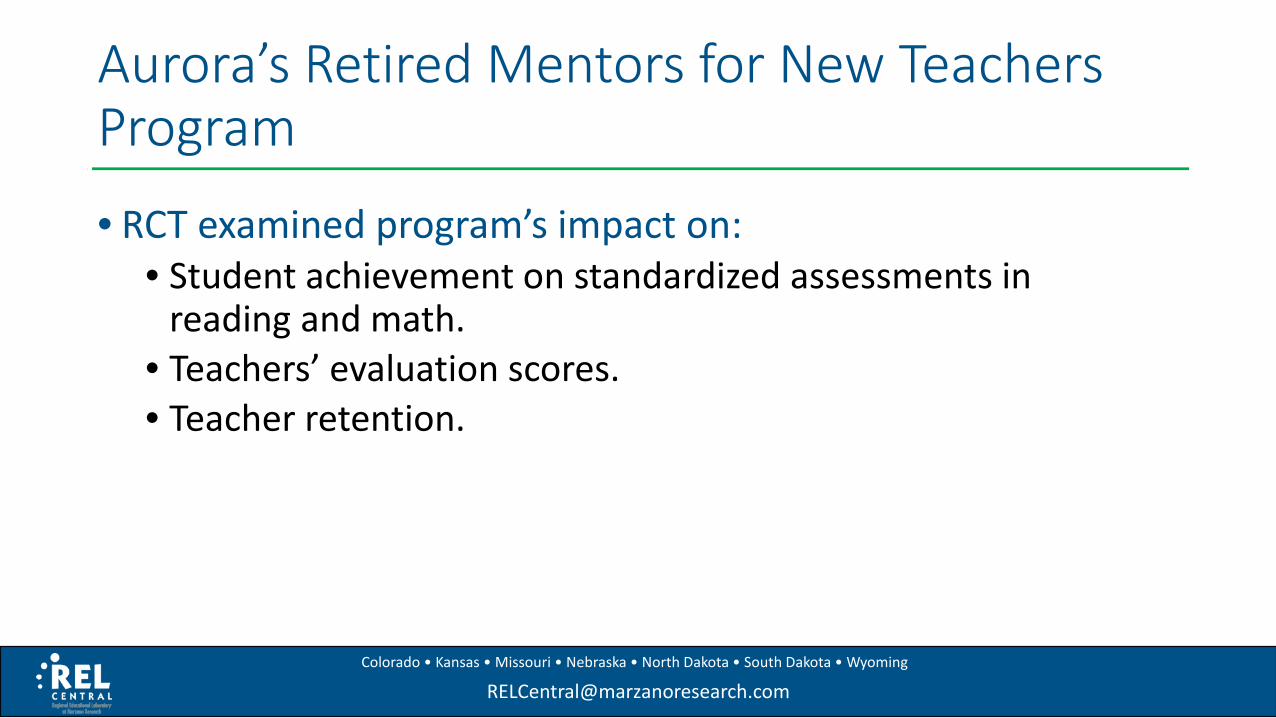
Aurora’s Retired Mentors for New Teachers Program
• RCT examined program’s impact on:• Student achievement on standardized assessments in
reading and math.• Teachers’ evaluation scores.• Teacher retention.
[email protected] • Kansas • Missouri • Nebraska • North Dakota • South Dakota • Wyoming
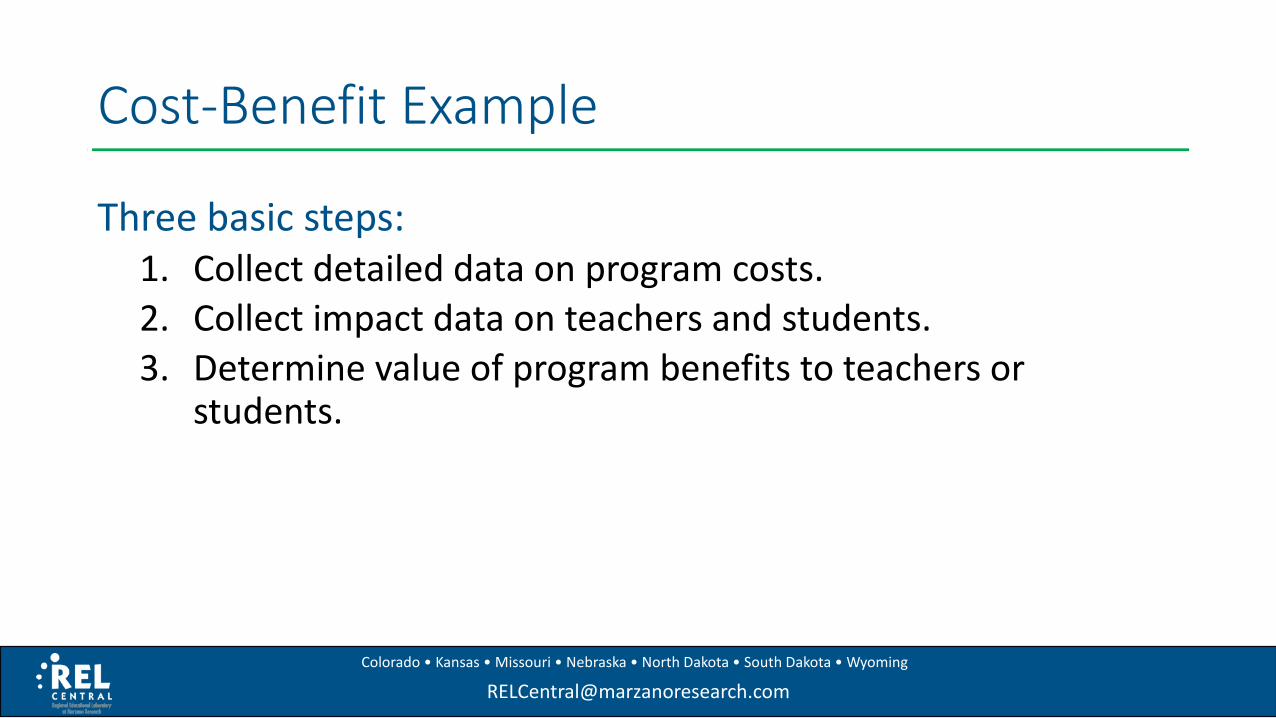
Cost-Benefit Example
Three basic steps:1. Collect detailed data on program costs.2. Collect impact data on teachers and students.3. Determine value of program benefits to teachers or
students.
[email protected] • Kansas • Missouri • Nebraska • North Dakota • South Dakota • Wyoming
Cost-Benefit Example
• What costs do you think would be associated with this program?
• What benefits and associated dollar savings might be expected?
[email protected] • Kansas • Missouri • Nebraska • North Dakota • South Dakota • Wyoming
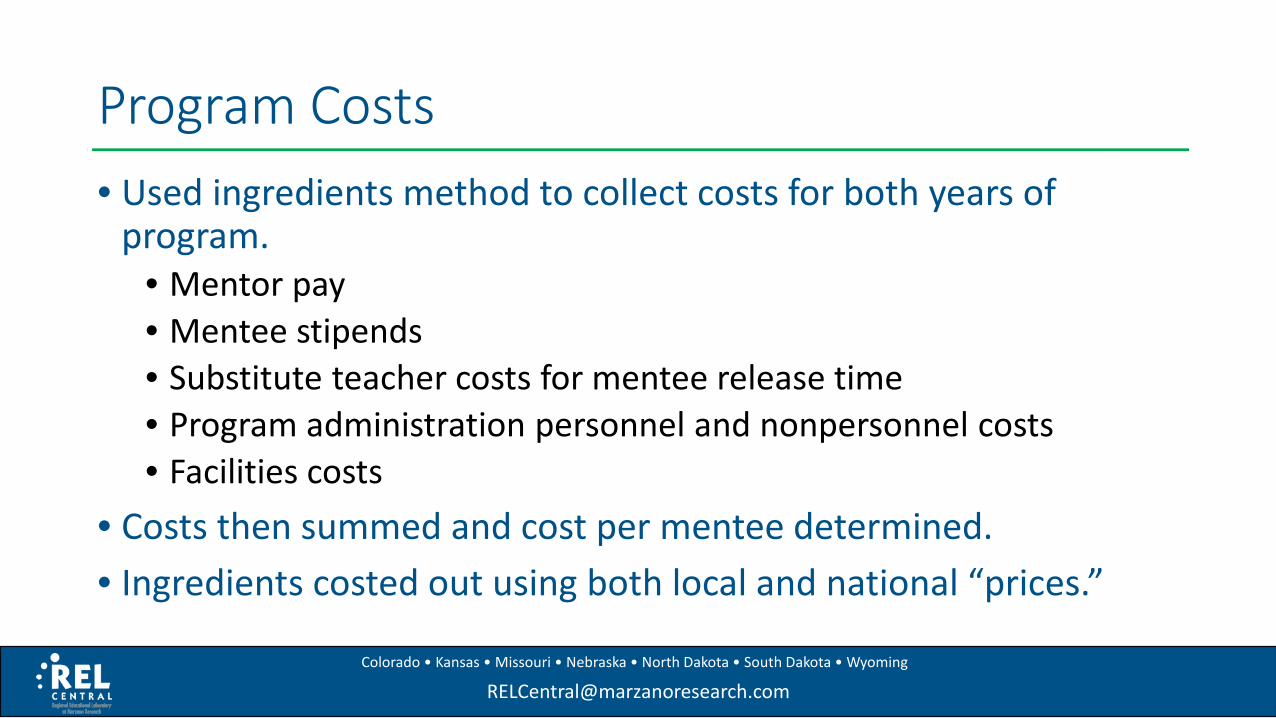
Program Costs• Used ingredients method to collect costs for both years of
program.• Mentor pay• Mentee stipends• Substitute teacher costs for mentee release time• Program administration personnel and nonpersonnel costs • Facilities costs
• Costs then summed and cost per mentee determined.• Ingredients costed out using both local and national “prices.”
[email protected] • Kansas • Missouri • Nebraska • North Dakota • South Dakota • Wyoming
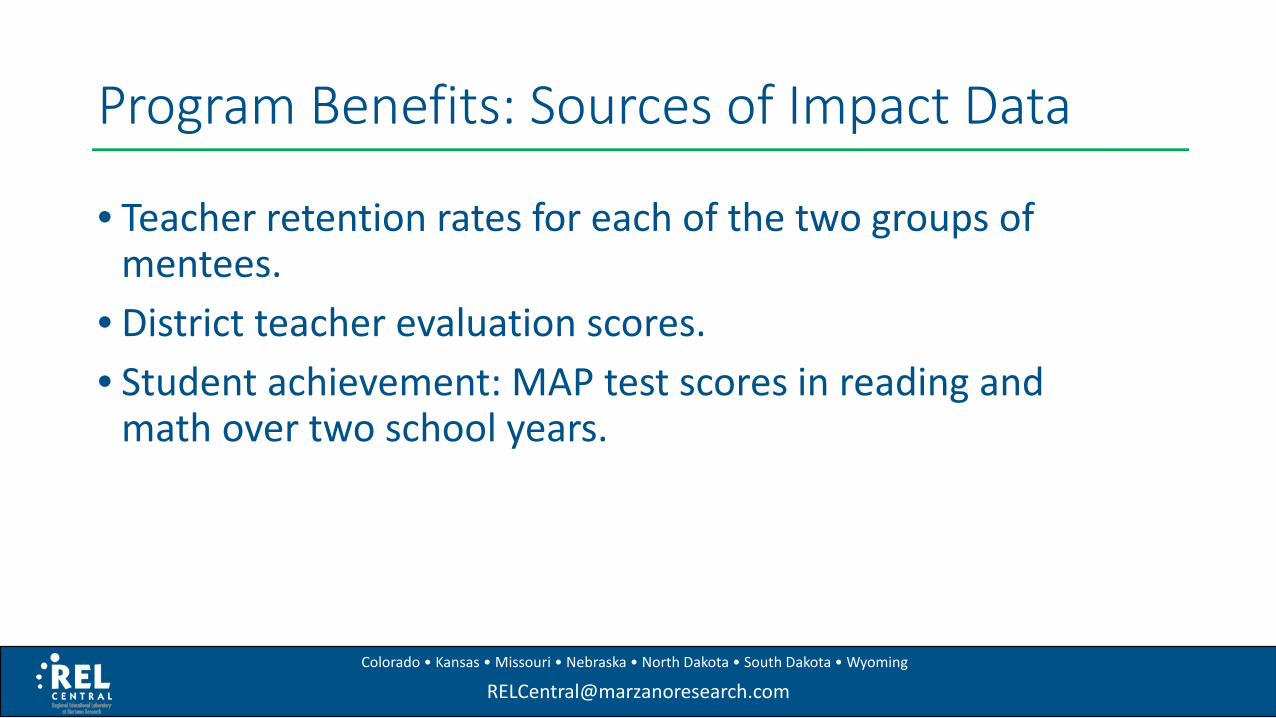
Program Benefits: Sources of Impact Data
• Teacher retention rates for each of the two groups of mentees.
• District teacher evaluation scores.• Student achievement: MAP test scores in reading and
math over two school years.
[email protected] • Kansas • Missouri • Nebraska • North Dakota • South Dakota • Wyoming
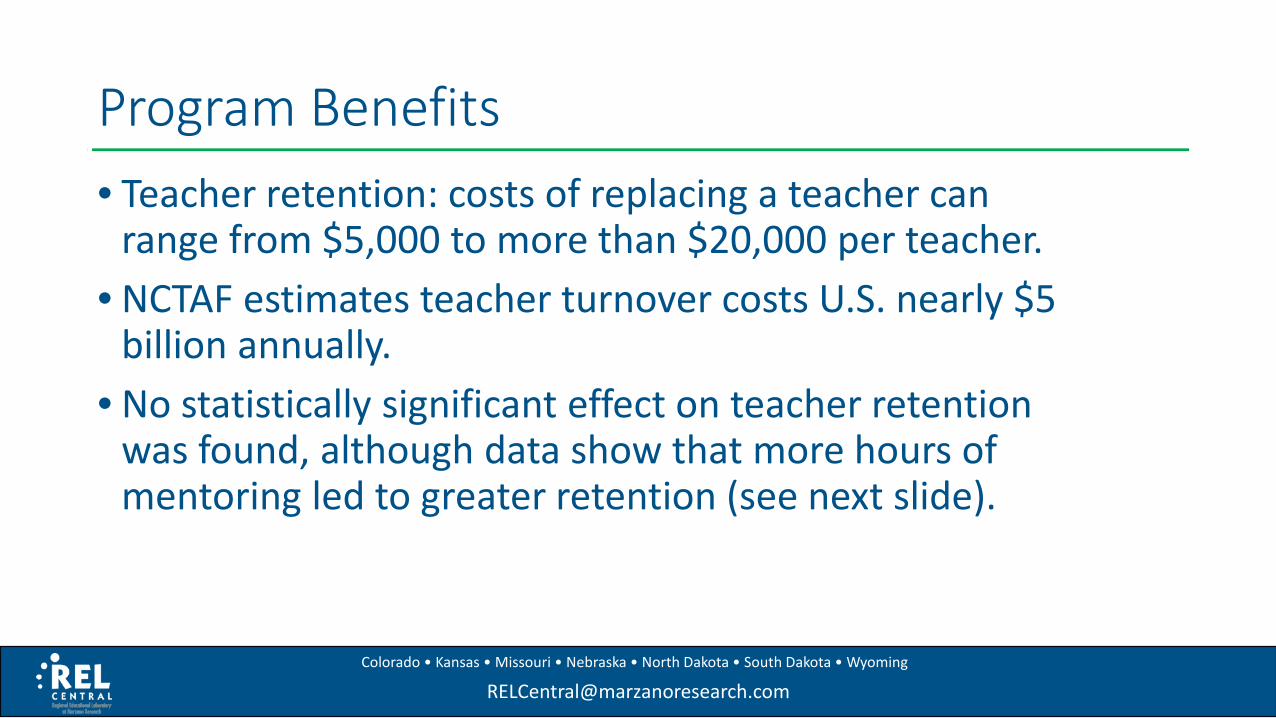
Program Benefits• Teacher retention: costs of replacing a teacher can
range from $5,000 to more than $20,000 per teacher.• NCTAF estimates teacher turnover costs U.S. nearly $5
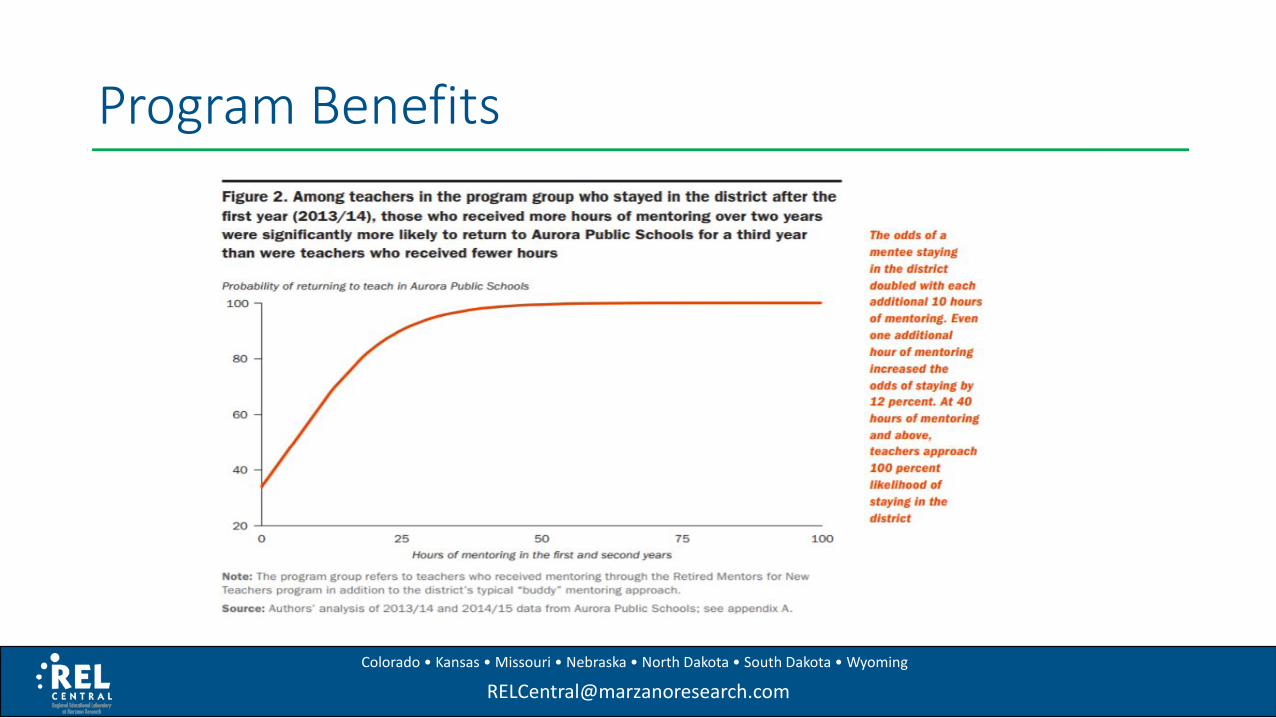
billion annually. • No statistically significant effect on teacher retention
was found, although data show that more hours of mentoring led to greater retention (see next slide).
[email protected] • Kansas • Missouri • Nebraska • North Dakota • South Dakota • Wyoming
Program Benefits
[email protected] • Kansas • Missouri • Nebraska • North Dakota • South Dakota • Wyoming
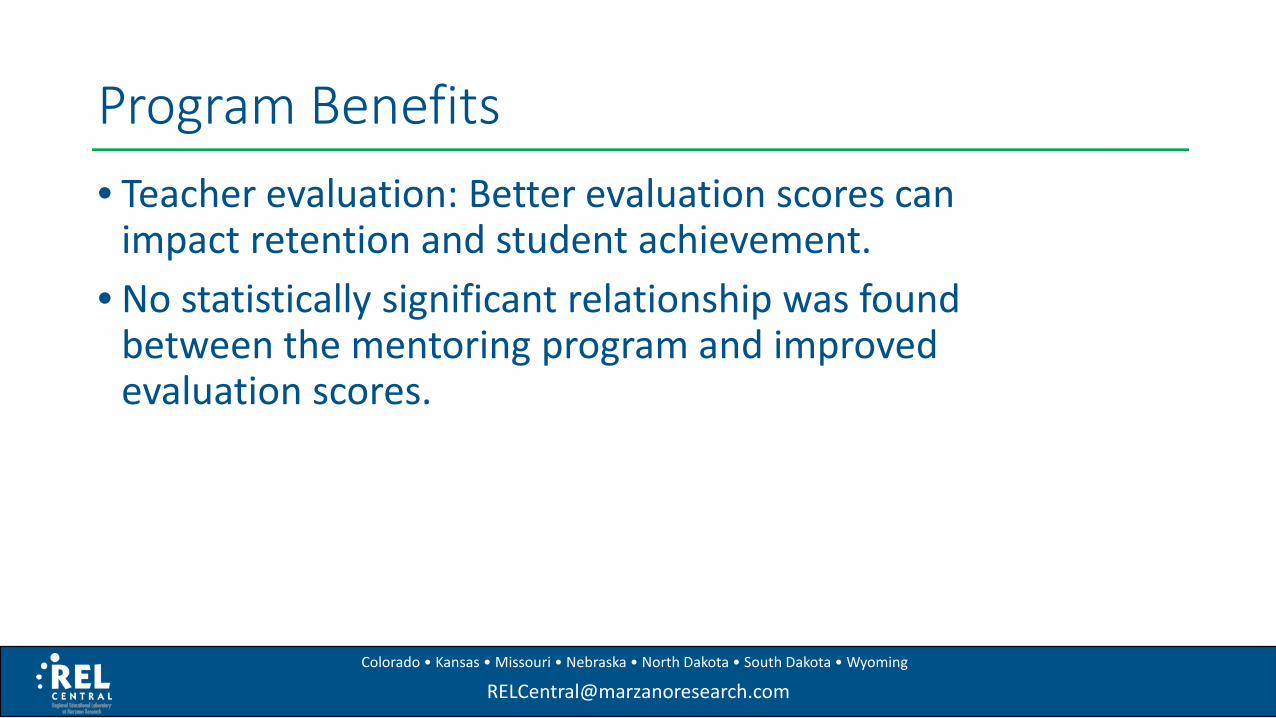
Program Benefits• Teacher evaluation: Better evaluation scores can
impact retention and student achievement.• No statistically significant relationship was found
between the mentoring program and improved evaluation scores.
[email protected] • Kansas • Missouri • Nebraska • North Dakota • South Dakota • Wyoming
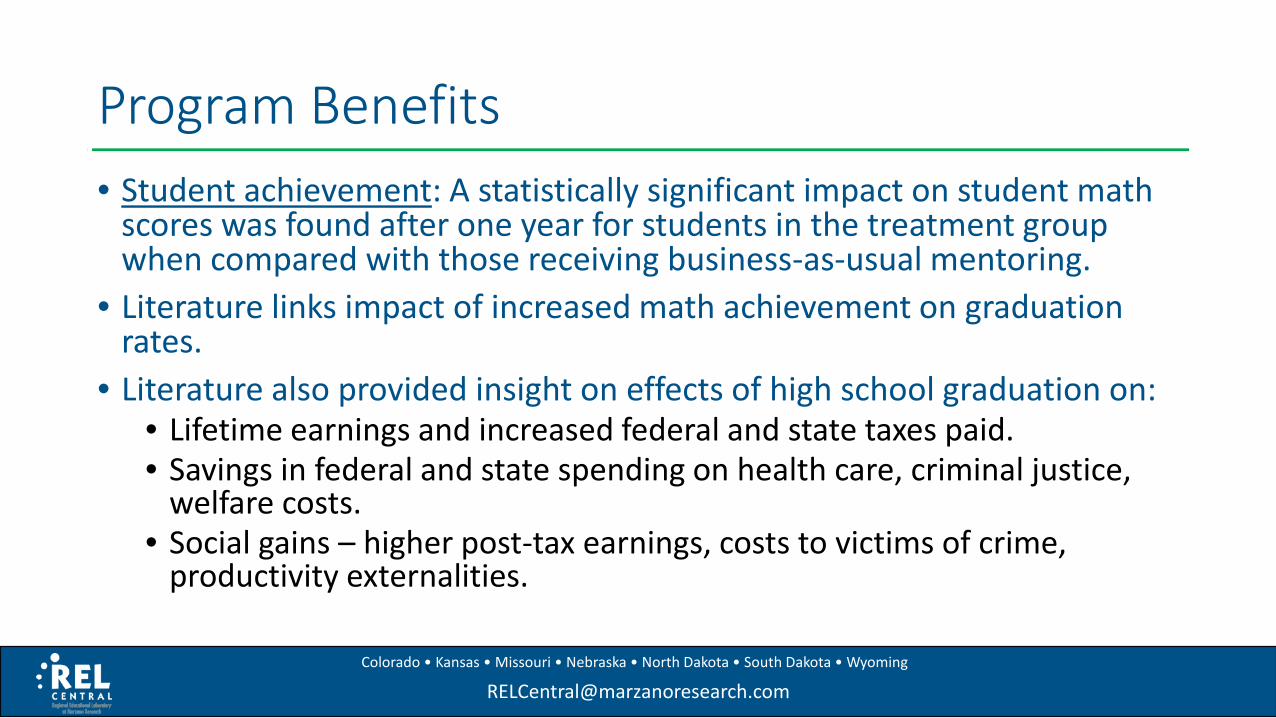
Program Benefits• Student achievement: A statistically significant impact on student math
scores was found after one year for students in the treatment group when compared with those receiving business-as-usual mentoring.
• Literature links impact of increased math achievement on graduation rates.
• Literature also provided insight on effects of high school graduation on:• Lifetime earnings and increased federal and state taxes paid.• Savings in federal and state spending on health care, criminal justice,
welfare costs.• Social gains – higher post-tax earnings, costs to victims of crime,
productivity externalities.
[email protected] • Kansas • Missouri • Nebraska • North Dakota • South Dakota • Wyoming
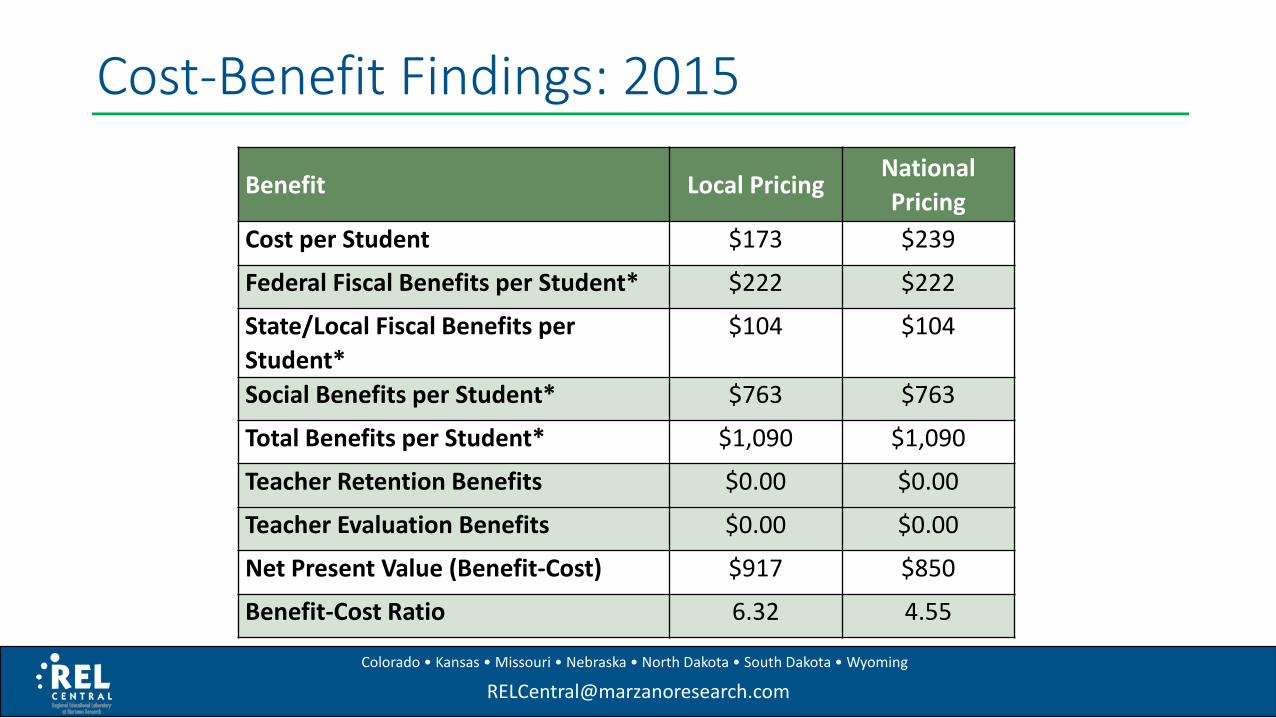
Cost-Benefit Findings: 2015
Benefit Local PricingNational Pricing
Cost per Student $173 $239
Federal Fiscal Benefits per Student* $222 $222
State/Local Fiscal Benefits per Student*
$104 $104
Social Benefits per Student* $763 $763
Total Benefits per Student* $1,090 $1,090
Teacher Retention Benefits $0.00 $0.00
Teacher Evaluation Benefits $0.00 $0.00
Net Present Value (Benefit-Cost) $917 $850
Benefit-Cost Ratio 6.32 4.55
[email protected] • Kansas • Missouri • Nebraska • North Dakota • South Dakota • Wyoming
Return on Investment• Longitudinal research indicates that students taught
math by teachers in the treatment group in the first year could earn nearly $2 million more combined over their lifetimes than students taught by teachers in the business-as-usual group.
• The estimated increase in lifetime earnings alone could pay back the annual cost of the program more than 15 times over.
[email protected] • Kansas • Missouri • Nebraska • North Dakota • South Dakota • Wyoming
Return on Investment• Return could be higher if it were possible to quantify
the value of other documented benefits of improved student performance in math, including:
• Increased probability of attending college by age 20.• Reduced probability of teenage births.
• More research is needed to accurately estimate the dollar value of these benefits.
[email protected] • Kansas • Missouri • Nebraska • North Dakota • South Dakota • Wyoming
Questions?• Dale DeCesare at APA Consulting: [email protected]
• Mark Fermanich at APA: [email protected]
Other resources:• Levin, H. M., & McEwan, P. J. (2001). Cost-Effectiveness Analysis
(2nd ed.) Thousand Oaks, CA: Sage Publications.• Center for Benefit-Cost Studies of Education – Levin’s center at
Teachers College, Columbia University: http://cbcse.org/• Includes cost analysis study reports, CostOut analysis tool.
[email protected] • Kansas • Missouri • Nebraska • North Dakota • South Dakota • Wyoming
Thank YouPlease visit our website and follow us on Twitter for more information about our
events, priorities, research alliances, and access to our many free resources.https://ies.ed.gov/ncee/edlabs/regions/central/index.asp
@RELCentral
Or contact us at
This webinar was prepared under Contract ED-IES-17-C-0005 by Regional Educational Laboratory Central, administered by Marzano Research. The content does not necessarily reflect the views or policies of IES or the U.S. of Education, nor does mention of trade names, commercial products, or organizations imply endorsement by the U.S. Government.