Embed Size (px)
Citation preview

14712/19 SH/bsl
TREE.1.A EN
Council of the European Union
Brussels, 2 December 2019 (OR. en) 14712/19 ENV 976 ENER 532 IND 298 TRANS 567 ENT 266
COVER NOTE
From: Secretary-General of the European Commission, signed by Mr Jordi AYET PUIGARNAU, Director
date of receipt: 28 November 2019
To: Mr Jeppe TRANHOLM-MIKKELSEN, Secretary-General of the Council of the European Union
No. Cion doc.: SWD(2019) 427 final
Subject: COMMISSION STAFF WORKING DOCUMENT FITNESS CHECK of the Ambient Air Quality Directives Directive 2004/107/EC relating to arsenic, cadmium, mercury, nickel and polycyclic aromatic hydrocarbons in ambient air and Directive 2008/50/EC on ambient air quality and cleaner air for Europe
Delegations will find attached document SWD(2019) 427 final.
Encl.: SWD(2019) 427 final

EN EN
EUROPEAN COMMISSION
Brussels, 28.11.2019
SWD(2019) 427 final
COMMISSION STAFF WORKING DOCUMENT
FITNESS CHECK
of the
Ambient Air Quality Directives
Directive 2004/107/EC relating to arsenic, cadmium, mercury, nickel and polycyclic
aromatic hydrocarbons in ambient air
and
Directive 2008/50/EC on ambient air quality and cleaner air for Europe
{SEC(2019) 426 final} - {SWD(2019) 428 final}

1
TABLE OF CONTENTS
TABLE OF CONTENTS ............................................................................................................................... 1
GLOSSARY ................................................................................................................................................... 3
1. INTRODUCTION: PURPOSE AND SCOPE ...................................................................................... 5
2. BACKGROUND TO THE INTERVENTION ..................................................................................... 9
2.1. Description of the intervention and its objectives ................................................ 9
2.2. Air quality policy context prior to 2008 ............................................................. 10
2.3. Points of comparison and baseline ..................................................................... 12
3. IMPLEMENTATION / STATE OF PLAY ........................................................................................ 15
3.1. Air quality monitoring ........................................................................................ 15
3.2. Air quality standards .......................................................................................... 16
3.3. Air quality reporting and information ................................................................ 18
3.4. Air quality plans and Member States’ measures ................................................ 20
3.5. Ongoing infringements point to implementation gaps ....................................... 22
4. METHOD............................................................................................................................................ 23
4.1. Process and methodology ................................................................................... 23
4.2. Limitations and robustness of findings .............................................................. 25
5. ANALYSIS AND ANSWERS TO THE EVALUATION QUESTIONS .......................................... 27
5.1. Relevance ........................................................................................................... 27
5.2. Effectiveness ...................................................................................................... 37
5.3. Effectiveness and efficiency of air quality monitoring ...................................... 44
5.4. Efficiency ........................................................................................................... 53
5.5. Coherence ........................................................................................................... 60
5.6. EU Added Value ................................................................................................ 71
6. CONCLUSIONS ................................................................................................................................. 78
6.1. Clear air quality standards .................................................................................. 79
6.2. Representative high-quality monitoring of air quality ....................................... 80
6.3. Reliable, objective, comparable information on air quality ............................... 81
6.4. Action to avoid, prevent and reduce the impact of poor air quality ................... 82
6.5. Simplification and burden reduction potential ................................................... 83
6.6. Some lessons learned .......................................................................................... 84

2
ANNEX 1: PROCEDURAL INFORMATION AND EVIDENCE USED .................................................. 86
ANNEX 2: STAKEHOLDER CONSULTATION ....................................................................................... 96
ANNEX 3: METHODS AND ANALYTICAL MODELS ........................................................................ 111
ANNEX 4: HISTORICAL OVERVIEW OF AIR QUALITY POLICY ................................................... 117
ANNEX 5: AIR POLLUTANTS, THEIR SOURCES AND ABATEMENT MEASURES ...................... 120
ANNEX 6: INFRINGEMENTS AND LITIGATION UNDER THE AAQ DIRECTIVES ....................... 126
ANNEX 7: COMPARISON OF THE SITUATION IN 2008 WITH 2018 ................................................ 133
ANNEX 8: THE 2018 CLEAN AIR OUTLOOK ...................................................................................... 135
ANNEX 9: AIR QUALITY POLICY AND OTHER EUROPEAN INSTITUTIONS .............................. 138
ANNEX 10: EVOLVING PUBLIC PERCEPTIONS ON AIR QUALITY ............................................... 144
ANNEX 11: SUMMARIES OF THE SEVEN CASE STUDIES............................................................... 147
ANNEX 12: OVERVIEW OF COSTS AND BENEFITS IDENTIFIED .................................................. 156

3
GLOSSARY
Term or acronym Meaning or definition
Policies
AAQ Directives Ambient Air Quality Directives (Directive 2008/50/EC
and Directive 2004/107/EC as amended by Commission
Directive (EU) 2015/1480)
NEC Directive Directive on the reduction of national emissions of
certain atmospheric pollutants (Directive (EU)
2016/2284)
IED Directive Directive 2010/75/EU of the European Parliament and
of the Council of 24 November 2010 on industrial
emissions (integrated pollution prevention and control)
CAP EU common agricultural policy
Air Convention (CLRTAP) UNECE Air Convention (Convention on Long-Range
Transboundary Air Pollution)
MARPOL International Convention for the Prevention of Pollution
from Ships
Pollutants
SO2 Sulphur dioxide
NO2 Nitrogen dioxide
NOx Nitrogen oxides (i.e. sum of NO and NO2)
PM10 Particulate matter, aerodynamic diameter < 10 µm
PM2.5 Fine particulate matter, aerodynamic diameter < 2.5 µm
O3 Ozone
C6H6 Benzene
Pb Lead
CO Carbon monoxide
As Arsenic
Cd Cadmium
Ni Nickel
BaP Benzo(a)pyrene

4
Units
mg/m3 Milligram(s) per cubic metre (= 1 000 µg/m3)
µg/m3 Microgram(s) per cubic metre (= 1 000 ng/m3)
ng/m3 Nanogram(s) per cubic metre
EUR Euro
USD US Dollar
Abbreviations
ECA European Court of Auditors
EEA European Environment Agency
EUROSAI European Organisation of Supreme Audit Institutions
GAINS Greenhouse gas – Air pollution Interactions and
Synergies Model of IIASA
IIASA International Institute for Applied Systems Analysis
JRC European Commission Joint Research Centre
NGO Non-governmental organisation
OECD Organisation for Economic Co-operation and
Development
UNECE United Nations Economic Commission for Europe
WHO World Health Organization

5
1. INTRODUCTION: PURPOSE AND SCOPE
Air pollution has decreased across Europe over the past decades, as emissions of many
pollutants have been curbed successfully thanks to joint efforts by the EU and national,
regional and local authorities. As a result, since 2000, emissions of the main air
pollutants decreased by 10% to 70% depending on the pollutant.1 Yet, in most Member
States, the quality of life of EU citizens remains hampered, as air quality standards,
especially for particulate matter and nitrogen dioxide, are still not being met.
Poor air quality is a cause of chronic and serious diseases such as asthma, respiratory and
cardiovascular problems, or lung cancer. According to the latest data by the World
Health Organization, air pollution levels remain dangerously high in many parts of the
world, with 9 out of 10 people breathing air containing high levels of pollutants.2 Air
pollution continues to be the number one environmental health problem in the EU, with
estimates reliably pointing to more than 400 000 premature deaths per year.3
To address this, the EU has set, by means of legislation adopted by the Council and the
European Parliament, the goal to achieve levels of air quality that do not give rise to
negative impacts on, and risks to, human health and the environment.4 This comprises a
three-pronged EU Clean Air policy framework, which (i) sets air quality standards as
regards concentration levels of pollutants in the ambient air,5 (ii) establishes national
emission reduction commitments for key pollutants,6 and (iii) comprises emissions
standards for key sources of pollution.7 (See Figure 1)
This fitness check focuses on a subset of this framework: it assesses the performance of
the two complementary EU Ambient Air Quality (AAQ) Directives (2008/50/EC and
2004/107/EC, as augmented by Commission Directive (EU) 2015/1480). These
Directives set air quality standards not to be exceeded throughout the EU, and
requirements to ensure that Member States adequately monitor and/or assess air quality
in a harmonised and comparable manner. They are complemented by an Implementing
Decision laying down the rules for reciprocal exchange of information and reporting on
ambient air quality.8
1 COM(2018)330. ‘A Europe that protects: Clean air for all’.
2 WHO: https://www.who.int/news-room/fact-sheets/detail/ambient-(outdoor)-air-quality-and-health
(accessed on 24 May 2019).
3 EEA Report 10/2019. ‘Air quality in Europe – 2019 report’.
4 Decision 1600/2002/EC.
5 Directives 2004/107/EC and 2008/50/EC, as amended by Commission Directive (EU) 2015/1480.
6 Directive 2016/2284/EU.
7 Including Directives 2010/75/EU (on industrial emissions), 2015/2193/EU (on medium combustion
plants), 97/70/EC (on fuel quality), 2016/802/EU (on sulphur content in liquid fuels), 2009/125/EC (on
ecodesign), as well as EC Regulations 443/2009 and 510/2011 (on emission standards for vehicles),
Regulations (EU) 2016/427, (EU) 2016/646, and (EU) 2017/1154 (on real driving emissions), and
Regulation (EU) 2016/1628 (on non-road mobile machinery).
8 Implementing Decision 2011/850/EU.

6
Figure 1 – The EU Clean Air Policy framework
In line with the principles of Better Regulation, this fitness check assesses whether the
EU actions enshrined in these pieces of legislation have achieved their objectives without
entailing disproportionate costs and continue to be justified. The AAQ Directives
themselves do not include a formal requirement for a comprehensive evaluation at a
specific moment. However, an evaluation is timely for several reasons:
(1) Despite decreases in emissions of air pollutants over the last decades and improved
air quality, still more than one-in-six inhabitants of urban areas in the EU are exposed
to air pollution concentrations above EU air quality standards.9 The ‘Clean Air
Programme for Europe’'10 in 2013 put forward a strategic ambition to achieve full
compliance with existing air quality standards across the EU as soon as possible, and
by 2020 at the latest. In 2018, a Communication on ‘Clean Air for All’11 outlined
possible additional measures. Yet, as of 2019, significant compliance gaps remain.
(2) The air quality standards set in the AAQ Directives have been in place for almost two
decades, as most of them were ‘inherited’ from predecessor legislation (see Annex 4
to this SWD), and were last reviewed in 2005 in the context of the Thematic Strategy
on Air Pollution.12 Since their original conception, the evidence base regarding health
and environmental impacts has evolved: the Air Quality Guidelines of the World
Health Organization are, in most instances, more stringent than EU air quality
standards (it is to be noted that the Guidelines are currently being updated by the
World Health Organization). Also knowledge about the impacts of air pollution on
ecosystems, and vice-versa, has increased.13
9 EEA Report 10/2019. ‘Air quality in Europe – 2019 report’.
10 COM(2013)918. ‘A Clean Air Programme for Europe’.
11 COM(2018)330. ‘A Europe that protects: Clean air for all’.
12 COM(2005)446. ‘Thematic Strategy on air pollution’.
13 Intergovernmental Science-Policy Platform on Biodiversity and Ecosystem Services (IPBES).

7
(3) Over the past decade, both the policy context and the technical feasibility of effective
air quality measures have evolved. Relevant policy developments on emission
sources include the policy packages on Energy Union, Low Emission Mobility and
climate objectives, as well as the implementation of specific new tools and
instruments to utilise the full potential of existing source control legislation (i.a. by
reducing sulphur emissions of certain marine fuels, and improving the effectiveness
of vehicle emission standards, including through Real Driving Emission testing).
(4) Public interest and concern about air pollution continues to be pronounced and has
increased over the period covered by this fitness check. In 2013, a majority (56%) of
Europeans held the opinion that air quality had deteriorated over the preceding 10
years.14 Also, in 2017, a relative majority (47%) of Europeans held this opinion – and,
just behind climate change, air pollution is the environmental issue that is considered
the most important.15 This is also reflected in the high media coverage air pollution
receives in most Member States, and especially in those that have been reporting
exceedances of EU air quality standards.
This fitness check draws on experience in, and data from, all Member States, focusing on
the period from 2008 to 2018 as this is the period when both Directives were in force.
The analysis covers all articles and provisions of the two AAQ Directives, looking at the
role they have played in meeting the objectives. Thereby, this fitness check complements
and builds on the extensive analysis developed as part of the 2013 air policy review,
which informed the Clean Air Programme for Europe and the national emission
reduction commitments established under Directive 2016/2284/EU (note: the date of
transposition for this Directive was 1 July 2018, and it has not been included in this
fitness check).
In particular, this fitness check addresses the following four overarching topics:
• The extent to which the AAQ Directives have successfully defined methods to monitor
and assess air quality, to ensure that representative and high quality assessment
regimes are in place in all Member States.
• The extent to which the AAQ Directives have established clear and actionable air
quality standards that are in accordance with scientific advice to minimise harmful
effects on human health and ecosystems.
• The extent to which the AAQ Directives have helped ensure that reliable, objective
and comparable information on air quality and the attainment of air quality
standards is made public and reported to the Commission.
• The extent to which the AAQ Directives have facilitated action to avoid, prevent or
reduce the adverse effects of poor air quality, and triggered air quality plans that
have led to measurable improvements of air quality.
14 European Commission (2013). Flash Eurobarometer 360: ‘Attitudes of Europeans towards air quality’.
15 European Commission (2017). Special Eurobarometer 468: ‘Attitudes of European citizens towards
the environment’.

8
The findings of this fitness check will be used to inform further reflections on whether
the AAQ Directives continue to provide the appropriate legislative framework to ensure
protection from adverse impacts on, and risks to, human health and the environment.

9
2. BACKGROUND TO THE INTERVENTION
2.1. Description of the intervention and its objectives
The EU Ambient Air Quality (AAQ) Directives are guided by the overarching need to
reduce air pollution to levels which minimise harmful effects on human health, the
environment as a whole and the economy, taking into account relevant guidelines i.a. by
the World Health Organization. A basis for effective air pollution reduction is proper
monitoring and assessment of air quality, whereas providing information to the public
can support the minimisation of harmful health effects and help raise awareness.
Figure 2 provides an overview of how the overarching needs for health, environment and
economy translate into the AAQ Directives’ key objectives, and how they require input
and activities both at EU and at Member State level. This intervention logic can be
summarised along four main strands.
Figure 2 – Intervention logic of the EU Ambient Air Quality (AAQ) Directives
First, the AAQ Directives set common methods and criteria to assess air quality in all
Member States in a comparable and reliable manner: Member States must designate
zones and agglomerations16 throughout their territory, classify them according to
prescribed assessment thresholds, and provide air quality assessments underpinned by
measurement, modelling and/or objective estimation, or a combination of these.
Second, the AAQ Directives define and establish objectives and standards for ambient air
quality for 13 air pollutants to be attained by all Member States across their territories
against timelines laid out in the Directives. These are: sulphur dioxide (SO2), nitrogen
dioxide (NO2) and nitrogen oxides (NOx), particulate matter (PM10 and PM2.5), ozone
(O3), benzene, lead, carbon monoxide, arsenic, cadmium, nickel, and benzo(a)pyrene.
16 According to Directive 2008/50/EC a ‘zone’ shall mean part of the territory of a Member State, as
delimited by that Member State for the purposes of air quality assessment and management;
‘agglomeration’ shall mean a zone that is a conurbation with a population in excess of 250 000
inhabitants or above a given population density per km2 to be established by the Member States.

10
Third, the Directives require Member States to monitor air quality in their territory.
Member States need to report to the Commission as well as to the general public, the
results of air quality assessment on an annual basis, ‘up-to-date’ air quality
measurements, as well as information on the plans and programmes they establish. It is
the responsibility of Member States to approve the measurement systems required and
ensure the accuracy of measurements.
Fourth, where the established standards for ambient air quality are not met, the Directives
require Member States to prepare and implement air quality plans and measures (for
these pollutants exceeding the standards). These air quality plans need to identify the
main emission sources responsible for pollution, detail the factors responsible for
exceedances, and spell out abatement measures adopted to reduce pollution. Abatement
measures can include, for example, measures to reduce emissions from stationary sources
(such as industrial installations or power plants, as well as medium and small size
combustion sources, including those using biomass) or from mobile sources and vehicles
(including through retrofitting with emission control equipment), measures to limit
transport emissions through traffic planning or encouraging shifts towards less polluting
modes (including congestion pricing or low emission zones), promoting the use of low
emission fuels, or using economic and fiscal instruments to discourage activities that
generate high emissions.
Guided by the principle of subsidiarity, the AAQ Directives leave the choice of means to
achieve their air quality standards to the Member States, but explicitly require that
exceedance periods are kept as short as possible.
2.2. Air quality policy context prior to 2008
Air quality has been understood as a key environmental challenge for several decades.
EU level policy interventions started already in the 1980s and expanded in the late 1990s
and 2000s. Most of the provisions found in the currently applicable versions of the AAQ
Directives were originally established either via the Air Quality Framework Directive in
1996 or in one of the four Daughter Directives adopted between 1999 and 2004.17
Previous policy interventions already led to the establishment of most of the EU air
quality standards applicable today as well as of a comprehensive monitoring network. By
2005, Member States were monitoring air quality at around 3 000 locations and routinely
disseminated this information to the public and the Commission (albeit not using a
system of electronic reporting based on a shared information system yet).18
In 2005, the Thematic Strategy on Air Pollution presented a detailed assessment of the
situation at the time as basis for a revision of EU Clean Air Policy. It concluded that “air
pollution continues to diminish the health and quality of life of EU citizens as well as the
17 Air Quality Framework Directive (96/62/EC), and its First (1999/30/EC on limit values for sulphur
dioxide, nitrogen dioxide and oxides of nitrogen, particulate matter and lead in ambient air), Second
(2000/69/EC on limit values for benzene and carbon monoxide in ambient air) and Third (2002/3/EC
on ozone in ambient air) Daughter Directives. The current Directive 2004/107/EC was originally
conceived as the Fourth Daughter Directive. See also Annex 4.
18 SEC(2005)1132. ‘Thematic Strategy on air pollution’.

11
natural environment. The magnitude of these effects is too large to ignore and doing
nothing more beyond implementing existing legislation is not a sensible option.”19
As regards the AAQ Directives specifically, the Thematic Strategy included a legislative
proposal to combine the Air Quality Framework Directive and first three Daughter
Directives, while suggesting that the fourth Daughter Directive (see Annex 4 to this
SWD) would be ‘merged later through a simplified “codification” process’.20 The
strategy foresaw three main actions to be implemented in a revised AAQ Directive:
• Addressing specific implementation problems: Experience had shown that there were
zones suffering from acute and exceptional problems. Therefore, as part of the
proposal, it was suggested to allow Member States to request an extension to the
deadline for compliance in affected zones if they could demonstrate that they had
taken all reasonable measures and put in place plans to move towards compliance.21
• Modernising monitoring and reporting: It was proposed to move to a system of
electronic reporting based on a shared information system.22 Furthermore the Impact
Assessment assumed that the proposed regulation would require an additional 800 to
1 200 sampling points for PM2.5 (and, at the same time, noted scope to reduce the
overcapacity of some 500 SO2 sampling points identified).
• Control of human exposure to PM2.5 in ambient air: The Thematic Strategy found,
that in addition to the existing controls on PM10, there was a need to cap unduly high
risks from exposure to PM2.5 and to reduce the general exposure of citizens
everywhere. A cap of 25 μg/m3 was proposed which was deemed unlikely to impose
additional burdens except in the most polluted areas of the EU.
The impact assessment of the Thematic Strategy assumed that both the AAQ Directives
and previous NEC Directive23 would be revised concurrently, to ensure simultaneous
reduction of emissions and background concentrations of several air pollutants: nitrogen
oxides (NOx), sulphur dioxide (SO2), volatile organic compounds (VOC), ammonia
(NH3) and fine particulate matter (PM2.5). It was estimated that this would decrease the
total number of years of life lost by 42% by the year 2020 compared to 2000.
This impact assessment also concluded that the Commission’s proposal to reduce PM2.5
background concentrations between 2010 and 2020 would render monetized benefits of
at least EUR 37 billion (and up to EU 119 billion) per year by the year 2020, while the
costs of implementation were estimated at between EUR 5 and 8 billion per year.24
It should be stressed that these estimates were explicitly based on the assumption that
emissions of air pollutants would be reduced via a revised NEC Directive in immediate
19 SEC(2005)1132. ‘Thematic Strategy on air pollution’.
20 SEC(2005)1133. ‘Thematic Strategy on air pollution: Impact Assessment’.
21 Note that this relates to Article 22 of Directive 2008/50/EC, which introduced postponement of
attainment under specific conditions. Any related exemptions, however, have since expired.
22 Note that this was established by Implementing Decision 2011/850/EU.
23 Directive 2001/81/EC.
24 SEC(2005)1133. ‘Thematic Strategy on air pollution: Impact Assessment’.

12
follow-up to the Thematic Strategy. 25 Accordingly, no bespoke assessment for the costs
and benefits of the AAQ Directives alone was carried out at the time.26
2.3. Points of comparison and baseline
The AAQ Directives and its predecessor legislation have established clear EU air quality
standards in the form of limit values and target values (see Table 1).27 These EU air
quality standards provide a benchmark and point of comparison against which to assess
improvements in air quality over the past ten years. Section 3.2 and Annex 7 provide
further points of comparison in the form of key air quality indicators.
Table 1 – Air quality standards for different pollutants according to the AAQ Directives Pollutant Concentration Averaging period Legal nature Date entering into
force
Permitted
exceedances each
year
Sulphur dioxide
(SO2)
350 µg/m3 1 hour Limit value 1.1.2005 24
125 µg/m³ 24 hours Limit value 1.1.2005 3
Particulate matte
(PM10)
50 µg/m3 24 hours Limit value 1.1.2005 ** 35
40 µg/m3 1 year Limit value 1.1.2005 ** n/a
Fine particulate
matter (PM2.5)
25 µg/m3 1 year Target value
Limit value
1.1.2010
1.1.2015
n/a
n/a
Nitrogen dioxide
(NO2)
200 µg/m3 1 hour Limit value 1.1.2010 * 18
40 µg/m3 1 year Limit value 1.1.2010 * n/a
Lead (Pb)
0.5 µg/m3 1 year Limit value 1.1.2005 *** n/a
Carbon monoxide
(CO)
10 mg/m3 Max daily 8 hour
mean
Limit value 1.1.2005 n/a
Ozone 120 µg/m3 Max daily 8 hour
mean
Target value 1.1.2010 25 days averaged
over 3 years
Benzene
5 µg/m3 1 year Limit value 1.1.2010 ** n/a
Arsenic (As)
6 ng/m3 1 year Target value 31.12.2012 n/a
Cadmium (Cd)
5 ng/m3 1 year Target value 31.12.2012 n/a
Nickel (Ni)
20 ng/m3 1 year Target value 31.12.2012 n/a
Benzo(a)pyrene
(BaP)
1 ng/m3
1 year Target value 31.12.2012 n/a
*Under Directive 2008/50/EU, the Member States could apply for a postponement of a maximum of five years (i.e.
maximum up to 2015) in specific zones; subject to an assessment by the Commission.
**Under Directive 2008/50/EU, Member States were able to apply for an exemption to apply these limit until 11 June
2011 in specific zones; subject to assessment by the Commission.
*** Or 1.1.2010 in the immediate vicinity of specific, notified industrial sources; and a 1.0 µg/m3 limit value applied
from 1.1.2005 to 31.12.2009.
25 Note that the NEC Directive, i.e. Directive 2001/81/EC, was not revised at the time. It was, however,
subsequently revised in 2016; see Directive (EU) 2016/2284. This should now help delivering a
sustained downward trend in air pollutant emissions in a 2030 and beyond perspective, and reduce the
negative health impacts of air pollution by more than 50% by the year 2030 compared to 2005.
26 SEC(2005)1133. ‘Thematic Strategy on air pollution: Impact Assessment’.
27 In addition to limit values and target values, other types of air quality standards have been established
in the form of critical levels, long-term objectives, alert thresholds and information thresholds,
depending on the pollutant. The differences between these types of air quality standards are described
in further detail below, see Table 1 and Box 1

13
Box 1 – A typology of EU Air Quality Standards
The AAQ Directives deploy a number of different types of air quality standards for the different
pollutants they cover. All of these standards have been set on the basis of scientific knowledge,
with the aim of avoiding, preventing or reducing harmful effects on human health and/or the
environment as a whole, but their formats and purposes differ. These differences are motivated in
part by different levels to which Member States can address the respective air pollutants and their
underlying emissions on their own territories.
Limit values are to be attained within a given period and not to be exceeded once attained – set
for particulate matter, sulphur dioxide, nitrogen dioxide, benzene, carbon monoxide, and lead.
Target values are to be attained where possible over a given period by taking all necessary
measures not entailing disproportionate costs – set for ozone, benzo(a)pyrene, arsenic, cadmium,
nickel (also for fine particulate matter standards were initially established as target values before
becoming limit values). One reason for setting target values rather than limit values is to take
account of the specific formation mechanisms, for example in the case of ozone (also due to a
strong role of transboundary sources and annual variations in meteorology for this air pollutants).
Critical Levels refer to concentrations, above which direct adverse effects may occur on some
receptors, such as trees, other plants or natural ecosystems but not on humans – set for sulphur
oxides and for oxides of nitrogen.
Long-Term Objectives are set to be attained in the long term, save where not achievable through
proportionate measures – set for ozone only.
Alert thresholds are levels beyond which there is a risk to human health from brief exposure for
the population as a whole and at which immediate steps are to be taken by the Member States –
set for sulphur dioxide, nitrogen dioxide, and ozone. And for ozone only, information thresholds
set a level lower than the alert threshold beyond which there is a risk for particularly sensitive
persons and appropriate information is needed.
In addition, the Average Exposure Indicator provides an average level determined on the basis of
measurements at urban background locations which reflects population exposure. It is used to
calculate national exposure reduction targets (in percent) for each Member State. This has been
established only for fine particulate matter (PM2.5).
An assessment of the state of air quality in 2008,28 provides a pollutant by pollutant
baseline of the number and magnitude of exceedances at the time (see also Section 3.2
and Annex 7):
• Sulphur dioxide (SO2) showed an ongoing decreasing trend in ambient
concentrations, and exceedances of the health related limit values were observed at a
limited number of stations only.
• Particulate matter (PM10 and PM2.5) concentrations were decreasing slowly. In
particular, the PM10 limit value for daily concentration measurements was exceeded
frequently at urban background and traffic stations. Also the target value for PM2.5
(which was to enter into force in 2010) was being exceeded for about 10% of the
sampling points. (See Figure 3)
28 ETC/ACC Technical paper 2010/1. ‘The state of the air quality in 2008’.

14
• Nitrogen dioxide (NO2) concentrations were decreasing in most parts of Europe:
more than half of the traffic stations showed a decline. Still, compliance with the air
quality standards for annual mean values was seen as a serious problem in many
urban and traffic areas. (See Figure 3)
• Ozone (O3) concentrations showed, more than for any of the other pollutants, a
pronounced year-to-year variability which made it difficult to identify a trend. In
2008, both the health and the ecosystem related target values were exceeded
frequently and widely across Europe.
• Carbon monoxide (CO) levels were generally below the limit value even if some
incidental exceedances were observed, as concentrations had already decreased
during the previous decade. Similarly, benzene (C6H6) concentrations were in
compliance with the limit values except for a limited number of traffic hotspot
situations.
• Lead (Pb) air pollution exceedances were observed in a limited number of Member
States, but appeared to be local issues only. Similarly, arsenic (As), cadmium (Cd),
and nickel (Ni) air pollution was generally low: at a majority of the sampling points
the concentrations were below the lower assessment threshold. Still, limited
exceedances at between 2% and 7% of the stations were reported.
• Benzo(a)pyrene (BaP) target values were exceeded at more than one third of the
sampling points, mainly those located at (sub)urban background stations.
Figure 3 – Annual mean concentration map of PM10 (left), NO2 (right) in 2008

15
3. IMPLEMENTATION / STATE OF PLAY
3.1. Air quality monitoring
Across the EU, Member States have established more than 4 000 monitoring stations,
with more than 16 000 sampling points to measure specific pollutants, see Table 2.
Table 2 – Number of sampling points per pollutant, and total monitoring stations (which
may contain multiple sampling points), as reported by Member States for the year 201729, Monitoring
Stations per
Member State
Sampling points per pollutant
PM10 PM2.5 SO2 NO2 O3 CO
Benze
ne
Pb in
PM10
As in
PM10
BaP in
PM10
Cd in
PM10
Ni in
PM10
AT 187 156 55 69 148 111 26 21 13 13 30 14 13
BE 218 66 70 37 119 38 18 32 28 28 19 28 28
BG 43 40 9 30 25 20 18 20 9 4 13 10 5
CY 5 3 4 3 3 3 3 1 2 2 1 2 2
CZ 149 121 70 46 68 60 15 34 42 42 39 42 42
DE 606 502 219 130 559 275 93 130 99 103 114 103 103
DK 13 8 10 3 13 8 5 3 3 3 2 3 3
EE 9 11 7 9 9 9 7 4 5 5 5 5 5
EL 26 27 14 11 23 20 12 7 2 2 2 2 2
ES 610 464 242 423 497 435 194 108 122 123 89 123 122
FI 61 41 17 12 31 17 1 2 1 4 8 4 4
FR 651 391 157 164 443 345 28 71 59 54 53 54 51
HR 22 13 10 8 13 15 4 3 2 2 3 2 2
HU 36 25 12 24 24 17 21 11 - 7 19 5 2
IE 30 16 9 12 14 12 4 2 4 4 4 4 4
IT 663 509 265 247 582 327 211 226 126 129 146 128 125
LT 18 15 7 14 17 14 9 3 5 5 5 5 5
LU 8 6 7 3 7 5 3 1 1 1 1 1 1
LV 12 6 5 6 8 7 1 6 5 5 5 5 5
MT 4 3 4 3 4 4 2 2 3 3 1 3 3
NL 82 68 47 14 73 46 10 10 1 1 3 1 1
PL 278 288 111 141 141 119 83 49 83 81 135 81 80
PT 65 59 18 29 52 47 14 3 - - - - -
RO 144 92 17 141 115 94 106 65 55 32 - 54 47
SE 141 75 40 33 114 45 12 22 4 4 - 4 4
SI 21 18 4 7 9 12 4 2 5 5 3 5 5
SK 38 32 32 14 25 16 13 11 4 4 4 4 4
UK 192 75 81 27 153 76 7 38 24 24 32 24 24
Total 4 332 3.130 1.543 1.660 3.289 2.197 924 887 707 690 736 716 692
For comparison, number of total sampling points per pollutant for which data was reported for the year 2008:30
2694 540 2144 3 140 2 166 1313 707 624 637 637 637 637
This monitoring network provides reliable, credible and comparable information on air
quality. It increasingly does so in real time, with more than 2 500 monitoring stations
providing the European Environment Agency with ‘up-to-date’ data. More and more of
this information is made available also online, including on hand-held devices, for
example via the European Air Quality Index.31
As regards the placement of monitoring stations and sampling points, the AAQ
Directives give the competent authorities in the Member States a certain margin to adapt
the placement of sampling points to local circumstances, but only within the limits set by
the AAQ Directives. Section 5.3 discusses the effectiveness and efficiency of the
monitoring network in further detail.
29 https://tableau.discomap.eea.europa.eu/t/Aironline/views/Content_stats-refreshed/SPO-1year-npollutants
30 ETC/ACC Technical paper 2010/1. ‘The state of the air quality in 2008’.
31 http://airindex.eea.europa.eu/

16
3.2. Air quality standards
The AAQ Directives have established a set of EU air quality standards, which have
entered into force in 2005, 2010, 2012 and 2015 respectively. The latest available data as
published by the European Environment Agency via its annual air quality report for
Europe shows that widespread exceedances of EU air quality standards of key pollutants
continue to have significant impacts on the health of EU citizens.32
For particulate matter (PM10), in 2017, 23% of all reporting sampling points and
17 Member States reported exceedances of the daily limit values established by EU
legislation: this translates into leaving 17% of the urban population exposed to
exceedances for PM10 (note that when compared against WHO Air Quality Guidelines,
this number increases to approximately 44% of the urban population), see Figure 4a.
For fine particulate matter (PM2.5), in 2017, 7 Member States reported exceedances
above the EU annual limit value. The share of the urban population exposed to
exceedances above the annual limit value is 8% compared to EU air quality standards,
but 77% compared to WHO Air Quality Guidelines, see Figure 4b.
For nitrogen dioxide (NO2), in 2017, around 10% of all reporting sampling points and
16 Member States, reported exceedances above EU air quality standards: including in
more than 130 cities across the EU. This leaves approximately 7% of the urban
population exposed to annual concentrations above the limit value, see Figure 4c.
Figure 4a – Percentage of monitoring stations for particulate matter, PM10, with
exceedances above the daily limit value (columns, left axis), and highest number of days
with exceedances (points, right axis shows number of days above the daily limit value),
as reported for each Member State for 2008 and 2017.33
32 EEA Report 10/2019. ‘Air quality in Europe – 2019 report’.
33 Data for Croatia shows 2013 (i.e. not 2008) and 2017. Data for Malta shows 2009 (i.e. not 2008) and
2017. Note that for some Member States, for example Poland, this figure also reflects significant
changes in the air quality network, in particular adding of new stations in areas of exceedances (thus
increasing the number of stations above the limit value between 2008 and 2017). The dashed line
depicts the number of days for which exceedances of the daily limit value are permissible under the
AAQ Directives. Member States are sorted according to maximum number of days reported in 2017.

17
Figure 4b – Percentage of monitoring stations for fine particulate matter, PM2.5, with
exceedances above the annual limit value (columns, left axis), and highest concentration
(points, right axis shows µg/m3), as reported for each Member State for 2008 and 2017.34
Figure 4c – Percentage of monitoring stations for nitrogen dioxide, NO2, with
exceedances above the annual limit value (columns, left axis), and highest concentration
(points, right axis shows µg/m3), as reported for each Member State for 2008 and 2017.35
Note that this does not take into account the possible subtraction due to natural sources or winter
sanding/salting.
34 Data for Croatia shows 2013 (i.e. not 2008) and 2017. Data for Romania shows 2010 (i.e. not 2008)
and 2017. Note that for some Member States, for example Poland, this figure also reflects significant
changes in the air quality network, in particular adding of new stations in areas of exceedances (thus
increasing the number of stations above the limit value between 2008 and 2017). Note that this does
not take into account the possible subtraction due to natural sources or winter sanding/salting. The
upper dashed line depicts the annual limit value (40 µg/m³); the lower dashed line depicts the WHO
Guidelines (20 µg/m³). Member States are sorted according to highest exceedance reported in 2017.
35 Data for Croatia shows 2013 (i.e. not 2008) and 2017. Data for Cyprus and Malta shows 2009 (i.e. not
2008) and 2017. The dashed line depicts the annual limit value (which is identical to levels

18
Also, exceedances above the ozone target value and the long-term objective continue to
be widespread and persistent. In 2017, 20% of all reporting sampling points and
17 Member States reported exceedances above the target values. It is also worth noting
that exceedances reported for ozone vary significantly from year to year, as this pollutant
is particularly sensitive to changes in meteorological conditions. The share of the urban
population exposed to exceedances above the annual target value is 14% when compared
to EU air quality standards, but 97% when compared to WHO Air Quality Guidelines.
For several other pollutants, exceedances occur only in isolated instances. In 2017,
exceedances were reported for only two sampling points for sulphur dioxide (in
Bulgaria), for one sampling point for carbon monoxide (in Sweden), for three sampling
points for benzene (in Belgium, Romania and Spain), and none for lead. In the same year,
only a limited number of exceedances were reported for arsenic (six sampling points),
cadmium (two sampling points), and nickel (five sampling points).
Air pollution also damages vegetation and affects the ecosystems’ ability to function and
grow. The most harmful air pollutants in terms of damage to ecosystems are ozone,
ammonia, nitrogen dioxide and sulphur dioxide. In particular, air emissions of sulphur
dioxide, ammonia and nitrogen dioxide affect water, vegetation and soils through
acidification and eutrophication, with adverse effects on flora and fauna, leading to
reduced capacity of ecosystems to provide fundamental services such as nutrient cycling,
carbon cycling and water provision, on which the ecosystems and human life depend.
73% of EU-28 ecosystem area remains exposed to air pollution above eutrophication
limits.36 Increased ground-level ozone causes damage to plants, leading to reduced
agricultural yields, ecosystems damages and, ultimately, reduced air filtering capacity of
the vegetation overall.37
3.3. Air quality reporting and information
Member States send validated data to the Commission once a year, and continuously
transmit up-to-date (near real-time) air quality data. Reporting obligations include
monitoring data and information about sampling points and assessment methods,
exceedance situations and alerts, about contributions from natural sources, road sanding
and salting, about air quality plans and measures.
Since 2013, the requirements for the reciprocal exchange of information and reporting on
ambient air quality are governed by Implementing Decision 2011/850/EU.38 Accordingly,
data is by now submitted via e-reporting through the Reporting Obligation Database
recommended in the WHO Guidelines. Member States are sorted according to highest exceedance
reported in 2017.
36 EEA Report 10/2019. ‘Air quality in Europe – 2019 report’.
37 UNECE Air Convention (Convention on Lon-Range Transboundary Air pollution), Geneva, 1979.
38 Implementing Decision 2011/850/EU laying down rules as regards the reciprocal exchange of
information and reporting on ambient air quality applies since 1 January 2014 (i.e. for data observed in
2013).

19
(Central Data Repository) of the European Environment Information and Observation
Network (EIONET), hosted by the European Environment Agency.
In this manner, all Member States report information on zones and agglomerations
(‘Dataflow B’), on assessment regimes (‘Dataflow C’), on assessment methods
(‘Dataflow D’), on primary validated assessment data (‘Dataflow E1a’), and on the
attainment of environmental objectives (‘Dataflow G’).39 26 Member States (status in
May 2019) report primary up-to-date assessment data (‘Dataflow E2a’). For 2017,
12 Member States reported also modelled data (‘Dataflow E1b’) – see section 5.3.
Where and when applicable, Member States also report information on air quality plans
(‘Dataflow H’), on source apportionment (‘Dataflow I’), on the scenario for the
attainment year (‘Dataflow J’) and on measures (‘Dataflow K’).
Based on the data reported by Member States, the European Environment Agency
provides online access to all reported air quality data, statistics and maps, and publishes
an annual air quality report summarising key findings. It also provides access to this data
via online information services such as the European Air Quality Index (see Figure 5).
Figure 5 – The European Environment Agency publishes annual air quality reports (left)
and hosts an online European air quality index with near-real-time data (right)40
39 http://aqportal.discomap.eea.europa.eu/products/submission-monitoring/data-monitor-all-except-e2a/
40 http://airindex.eea.europa.eu/
15 October
2018
29 October
2018
20
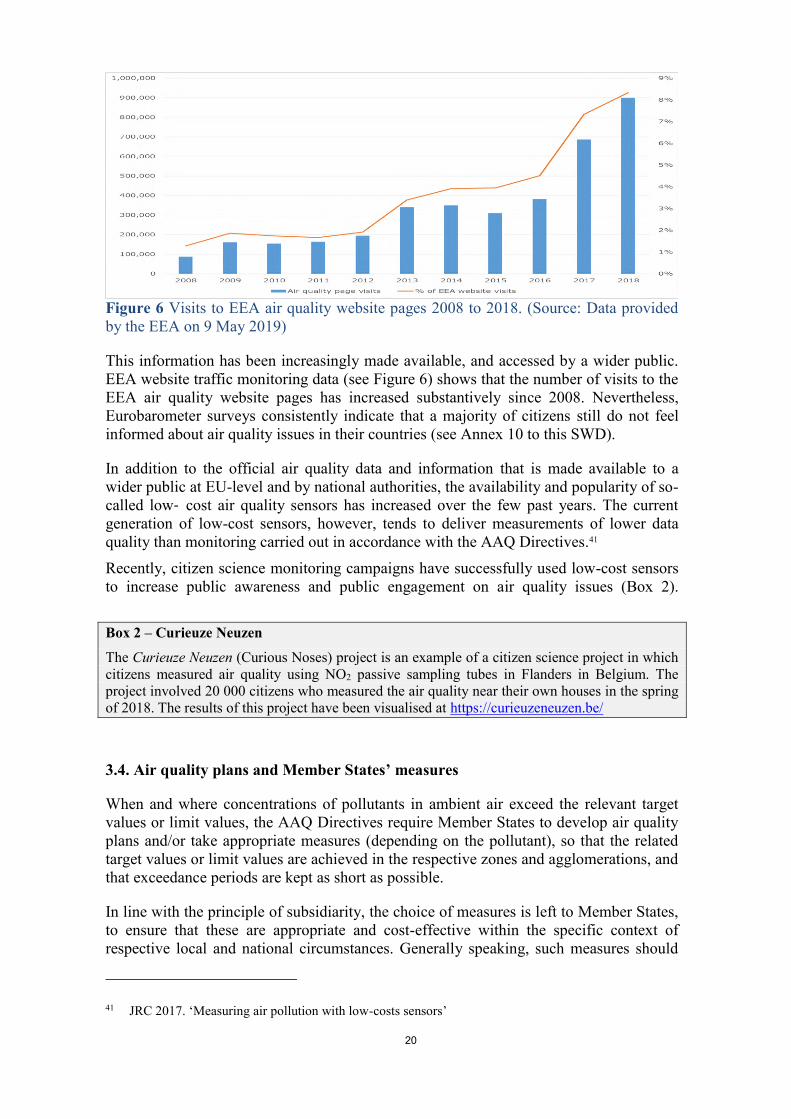
Figure 6 Visits to EEA air quality website pages 2008 to 2018. (Source: Data provided
by the EEA on 9 May 2019)
This information has been increasingly made available, and accessed by a wider public.
EEA website traffic monitoring data (see Figure 6) shows that the number of visits to the
EEA air quality website pages has increased substantively since 2008. Nevertheless,
Eurobarometer surveys consistently indicate that a majority of citizens still do not feel
informed about air quality issues in their countries (see Annex 10 to this SWD).
In addition to the official air quality data and information that is made available to a
wider public at EU-level and by national authorities, the availability and popularity of so-
called low‑ cost air quality sensors has increased over the few past years. The current
generation of low-cost sensors, however, tends to deliver measurements of lower data
quality than monitoring carried out in accordance with the AAQ Directives.41
Recently, citizen science monitoring campaigns have successfully used low-cost sensors
to increase public awareness and public engagement on air quality issues (Box 2).
Box 2 – Curieuze Neuzen
The Curieuze Neuzen (Curious Noses) project is an example of a citizen science project in which
citizens measured air quality using NO2 passive sampling tubes in Flanders in Belgium. The
project involved 20 000 citizens who measured the air quality near their own houses in the spring
of 2018. The results of this project have been visualised at https://curieuzeneuzen.be/
3.4. Air quality plans and Member States’ measures
When and where concentrations of pollutants in ambient air exceed the relevant target
values or limit values, the AAQ Directives require Member States to develop air quality
plans and/or take appropriate measures (depending on the pollutant), so that the related
target values or limit values are achieved in the respective zones and agglomerations, and
that exceedance periods are kept as short as possible.
In line with the principle of subsidiarity, the choice of measures is left to Member States,
to ensure that these are appropriate and cost-effective within the specific context of
respective local and national circumstances. Generally speaking, such measures should
41 JRC 2017. ‘Measuring air pollution with low-costs sensors’

21
be guided by the principles that guide environmental action in the EU, i.e. that action
should be based on the precautionary principle and on the principles that preventive
action should be taken, that environmental damage should as a priority be rectified at
source and that the polluter should pay.
Air quality plans are required to clearly localise the excess pollution, provide an
assessment of the pollution situation, list and quantify the main emission sources
responsible for the pollution and provide details of those factors responsible for the
exceedance, and detail possible measures for the improvement of air quality. Measures
adopted with a view to reducing pollution need to be described, including with a
timetable for implementation as well as estimates of the improvement in air quality
planned. 42
Appropriate measures need to address the main emission sources at different
geographical scales (see Annex 5 to this SWD). In general, looking at the EU as a whole,
air pollutants mainly stem from transport, both road and non-road transport; the
commercial, institutional and households sector, including residential heating; energy
production and distribution; energy use in industry; industrial processes and product use;
agriculture; and waste (see Figure 7 for details per pollutant).
Figure 7 – Contribution to EU-28 emissions from main source sectors in 201643,44
42 Annex XV of Directive 2008/50/EC specifies the details to be provided in air quality plans.
43 EEA Report 12/2018. ‘Air quality in Europe – 2018 report’.

22
Air quality plans shall be reported to the Commission no later than two years after the
exceedance occurred. For the period 2013 to 2017, via the e-reporting system hosted by
the EEA, almost 300 air quality plans for 20 Member States have been reported.45
Member States also report source apportionment where exceedances occur, as well as
measures adopted.46 The Joint Research Centres hosts a Catalogue of Air Quality
Measures to showcase a selected number of successful and less successful air quality
measures to inform better implementation.47
An analysis of the different types of measures and plans to improve air quality that were
officially reported from 2014 to 2016 indicates that most of these address particulate
matter and nitrogen dioxide, corresponding to the limit values most commonly
exceeded.48 The majority of individual measures taken address the transport sector,
although they focus mainly on road transport compared to non-road transport.
3.5. Ongoing infringements point to implementation gaps
The European Commission has worked intensively with national authorities throughout
the past years, even before limit values entered into force, to steer progress in
implementation, and help deliver compliance with air quality legislation. This has been
done alongside the Commission using its legal powers: where exceedances and non-
compliance persist, infringement procedures have been initiated and pursued.
As of October 2019, 32 infringement procedures against 20 Member States remain
pending:
• 15 cases for persistent particulate matter (PM10) exceedances (Bulgaria, Czechia,
Germany, Greece, Spain, France, Hungary, Italy, Latvia, Portugal, Poland, Romania,
Sweden, Slovakia and Slovenia);
• 14 cases for persistent nitrogen dioxide (NO2) exceedances (Austria, Belgium,
Czechia, Germany, Denmark, France, Greece, Spain, Hungary, Italy, Luxembourg,
Poland, Portugal, and the United Kingdom);
• one case for persistent sulphur dioxide (SO2) exceedances (Bulgaria); and
• two cases for shortcomings related to air quality monitoring (Slovakia and Romania).
Of these, for eleven cases the decision has been taken to refer these to the Court of
Justice of the EU. Three cases have received a recent ruling: in 2017, 2018 and 2019,
respectively, the Court of Justice of the EU delivered judgements in the cases on
44 EEA Report 6/2018. ‘European Union emission inventory report 1990-2016’ provides an explanation
of the categories of emission sources (in its Appendix 4). Note that the category ‘commercial,
institutional and households’ includes residential heating.
45 Data extracted from http://aideh.apps.eea.europa.eu.
46 See http://aidei.apps.eea.europa.eu and http://aidek.apps.eea.europa.eu, respectively.
47 See https://fairmode.jrc.ec.europa.eu/measure-catalogue/.
48 EEA Briefing 9/2018. ‘Improving Europe’s air quality — measures reported by countries’.

23
exceedances of PM10 in Bulgaria and in Poland, and for NO2 in France.49 These
judgements confirm the European Commission’s view that persistent exceedances
require the Member States concerned to take more effective measures.
The European Court of Auditors has recommended to accelerate enforcement by the
Commission, as infringement cases have been taking between six and eight years from
the initial exceedance to a referral to the Court of Justice of the EU, and have not yet
ensured compliance with the AAQ Directives.50
Furthermore, there have been numerous, often successful, proceedings before national
courts brought by NGOs demanding the elaboration or implementation of appropriate air
quality plans.51
49 For an overview of closed and pending cases before the Court of Justice of the EU, see Annex 6 to this
SWD. See case C-488/15 for Bulgaria, case C-336/16 for Poland and case C-636/18 for France.
50 European Court of Auditors Special Report on Air Pollution. See section 1 of Annex 9 to this SWD.
51 See Annex 6 to this SWD for an illustrative overview of clean air cases before national courts.

24
4. METHOD
4.1. Process and methodology
Evaluation questions
This fitness check was guided by a Roadmap52 that outlined issues, looking in particular
at the five evaluation criteria outlined in the Better Regulation agenda. This translated
into five overarching evaluation questions on the criteria of relevance, effectiveness,
efficiency, coherence and EU added value. A sixth evaluation question specifically
looked at the effectiveness and efficiency of air quality monitoring.
(1) Do the AAQ Directives still set appropriate objectives, address the most pressing air
pollutants, and set meaningful standards to protect human health and ecosystems in
accordance with evolving scientific understanding? (Relevance)
(2) To what degree have the AAQ Directives acted as an incentive to implement
effective measures to improve air quality, and thus reduce the adverse impacts of air
pollution? (Effectiveness)
(3) To what degree are the monitoring and reporting approaches mandated by the AAQ
Directives (and their respective implementation) fit for purpose? (Effectiveness and
efficiency of air quality monitoring)
(4) To what degree do the benefits of improved air quality justify the costs of improving
air quality? Are there significant differences in costs (or benefits) between Member
States, and if so, what is causing them? (Efficiency)
(5) Are the AAQ Directives coherent internally, with other EU Clean Air policies, with
other EU legislation (e.g. on transport, energy, agriculture or nature protection), and
with international commitments? (Coherence)
(6) To what degree have common EU air quality standards and comparable monitoring,
reporting and assessment regimes enabled Member States to take successful action
beyond what would have been possible without EU action? (EU added value)
To inform the responses to these six evaluation questions a separate support study53
analysed a total of ten more detailed evaluation (sub-) questions which were derived from
the above six (i.e. one on relevance, one on effectiveness, four on efficiency, two on
coherence and two on EU added value). For the responses provided in this Staff Working
Document the evidence collated under these ten evaluation (sub-) questions has been
summarised for each of the six questions listed above – see Annex 3 to this SWD.
52 https://ec.europa.eu/info/law/better-regulation/initiatives/ares-2017-3763998_en
53 COWI et al. (2019). ‘Supporting the fitness check of the EU Ambient Air Quality Directives
(2008/50/EC, 2004/107/EC)’ – hereafter referred to as ‘Support study informing this Fitness Check’.

25
Information and data gathering
The support study helped gather information and data through different channels,
including several means to solicit stakeholder views.
Literature review and legal analysis: An extensive literature review was undertaken,
through the support study (which analysed more than 600 sources of evidence)54 and
outside of it, analysing relevant reports and studies, academic literature, position papers
published by experts, stakeholder opinions, legislation at EU and Member State levels as
well as other relevant sources. The review contributed to establishing the baseline and the
implementation state of play and to collecting information on all evaluation questions. It
also benefited from several other institutions’ reports published during the course of this
fitness check, in particular reports by the European Court of Auditors55 and the European
Organisation of Supreme Audit Institutions (EUROSAI).56
Analysis of reported data: The support study gathered relevant information from the air
quality e-Reporting database managed by the European Environment Agency. The
database gathers air quality information reported by Member States, such as on
assessment regimes, attainment of environmental objectives, air quality plans and
measures, which informed the assessment of the effectiveness and efficiency criteria (see,
in particular, Appendix E to the support study).
An open public consultation of EU stakeholders was published online in 2018, open to all
interested parties (citizens, companies, NGOs, research institutions, public authorities)
for 12 weeks (from May to July 2018), and translated into all official EU languages. It
consisted of both closed and open questions covering all evaluation questions. It also
allowed for position papers to be uploaded. The open public consultation generated 489
responses, with respondents from 27 of the 28 EU Member States. The number of
responses, below 500 respondents, provides an illustration of stakeholder perspectives,
but by itself does not allow for a conclusive analysis (see Annex 2 to this SWD).
A targeted questionnaire was sent to representatives of public authorities’ stakeholders
(approximately 160 contacts at national, regional and local level); national and EU level
NGOs (around 100 contacts); industry and trade representatives (around 80 contacts at
national and EU levels); research institutes and universities (around 180 contacts), with
more than two months for sending responses. 43 responses were received from all types
of stakeholders consulted, which were used in all aspects of the evaluation (see Annex 2
to this SWD).
Two stakeholder workshops took place on 18 June 2018 and on 15 January 2019,
respectively, with high-level representatives from the Commission.57 The workshops
54 Support study informing this Fitness Check, Appendix C.
55 European Court of Auditors Special Report on Air Pollution. See section 1 of Annex 9 to this SWD.
56 EUROSAI Joint Report on Air Quality. See section 4 of Annex 9 to this SWD.
57 The agendas and summaries are available online.
18 June 2018: https://ec.europa.eu/info/events/stakeholder-workshop-support-fitness-check-eu-
ambient-air-quality-directives-2018-jun-18_en
15 January 2019: https://ec.europa.eu/info/events/second-stakeholder-workshop-support-fitness-check-
eu-ambient-air-quality-directives-2019-jan-15-0_en

26
provided the opportunity to gather feedback on the approach taken, the sources of
information, and the preliminary results of the analysis. In addition, four meetings of the
Ambient Air Quality Expert Group gathering representatives from EU Member States
provided opportunities to inform and discuss the fitness check, from January 2018 to
April 2019 (see Annexes 1 and 2 to this SWD).
Seven case studies were conducted in Bulgaria, Germany, Ireland, Italy, Spain, Slovakia,
and Sweden, based on extensive desk research and interviews with relevant authorities
and stakeholders. The case studies investigated several dimensions of the analysis, such
as the impact of governance systems on air quality monitoring and assessment, good
practices and implementation challenges (see Annex 11 to this SWD).
Bespoke modelling and computations: For the analysis of the efficiency criterion, and in
addition to the sources of information presented above (which informed mostly the
analysis of the costs), the support study undertook specific computations based on
previously published methodology, in order to estimate some of the health benefits of the
AAQ Directives and some of the damage costs to society in case of their insufficient
implementation. The precise steps of these computations are described in Annex 3 to this
SWD.
4.2. Limitations and robustness of findings
Each source of information had its own set of limitations but combining those sources
has allowed to minimise the impacts of the limitations on the reliability of the analysis.
The reliability of the extensive body of literature that has been reviewed is high as the
studies and reports used were peer-reviewed. However, it has to be noted that some
evaluation questions were subject to more abundant literature than others. This limitation
applies specifically to the efficiency criterion, for which it has proved difficult to find
studies exactly fitted for the analysis under this fitness check (in terms of coverage,
timeline etc.), hence also limiting the availability and reliability of baseline data.
However, costs and benefits’ estimates stemming from other related (although not
similar) exercises were also considered, be they from the OECD or from previous
Commission work. On the other hand, the analysis of legal documents has provided a
high level of confidence, based on case law, infringement cases as well as secondary
literature (e.g. reports or academic literature) analysing these aspects.
The information gathered through the EEA reporting database is deemed very reliable
due to extensive quality checks both by Member States and the European Environment
Agency; it allowed establishing trends and patterns of implementation across Member
States, which were then complemented by more specific information from other sources.
As it is the case with any such consultation, the results from the public and stakeholder
consultations undertaken during this exercise should not be regarded as necessarily
representative of the general population. Having said that, it should be noted that views
were expressed from a sufficiently large variety of stakeholders in order to provide useful
and illustrative information. Limitations of representativeness were also counterbalanced,
as much as possible, through the information gathered through other sources. In
particular, the case studies, although representative only of specific cases, provided
useful complementary information for exemplification.

27
Most of the limitations in the analysis relate to the efficiency criterion and these are
clearly highlighted throughout the support study and this Staff Working Document.
Despite attempts to gather information through several channels (targeted questionnaire,
case studies, literature review), data availability on costs and benefits for the periods
before and after the implementation of the AAQ Directives is poor. This difficulty, also
recognised in the EUROSAI report,58 can be explained by the fact that many measures
affecting air quality originate from other policy areas (such as congestion reduction,
acting on energy poverty) and that measures put in place in air quality plans also deliver
co-benefits to other policies (such as decarbonisation). It is therefore difficult to isolate
the costs and benefits that should be attributed exclusively to the measures stemming
from the AAQ Directives (and this information is not available at regional or Member
State level).
In addition, and although they are based on a well-established methodology, including
peer-reviewed modelling approaches, the calculations undertaken in the support study to
estimate the social costs and benefits have several limitations, due to the need to base the
modelling on assumptions when there is uncertainty on some actual parameters (see
Annex 3 to this SWD for more details on the modelling and its limitations). Therefore,
the quantification of the impacts done for this fitness check should not be considered as
exact numbers, nor used for direct comparisons. However, the information gathered is
sufficient to draw conclusions on trends and orders of magnitude of socioeconomic costs
and benefits.
Overall, and despite the limitations presented above, the analysis underpinning this
fitness check is sufficient to formulate answers to the evaluation questions. As regards
monetized costs and benefits of air pollution, and of measures taken to improve air
quality in particular, it is unlikely that further analysis based on available data would
yield considerably different results or significantly influence the overall findings.
58 EUROSAI Joint Report on Air Quality. See section 4 of Annex 9 to this SWD.

28
5. ANALYSIS AND ANSWERS TO THE EVALUATION QUESTIONS
5.1. Relevance
Evaluation question: Do the AAQ Directives still set appropriate objectives, address
the most pressing air pollutants, and set meaningful standards to protect human
health and ecosystems in accordance with evolving scientific understanding?
Overall response: Air pollution is of high concern to citizens across the EU. The level of
concern has increased and become more acute over the past decade. This translates into a
clear and increasing expectation for policy to act where air quality is poor. Scientific
evidence of the harmful effects of the air pollutants covered by the AAQ Directives has
been further consolidated and increased (and there is robust scientific evidence that the
pollutants covered have harmful effects).
All of the air pollutants covered by the Directive continue to be relevant, as their
respective harmful effects are confirmed. Europeans continue to be exposed to
widespread and persistent excess concentrations of particulate matter, nitrogen dioxide,
benzo(a)pyrene and ozone. For other pollutants only local or occasional exceedances
have been reported over the past years: in such cases the known harmful effects still
make continuous monitoring relevant, also to ensure that no new exceedances occur. The
AAQ Directives sets upper and lower assessment thresholds, and thus offer scope to
address pollutants differently depending on their expected risk of exceedances (allowing
for a proportionate approach to monitoring and to when and where measures are taken).
The air quality standards established by the AAQ Directives for some pollutants are not
as stringent as recommended by the World Health Organization ‘Air Quality Guidelines’.
Scientific evidence points to serious adverse health effects at lower concentration levels
than set by the EU air quality standards for several air pollutants, most notably for
particular matter, sulphur dioxide, benzene and benzo(a)pyrene (and to a lesser degree
also for ground-level ozone).
This results in a dichotomy: on the one hand for a number of air pollutants the air quality
standards as set by the AAQ Directives fall short of scientific recommendations and
public expectations – while on the other hand the persistent exceedances of the current
air quality for at least one pollutant in a majority of Member States point to substantial
socio-economic and/or political challenges in reaching the objectives agreed a decade
ago.
What is the issue?
The overarching objective of the AAQ Directives is to protect citizens from the adverse
effects of air pollution and reduce it to levels which minimise harmful effects on human
health, paying particular attention to sensitive populations, and the environment as a
whole. Central to this is the establishing of common maximum concentration levels, or
air quality standards, for harmful substances in the ambient air – taking into account the
relevant guidelines and recommendations by the World Health Organization.
The AAQ Directives set air quality standards for a total of 13 air pollutants, namely for
sulphur dioxide (SO2), nitrogen dioxide (NO2) and nitrogen oxides (NOx), particulate
matter (PM10 and PM2.5), ozone, benzene, lead, carbon monoxide, arsenic, cadmium,
nickel, and benzo(a)pyrene, to be attained by 2005, 2010, 2012 or 2015, depending on

29
the pollutant. These standards take the form of limit values, target values, critical values,
alert thresholds, information thresholds or long term objectives (see Table 1 and Box 1).
But do the AAQ Directives still tackle the most pressing air pollutants, and do they do so
at the appropriate scale and at meaningful levels? Has scientific understanding evolved to
now indicate that some pollutants are more harmful, or less harmful, than understood at
the time the AAQ Directives were adopted?
What are the findings?
Air quality continues to be a major health and environmental concern to the citizens of
the EU (see stakeholder views below). This perception continues to be fully in line with
the available scientific evidence. There is an extensive and continuously expanding body
of clinical, toxicological, and epidemiological studies that conclusively document the
adverse health effects of air pollution.
The scientific evidence base available prior to the adoption of the AAQ Directives was
authoritatively summarised by the World Health Organization in its Air Quality
Guidelines from 2006 (See Box 3).59 This was an important consideration in setting the
standards, along with information on the technical feasibility of meeting different
standards, and their costs and benefits.
Box 3 – The Air Quality Guidelines by the World Health Organization
A first edition of the Air Quality Guidelines for Europe was published by the World Health
Organization in 1987. Since then, new data and developments in risk assessment methodology
have informed updates and revision of these guidelines. The most recent edition of Air Quality
Guidelines by the World Health Organization was published in 2006.60
For this most recent edition, the World Health Organization established a steering group to advise
and lead the guideline development process, and recommended experts in epidemiology,
toxicology, air quality exposure assessment, air quality management and public policy to draft
the guideline document. These were subjected to both internal and external expert review. It is
worth noting that these guidelines are not conceived as standards nor legally binding criteria.
Since 2006, the evidence base for adverse health effects related to short- and long-term exposure
to air pollutants such as particulate matter, nitrogen dioxide, and ozone has expanded further.61
Accordingly, in 2016, the World Health Organization initiated work towards the update of the
Air Quality Guidelines. This work will conclude with the provision of up-to-date
recommendations in the early 2020s.62
The scientific evidence base has evolved further, and has been reviewed periodically: in
2013, for example, the World Health Organization provided an extensive review of
evidence on health aspects of air pollution confirming their existing guidelines. That
review highlighted in particular additional evidence on the chronic impacts of particulate
59 World Health Organization (2006). ‘Air Quality Guidelines – Global Update 2005’.
60 World Health Organization (2006). ‘Air Quality Guidelines – Global update 2005’.
61 World Health Organization (2013). ‘Review of evidence on health aspects of air pollution’.
62 https://www.who.int/news-room/fact-sheets/detail/ambient-(outdoor)-air-quality-and-health

30
matter, nitrogen dioxide and ground-level ozone. Looking at the specific pollutants that
contribute to outdoor air pollution, scientific evidence has grown on the harmful effects
of the pollutants the AAQ Directives address. By contrast, no scientific evidence that any
of the pollutants covered have only a limited adverse effect has been identified. 63
It is also worth noting that, in 2013, the International Agency for Research on Cancer
classified outdoor air pollution as carcinogenic to humans.64
As for pollutants currently not covered, there is a growing body of research suggesting
the relevance of considering various components of particulate matter, such as black
carbon or ultrafine particles (see Box 4). In 2013, the World Health Organization
concluded that the scientific base at the time was too weak to lay down a guideline value
for black carbon or ultrafine particles, but that it would need to be kept under review. To
date the World Health Organization has not suggested guideline values for additional air
pollutants.
Box 4 – Ultrafine Particles
There is increasing, though limited epidemiological evidence of adverse health impacts of
ultrafine particles (smaller than 0.1 μm) in ambient air. Such particles have been found in several
organs, and recent systematic literature reviews point to short-term association with
cardiorespiratory health, including pulmonary and systemic inflammation, as well as the health of
the central nervous system. For other adverse health outcomes, the evidence on health effects
remains inconclusive or insufficient.65
To establish a correlation with illnesses is difficult due to the limited availability of specific data,
expressed in terms of numbers per cubic meter or as ultrafine particles (PM0.1), which does not
allow to conduct targeted epidemiological studies. The risk linked to such particles is however
potentially growing, due to the evidence of modern combustion engines emitting large numbers
of extremely small particles whose mass is extremely limited while their capacity to penetrate the
circulatory and nervous systems is enhanced by their size (as small as 2.5nm).
However, available data would still be insufficient to set standards: more research efforts are
needed in this area. In particular, several expert bodies have recommended to enhance the
continuous monitoring of ultrafine particle concentrations in ambient air, including in the vicinity
of major airports.66
The pollutants addressed by the AAQ Directives thus have been and continue to be
relevant substances for which concentration levels are to be regulated. Whether this has
63 World Health Organization (2013). ‘Review of evidence on health aspects of air pollution’.
64 https://www.iarc.fr/wp-content/uploads/2018/07/pr221_E.pdf (accessed 8 May 2019).
65 World Health Organization (2013). ‘Review of evidence on health aspects of air pollution’. For more
recent reviews, see for example, Ohlwein et al (2019). ‘Health effects of ultrafine particles: a
systematic literature review update of epidemiological evidence’. Int J Public Health 64(4):547-559.
Similarly, see for example, Umweltbundesamt (2018). ‘Health Effects of Ultrafine Particles’.
66 See for example: Anses (2018). ‘Polluants “émergents” dans l’air ambiant : Identification,
catégorisation et hiérarchisation de polluants actuellement non réglementés pour la surveillance de la
qualité de l’air’. Similarly, see for example, Air Quality Expert Group to the Department for
Environment, Food and Rural Affairs, Scottish Government, Welsh Government and Department of
the Environment in Northern Ireland (2018). ‘Ultrafine Particles (UFP) in the UK’.

31
been done at the levels recommended by scientific evidence in general, or by the Air
Quality Guidelines of the World Health Organization (simply referred to as the ‘WHO
Guidelines’ hereafter) in particular, depends on the respective pollutant (see Table 3).
In 2018, the European Court of Auditors emphasised that some of the air quality
standards established by the Directive 2008/50/EC ‘are much weaker than the WHO
Guidelines. Furthermore, the standards allow limits to be exceeded frequently and do not
include any short-term (i.e. daily) standard for PM2.5, a very harmful air pollutant […].
Health professionals support stricter standards in the EU […].’67
Similarly, the 2019 Special Eurobarometer on air quality68 shows that among those
respondents who have heard of EU quality standards, almost two-thirds believe that they
should be strengthened. A majority of the respondents also feels that air quality has
deteriorated in the past decade. The latter should however be understood against the
background of reported data showing that air quality has in fact improved over the last 10
years (see section 5.2). This may mean that the above public perceptions of deterioration
could stem from air quality having gained more prominence in the public debate over the
past decade, at least partly as a result of the implementation of the AAQ Directives (see
in particular section 5.6).
It should be kept in mind that the WHO Guidelines are not conceived as standards nor
legally binding criteria. They are designed to offer guidance based on expert evaluation
of scientific evidence that can be used by regulatory authorities as a basis for setting
standards, taking into account local socio-political and economic conditions and
prevailing ambient concentrations of air pollutants.69,70 Scientific guidelines have to be
considered also against this context.
Nevertheless, modelling analysis projects that with full implementation of the relevant
acquis, and the Directive on the reduction of national emissions of certain atmospheric
pollutants71 in particular, the share of EU population exposed to fine particulate matter
(PM2.5) concentrations over the WHO Guidelines value would decrease from 88% in
2005 to 13% by 2030 (see Clean Air Outlook, as summarised in Annex 8 of this SWD).
This puts the EU on a trajectory towards reaching levels as recommended by the WHO
for fine particulate matter in large parts of the EU in a ten year perspective.
However, it should be noted that this EU-level result hides disparities in pollutants
concentrations, across and within Member States, leading to some regions in the EU still
67 European Court of Auditors Special Report on Air Pollution. See section 1 of Annex 9 to this SWD.
Note that the WHO Guidelines make reference to both annual mean and daily mean concentrations of
PM2.5; EU air quality standards set a limit value for annual mean concentration only.
68 See Section 2 of Annex 10 to this SWD.
69 World Health Organization Regional Office for Europe (2017). ‘Evolution of WHO air quality
guidelines: past, present and future’.
70 Note that public interventions, which aim at improving social welfare, depend not only on budgetary
constraints but also on the various historical, geographical and social contexts in which they take
place. Any public intervention decision necessarily reflects potential tensions between various priority
interests (environment, health, but also employment, education etc.) of different societal actors.
71 Directive (EU) 2016/2284 on the reduction of national emissions of certain atmospheric pollutants.

32
overpassing the WHO Guidelines values in the 2030 modelling results (including
Northern Italy and Southern Poland). In these cases measures are deemed technically
feasible but not cost-effective under current economic and political assumptions, in turn
leading to a situation where the WHO Guidelines would not be reached even in a 2030
projection without significant additional effort.
It is also worth stressing that, consistent with the principle established in Article 193 of
the Treaty on the Functioning of the European Union, the AAQ Directives do not prevent
Member States to set more stringent standards in national legislation – as is the case, for
example, in Austria (for particulate matter (PM10) and nitrogen dioxide), the United
Kingdom (for ozone) or Sweden (most notably for nitrogen dioxide).
Table 3 compares EU air quality standards with the WHO Guidelines and the standards
in place in other OECD countries. This shows alignment with WHO Guidelines in some
cases (such as for nitrogen dioxide) and large differences in other cases (such as for
sulphur dioxide). For fine particulate matter, the EU air quality standards are also above
those set in other OECD countries, while for most other pollutants EU levels are within
the range established in other OECD countries (i.e. higher than in some, lower than in
others).
Table 3 – Comparison of EU air quality standards with WHO Guidelines and standards
applicable in other OECD countries (*) Pollutant WHO
Guidelines
EU air quality
standards
‘Permitted’
exceedances
Selected standards applicable in
other OECD countries (**)
PM10
(annual LV)
20 µg/m3 40 µg/m3 - AU: 25; CH:20; NO:25
PM10
(daily LV)
50 µg/m3 50 µg/m3 (35 days a year) AU: 50; CH: 50 (3d); NO: 30 (30d)
NZ: 50 (1d); US: 150 (1d)
PM2.5
(annual LV)
10 µg/m3 25 µg/m3 - AU: 8; CH: 10; CA: 10; JP: 15;
NO: 15; US: 12
PM2.5
(daily LV)
25 µg/m3 - - AU: 25; CA: 28; JP: 35 (2%);
US: 35 (2%)
NO2
(annual LV)
40 µg/m3 40 µg/m3 - AU: 57; CA: 32; CH: 30;
NO: 40; US: 101
NO2
(hourly LV)
200 µg/m3 200 µg/m3 (18 hours a year) AU: 230; CA: 115; NO: 200 (18h);
NZ: 200 (9h); US: 191 (2%)
SO2
(daily LV)
20 µg/m3 125 µg/m3 (3 days a year) AU: 213 (1d); CH:100 (1d); JP: 107
NO: 125 (3d)
SO2
(hourly LV)
500 µg/m3
(for 10 min)
350 µg/m3 (24 hours a year) AU: 532 (1d); JP: 266; NO: 350
(24h); NZ: 350 (9h); US: 200 (1%)
O3
(8-hour TV)
100 µg/m3 120 µg/m3 (75 days in
3 years)
CA: 126; US: 140
(*) Cells shaded in grey and using red font highlight where EU air quality standards diverge from WHO Guidelines.
Acronyms used in this table: LV (limit value), TV (target value). Note: where standards applicable in selected other
OECD countries have been established as ‘ppb (parts per billion)’, this has been converted to µg/m3 for this table
(**) Values in parentheses in this column denote the number of ‘permitted’ exceedances above the noted standard:
AU (Australia): Standards and Goal established under National Environment Protection (Ambient Air Quality)
Measure, status of 25 February 2016, see https://www.legislation.gov.au/Details/F2016C00215
CA (Canada): Canadian Ambient Air Quality Standards (CAAQS) established under the Canadian Environmental
Protection Act, see http://airquality-qualitedelair.ccme.ca/en/
CH (Switzerland): ‚Luftreinhalte-Verordnung (vom 16 Dezember 1985, inklusive Änderung vom 11. April 2018)’,
see https://www.admin.ch/opc/de/classified-compilation/19850321/index.html
JP (Japan): Environmental Quality Standards in Japan – Air Quality. http://www.env.go.jp/en/air/aq/aq.html
NO (Norway): ‘Grenseverdier for tiltak’, as established in ‘forskrift om begrensning av forurensning’ see
https://lovdata.no/dokument/SF/forskrift/2004-06-01-931 (see Del 3)
NZ (New Zealand): Ambient air quality standards for contaminants under Resource Management (National

33
Pollutant WHO
Guidelines
EU air quality
standards
‘Permitted’
exceedances
Selected standards applicable in
other OECD countries (**)
Environmental Standards for Air Quality) Regulations 2004 (SR 2004/309), see
http://www.legislation.govt.nz/regulation/public/2004/0309/latest/DLM287036.html
US (United States of America): National Ambient Air Quality Standards (NAAQS) set by the Environmental
Protection Agency under the Clean Air Act, see https://www.epa.gov/criteria-air-pollutants/naaqs-table
For particulate matter (PM10), the EU annual limit value is set at twice the level
recommended by the WHO Guidelines (i.e. 40 µg/m3 versus 20 µg/m3). Meanwhile, for
the EU daily limit value, the AAQ Directives followed the WHO Guidelines (i.e. 50
µg/m3), however allowing for up to 35 days of exceedances per year having in mind
specific local geographical and/or meteorological conditions.
For fine particulate matter (PM2.5), the scientific conclusions of the WHO Guidelines on
the evidence for a causal link between PM2.5 and adverse health outcomes in humans
have been strengthened since the adoption of the AAQ Directives. At the time, however,
the AAQ Directives did not follow the WHO Guidelines as regards the annual limit value
(25 µg/m3 versus 10 µg/m3). Furthermore, the AAQ Directives did not establish a daily
limit value for fine particulate matter, whereas the WHO Guidelines here recommend 25
µg/m3. The AAQ Directives also established an exposure reduction target according to
which Member States need to secure a relative reduction depending on their starting
levels, and which calls for all appropriate measures to be taken to limit average exposure
to below a maximum of 18 µg/m3 by 2020.
For nitrogen dioxide (NO2),72 the limit values set by the AAQ Directives align with the
WHO Guidelines (even though the hourly limit value may be exceeded in up to 18 hours
per year). In 2013, an extensive World Health Organization review noted that ‘more
studies have now been published, showing associations between long-term exposure to
NO2 and mortality and morbidity’ and that ‘both short- and long-term studies have found
these associations with adverse effects at concentrations that were at or below the
current EU limit values’. While this review noted that there is scientific debate as to the
degree to which adverse effects are due to nitrogen dioxide per se (as the adverse effects
may be indicative of other traffic-related pollutants) it explicitly ‘suggests that
consideration should be given to lowering the WHO Guideline’.73
For ground-level ozone (O3),74 the EU air quality standards for maximum daily 8-hour
mean concentrations is close to the WHO Guidelines (120 µg/m3 versus 100 µg/m3), but
this target value may be exceeded on no more than 25 days per year (averaged over three
years). The long-term objective is to not exceed this level at all.
72 Nitric oxide (NO) and nitrogen dioxide (NO2) are together referred to as nitrogen oxides (NOX).
73 World Health Organization (2013). ‘Review of evidence on health aspects of air pollution’. See
question C2: ‘Is there any new evidence on the health effects of NO2 that impact upon the current limit
values? Are long-term or short-term limit values justified on the grounds that NO2 affects human
health directly, or is it linked to other co-emitted pollutants for which NO2 is an indicator substance?’
74 Tropospheric (ground-level) ozone is a secondary pollutant, which is not directly emitted into the
atmosphere, but is formed (and removed) via chemical reactions in the presence of sunlight, and
natural and anthropogenic precursor gases (mainly nitrogen oxides (NOx) from vehicle and industry
emissions and volatile organic compounds (VOCs) emitted by vehicles, solvents and industry). As a
result, the highest levels of ozone pollution occur during periods of sunny weather. At the continental
scale, methane (CH4) and carbon monoxide (CO) also play a role in ozone formation. See also EEA
Report 12/2018, ‘Air quality in Europe – 2018 report’ for further details on ozone.

34
For sulphur dioxide (SO2), the daily limit value set by the AAQ Directives (125 µg/m3)
is considerably less stringent than the WHO Guidelines (20 µg/m3). The hourly limit
value established by the AAQ Directives is closer to the WHO Guidelines for 10 minute
periods (500 µg/m3 versus 350 µg/m3).
For both lead and cadmium, the annual limit value, and target value respectively
established by the AAQ Directives are fully aligned with the standards recommended by
the WHO Guidelines, at 0.5 µg/m3 and 5 ng/m3, respectively. Also for carbon monoxide,
the maximum daily 8-hour mean limit value of 10 mg//m3 matches the WHO Guidelines:
however, at EU level there is no air quality standard for one hour, which the WHO
Guidelines recommend to set at 30 mg/m3.
For several other pollutants, the World Health Organization did not put forward Air
Quality Guidelines as such, but did provide estimated reference levels based on excess
lifetime cancer risk of 1 in 100 000. For arsenic and nickel, the respective annual target
values of 6 ng/m3 and 25 ng/m3 are close to the respective reference levels at 6.6 ng/m3
and 20 ng/m3. For benzene, there is a somewhat larger discrepancy, with an annual limit
value at 5 µg/m3 three times higher than the reference level at 1.7 µg/m3. For
benzo(a)pyrene this discrepancy is even larger with an annual target value at 1 ng/m3 and
a reference level at 0.12 ng/m3.
Generally speaking, over the past decade, there has been a downward trend for all air
pollutants for which the AAQ Directives have established environmental objectives (i.e.
EU air quality standards). Nevertheless, exceedances continue to be widespread and
frequent, for particulate matter, nitrogen oxides, ozone and benzo(a)pyrene. For other
pollutants exceedances tend to be rare or isolated occurrences.75
This does not mean, however, that monitoring or achieving the standards set for these
pollutants is no longer relevant: the health risks remain, and when and where
exceedances occur, these need to be addressed. It can be argued that it is sufficient to
keep these pollutants ‘under observation’. The AAQ Directives already provide a
mechanism for such a proportionate approach, whereby pollutants that are expected to be
below well-defined assessment thresholds, can be covered by less extensive monitoring
regimes (see, for example, Article 6 and Annex V in Directive 2008/50/EC).
While the AAQ Directives provide a degree of flexibility in relation to amending non-
essential elements of the Directives (which explicitly excludes the possibility to change
air quality standards as such), there are no specific mechanisms in the Directives laying
down an obligation to carry out a periodic review of the Directives with a view of
adapting them to the latest technical and scientific progress. Additional pollutants or
more stringent air quality standards can only be added by the co-legislators.
Finally, Box 5 points to a number of provisions of the AAQ Directives that have become
redundant since 2008. However, none of these directly affect the implementation of the
AAQ Directives in their current form.
75 For the year 2017, reported data refers to exceedances for arsenic only at six sampling points across
the EU, for cadmium at two sampling points, for nickel at four sampling points, for carbon monoxide
at one sampling point, for benzene at three sampling points, and no exceedances for lead. See also
EEA Report 10/2019. ‘Air quality in Europe – 2019 report’ for further details.

35
Box 5 - Provisions of the AAQ Directives that have become redundant
There are a number of provisions of the AAQ Directives that have become redundant over time.
This is the case with the provisions that contain a temporal component, prescribing the starting or
the ending date of an obligation. In the meantime, they either have been exhausted or have lost
relevance:
• Article 22, in connection with Annex XV, section B, of Directive 2008/50/EC, related to the
postponement of attainment deadlines by up to five years and the exception from the
obligation to apply certain limit values until June 2011.
• Article 32 of Directive 2008/50/EC, obliging the Commission to review in 2013 provisions
related to PM2.5 and, as appropriate, other pollutants. This 2013 review has occurred.
• Article 8 of Directive 2004/107/EC requiring the Commission to report by the end of 2010 on
the experience with the Directive. A corresponding analysis has been prepared as part of the
air policy review initiated in 2011.76
• Several provisions of Directive 2008/50/EC refer to margins of tolerance (allowed
exceedances of limit values expressed in percentages) that were applicable until a certain date
(e.g. until 1 January 2010 for nitrogen dioxide).
Views of stakeholders77
Air quality continues to be a major health and environmental concern to the citizens of
the EU. Respondents to a Eurobarometer survey in 2017 (with more than 27 000
respondents) highlighted ‘air pollution’ as one of the two most important environmental
issues, with 46% including this issue in their response (the other being ‘climate change’,
named by 51%).78
Similarly, a large majority of respondents to the open public consultation carried out in in
the context of this fitness check (489 respondents), noted that, in their view, air pollution
poses a concern to public health (94%) and the environment (88%) to a large or a very
large extent. And an even higher number of respondents (95%) considered defining and
establishing of common EU standards to be important or very important.
The open public consultation also indicates that all the pollutants currently regulated by
the AAQ Directives remain relevant. The largest agreement was on the importance of
addressing nitrogen dioxide (94%) and fine particulate matter (93%). Stakeholders
highlight that the evidence about the health impacts of all the pollutants addressed by the
AAQ Directives has further developed over the last 10 years and, as a result, there is no
reason for EU law to stop regulating any of the pollutants currently addressed. One NGO
suggested that SO2 is no longer relevant due to the implementation of stricter coal
76 SEC(2011)342. ‘Implementation of EU Air Quality Policy and preparing for its comprehensive
review’; see also underpinning analysis provided jointly by Environment Agency Austria,
Ricardo-AEA, and TNO (2013) ‘Review of the Air Quality Directive and the 4th Daughter Directive’.
77 For an overview of the stakeholder feedback, and details on views expressed by different stakeholder
groups in the open consultation, please also see Annex 2 to this SWD.
78 European Commission (2017). Special Eurobarometer 468: ‘Attitudes of European citizens towards
the environment’. In nine Member States ‘air pollution’ topped the list of environmental issues named,
namely in Malta, Bulgaria, Belgium, Poland, Greece, Croatia, Romania, Italy and France.

36
combustion standards. Another respondent noted that there is no need to monitor lead,
nickel and carbon monoxide as frequently anymore.
Approximately 24% of the respondents to the open public consultation found the air
quality standards of the AAQ Directives to be set at appropriate levels, while 61% found
the standards either much too lenient (27%) or somewhat too lenient (34%). In contrast,
only 9% found the standards too strict (8%) or far too strict (1%). The findings of the
targeted questionnaire paint a similar picture.
A large share of stakeholders interviewed highlighted the need to reflect the most recent
scientific evidence on the harmful effects of air pollution and sharpen the current
standards at least to the levels recommended by the WHO Guidelines. In particular,
NGOs focussed on environment and health, but also stakeholders from a science and
research background, expressed concerns that the current standards do not sufficiently
protect from the adverse impacts of air pollution. Similar views have been explicitly
stressed by the European Parliament which ‘urges the Commission and the Member
States to assess and review air quality policies only on the basis of robust, up-to-date,
independent and peer-reviewed scientific evidence’.79
Conversely, a number of stakeholders also highlighted the issue of economic viability of
following scientific advice. Several national and regional authorities cautioned that more
stringent air quality standards might create unrealistic challenges for those Member
States that do not yet meet the current air quality standards. Similarly, industry
associations highlighted the importance of air quality standards requirements to be
cost-effective, reachable by the industry with available technologies, and in line with the
Best Available Techniques (BAT), as defined in the Industrial Emissions Directive. The
above also called for more time and flexibility to reach current air quality standards.
The continuing exceedances of EU air quality standards have led a small number of
stakeholders to question the ambition level of the AAQ Directives, arguing that some
limit values may be disproportionately strict compared to expected impacts of
exceedances. In particular, in the German public debate, the nitrogen dioxide limit values
have been questioned by some: in response, the German National Academy of Sciences
has, in April 2019, offered an opinion reasserting that both nitrogen dioxide and fine
particulate matter exceedances remain problematic (noting also that, from a scientific
perspective, a further tightening of the nitrogen dioxide limit values is not urgent).80
In their feedback to the targeted questionnaire (43 responses in total, see Annex 2),
several stakeholders reflected in their comments on specific air quality standards. One
industry association indicated that the daily limit values for PM10 were too stringent.
Another industry association suggested increased focus should be given on average
population exposure rather than standards; this view was shared by one research
organisation. Other respondents noted that the short-term and annual PM10 and PM2.5 data
are highly correlated, which could improve the efficiency of the monitoring system. One
regional authority suggested that, due to the problems large cities have with compliance
79 European Parliament resolution on ‘A Europe that protects: Clean air for all’. See also Section 5 of
Annex 9 to this SWD.
80 Nationale Akademie der Wissenschaften Leopoldina (2019): Saubere Luft. Stickstoffoxide und
Feinstaub in der Atemluft: Grundlagen und Empfehlungen.

37
with the air quality standards, different thresholds should apply for urban areas (see also
Box 6).
Box 6 – REFIT Platform Opinion on adapting limit values to population density
In March 2018, the REFIT Platform considered submissions by the House of Dutch Provinces for
Better Regulation which suggested a simplification of the Ambient Air Quality Directive by
which provinces and other subnational authorities would be given more possibilities for solving
the problems by taking the objectives of the regulations into account, rather than having to
strictly comply with the rules. The REFIT Platform’s Stakeholder Group disagreed with the
submitter’s suggestion to adapt air quality limits according to the amount of population and
establish different thresholds depending on the area (e.g. residential versus low populated) and its
degree of population. The Stakeholder group considers that air quality limits should remain the
same across the entire EU territory, to protect all EU citizens and that current EU rules provide
enough flexibility to national and local authorities as to the correct measures to be adopted to
meet existing limits. The Stakeholder group recalls that the European directive seeks to establish
minimum limits for human health, requiring one standard methodology, as such seeking
differentiation or adaptation according the population density is not possible.81
Conversely, one NGO specifically noted that, contrary to the limit values, other types of
air quality standards (such as the target values, or the national exposure reduction target)
do not provide certainty to the public. It argued that several flexibilities, inherent to these
standards, and the ability of Member States to balance the protection of health and the
environment with other factors (such as the costs of measures), significantly weaken the
ability of these obligations to deliver improvements of air quality.
Regarding pollutants which are not addressed by the AAQ Directives, but would warrant
future consideration, open public consultation respondents were given an open text field
and were able to name multiple pollutants in their answers. Among the 237 responses to
this question, the most commonly cited additional pollutants were ultrafine particles (96
responses), black carbon (70 responses) and ammonia (45 responses). Also, several
NGOs, research organisations and public authorities suggest including one or several of
the above pollutants into the scope of air quality policy, and expand related monitoring.
81 https://ec.europa.eu/info/sites/info/files/recommendation-ix-5-a_air-quality-directive_en.pdf
38
5.2. Effectiveness
Evaluation question: To what degree have the AAQ Directives acted as an incentive
to implement effective measures to improve air quality, reach the EU air quality
standards and thus reduce the adverse impacts of air pollution?
Overall response: Over the past decade, the AAQ Directives have been only partially
effective in achieving their overall objectives of reducing air pollution and curbing its
adverse effects. While they have guided the monitoring of air quality, set clear air quality
standards, and facilitated the exchange of information on air quality, they have not
ensured that sufficient action is taken throughout the EU to meet air quality standards and
keep exceedances as short as possible, resulting in a mixed picture.
On the one hand, air quality has improved and the share of air quality zones across the
EU that report exceedances of limit values or targets values, have declined significantly
for several pollutants. Both the number and magnitude of exceedances have decreased for
most pollutants and in most Member States. As a result, also the share of urban
population exposed to air pollution above EU air quality standards is lower now than a
decade ago, with exposure to particulate matter amounting to half of what it was in 2008.
On the other hand, persistent and widespread exceedances still continue for particulate
matter, nitrogen dioxide, ozone and benzo(a)pyrene.82 Air quality plans and their
implementation, in several instances, have not lived up to the requirement to keep
exceedance periods as short as possible and secure effective compliance. The European
Commission has responded to these shortcomings, including through enforcement action,
initiating infringement procedures against 20 Member States not only to address
exceedances, but also because it regarded the measures taken to be insufficient.
Although air quality has improved over the past decade, exceedance periods have not
been kept as short as possible in all instances. This indicates that the AAQ Directives
have been at least partially effective in achieving the EU air quality standards and thus
reducing the impacts of air pollution. It is moreover evident that where improvements
have occurred, they have at least in part been incentivised by the requirements to meet
EU air quality standards, and to put in place plans and measures. However, it remains
that the AAQ Directives have not been fully effective as EU air quality standards are still
not being met in many Member States.
What is the issue?
The AAQ Directives’ overall aim is to reduce air pollution and the harmful effects on
human health and the environment. Practically this translates into a string of more
specific objectives upon which the effective implementation of both AAQ Directives
depends – this is outlined in detail in the intervention logic presented in section 2.1.
In short, effective implementation of the AAQ Directives is thus expected to ensure the
setting up and maintenance of a representative and high quality network for the
monitoring and assessment of air quality in all EU Member States. This network needs to
make available reliable, objective and comparable information on air quality across the
82 See, in particular, Figure 8, Section 3.2 and Annex 7 to this SWD.

39
EU as a basis for taking coherent action to avoid, prevent or reduce the adverse effects of
poor air quality (see section 5.3 for a discussion about its effectiveness and efficiency).
In line with the overall purpose of the AAQ Directives to avoid, prevent or reduce
harmful effects of air pollution and achieve good air quality, the ultimate metric of their
success will be whether EU air quality standards have been met, or not (see section 2.3).
Simply put, full compliance would translate into full effectiveness. This has not been
achieved, and is well-documented (see also section 3.2 and Annex 7 for an overview).
It is thus meaningful to also assess whether and by how much the number and magnitude
of the remaining exceedance situations have decreased. This can provide a metric of
partial effectiveness, and allow an assessment of progress towards the AAQ Directives
overall aim to avoid, prevent or reduce harmful effects of air pollution. It is therefore
methodologically relevant to also take into account the overall reductions in population
exposed to air pollution over the AAQ Directives implementation period.
What are the findings?
The AAQ Directives provide an approach to manage air quality across the EU. This
builds on four main strands of intervention by which (1) air quality is monitored based on
common methods, (2) agreed air quality standards provide benchmarks to achieve,
(3) information on air quality is reported and communicated, and (4) action is taken to
improve air quality if, when and where it does not meet agreed air quality standards.
The AAQ Directives have arguably successfully guided the monitoring of air quality (see
sections 3.1 and 5.3), established clear air quality standards (see sections 2.3 and 5.1),
and facilitated the exchange of information on air quality (see sections 3.4 and 5.3).
However, they have not fully ensured that sufficient action is taken to meet air quality
standards and keep exceedances as short as possible throughout the EU.
As a result, the present picture is mixed, with persistent and widespread exceedances still
being prevalent in many Member States. Substantial exceedances continue in up to 20
Member States, depending on the air pollutant (this included, in 2017, reported
exceedances of nitrogen dioxide in 17 Member States; particulate matter (PM10 or PM2.5)
in 15 Member States; ozone in 13 Member States;83 benzo(a)pyrene in 12 Member States;
arsenic and nickel in 4 Member States each; sulphur dioxide, cadmium and benzene in 2
Member States each; and carbon monoxide in 1 Member State).84,85
At the same time, reported air quality data shows that the number and magnitude of
exceedances of EU limit values and target values have significantly decreased over time
for most pollutants. Generally, both the number of Member States experiencing
exceedances as well as the share of air quality zones reporting exceedances have
decreased since the AAQ Directives have been adopted (Figure 8).
83 It is also worth noting that exceedances reported for ozone vary significantly from year to year, as this
pollutant is particularly sensitive to changes in meteorological conditions.
84 COM(2019)149. ‘Environmental Implementation Review 2019’; and air quality data as provided via
the EEA Air Quality Portal. See also Section 3.2 and Annex 7 to this SWD.
85 Also see Section 3.2 and Annex 7 to this SWD for a comparison of situation in 2008 and 2017.

40
Note that for fine particulate matter (PM2.5) there had been an increase in the share of
zones that reported exceedances in the initial years of the 2008 to 2018 evaluation period,
especially in the first three years. During the same period, the monitoring network for
PM2.5 was expanded in line with the requirements of Directive 2008/50/EC, thus adding
almost 1 000 additional sampling points since 2008 (see Table 2). Since 2015, the year in
which the limit value for PM2.5 entered into force, there has been a clear downward trend.
Figure 8 – Share of zones with exceedances above EU target/limit values, 2008 to 201786
Looking in more detail at specific pollutants, a more complex picture unfolds. In
particular, the trends for particulate matter and nitrogen dioxide are illustrative here, not
least as these are the two pollutants for which persistent and widespread exceedances
above the limit value prevailed after their respective dates of becoming binding. This has
triggered a number of infringement cases by the European Commission focussed on these
two pollutants (see Section 3.5 and Annex 6 of the SWD for an overview).
Overall reductions in these two pollutant concentrations had a positive impact on the
share of urban population exposed to air pollution above limit values and target values.
This exposure is lower now than a decade ago: For particulate matter (PM10), this share
has almost halved, from 23.9% in 2008; at the same time for nitrogen dioxide (NO2) this
share has decreased from 12.3% in 2008 to 7.3% in 2016. See Annex 7 to this SWD.
For particulate matter (PM10), the number of zones with exceedances has more than
halved between 2008 and 2017, and the number and magnitude of the remaining
exceedances has been reduced. The highest annual average concentrations reported has
decreased in all but two Member States between 2008 and 2017, and on average this
decline has been one of more than 20%. The highest reported levels were 99 µg/m3 in
2008 and 64 µg/m3 in 2017. Similarly, exceedances above the daily limit value have
declined.87
86 Based on annual ETC Technical Papers on ‘Reporting on ambient air quality assessment in the EU
Member States’ for 2008 to 2012 (see https://acm.eionet.europa.eu/reports/#tp), and on data by
Member States via e-reporting for 2013 to 2017 (see http://aideg.apps.eea.europa.eu).
87 For a comparison between 2008 and 2017 per Member State for PM10, see Section 3.2 and Annex 7 to
this SWD.

41
In several cases, air quality measures taken have resulted in compliance, in particular in
Western Europe.88 A range of air quality measures have contributed to this success,
including the successful reduction of particulate matter emissions from transport due to
the use of diesel particle filters, and the use of urban vehicle access restrictions (see Box
7). Where exceedances remain, especially in Eastern Europe and Northern Italy, they
relate primarily to emissions from the energy sector and often residential heating, as well
as from transport.
Box 7 – Case Study Berlin: Urban Vehicle Access Regulations
Urban Vehicle Access Regulations have, in a majority of cases, been established as Low
Emission Zones that primarily aim at improving air quality. Evidence suggests that they have
successfully lowered local transport emissions in several cases, notably of particulate matter.89
For example, according to the Berlin air quality plan, the existing Low Emission Zone in Berlin
reduced the local increment to this pollutant from engines from 11% to 4%.90
Also for nitrogen dioxide (NO2) widespread exceedances prevail, with exceedances in
more than 130 cities in 2017. At the same time, the number and magnitude of
exceedances has been reduced. In 2008, 21 Member States reported annual average
concentrations above the EU air quality standards, five of which with levels at above
double the limit value (and even levels of 115 µg/m3 and 106 µg/m3 at sampling points in
the United Kingdom and Germany, respectively). In 2017, still 17 Member States
reported exceedances, even if the maximum levels decreased in most cases.91
Despite some progress made, this indicates that the measures taken by Member States to
date have been insufficient. This is the case for most urban areas across the EU, and the
highest levels are reported for London, Paris, Turin, Munich and Athens. Air quality
plans point to a number of measures to reduce NOx emissions in cities, in particular from
road transport, including by improving public transport options or promoting a modal
shift. However, the resulting emission reductions have been partially offset by increased
transport demand and a high proportion of high emitting diesel vehicles in the fleet due to
Euro 5 and early Euro 6 vehicles having high emissions in real driving, which reduced
the effectiveness of scrapping schemes and low emissions zones.
Where, in given zones or agglomerations, the levels of pollutants in ambient air exceed
any limit value or target value, Member States, including regions and municipalities,
shall ensure that air quality plans are established, and where limit values are exceeded
measures are to be taken to keep exceedance periods as short as possible. In line with the
subsidiarity principle, the AAQ Directives give flexibility to Member States to apply
those measures that best fit their local conditions. While additional measures to improve
air quality may also result from other EU legislation (see section 5.5) as well as from
88 For instance, the number of zones in exceedance in Belgium has decreased from nine in 2008 to none
in 2017.
89 EEA Report 24/2018. ‘Europe’s urban air quality’. See also the support study informing this Fitness
Check, Appendix I; see also Annex 9 to this SWD.
90 When comparing source apportionment results before and after the introduction of the LEZ; see
Entwurf Luftreinhalteplan für Berlin (2 Fortschreibung, Stand 15 April 2019).
91 For a comparison between 2008 and 2017 per Member State for NO2, see Section 3.2 and Annex 7 to
this SWD.

42
other Member State actions, the choice of measures primarily lies with the competent
national authorities.
The air quality plans, and the air quality measures they mandate, are reported to the
European Environment Agency. Looking at the reporting period from 2013 to 2016 (i.e.
the period for which air quality plans and measures have been reported in accordance
with the requirements of Implementing Decision 2011/850/EU), most measures reported
focus on emissions from the transport, energy and industry sectors (as these tend to be
the main sources of pollution for particulate matter and/or nitrogen dioxide).
The effectiveness of any air quality plan depends strongly on the political commitment
and coordination between levels of government. The ultimate test for the success of a
plan is whether the measures implemented have led to reductions in the concentration
levels of the air pollutants targeted, and indeed kept the exceedance period as short as
possible (which needs to be determined on a case by case basis).92 And, against the metric
of reduced concentration levels (and reduced exposure to concentration levels above EU
air quality standards), there have been both successes and shortcomings, as illustrated
above.
The European Court of Auditors93 indicated that the insufficient quality of air quality
plans in Member States, and the lack of requirements for Member States to report on the
implementation and performance of these plans, means that they generally do not provide
appropriate information about the real impact of measures taken. The European Court of
Auditors points to three reasons that, in their view, compromise the effectiveness of air
quality plans: (a) they were not sufficiently targeted and could not be implemented
quickly enough for the areas with highest concentration levels, (b) they could not deliver
results in the short term because they went beyond the powers of the local authorities
responsible for implementing them, or because they were designed for the long-term, and
(c) they were not supported by cost estimates or were not funded.
It is worth noting that by their very definition, air quality plans require time. In
accordance with the provisions of Directive 2008/50/EC, air quality plans shall be
communicated no later than two years after the end of the year the first exceedance was
observed (even if Member States can choose to accelerate this). This in itself carries the
risk that up to three years can pass, before necessary measures are actually taken. And the
measures themselves, especially where they address large scale infrastructure
development, can take even longer than this to show effect. These considerations need to
be carefully factored in by the competent authorities in order to ensure exceedance
periods are kept as short as possible, and not delayed unduly.
The AAQ Directives offered the possibility for the so-called time extensions (in
accordance with Article 22 of Directive 2008/50/EC). Several Member States have made
use of the opportunity to apply for a time extension to comply with particulate matter and
nitrogen dioxide limit values. While time extension for particulate matter tend to have
resulted in an above-average rate of air quality improvements in these zones, time
extensions for nitrogen dioxide did not (mainly as vehicle emissions did not decrease as
92 Note that Article 23 and Annex XV of Directive 2008/50/EC explicitly require air quality plans
developed to keep exceedance periods a short as possible to include an ‘estimate of the improvement of
air quality planned and of the expected time required’.
93 European Court of Auditors Special Report on Air Pollution. See section 1 of Annex 9 to this SWD.

43
planned during the time extension period, and the higher than expected emissions from
diesel vehicles was not sufficiently compensated for in the relevant local air quality
plans).
Furthermore, Directive 2008/50/EC provides the option to deduct contributions from
natural sources, i.e. emissions of pollutants not caused directly or indirectly by human
activities, including natural events such as volcanic eruptions, seismic activities,
geothermal activities, wild-land fires, high-wind events, sea spray or the atmospheric re-
suspension or transport of natural particles from dry regions (see Box 8). In addition,
deductions for winter-sanding and -salting are explicitly warranted by this Directive: for
the year 2017, two Member States made use of this possibility in seven instances.
Box 8 – Subtraction of contributions from natural sources
The subtraction of exceedances of particulate matter attributable to natural sources is guided by
six key principles laid out in a dedicated guideline document.94 For the year 2008, eleven
Member States made use of the provision to subtract contributions to particulate matter
exceedances from natural sources.95 For the year 2017, six Member States did so in 37 instances:
in 17 instances (in six Member States) this changed the compliance status, where as in 20
instances (in four Member States) it did not.96 The main natural sources cited were ‘transport of
natural particles from dry regions outside the Member State’ (i.e. Saharan dust), followed by sea
spray and wild-land fires. The contributions of natural sources to the annual mean concentrations
of particulate matter were estimated in the range of between 1 and 5 µg/m3, and in some cases as
high as 13 µg/m3 (due to Saharan dust).
Having said this, the available air quality data for the period 2008 to 2017 shows that
exceedance occurrences have generally decreased for all pollutants. Many air quality
zones have either improved air quality or reached compliance with EU air quality
standards during the assessment period for most pollutants. This does indicate that the
AAQ Directives have been at least partially effective in reaching their objectives.
Views of stakeholders97
Stakeholders largely consider that the AAQ Directives have been effective in establishing
common EU air quality standards (with more than 70% agreeing or completely agreeing
with this in the open public consultation). Also, responses to the targeted questionnaire
survey rated ‘the extent to which the established standards of air quality to achieve across
the EU has been achieved’ positively. Respondents considered that establishing of
common standards and associated framework provide a ‘push’ to improve air quality, by
urging authorities to act: a view that was also expressed by most of the local and regional
authorities that provided feedback to the stakeholder consultation (Box 9).
94 SEC(2011)208. ‘Guidelines for demonstration and subtraction of exceedances attributable to natural
sources under the Directive 2008/50/EC’.
95 Based on EEA Technical Report 10/2012. ‘Particulate matter from natural sources and related
reporting under the EU Air Quality Directive in 2008 and 2009’.
96 http://aideg.apps.eea.europa.eu
97 For an overview of the stakeholder feedback, and details of views of expressed by different
stakeholder groups in the open consultation, please also see Annex 2 to this SWD.

44
In particular, the mandatory nature of the air quality standards, and their enforcement by
the European Commission, has been identified by stakeholders as a key factor that
contributed to better air quality (44% of respondents to the open public consultation
expressed a view that ‘ambition and stringency of the standards established’ were
contributing to air quality improvements to a very large or large extent – compared with
21% who indicated them to be contributing very little or not at all). While the importance
of these factors is acknowledged by a proportion of the respondents, this view is not
unanimous. It is in particular noticeable that the perceptions on enforcement action (see
Annex 6 to this SWD for an overview of infringement cases) and cooperation are highly
varied, indicating different experiences and perceptions.
Box 9 – Perspectives of local and regional authorities
To inform this fitness check, detailed responses to the targeted questionnaire or ad-hoc
contributions were received from 11 local or regional authorities (see Annex 2 to this SWD).
These mostly consider that the AAQ Directives have been instrumental in driving air quality
improvements, including through binding limit values and the possibility of legal action.
A key reason identified by local and regional authorities for not achieving compliance throughout
the EU is a lack of coordination between governance levels, and a suboptimal allocation of
responsibilities between them. Another reason referred to are shortcomings in policy coordination
at EU level, such as with climate policies or with regulation of pollutant emissions at source.
Several local and regional authorities emphasise the need to adapt to local conditions. The AAQ
Directives’ provisions on air quality monitoring are praised as ensuring comparable, high quality
information on air quality across the EU, with some room for improvement on specifying
assessment and monitoring requirements (while accounting for local practical needs).
While the responses to the open public consultation indicated that stakeholders
considered the AAQ Directives to be effective in triggering a need and urgency for air
quality improvements, respondents seem somewhat critical about the effectiveness of the
AAQ Directives to actually facilitate coherent action to avoid, prevent, or reduce the
effect of poor air quality: less than half of the respondents agreed that the AAQ
Directives have been effective in achieving this output. Several industry stakeholders
expressed the view that the air quality standards were not always fully actionable.
Reasons named for this lingering dissatisfaction include the continued exceedances of the
target and limit values, as well as the pace of EU-level enforcement actions. In particular
the air quality plans and measures mandated by the AAQ Directives received mixed
feedback in the feedback to the targeted questionnaire (43 responses in total, see Annex 2
to this SWD). On the one hand, several stakeholders (including both NGOs and some
national authorities) were positive about the provisions on air quality plans in the AAQ
Directives. On the other hand, others explicitly flagged limitations in these provisions,
including: the issue of timing when air quality plans are required and drawn up (one
national authority and two NGOs), ambiguity of air quality plans (one scientific
institution and one NGO), and the ineffectiveness of these plans (one national authority
and one NGO).
A key limitation raised by several stakeholders was the fact that the AAQ Directives do
not tackle the sources of air pollution as such (meaning they do not include provisions
that limit emissions at national level or per source – note that the coherence of different
legislation to this effect is discussed in section 5.6). A further limitation identified in
particular by local and regional authorities were shortcomings in the coordination
between different governance levels (Box 9).

45
5.3. Effectiveness and efficiency of air quality monitoring
Evaluation question: To what degree are the monitoring and reporting approaches
mandated by the AAQ Directives (and their respective implementation) fit for
purpose?
Overall response: The AAQ Directives spell out the clear criteria for determining
minimum numbers of sampling points, for data quality and acceptable uncertainty in
monitoring and modelling, as well as for macroscale and microscale siting of sampling
points. These criteria set limits to the flexibility that Member States have in setting up
their respective air quality monitoring regimes, but within these limits leave the
establishment and maintenance of the network to national, regional or local authorities.
This flexibility ensures that siting of sampling points is based on local expertise.
Over time, this has guided the build-up of an effective air quality monitoring network
across the EU which, by and large, adheres to the provisions of the AAQ Directives, and
ensures that reliable and representative air quality measurements and data are available.
The key challenge here is to ascertain that air quality sampling points indeed provide
information both for where the highest concentrations of air pollutants occur as well as
for other areas which are representative of the exposure of the general population.
Some stakeholders question the comparability of the data provided by sampling points in
different locations, as the spatial representativeness of measurements may vary
considerably even on small scales (i.e. tens of meters) for some pollutants, notably
nitrogen dioxide. Meanwhile, the European Court of Auditors has expressed concerns
that air pollution might be underestimated, if not monitored in the right places. On
balance, this fitness check found that air quality information collected and reported is
effective, and delivers air quality data that is robust and reliable enough to act upon.
In terms of efficiency, the information entails relatively low per capita administrative
burden. There are some indications that efficiency could be improved in Member States,
relating to different governance approaches. It is worth noting that the monitoring
requirements depend on the number of air quality zones designated, the population in
these zones, as well as on whether pollution levels are above specific assessment
thresholds defined in the AAQ Directives. Simply put: less pollution, or less people
living in an area, will require less monitoring and thus lower monitoring costs.
The successful establishment and operation of a Europe-wide e-reporting database during
the past decade (based on standardised and machine-readable reporting formats) will
allow further improvements in the way information is reported, quality assured and made
accessible, but may require detailed additional (future) guidance on reporting of air
quality information (for example as regards air quality modelling).
What is the issue?
Reliable, objective and comparable information on air pollution is at the core of all the
efforts to maintain air quality where it is good, or improve it where it is not.
Representative and quality assured data about air quality also highlights whether, when
and where air pollution exceeds acceptable thresholds and whether concentration levels
result in risks to human health and the environment. Air quality monitoring is not an aim
in itself: it is supposed to be helpful for authorities (and the public) in finding out facts
and guiding appropriate response options: are limit values respected and if not, why not

46
and what to do about it? It is also crucial to understand whether measures taken to
improve air quality rendered successes or not.
The AAQ Directives define common approaches and criteria on how and where to
monitor and assess ambient air quality. These criteria include a dual requirement to
sample air quality both where the highest concentrations occur as well as in other areas
which are representative of the exposure of the general population.
The level of detail as to which air quality is to be monitored depends on the population
potentially exposed to air pollution, and whether concentrations are expected to actually
exceed clearly defined assessment thresholds, or not. Depending on this, techniques other
than measurements, including modelling of air quality and indicative measurements, can
also be used to assess ambient air quality, provided that the criteria defined by the AAQ
Directives for their required accuracy are met.
Commission Implementing Decision 2011/850/EU lays down in considerable detail rules
on reporting on ambient air quality and on the reciprocal exchange of information. As a
result of this, reporting of air quality is based on a state-of-the-art electronic reporting
approach by which air quality information is made available in a standardised and
machine-readable format – and made accessible in full via the websites of the European
Environment Agency.98
There is no question that good information on the state of the air is key for the successful
implementation of the AAQ Directives. But are the requirements for monitoring,
assessing and reporting of air quality as set out in the AAQ Directives, the corresponding
Implementing Decision, and supporting guidance documents (fully) fit to ensure that the
‘right information’ is available at the ‘right time’ and without resulting in excessive
administrative burdens, overlaps and/or synergies, gaps, inconsistencies?
What are the findings?
Overall, the information about air quality across the EU is good: an extensive monitoring
network of more than 4 000 monitoring stations that report data to the European
Commission today includes at least 600 sampling points for each of the pollutants and,
for particulate matter and nitrogen dioxide, even more than 3 000 sampling points each.
The number of sampling points varies between Member States (Table 2), as monitoring
requirements depend on the number of designated air quality zones, the population
density in these zones, as well as on whether pollution levels are above specific
assessment thresholds defined in the AAQ Directives.
The monitoring and reporting of air quality is and has been broadly in line with the
requirements established in the AAQ Directives. Even if there are still today isolated
instances where the requirements of the AAQ Directives as regards monitoring and
reporting are not met, most zones in the Member States have the minimum number of
sampling points required by the AAQ Directives. Where this is not the case, the
European Commission has, in several instances, initiated infringement procedures and is
constantly encouraging further compliance efforts, which have led to the result that the
total number of sampling points has in general increased.
98 https://www.eea.europa.eu/

47
In its 2018 Special Report, the European Court of Auditors has identified a number of
issues that hamper effective and efficient monitoring and reporting, relating to the
number and location of sampling points (see below), and has identified as a limiting
factor that the Commission does not have the mandate to require additional monitoring
points at specific locations when and where it considers this is necessary to better
measure air pollution.99
Furthermore, the European Court of Auditors has stressed that timely air quality data is
important, both for the Member States to take appropriate actions to reduce air pollution,
and for the Commission to act earlier to take enforcement procedures against the Member
State. The AAQ Directives require that Member States provide annual validated data
only by 30 September of the following year - with e-reporting this could be accelerated,
decreasing the time lags between observation and reporting, making it easier also for
citizens to access more recent air quality data.
Number and type of sampling points
The AAQ Directives provide a clear indication as regards the number and type of
sampling points needed in each zone (or agglomeration) for each pollutant. For nitrogen
dioxide, particulate matter, benzene and carbon monoxide this shall include at least one
urban background monitoring station and one traffic-orientated station, provided this
does not increase the number of sampling points.
Generally speaking, there are three types of sampling points: (a) at urban background
locations, depicting pollution levels influenced by the integrated contribution of all
sources rather than a single source (as a general rule, these are representative for several
square kilometres); (b) at traffic-orientated locations, sited in such a way that the air
sampled is representative of air quality for a street segment of no less than 100 m length;
and (c) at rural background locations, away from significant sources of air pollution.
Most Member States have put in place the minimum number of sampling points required
by the AAQ Directives. An analysis of the monitoring and assessment regimes in each of
the 28 Member States for particulate matter and nitrogen dioxide did not point to
fundamental gaps in the number of monitoring stations in Member States: in 2015, more
than 98% of the required sampling points for nitrogen dioxide reported data (and this has
since increased further). For particulate matter, this number was slightly lower at just
under 96%: here, traffic-oriented PM2.5 sampling points are missing in some cases.100
Data for 2017 indicates that this has improved further since 2015.101
Similarly, analysing the implications of a sub-set of only five Member States, a study
published by the European Parliament Research Service102 in spring 2019 notes that most
of the monitoring requirements of the AAQ Directives were fulfilled in the analysed
99 European Court of Auditors Special Report on Air Pollution. See section 1 of Annex 9 to this SWD.
100 Ricardo (forthcoming). ‘Assessment of monitoring regimes 2015’.
101 EEA Air Quality Data Portal: http://aqportal.discomap.eea.europa.eu/
102 European Parliament (2019). ‘Sampling points for air quality: Representativeness and comparability of
measurements in accordance with Directive 2008/50/EC on ambient air quality and cleaner air in
Europe’ (study requested by the ENVI Committee).

48
Member States: especially the number of monitoring stations was sufficient in every case
(even if the study also noted that it is not clear from the available documentation if the
location with the highest concentration is covered in all Member States).
Compliance has in general increased for the different air pollution types since the start of
the implementation of the AAQ Directives. Hence, it seems that the AAQ Directives
have generally improved the availability of reliable and comparable data, thus enabling
the monitoring of trends at EU-wide level.
In addition to this, over the past five years, the use and reporting of modelling techniques
to complement data from fixed monitoring stations has increased substantially. Such air
quality modelling helps improve the spatial representativeness of air quality information,
and generally does so at a relatively moderate costs (see Box 10).
While in 2013 only four Member States reported modelled data to the European
Commission, this had, by 2017, increased to twelve Member States.103 Stakeholders, and
especially local and regional authorities, noted a lack of clear provisions on air quality
modelling in the AAQ Directives, and pointed to a need to further improve guidance.
Location of sampling points
While the EU rules prescribe certain minimum criteria on the positioning of monitoring
stations, they provide some discretion to Member States for choosing the exact locations.
Flexibility of the criteria for classifying measurement stations are identified as possible
factors that have led to differences in the way this has been done in the Member States
and so may have led to limitations in comparability of data. Regarding external factors,
resource constraints (e.g. costs, qualified staff) may have led to a varied coverage and
data quality of the monitoring network across the EU. In terms of other possible external
factors, no firm conclusions can be drawn from the analysis.
Some concerns have also been raised about the representativeness of sampling points that
may, in some cases, limit the comparability. Even if the AAQ Directives require to locate
sampling points both ‘where the highest concentrations occur’ and ‘other areas […]
which are representative of the exposure of the general population’, it is not always clear
that the monitoring network lives up to this. Most notably, the European Court of
Auditors concluded in 2018 that ‘air pollution can be underestimated as it might not be
monitored in the right places.’104
Furthermore, in particular the criteria for the microscale siting of sampling points leaves
a degree of flexibility to national authorities (aligned with the overall principle of
subsidiarity) when establishing monitoring networks in order to be mindful of specific
circumstances, including local spatial planning requirements. Specifically, while the
AAQ Directives – amended further by Commission Directive (EU) 2015/1480 – do set
out a series of criteria, they require such criteria to apply ‘in so far as practicable’.
103 In 2013: Netherlands, Poland, Spain, and the United Kingdom. In 2017: the previous four, plus
Belgium, Germany, Portugal, Romania, Croatia. Latvia, Lithuania, and Sweden.
104 Note that this has also been subject to interpretation by the Court of Justice of the EU; see section 3 of
Annex 6 to this SWD.

49
A position paper published by the JRC and the network of National Reference
Laboratories (AQUILA) in 2013 related to siting criteria, classification and
representativeness of air quality monitoring stations noted that the spatial
representativeness of measuring sites is not defined in the legislation, which can hinder
the effectiveness of the monitoring network design and suitability to assess exposures
and model performances.105
Furthermore, a study published by the European Parliament Research Service in 2019
pointed to a number (22) of specific ‘ambiguities’ in the provisions laid down in the
AAQ Directives as regards the macroscale and microscale siting of sampling point. This
refers in particular to the methods for the identification of the highest concentration and
general population exposure, ‘thereby potentially compromising the protection of human
health’. It also points to the fact that the use of terminology such as ‘some metres’, ‘at
least 180°’, or ‘immediate vicinity’ may leave an excessive margin of discretion.106
Costs of monitoring and reporting
The Commission Better Regulation Toolbox defines the costs linked to the legal
obligation to provide information as administrative costs; it also defines information in a
broad sense, including monitoring, reporting and assessment needed to provide the
information.107
All costs related to the AAQ Directives requirements for monitoring and reporting are
therefore administrative costs. However, only a sub-set of these administrative costs can
be considered administrative burden, stemming specifically from the AAQ Directives.
Indeed, even in the absence of the AAQ Directives, it is very likely that Member States
would undertake some air quality monitoring (and already did so before the AAQ
Directives were adopted, see Table 2 for an overview) and information to the public (see
more details on the typology of costs in Annex 3).
The estimates of the costs of air quality monitoring and reporting have therefore to
distinguish, within these overall administrative costs, between the ones stemming
specifically from the AAQ Directives (administrative burden) and the ‘business as usual’
administrative costs (see Box 10 for examples for selected Member States).
Estimates based on data provided by eight Member States through the support study108
indicate that the per capita overall administrative costs (see Annex 3) of air quality
105 JRC (2013). ‘Assessment on siting criteria, classification and representativeness of air quality
monitoring stations’.
106 See Annex 9 to this SWD.
107 Section 2 of Tool #59 of the Better Regulation Toolbox: ‘Administrative costs are defined as the costs
incurred by enterprises, the voluntary sector, public authorities and citizens in meeting legal
obligations to provide information on their action or production, either to public authorities or to
private parties. Information is to be construed in a broad sense, i.e. including labelling, reporting,
registration, monitoring and assessment needed to provide the information. In some cases, the
information has to be transferred to public authorities or private parties. In others, it only has to be
available for inspection or supply on request.’
(https://ec.europa.eu/info/sites/info/files/file_import/better-regulation-toolbox-59_en_0.pdf).
108 Support study informing this Fitness Check, Section 6.3.3 and Appendix F3.

50
monitoring and reporting are between EUR 0.14 and 0.98 per year per person.
Accordingly the estimated costs of monitoring are several orders of magnitude smaller
than the costs of exceeding EU air quality standards (which are estimated to amount to
about EUR 240 billion for the period 2008 to 2016, see section 5.4). It is also worth
noting that the AAQ Directives provide a mechanism for a proportionate approach to
monitoring, whereby pollutants that are below well-defined assessment thresholds, can
be covered by less extensive monitoring regimes, thus decreasing monitoring costs.
Based on a smaller sample of three Member States, administrative burden (see Annex 3
to this SWD) stemming directly from the monitoring requirements established in the
AAQ Directives per capita are estimated between EUR 0.12 and 0.38 per year person.109
Box 10 - Monitoring and reporting costs: information on selected Member States110
The case studies and targeted questionnaires allowed to gather rather detailed information about
the cost of air quality monitoring and reporting directly from the authorities operating the
monitoring networks. Although not always covering exactly the same items, this information
provides an order of magnitude on several aspects of the monitoring and reporting costs.
Annual operating costs, per monitoring station: the 2005 impact assessment for the Thematic
Strategy on Air Pollution estimated an annual costs per monitoring station at EUR 24 000
(covering sampling equipment, maintenance costs, labour and analysis). This broadly
corresponds to the findings of the 2018 case studies (see Annex 9 to this SWD), with annual
operating costs ranging from EUR 7 500 (in Sweden) to EUR 32 000 (in Italy), and up to EUR
70 000 in some Spanish regions.
Annual capital cost (i.e. equipment related costs) are estimated at EUR 380 000 for Ireland, while
for Spain the estimates vary by region from EUR 345 000 (Castilla y Leon) to EUR 2.7 million
(Andalucia). Estimates for annual laboratory costs to check the measurements done by the
monitoring network are estimated at EUR 30 000 for Spain and EUR 50 000 for Sweden. Annual
modelling costs are estimated at EUR 65 000 for Sweden.
Not all these costs can be exclusively attributed to the AAQ Directives, which can explain the
considerable range in the above estimates. Both Dublin City Council and the Swedish
Environmental Protection Agency, for example, indicated that the setting up of the air quality
monitoring network already started before 2008, which reduced the amount of additional costs
incurred as a result of AAQ Directives.
The fitness check of reporting and monitoring of EU environment policy111 approximated
the administrative burden related to the regular reporting (i.e. only compiling and
reporting of information, not monitoring) by Member States to the EU under the AAQ
Directives to be fairly large (i.e. between EUR 100 000 and EUR 1 million in total across
the EU). Since 2014, the two AAQ Directives utilise a common e-reporting system
which has resulted in effectiveness and efficiency gains.
The annual cost incurred by the European Environment Agency for dealing with all
reporting on air quality issues was estimated at EUR 760 000 for the 2014 to 2016
109 Support study informing this Fitness Check, Section 6.3.3 and Appendix F3.
110 Based on case studies and replies to targeted questionnaire, see Annex 11 to this SWD
111 SWD(2017)230. ‘Fitness Check of Reporting and Monitoring of EU Environment Policy’.

51
period.112 This covered large investment in new IT systems, including the Air Quality e-
reporting database, with most of this cost arising from software development by
contractors. No data from earlier periods was available.
Some specific areas have been identified which could explain the cost differences across
Member States and regions (see Box 10) and where both effectiveness and efficiency in
the monitoring and reporting could be improved:
• the extent to which the compliance with the requirements of the AAQ Directives is
delegated to local authorities whilst supported and co-funded by national authorities;
• the availability of national level guidance in Member States;
• the level of use of modern information technology and media technology.
The level and kind of air quality information provided to a wider public beyond what is
presented by the European Environment Agency and the European Commission differs
significantly between Member States (see, for example Box 11 and Annex 11 to this
SWD). While cost data for the full range of public authorities providing information is
not available, these costs are likely to vary accordingly across Member States.
Box 11 – Public information on air quality: examples from Ireland113
The Environmental Protection Agency manages the national ambient air quality monitoring
network and measures the levels of a number of atmospheric pollutants in ambient air. Its website
provides freely and easily accessible information to the public, including: (1) real-time
monitoring data for a number of stations across Ireland; (2) an air quality index for health
(AQIH) with colour coded maps across different regions; (3) air quality bulletins for NO2, O3 and
PM10 with information on exceedances of daily limit values or alert thresholds, as well as a
variety of official reports on air quality; (4) information for web-developers for third party
reporting solutions, providing a dynamically generated feed for the air quality index for health.
The website also offers information to health professionals on how to use the air quality index for
health to help pollution-sensitive patients manage their condition and reduce their symptoms, as
well as general information on air quality zones, standards and management.
Views of stakeholders114
A large majority of respondents to the open public consultation (88%) indicated that, in
their view, monitoring and reporting regimes under the AAQ Directives had helped
112 SWD(2017)230. ‘Fitness Check of Reporting and Monitoring of EU Environment Policy’. The
estimate of EUR 760 000 is based on the average budget and staff dedicated to air quality reporting by
the EEA. Within this envelope, the EEA amongst other manages and maintains the relevant data
repository as per Implementing Decision 2011/850/EC, ensures that reported data is publically
accessible via a bespoke online information portal, analyses this data and publishes its assessment via
an annual Air Quality in Europe report, and since 2017 host a European Air Quality Index available to
citizens online including via mobile devices.
113 Based on case study (Ireland), see Annex 11 to this SWD. The website referred to includes:
Real-time monitoring data: http://www.epa.ie/air/quality/data/
Air Quality Index for Health (AQHI): http://www.epa.ie/air/quality/
Air quality bulletins & reports: http://www.epa.ie/air/quality/reports/
Information for web-developers: http://www.epa.ie/air/quality/dev/
114 For an overview of the stakeholder feedback, and details of views of expressed by different
stakeholder groups in the open consultation, please also see Annex 2 to this SWD.

52
deliver reliable, accurate and comparable air quality information across the EU to a large
or even very large extent. Feedback in particular from national and regional authorities
acknowledged that the common methods established by the AAQ Directives have been
instrumental in having reliable and comparable data across the European Union as a basis
to monitor trends and guide air quality management (but noting that for some pollutants,
namely benzo(a)pyrene or volatile organic compounds this could be improved).
More specifically, around half of the respondents to the open public consultation agreed
that sufficient criteria are defined at the EU level for monitoring and assessment (58%),
and that measurement techniques are sufficiently standardised across Member States
(46%). However, a majority of respondents disagreed that there are sufficient sampling
points and measurements to assess air quality (52%) and that sampling points are
representative as regards the highest concentration or general population exposure.
Similar findings were echoed in the workshops, with participants identifying several
factors that may limit the effectiveness of air quality objectives. NGOs and local and
regional governments noted a lack of clear provisions and guidance on air quality
modelling. National officials also emphasised that more attention should be given to
measuring emissions in areas where vulnerable populations are present, with
consideration given to applying more stringent limit values in these areas.
A number of comments were raised by representatives of authorities, industry and NGOs
on the siting of monitoring stations: some stakeholders suggested that the
AAQ Directives’ criteria on siting are too flexible, while others suggested that they are
too restrictive. Participants also raised aspects where AAQ Directives have made
progress, such as the improvements in publicly available information and data on air
quality and on the accessibility, timeliness and user-friendliness of information on air
quality assessment thanks to the reporting obligations laid down by Implementing
Decision 2011/850/EU.
Similarly, a majority of the respondents to the targeted questionnaire survey
(43 responses in total, see Annex 2 to this SWD), stated that the AAQ Directives have
achieved the objective of defining common methods to monitor and assess air quality to a
large or a very large extent, as well as the objective of actually monitoring and assessing
ambient air quality. Some stakeholders, in particular NGOs and representatives of
authorities, noted areas of further improvement of comparability/reliability of data, for
example due to potential for different interpretations by the Member States. National
authorities indicated that guidance on how modelling should or can be incorporated in
official reporting was limited.
Both during the stakeholder workshops and in the feedback to the targeted questionnaire,
several respondents noted that there is scope to further clarify and improve monitoring
requirements, and enhance the spatial representativeness where monitoring sites are
limited. One industry association specifically identified the requirement for traffic
measuring points to be within 10 meters from the kerbside (Annex III of Directive
2008/50/EC) as inappropriate for motorways and other highways where no one is living,
and stated that this makes it difficult to establish a business in these locations, resulting in
an undesirable shift of operating facilities into residential areas.
Regarding the costs of monitoring, reporting and assessment associated with the AAQ
Directives, a larger share of respondents agreed somewhat or completely that significant
costs were associated with monitoring equipment (46%). Furthermore, during the

53
stakeholder consultation, representatives from reporting authorities noted that the amount
of information required to be reported goes beyond the essential in some cases.115
Meanwhile, in the open public consultation, a majority of respondents positively assessed
the achievement of the objective of making air quality information available to the
public, but it is worth highlighting that also here almost one in three respondents saw
room for improvements (especially related to alert thresholds and/or information
thresholds applied to inform the public).
115 See summary of discussions at the stakeholder workshop held on 18 June 2018 in the framework of
this fitness check: https://ec.europa.eu/info/events/stakeholder-workshop-support-fitness-check-eu-
ambient-air-quality-directives-2018-jun-18_en

54
5.4. Efficiency
Evaluation question: To what degree do the benefits of improved air quality justify
the costs of improving air quality? Are there significant differences in costs (or
benefits) between Member States, and if so, what is causing them?
Overall response: Good air quality makes good economic sense. Measures taken to
improve air quality tend to be motivated by multiple expected outcomes, be they related
to energy policy, transport policy or climate policy: many of the more expensive
measures linked to air quality action plans are often taken also with other objectives in
mind, such as reducing congestion, improving mobility or reducing greenhouse gases.
Aggregate estimates of the overall costs and benefits of air-related policies and of the
AAQ Directives specifically are scarce and sometimes based on different assumptions.
They are useful to provide an order of magnitude, but should not be used for comparison
or as precise data.
An analysis published in 2017116 had estimated that the costs of all measures taken that
result in air quality improvements (but which are often not primarily motivated by air
quality considerations) add up to EUR 70 to 80 billion per year. Earlier estimates of the
costs caused by air pollution to society, health and economic activities add up to between
EUR 330 and 940 billion, per year, for the EU.117 This provides an order of magnitude of
the relatively low level of the cost of action (measures) compared to the cost of inaction
(harmful impacts) for air pollution in general.
Computations undertaken for the support study118 to this fitness check estimate that the
costs of exceeding EU air quality standards have been decreasing since 2011 and amount
to about EUR 240 billion for the whole 2008 to 2016 period – while the health benefits
of measures taken to meet EU air quality standards are estimated to have increased over
the same period and now amount to about EUR 50 billion. This estimate of benefits is
however only a small sub-set of the overall benefits that can be attributed to the AAQ
Directives, due to methodological constraints. If all benefits were to be accounted for
(including all benefits to health, ecosystems, innovation or competitiveness), this would
very likely increase the monetized estimate to a significant extent.
Both the costs and the benefits of taking air quality measures can vary substantially
between Member States, by a factor of two or more, depending on the national
specificities and the typology of measures put in place.
What is the issue?
Air quality has improved in the EU over the last decades, thanks to joint efforts by the
EU and the national, regional and local authorities. As a result of actions taken, since
2000, the EU's GDP grew by 32% while emissions of the main air pollutants decreased
by 10% to 70% depending on the pollutant (“absolute decoupling”). This improvement
116 IIASA (2017). ‘Costs, benefits and economic impacts of the EU Clean Air Strategy and their
implications on innovation and competitiveness’
117 SWD(2013)531. ‘Clean Air Programme for Europe Impact Assessment’ (based on GAINS modelling).
118 Support study informing this Fitness Check, Sections 6.3.1 and 6.3.2, and Appendices F1 and F2.

55
has led to better health, a cleaner environment and direct economic benefits – but are
they worth the costs of these improvements?
To provide context for this issue, it is useful to look first at the total costs of air pollution,
or in other words, the potential benefits that could – theoretically – be achieved in an air
pollution free world. In 2013, the Impact Assessment119 that underpinned the Clean Air
Programme for Europe estimated the overall external economic costs of air pollution to
be in the order of magnitude of EUR 330 to 940 billion per year.
This estimate includes the monetised valuation of ill health and increased mortality risk
of the individual (which carries a high degree of uncertainty, which in turn explains the
range of a factor three in the overall estimate); this includes also direct costs such as
labour productivity losses, costs to the health care systems and lower crop yields, which
add up to EUR 23 billion (note that this estimate does not include the total costs of
ecosystem damages and biodiversity loss, including impacts on agricultural and forestry
yields, nor impacts on materials and buildings).120
These estimates are in the same order of magnitude as those provided by others: the
OECD, for example, estimated the welfare costs attributed to premature deaths due to air
pollution at around USD 730 billion in 2015 for those Member States that are part of the
OECD.121
The total costs of air pollution include the foregone benefits that could be harvested
through reduced pollution. Measures taken to enhance compliance with EU air quality
standards, tap into these potential benefits, but are only a sub-set of those. It is important
to note that many, if not all of these measures, bring with them substantial co-benefits
and are not motivated by air quality policy alone: measures to improve energy efficiency
(such as replacement of inefficient boilers), to subsidise shifts towards low emission
mobility, to further develop public transport systems also have positive impacts for the
way we source and use energy, for the decongestion of our urban mobility systems or for
the fight against climate change. It is nearly impossible to disentangle these impacts from
each other. Therefore, when assessing the costs and benefits of the measures taken to
comply with the AAQ Directives, it is important to keep in mind that there are several
linkages between these costs and benefits and wider ones related to environmental,
energy and climate impacts overall.
Nevertheless, the findings accrued under this evaluation question attempt to provide
some indications about the overall costs of emission control and measures taken to meet
air quality limit values and target values, as well as the costs of the monitoring and
reporting obligations set by the Directives. In addition, the analysis put these costs in
perspective with the benefits of meeting air quality standards on the one hand, and with
the costs of poor implementation (i.e. the benefits foregone by not meeting the EU air
quality standards) on the other hand. More information about the methodology used for
all these findings and their limitations can be found in Annex 3.
119 SWD(2013)531. ‘Clean Air Programme for Europe Impact Assessment’.
120 SWD(2013)531. ‘Clean Air Programme for Europe Impact Assessment’.
121 OECD (2016). ‘The Economic Consequences of Outdoor Air Pollution’.

56
What are the findings?
There is a wide variety of air quality measures available to national, regional and local
authorities to comply with the AAQ Directives. These include actions to reduce traffic
demand, promote cleaner vehicles and modes of transport, lower emissions from
domestic heating, and additional actions beyond Best Available Techniques (BAT) for
industrial facilities. There are many others, and Commission Communication ‘A Europe
that protects: Clean air for all’122 provides an overview of such measures.
Comprehensive estimates of costs of air quality measures are rare, not least as these costs
are not reported to the European Commission or the European Environment Agency as
such. In 2018, the GAINS model was used to estimate the costs that compliance with the
whole EU Clean Air Policy would incur.123 This provided an order of magnitude estimate
in the range of EUR 70 to 80 billion per year including the costs of implementation of all
source‑ oriented legislation and of the NEC Directive, and of synergetic measures
delivering also energy and climate objectives.
It is instructive that the above approximated costs vary substantially from EUR 93 per
person per year (for Romania) to EUR 239 per person per year (for Poland), with
Luxembourg being an outlier at an estimated more than EUR 500 per person per year.124
This illustrates the variety of each specific situation, but also the potential for efficiency
gains by sharing best practices.
To illustrate this further, the case study conducted in Bulgaria125 indicates that, for the
period 2011 to 2015, the costs of the air quality measures taken in the Plovdiv
agglomeration amounted to around EUR 25 million for measures related to road
infrastructure, street cleaning, greening of public spaces and preparation of an action plan
for new heating technologies and renewable energy.
In addition to the costs of the measures put in place to fulfil the limit values and target
values, the monitoring and reporting obligations of the AAQ Directives also entail some
administrative costs (see previous evaluation question). These have been estimated,
based on information received from a sub-set of Member States, to amount to less than
EUR 1 per person per year.
How do these costs stemming from the AAQ Directives compare with the original
expectations, and, more importantly, with the health benefits accrued and with remaining
costs of poor implementation?
The Impact Assessment underpinning Directive 2008/50/EC in 2005126 estimated the
direct costs of complying with provisions put forward in the Commission proposal to be
in the range of EUR 5 to 8 billion – compared with a monetised health benefit estimated
122 COM(2018)330. ‘A Europe that protects: Clean air for all’.
123 IIASA (2017). ‘Costs, benefits and economic impacts of the EU Clean Air Strategy and their
implications on innovation and competitiveness’
124 IIASA (2018). ‘Progress towards the achievement of the EU’s air quality and emissions objectives’.
125 Support study informing this Fitness Check, Appendix I.
126 SEC(2005)1133. ‘Thematic Strategy on air pollution: Impact Assessment’.

57
at the time in the range of EUR 37 to 119 billion per annum by 2020 (these benefits do
not include those related to ecosystems,127 materials and buildings). It is very important to
note that these 2005 estimates were restricted to costs and benefits of limiting fine
particulate matter (PM2.5) only, as other EU air quality standards at the time were
inherited from predecessor legislation.
Newer estimates128 indicate that a sub-set of the accrued health benefits of air quality
measures taken to comply with the limit values from 2008 to 2016 are in the order of
EUR 50 billion over the whole period, increasing over time and corresponding to just
under 8 000 avoided premature deaths in 2016. However, the overall set of benefits of the
measures taken is expected to be much wider as, for example, the following benefits are
not accounted for in this estimate:
• benefits to natural ecosystems and to agricultural and forestry yields;
• benefits to buildings and materials;
• health co-benefits: for instance, the promotion of cycling, walking, public transport
fleets renewal have not only air-related health benefits but also benefits linked to
increased physical activity and reduced noise;
• mental health benefits of reduced air pollution.
In addition, due to the methodology used for this estimate, a significant part of the
benefits is not accounted for. Indeed, the estimate only considers the benefits enjoyed by
the EU population living in air quality zones that have moved from above to below the
air quality limit values or target values over the 2008 to 2016 period. However, this
excludes a wide arrays of situations where benefits will also have been enjoyed, e.g.:
• when the air quality zones remain above limit values or target values, but with a
lower level of exceedance over the period;
• when the air quality zones are maintained below the limit values or target values, as
required by the AAQ Directives;
• when neighbouring zones also benefit from improvements in a given zone.
Figure 9 shows the trends in the estimates of some health benefits of the measures put in
place in order to comply with the air quality standards, estimated with all caveats
described above. It is salient to see that the health benefits increase over time, as more
measures are implemented and successfully deliver air quality improvements.
127 Cost of ecosystem impacts of air pollution was estimated in FP7 project (Effects of Climate Change on
Air Pollution and Response Strategies for European Ecosystems) and is presented in the Support Study
Appendix F1.7.2. It estimates the crop damages from exposure to ozone at EUR 8 billion per year (for
the period 2010 to 2030), damage to forests from ozone in terms of loss of production and greenhouse
gas sequestration at between EUR 3 and 34 billion per year, and damage to biodiversity through
nitrogen deposition and eutrophication at between EUR 3 and 12 billion per year, depending on the
method adopted. These estimates total EUR 14 to 54 billion per year.
128 Support study informing this Fitness Check, Sections 6.3.1 and 6.3.2, and Appendices F1 and F2; see
also Annex 3 to this SWD.

58
Figure 9 – Annual benefits of the AAQ Directives relating to reduction in exposure to
NO2, ozone and PM10 (with methodological caveats as described in support study).129
In parallel, the same methodology (see Annex 3 to this SWD) has been used to estimate
the costs of poor implementation of the AAQ Directives, through the degree of non-
compliance with limit values and target values for particulate matter, nitrogen dioxide
and ground-level ozone, respectively. The economic value of health impacts associated
with related exceedances is estimated to be in the order of EUR 240 billion for the EU for
the period 2008 to 2016, decreasing over time, with the same caveats on the methodology
as for the benefits presented above.
In addition to health benefits (delivered or foregone) mentioned above, it is useful to
assess the wider impacts of the AAQ Directives on the economy (and in particular
competitiveness) and on social sustainability. The 2013 Clean Air Programme for
Europe, for example, identified that better air also offers economic opportunities
including for the EU's clean technology sectors, and noted that major engineering firms
in the EU already earn up to 40% of revenues from their environment portfolios.130
Competitiveness impacts are difficult to ascertain and disentangle from the overall
impacts of environmental policy. However, based on literature review,131 they are
estimated to be minor over the whole economy but positive for the innovative sectors that
have benefited from new markets due to the measures put in place to reduce pollution.
More specifically, a 2019 OECD report estimates that “reductions in air pollution could
explain up to 15% of recent GDP growth in Europe” over the period 2000 to 2015, due to
increased labour productivity (less absenteeism and increased physical and cognitive
capabilities).132
Overall, variations in cost and benefits of the AAQ Directives and air pollution in general
across EU Member States are due to national specificities (age and composition of the
vehicle fleet, type and age of industrial facilities, predominant heating systems, scope for
129 Support study informing this Fitness Check, Section 6.3 and Appendix F.
130 COM(2013)918. ‘A Clean Air Programme for Europe’.
131 Support study informing this Fitness Check, Section 6.3.4 and Appendix F4.
132 OECD (2019). ‘The economic cost of air pollution – Evidence from Europe’; this study uses
econometric analysis on satellite-based pollution data at EU NUTS-3 level and estimates reduction of
air pollution through the achievement of the national exposure reduction target for PM2.5.
-€ 2,000
€ 0
€ 2,000
€ 4,000
€ 6,000
€ 8,000
€ 10,000
€ 12,000
€ 14,000
2008 2009 2010 2011 2012 2013 2014 2015 2016
Annu
al be
nefit
s, €m
illion

59
upgrades or fuel switches e.g.) and to the methodology used for estimating the benefits,
which reflects, i.a., the level of exceedances and population density, and therefore the
types of measures put in place and their potential for co-benefits.
Figure 10 – Exposure to PM2.5 mapped against GDP per capita, 2013-2014133
Air pollution also brings social cost in terms of inequalities and social sustainability:
groups of lower economic status tend to be more negatively affected by air pollution, as a
result of both greater exposure and higher vulnerability. Figure 10 illustrates, for
example, that EU regions with the lowest GDP per capita (e.g. regions in Central and
Eastern Europe, as well as parts of Southern Europe) generally experience higher
exposure to fine particulate matter concentrations than other regions. Measures towards
reducing air pollution and complying with the AAQ Directives can therefore act
positively towards improved social sustainability.
All the numbers presented above should be handled with care as they are subject to
several limitations (see Annex 3 to this SWD), stemming also from the fact that there is a
lack of ex-post data available to describe actual cost and effect of actions. However,
despite these methodological difficulties, the available evidence clearly suggests that the
benefits of measures tackling air pollution exceed cost. In line with EU legislation, such
measures should be guided by the principles that pollution is rectified at source and that
the polluter should pay.
Views of stakeholders134
A large proportion of open public consultation respondents believed that AAQ Directives
have delivered significant benefits for protecting human health (42%) and the
environment (39%) either to a very large or large extent. Views were less positive (a bit
more than 20%) for the directives’ effects on reducing economic costs linked to air
pollution and boosting competitiveness and innovation, or supporting the development of
133 EEA Report 22/2018. ‘Unequal exposure and unequal impacts’.
134 For an overview of the stakeholder feedback, and details of views of expressed by different
stakeholder groups in the open consultation, please also see Annex 2 to this SWD.

60
new industrial sectors. The economic sectors considered to benefit from AAQ Directives
implementation were innovative industries (in all sectors) (58%) and healthcare (48%).
As regards who is bearing the costs arising from abatement measures, a majority of
respondents considered that these are borne by ‘all citizens’ (59%) and ‘citizens living in
urban areas’ (47%). Just over half of respondents expressed the view that the transport
sector had borne costs to comply with the AAQ Directives (but only 4 out of 14
respondents that self-identified as from the transport sector). Manufacturing industries
(47% of all respondents, and 11 out of 12 that self-identified as from this industry) and
energy providers (46% of all respondents, and 10 out of 12 that self-identified as from
this sector) were also most frequently identified as bearing the costs, along with the
competent public authorities (37% of all respondents, and 20 out of 24 that self-identified
as from public administrations), see Annex 2 to this SWD for a more detailed analysis.
Other issues raised – especially in the stakeholder workshops – relate to the methodology
to be used for assessing costs and benefits, and in particular to the importance of
capturing costs by key sectors contributing to air pollution. In this regard, participants
noted the absence of a common methodology to quantify the costs of air pollution, not
only on health but also on agriculture and ecosystems: it was argued that such common
methodology would help to show the value of addressing air pollution.
Another methodological difficulty identified during the stakeholder workshops is the
attribution of costs (and benefits) of improved air quality to the AAQ Directives, due to
the interactions between the Directives and other policy interventions. It was also noted
that the majority of air quality plans do not have a cost-effectiveness analysis despite
many low-costs measures being available at the local level.
Business and industry representatives in particular noted an imbalance between those that
pollute the most and those that are asked to shoulder the costs for air quality
improvements, referring in particular to the investments made by industry. Industry
stakeholders more generally pointed to the need for air quality measures to be cost-
effective and firmly embedded in the wider clean air policy framework in general, and
aligned with best available techniques (BAT) developed under the Industrial Emissions
Directive.135
The evaluation of efficiency relied heavily upon the input of stakeholders via the targeted
questionnaire (43 responses in total, see Annex 2 to this SWD), which also included
questions focused on the administrative costs and burdens associated with the AAQ
Directives. Explaining the lack of data provided, the respondents commented on the
challenges of quantifying the costs and benefits associated with the AAQ Directives.
Both in the targeted questionnaire and in their feedback to the open public consultation,
NGOs were significantly more likely to express concerns about the costs of non-
implementation than other stakeholders. Responses by local authorities tended to note
they bear a disproportionate share of the costs of implementing measures needed to
ensure compliance with the Directive (see Annex 2 to this SWD). The responses from
industry stakeholders provided very limited concrete figures on costs and benefits and
generally little comment on the topic of efficiency.
135 Directive 2010/75/EU

61

62
5.5. Coherence
Evaluation question: Are the AAQ Directives coherent internally, with other EU
Clean Air policies, with other EU legislation (e.g. on transport, energy, agriculture
or nature protection), and with international commitments?
Overall response: The AAQ Directives together form a coherent regulatory system to
improve air quality in the EU, with only minor internal consistencies that may have a
limited impact on the effectiveness of the monitoring networks in achieving air quality
objectives. The AAQ Directives are also coherent with the overall EU clean air policy
framework, including in particular with the National Emissions Ceilings (NEC)
Directive. This coherence was strengthened over the evaluation period with the release of
the 2013 Clean Air Policy Package and the revision of the NEC Directive.
The AAQ Directives are also in a mutually supportive relationship with environmental,
sectoral and other relevant policies and legislation, including those on climate, energy,
transport and agriculture. Impact assessments of the EU climate and energy framework
for 2020, 2030 and for the long-term strategy consistently assume positive impacts for air
quality for the EU.136
However, analysis as well as stakeholder feedback also identified instances where the
coherence of, and implementation of, specific EU policies may run counter to the
implementation of the AAQ Directives. This includes the promotion of biomass
combustion for energy production resulting from climate and energy policy, the
shortcomings in the implementation of EU Type Approval Framework for cars in relation
to NOx emissions or the choices made by some Member States to support diesel over
petrol cars with a view to reducing greenhouse gas emissions. These findings were
corroborated by those of the European Court of Auditors.
In terms of EU funding, substantial funding has been made available to directly support
air quality improvements (i.e. in the 2014-2020 period Member States have allocated
about EUR 2 billion for air quality projects), and much larger cohesion policy allocations
in other areas support actions that can improve air quality indirectly, such as for
low-carbon economy (EUR 45 billion), environmental protection and resource efficiency
(EUR 63 billion) and network infrastructure (EUR 58 billion).
The AAQ Directives have also supported the Member States in their efforts to fulfil their
commitment under international law, in particular in relation to the UNECE Convention
on Long-Range Transboundary Air Pollution (Air Convention) and the IMO Convention
for the Prevention of Pollution from Ships (MARPOL).
What is the issue?
Coherence is concerned with how well different EU interventions work together, both
internally and with other interventions in other EU competence areas.
Broadly speaking, four levels of coherence can be distinguished: (a) internal coherence,
i.e. within each Directive and between each other; (b) coherence within the overarching
136 European Commission (2018). ‘In-depth analysis in support of the Commission Communication
COM(2018) 773’.
https://ec.europa.eu/clima/sites/clima/files/docs/pages/com_2018_733_analysis_in_support_en_0.pdf

63
EU Clean Air policy framework (including with the national emission reduction
commitments via Directive 2016/2284/EU, and emission standards established for key
pollution sources); (c) coherence with other EU legislation, i.e. on environment,
transport, climate, energy, agriculture, as well as funding regimes, and (d) with
international commitments.
As air pollution in the EU has its sources in many different sectors of economic activity,
it is necessary to look at a broad range of EU interventions regulating or having an effect
on these sectors from different angles.
What are the findings?
Internal coherence
From the perspective of internal coherence, the AAQ Directives form a coherent
regulatory system to improve air quality in the EU. Both directives were designed to
avoid, prevent or reduce harmful effects of different pollutants on human health and the
environment. For this purpose, they both set ambient air quality standards to be attained,
assessment requirements and methods to determine air pollutant concentrations, public
information provisions and requirements to take action to improve air quality.
The AAQ Directives form a complementary set, stemming also from their historical
development. Directive 2004/107/EC was historically one of the five daughter directives
of the previous legal framework for air quality (see Annex 4 to this SWD). The main
difference between the two directives is in the pollutants that they regulate, which is then
in turn reflected in the type of air quality standards that they set (Directive 2004/107/EC
prescribes only target values for heavy metals and BaP, whereas Directive 2008/50/EC
uses limit values, target values and other air quality objectives that are to be attained in
the long term – see Box 1). The preamble to Directive 2008/50/EC refers to the possible
merger of the two Directives once sufficient experience is gained in the implementation
of Directive 2004/107/EC. Such merger in itself, however, would not change the
functioning of either Directive (at least as long as none of the provisions are changed).
Against the backdrop of an overall coherent system, individual instances of incoherence
within the respective AAQ Directives were identified, in particular in relation to the
requirements that are prescribed for air quality monitoring networks. For example, the
European Court of Auditors noted that, while Member States should maintain sampling
points for diffuse sources of PM10 where there has been an exceedance in the last three
years, it is not clear why such provisions are not set for other pollutants.137
Furthermore, a joint submission by a group of NGOs138 pointed to further instances where
a lack of precision of the monitoring requirement may lead to incoherent applications of
these requirements. However, no systemic issues in this regard have been observed.
Therefore, these individual instances do not undermine the conclusion that the AAQ
Directives together form an overall coherent system of air quality management,
confirmed by views of stakeholders.
137 European Court of Auditors Special Report on Air Pollution. See section 1 of Annex 9 to this SWD.
138 In their reply to the targeted questionnaire.

64
Coherence with other EU clean air legislation
The AAQ Directives are coherent with the overall EU clean air policy framework, i.e.
with the National Emissions Ceilings (NEC) Directive139 as well as with EU legislation
setting emission standards for various industrial installations – the Industrial Emissions
Directive (IED)140 and the Medium Combustion Plants (MCP) Directive.141
Coherence with the related legislation was strengthened over the evaluation period with
the release of the 2013 Clean Air Policy Package and the revision of the NEC Directive.
The impact assessment for the Clean Air Policy Package142 explicitly referred to
‘untapped synergies between the AAQ Directives and the NEC Directive’. For this
reason, the new NEC Directive strengthened the national emissions reductions
commitments for four pollutants which relate both directly and indirectly to the
achievement of the AAQ Directives objectives: ammonia, sulphur dioxide, nitrogen
oxides and non-methane volatile organic compounds (note that the former three are
precursors to particulate matter, the latter two are precursors to ozone). It also introduced
national emissions reductions commitments for fine particulate matter (PM2.5).
With regard to legislation on industrial emissions, the Industrial Emissions Directive
aims to reduce emissions from large combustion plants for a number of pollutants (most
of which are also included in the AAQ Directives) through the applications of permits
based on Best Available Techniques (BAT), in turn based on BAT reference documents
(BREFs) prepared at EU level. To date, 16 BREFs had been reviewed for a number of air
polluting sectors, including for large combustion plants, non-ferrous metals industries,
refining of mineral oils and gas, as well as the intensive rearing of poultry and pigs.143
Having said this, the European Court of Auditors has noted that the IED still ‘allows
Member States to set less stringent emission limit values’ if they determine that BAT
would lead to ‘disproportionately higher costs’ than environmental benefits, and allows
‘flexibility instruments’, under which some Member States have less stringent standards
for certain plants. Currently, the Industrial Emissions Directive is subject to an evaluation
which will i.a. look at how it is contributing to air quality policies, including in terms of
relevance of its scope (industry sectors) and pollutants covered.
The Medium Combustion Plants Directive sets emission limits of SO2, NOx and dust for
medium-sized facilities, thus covering plants that were previously not covered by other
any EU legislation. However, since these limits became applicable to new plants only as
of December 2018 and will become mandatory for existing plants only as of 2024 or
2029 (depending on the capacity), it was not possible to evaluate the concrete effects of
their implementation in the framework of this fitness check.
139 Directive (EU) 2016/2284.
140 Directive 2010/75/EU.
141 Directive (EU) 2015/2193.
142 SWD(2013)531. ‘Clean Air Programme for Europe Impact Assessment’.
143 https://eippcb.jrc.ec.europa.eu/reference/

65
The First Clean Air Outlook144 concluded that, taken together, the package of measures
adopted by the co-legislators since the 2013 Clean Air Programme145 are expected by
2030 to deliver PM2.5 concentrations in most of the EU which are below the WHO
Guidelines value: it projects that the population exposed to concentrations above the
WHO Guidelines value would drop from 88% in 2005, to 13% in 2030. Where
exceedances are projected to continue, additional and less cost-effective measures not
considered in the analysis would still be needed and may require financial and other
targeted support to reach concentration levels recommended by the WHO Guidelines
(Annex 8).
Coherence with other environmental legislation and policies
The AAQ Directives are broadly coherent with different environmental legislation and
policy documents. This includes the overarching policy documents i.e. the 6th and the 7th
Environment Action Programmes; cross-cutting environmental policies such as the
Strategic Environmental Assessment (SEA) and Environmental Impact Assessment (EIA)
Directives as well as key environmental legislation in specific areas, including the
Habitats and Birds Directives, the Nitrates Directive, and the Noise Directive.
Specifically, the 6th Environment Action Programme146 from 2002 set an objective that air
quality levels ‘do not give rise to unacceptable impacts on, and risks to, human health
and the environment’; and both AAQ Directives refer to the 6th EAP in their first recitals.
The 7th Environment Action Programme,147 from 2013, further strengthened the
commitment to better air quality, by calling for significant improvement of air quality by
2020, ‘moving closer to WHO recommended levels’. In this way, environmental policy
and air quality legislation contribute also directly to the EU health policy targets.
The Strategic Environmental Assessment (SEA)148 and Environmental Impact Assessment
(EIA)149 Directives aim to ensure that environmental impacts are considered before
decisions on plans, programmes and projects that are likely to have significant effects on
the environment. Taking into account the provisions of these Directives calling
specifically to consider effects i.a. on air and human health, it can be concluded that the
SEA and EIA Directives contribute to the achievement of the AAQ Directives’
objectives. Unless a specific air quality plan meets the criteria laid down in Article 2a
and 3(2) of the SEA Directive, it does not require a strategic environment assessment.
Habitats and Birds Directives (or the Nature Directives)150 aim to contribute to ensuring
the conservation of biodiversity through the conservation of species and habitats of EU
144 COM(2018)446. ‘The First Clean Air Outlook’.
145 COM(2013)918. ‘A Clean Air Programme for Europe’.
146 Decision No 1600/2002/EC.
147 Decision No 1386/2013/EU.
148 Directive 2001/42/EC.
149 Directive 85/337/EEC.
150 Council Directive 92/43/EEC, and Directive 2009/147/EC.

66
conservation concern. An EEA study151 has found that the AAQ Directives have
contributed to reductions in atmospheric deposition of sulphur and nitrogen compounds,
yielding positive impacts on ecosystems, Natura 2000 sites and habitats.
Although it does not apply specifically to air emissions, the Nitrates Directive152 has an
indirect impact on air quality. It aims to protect water quality across Europe by
preventing nitrates from agricultural sources to pollute both ground and surface waters
and by promoting the use of good farming practices. Since manure and fertilisers are also
sources of air emissions (in particular nitrogen oxides (NOx) and ammonia (NH3); both
are precursors of particulate matter), preventing water pollution with nitrates from
agriculture can have an impact on air emission.
When it comes to the Environmental Noise Directive,153 the link with air quality is more
direct in a way that noise and air pollution have overlapping sources and cities are both
noise and air pollution hotspots.154 Directive 2008/50/EC explicitly requires air quality
plans to be consistent and integrated with plans and programmes for the assessment and
management of environmental noise.
Coherence with key sectoral policies
Climate & energy
The AAQ Directives and the greenhouse gas emissions reduction targets set out in EU
climate policy and legislation are broadly considered coherent – this includes the 2020
Climate and Energy Package, the 2030 Climate and Energy Framework and in particular
the 2050 Low Carbon Roadmap and the Long-Term Emissions Reduction Strategy which
specifically note the synergies that can be achieved when climate and air quality policies
are well coordinated. It is also confirmed by studies155 where modelling shows that EU
climate policy reduce the emissions of key air pollutants like NOx, SO2 and PM2.5, hence
also increasing the overall efficiency of the measures taken under this policy.
Similarly, the implementation of the Energy Efficiency Directive156 is considered as
positive for air quality, since it overall decreases energy consumption. The Ecodesign
regulatory framework (including the regulation for solid fuel boilers (EU 2015/1189) or
the EU energy labelling regulation for solid fuel boilers (EU 2015/1187), and the 2018
Commission Guidelines on Ecodesign requirements for heaters and solid fuel boilers)
151 EEA Report 11/2014. ‘Effects of air pollution on European ecosystems’
152 Council Directive 91/676/EEC.
153 Directive 2002/49/EC.
154 Science for Environment Policy In-depth Report (2016). ‘Links between noise and air pollution and
socioeconomic status’.
155 ETC/ACM Technical paper 2011/20, ‘Co-benefits of climate and air pollution regulations’; IIASA
(2014), ‘Complementary Impact Assessment on interactions between EU air quality policy and climate
and energy policy’; JRC (2017), ‘Global Energy and Climate Outlook 2017: How climate policies
improve air’; European Commission (2018), ‘In-depth analysis in support of the Commission
Communication COM(2018) 773’.
156 Directive 2012/27/EU, as amended.

67
contributes to the reduction of domestic emissions and is therefore positive for air
quality.
The impacts of the Renewable Energy Directive157 are overall positive, but impacts
depend on the sources of renewable energy that ultimately displace conventional energy
generation. Some sources (e.g. solar, wind) are clearly having positive impacts on air
quality, while the air quality benefits of other sources (e.g. biomass) are less clear. In
particular, the use of inefficient biomass combustion technologies may have a negative
effect on air quality as it can increase particulate matter concentrations in specific
locations. This was one of the issues that the stakeholders frequently raised as regards
coherence. This was also emphasised by the European Court of Auditors in its Special
Reports 05/2018 on Renewable Energy and 23/2018 on Air Pollution, pointing out that
the combustion of wood biomass can also lead to higher emissions of certain harmful air
pollutants. In order to address this issue, under the Ecodesign Regulation new energy
efficiency and air quality requirements will enter into force in 2020 for solid fuel boilers
and local space heaters. In addition, the new EU sustainability criteria post-2020 include
minimum energy efficiency standards for large-scale biomass in heat and power.
Transport
When it comes to road transport, the EU’s transport policy goals are found to be
consistent with EU air quality objectives. EU legislation and strategic policy documents
for road transport (i.a. the Transport White paper, 2016 Low-Emission Mobility Strategy,
2017 and 2018 Mobility Packages, Non-Road Mobile Machinery Regulation,
Eurovignette Directive, Alternative Fuels Infrastructure Directive, Clean Vehicle
Directive) overall set air quality among their goals, limit vehicle emissions and promote
alternatives to current transport systems.
However, it became clear that, during the evaluation period, implementation and
enforcement of EU provisions for vehicle emission standards and for controlling vehicle
emissions in the Type Approval Framework have had shortcomings with negative
consequences for air quality. This has also been confirmed by an European Parliament
Inquiry into Emission Measurements in the Automotive Sector.158
Legislative changes since 2015, in particular the adoption of new EU type-approval
legislation and market surveillance legislation, significantly raising the quality level and
independence of vehicle type-approval and testing, increasing checks of cars that are
already on the EU market and strengthening the overall system through the introduction
of a tighter European oversight and Real Driving Emissions test procedure, will address
many of the abovementioned weaknesses.
In terms of maritime transport, the Sulphur Directive159 regulates the maximum sulphur
content in fuels used on board ships with a view of reducing sulphur dioxide (SO2)
emissions from this sector. As a result of the good rate of compliance with and enhanced
enforcement of sulphur standards, concentrations of SO2 in coastal regions, notably in the
157 Directive (EU) 2018/2001.
158 European Parliament (2017). ‘Report on the inquiry into emission measurements in the automotive
sector’.
159 Directive (EU) 2016/802.

68
SOx Emission Control Areas where stricter standards apply, have gone down
significantly.160 Furthermore, it should be noted that nitrogen oxides and particulate
matter emissions from shipping contribute to local air quality problems in the EU and to
the eutrophication of European seas. This has led to further action, including through the
establishment of a NOx Emission Control Area in the Baltic and North Seas.161 The
Commission is currently working with EU and non-EU riparian states with a view to
possibly designate an Emission Control Area covering the Mediterranean Sea. In
addition, the contribution to port/coastal areas emissions from ships could be addressed
by Member States via the further deployment of ‘shore side electricity’ or facilitating the
access in their ports of greener ships with high-energy efficiency or using alternative
fuels.
Agriculture
In terms of air quality, the most relevant issue associated with agriculture and the EU’s
common agricultural policy (CAP) are emissions of ammonia – a precursor for
particulate matter. The agricultural sector accounts for over 92% of total ammonia
emissions across the EU.162,163 While for most other sectors and pollutants, source
legislation requiring emission reductions is in place, agriculture’s ammonia emissions are
an exception. As a result, ammonia emissions have decreased considerably less than
other pollutant emissions over the period of the fitness check.
This said, the CAP has undergone a series of reforms that aimed to enhance its
environmental sustainability. In particular, the 2013 reform aimed at finding a balance
between agricultural production, rural development and the environment. Under direct
payments to farmers (the main part of ‘Pillar I’ of the CAP), payments for implementing
compulsory ‘green’ measures were introduced to support basic environmental
management on all agricultural land in the EU-28.164 The cross-compliance rules refer to
soil management banning the burning of arable stubble, a provision that should reduce air
emissions of particulates. The cross-compliance rules also include the Nitrates Directive,
whose measures can reduce air emissions, as noted above.
The second pillar of the 2014-2020 CAP supports rural development: the European
Agricultural Fund for Rural Development includes among its objectives ensuring the
160 COM(2018)188. Commission report on implementation and compliance with the sulphur standards for
marine fuels set out in Directive (EU) 2016/802.
161 This NOx Emission Control Area, established under the International Maritime Organization, will be in
effect as of 2021.
162 EEA Report 10/2019. ‘Air quality in Europe – 2019 report’. Note that, since 2000, ammonia emissions
have decreased by less than 10%, compared to 77% for sulphur dioxide emissions.
163 It is worth noting that about 75% of all ammonia emissions in the EU‑ 28 are caused by manure
management from livestock farming, with 80% of manures originating from 4% of the farms. See:
IIASA, 2017. ‘Measures to address air pollution from agricultural source’.
164 SWD(2018)478. Evaluation of the ‘Regulation (EU) No 1307/2013 of the European Parliament and of
the Council of 17 December 2013 establishing rules for direct payments to farmers under support
schemes within the framework of the common agricultural policy and repealing Council Regulation
(EC) No 637/2008 and Council Regulation (EC) No 73/2009’ concerning the greening in direct
payments.

69
sustainable management of natural resources and addressing climate change. A sub-
priority of this Fund includes measures to reduce greenhouse gases and ammonia
emissions from agriculture, but their use has been limited. In addition to measures under
the CAP, certain large agriculture enterprises, including intensive pig and poultry rearing
facilities, come within the scope of the Industrial Emissions Directive, whose 2017 ‘Best
available techniques Reference’ document (BREF) includes techniques to reduce
emissions from this sector.
Further improvements are expected if the additional measures proposed by the European
Commission165 are agreed by the co-legislator and fully implemented by Member States.
Coherence with EU funding and taxation
When it comes to air quality investments, the cohesion policy funds, in particular the
European Regional Development Fund (ERDF) and the Cohesion Fund (CF) provided
about EUR 1.2 billion166 for air quality investments in the 2007-2013 programming
period, while for the current, 2014-2020 period Member States have allocated about
EUR 2 billion for air quality projects (as of June 2019).
In addition, much larger cohesion policy allocations in other areas support actions that
can improve air quality. These include allocations in the 2014-2020 period for the low-
carbon economy (EUR 45 billion), environmental protection and resource efficiency
(EUR 64 billion) and network infrastructure (EUR 58 billion) across all five European
Structural and Investment Funds (ESIF).
The LIFE programme has also been instrumental in delivering clean air benefits. In the
2014-2020 period, more than 50 projects and about EUR 300 million have been allocated
to projects with a direct or indirect impact on improving air quality.
Several studies indicate, however, that Member States did not use the full potential of
ERDF and CF resources for air quality. The European Court of Auditors noted that it
found cases ‘where Member States did not prioritise […] funding of projects that target
the main sources and pollutants identified’.167 Reiterating the European Court of
Auditors’ findings, the report from EUROSAI168 noted that EU funding for air quality can
provide useful support, but that it was not always well-targeted by Member States.
Investments, including those supported by EU funds, can also support projects that may
negatively affect air quality. An example would be investments into new roads (where
and when they lead to additional air pollution from traffic in areas that already face air
quality challenges). Approximately EUR 42.5 billion of cohesion policy funds was used
for roads (both new and reconstructed) in the 2007-2013 period, whereas in the
165 For the Commission proposals on the future of the common agricultural policy beyond 2020, see
https://ec.europa.eu/info/food-farming-fisheries/key-policies/common-agricultural-policy/future-
cap_en
166 COWI (2019). ‘Integration of environmental concerns in Cohesion Policy Funds’.
167 European Court of Auditors Special Report on Air Pollution. See section 1 of Annex 9 to this SWD.
168 EUROSAI Joint Report on Air Quality. See section 4 of Annex 9 to this SWD.

70
2014-2020 period, Member States have admittedly allocated a lower amount,
EUR 30 billion,169 favouring other transport modes such as rail.
Another example concerns projects supporting the use of biomass – as noted above in
relation to coherence with climate and energy policy, burning biomass may have negative
impacts on local air quality. In the 2007-2013 period, EUR 690 million was spent in
funding for biomass projects. In the 2014-2020 period, allocations of EUR 1.6 billion
were made for biomass, contributing to cohesion policy’s objective of supporting the
shift to a low-carbon economy, for which allocations were earmarked. The European
Court of Auditors also raised concerns about the coherence of biomass investments with
air quality objectives.
In addition, financing under the European Fund for Strategic Investments and the
Connecting Europe Facility (CEF) are expected to provide further indirect benefits for
air quality by funding projects that, for instance, support the modal shift towards railway
in the TEN-T network. Those programmes are also providing benefits for air quality by
funding projects that support the deployment of alternative fuels. For instance, under the
CEF funding objective ensuring sustainable and efficient transport systems (155 actions
with around EUR 930 million) many projects concern the deployment of alternative fuels
both in vehicles and for infrastructure.
Other EU funding instruments, including research programmes like Horizon 2020, have
also provided significant resources for projects that can support air quality objectives. It
can also be observed that EU funding instruments increasingly devote greater attention to
sustainable and low-carbon investments (which can, as pointed out above, bring about air
quality improvements - but impacts depend on the sources of renewable energy that
ultimately displace conventional energy generation).
When it comes to taxation as a means of influencing citizen behaviour, tax policies at
both EU and Member State levels may, in some instances, also be at odds with air quality
goals. The minimum levels of taxation for transport fuels set out in the Energy Taxation
Directive (2003/96/EC) (in its Article 7 and Annex I) set lower minimum tax rates per
litre for diesel than for petrol – with diesel being taxed at an around 8% lower level than
for unleaded petrol. Moreover, in 2017 most Member States had diesel taxes between
10% and 40% lower than petrol and, as of 1 January 2018, all but two Member States
(the United Kingdom and Hungary) taxed diesel fuel at a lower rate than petrol.170 These
tax incentives have encouraged greater private use of diesel vehicles, which – together
with weaknesses in the implementation of vehicle testing under the Type Approval
Framework during the evaluation period – may have worsened air quality.
169 COWI (2019). ‘Integration of environmental concerns in Cohesion Policy Funds’.
170 European Commission (2018). ‘Excise Duty Tables Part II Energy products and electricity’. See also
EEA indicator ‘Transport fuel prices and taxes’: https://www.eea.europa.eu/data-and-
maps/indicators/fuel-prices-and-taxes/assessment-2

71
International commitments
The UNECE Convention on Long-Range Transboundary Air Pollution (Air Convention)
is reflected in EU legislation in the Directive on the reduction of national emissions of
certain atmospheric pollutants (NEC Directive). Therefore, the conclusion on the strong
coherence between the latter directive and the AAQ Directives in the above sections also
applies to the Air Convention.
When it comes to emissions of air pollutants from ships, on the international level the
main act is Annex VI to the International Maritime Organization Convention for the
Prevention of Pollution from Ships (MARPOL), which sets rules on the progressive
reduction of SOx, NOx and particulate matter emissions from ships, as well as the
introduction of emission control areas for stricter requirements near cities and coastal
areas. Requirements for low sulphur content of marine fuels as expressed also via
requirements agreed under the rules of MARPOL have proven to be beneficial for air
quality.
Views of stakeholders171
A high number of respondents to the open public consultation (57%) considered
Directive 2008/50/EC to be more internally coherent than Directive 2004/107/EC (41%).
In responses to the targeted questionnaire, a relatively significant number of respondents
commented on issues relating to the internal coherence of the Directives (for example,
consistent approaches in setting limit values, consistency in the requirements of siting of
monitoring stations, coherence of alert thresholds).
Similarly, participants at the stakeholder workshops highlighted several areas where there
is a lack of internal coherence in or between the two AAQ Directives: (a) looking at the
provisions on the minimum number of monitoring stations (e.g. under Annex V of
Directive 2008/50/EC), it is not straightforward to establish the mix of types of sampling
points needed in each zone; (b) the absence of reference methods for modelling in Annex
VI of Directive 2008/50/EC; (c) and the provisions on air quality plans appear outdated,
as information still refers to measures adopted prior to June 2008.
As regards coherence with other EU Clean Air or environmental legislation, open public
consultation respondents considered the National Emissions Ceiling Directive to be
strongly coherent with the AAQ Directives, with 70% indicating that it either strongly
supports or supports the implementation of AAQ Directives. Coherence with the
Industrial Emissions Directives was seen similarly positively (71%). Of the small number
of industry respondents, most (4 out of 5) emphasised the need to ensure coherence
between the AAQ Directives and other legislation relevant to air quality, notably the
NEC Directive and the Industrial Emissions Directives – two commented that air quality
standards should be informed by what is feasible within the framework of the Industrial
Emissions Directive.
On coherence with other EU policies, open public consultation respondents believed that
the AAQ Directives support the EU Energy Union, Climate and low-emission mobility
policies, as well as Research and Innovation (Horizon 2020). At the same time
171 For an overview of the stakeholder feedback, and details of views of expressed by different
stakeholder groups in the open consultation, please also see Annex 2 to this SWD.

72
respondents, especially in the targeted questionnaires but across all stakeholder groups,
expressed concerns about the coherence between air quality goals and transport, energy
and climate policy. In particular the participants at the workshops and representatives in
the expert group expressed concern that greenhouse gas related measures taken in the
transport sector (for example, concerns about support for diesel vehicles), usually at the
national or local level, had the potential to undermine air quality.
However, looking at (sectoral) EU policies aimed at reducing emissions from specific
sources, the highest proportion of respondents commented positively on coherence
related to the emission standards for heavy goods vehicles (73%), noting that this
supports the implementation of AAQ Directives compared. This was closely followed by
emission standards for cars and vans (70%). Specific concerns were raised by several
stakeholders about the effectiveness of the Euro vehicle emissions standards in protecting
air quality (with one representative of a regional authority suggesting that the EU should
consider additional requirements for the existing fleet, not just new vehicles). According
to stakeholder comments at the workshops, Member States have struggled to meet air
quality standards due to weaknesses in the EU legal framework for vehicle emissions.
NGO and national authority respondents to the targeted questionnaire were also more
likely to cite concerns about the coherence between air quality, climate policy and
transport policy (and in particularly expressed concerns about support for diesel vehicles
in Member State responses to climate change challenges).
Other comments on sectoral policy focused on the treatment of biomass under the
Renewable Energy Directive, emissions standards for boilers under the Ecodesign
Directive, and air pollutant emissions from agricultural activities. Concerns about
emissions from biomass-generated heat tended to be raised by government authorities: of
the nine responses on this topic, seven were from national or local government
authorities.
Also, the common agricultural policy was deemed by respondents to the open public
consultation to potentially hamper implementation of the AAQ Directives. This issue was
also raised in the stakeholder workshops with a representative of a national NGO noting
that EU funding schemes for biomass and the common agricultural policy supported
various measures that increase air pollution. These have in turn made it difficult, in their
view, to obtain EU funding mechanisms that support actions for air quality at national
level, including under the CAP’s rural development funding.
Open public consultation respondents identified a lack of coherence in the
implementation of the AAQ Directives and a number of national policies, notably
taxation, public procurement, urban development policy and industrial policy.
Meanwhile, respondents were much more positive about mechanisms to promote
coordinated action between the EU and MS than between levels of government, or
ministries, within their country. In one of the stakeholder workshops, a representative of
a government health institute noted that permitting and spatial planning decisions in the
stakeholder’s Member State consider whether new activities are aligned with air quality
limit values, but this is not the case across the EU.

73
5.6. EU Added Value
Evaluation question: To what degree have common EU air quality standards and
comparable monitoring, reporting and assessment regimes enabled Member States
to take successful action beyond what would have been possible without EU action?
Overall response: There is a clear case for a harmonised approach to air quality through
the establishment of air quality standards and assessment framework at EU level. The
AAQ Directives have harmonised the criteria for monitoring Member States apply and
the air quality they aspire to. This has both enabled and prompted successful action
beyond what would have been the case without them. Three aspects stand out:
Firstly, the AAQ Directives introduced new and reinforced previous air quality standards,
which has led to a harmonised approach across Member States and contributed to the
overall reduction of air pollutant concentrations. What is more, by prescribing minimum
obligations for all Member States, the AAQ Directives are designed to equally protect the
health of all EU citizens and in this respect create a level playing field across the EU.
Secondly, the AAQ Directives’ common framework for air quality assessment and
monitoring have brought added value by providing reliable and comparable air quality
data across Member States, which has led to increased public awareness and supported
implementation and enforcement of air quality standards. Stakeholders overwhelmingly
agree that the AAQ Directives have been instrumental in motivating and framing action
in the Member States and achieving better air quality.
Thirdly, the AAQ Directives are in line with the principles of subsidiarity and
proportionality, leaving a substantial margin to the Member States in deciding how to
best achieve the prescribed objectives – to ensure the measures taken are appropriate and
cost-effective within the specific context of respective local and national circumstances.
What is the issue?
Obligations stemming from the AAQ Directives, like all requirements linked to EU
legislation, should be subject to the principle of subsidiarity, which is fundamental to the
functioning of the EU. Whereas air pollution is transboundary in nature, in many cases
the harmful effects of poor air quality become a local problem. The AAQ Directives are
specifically designed to tackle such local air quality problems (which tends to be a result
of the interplay of local, regional, national and transboundary air pollution, see Annex 5
to this SWD).
There is thus a need to demonstrate that there is a clear case for regulating air quality
standards as well as the corresponding monitoring, reporting and assessment regimes at
EU level, compared to leaving this for each Member State to tackle at national level.
What are the findings?
Common air quality standards
At the time of their respective adoption, the AAQ Directives introduced air quality
standards for five additional pollutants that had not been regulated at EU level before, i.e.
fine particulate matter (PM2.5) (limit and target values and the national exposure
reduction target), arsenic, cadmium, nickel and benzo(a)pyrene (target values). They also
reinforced pre-existent standards for other pollutants, i.e. particulate matter (PM10),

74
nitrogen dioxide (NO2) and nitrogen oxides (NOx), sulphur dioxide (SOs), ozone (O3),
carbon monoxide and benzene, which were in force at EU level prior to the adoption of
the two AAQ Directives (see also Annex 4).
Prior to their introduction at EU level, air quality standards varied considerably across
Member States in terms of the type of pollutants that were regulated, the level of
protection (weaker or stricter limits) and the legal nature of the regulations (binding or
voluntary, limit values or guidelines, obligation of results or obligation of means).172 For
instance, based on available data, when it comes to limit values for PM2.5 concentrations,
at least 13 Member States had no standards in force prior to the adoption of Directive
2008/50/EC. The situation is similar with respect to heavy metals, with at least nine
Member States without air quality standards in force for heavy metals before 2004.
In areas where the AAQ Directives have not introduced harmonising provisions, Member
States have adopted different solutions and approaches. This is the case with levels of
alert and information thresholds for PM10 and PM2.5 – which are not regulated at EU
level, or defined in the AAQ Directives – and which still vary significantly across the
EU. The alert thresholds for PM10 range from 50 µg/m³ (in Finland, Germany, and parts
of Italy) to 300 µg/m³ (in Poland). 173,174
In terms of the effects that EU air quality standards had on pollutant concentrations in
ambient air during the evaluation period, there is a declining trend across most regulated
pollutants, as shown above (see section 5.2). It should be kept in mind that effective air
quality policies often need to address several levels of governments, sectors and policy
areas, and take time to implement and have an effect. Correspondingly, when comparing
historical trends of emissions with temporal milestones for the adoption and transposition
of the AAQ Directives, no sudden or sharp declines can be observed. It is also difficult to
precisely attribute these developments to the implementation of the AAQ Directives’
standards, due to confounding factors that most likely have also impacted these trends
(e.g. legislation on emission sources, the National Emission Ceilings Directive, pre-
existent national legislation in place, prevalence of activity in certain sectors in specific
Member States).
Nevertheless, irrespective of the difficulties to precisely attribute the reduction of air
pollutant concentrations to their respective standards, stakeholders agree across the
board, corroborated by the conducted case studies, that the AAQ Directives have been
instrumental in achieving better air quality. The setting of EU air quality standards had
the added value of setting a common level of ambition across the EU and its single
market and providing a focused and complementary approach in dealing with pollutant
concentrations. Common air quality standards ensured the equal treatment of all EU
citizens, with the same level of health protection guaranteed.
172 Support study informing this Fitness Check, Section 6.3.1.1.
173 The situation regarding the information thresholds for PM10 is similar (ranging from 50 to 200 µg/m³).
174 Support study informing this Fitness Check, based on Wiesen (2017), Air Pollution Emergency
schemes, and EUROSAI Joint Report on Air Quality.

75
Common framework for assessment and monitoring
The AAQ Directives also introduced a common framework for assessment and
monitoring, which led to the availability of better quality and more comparable
information to the public.175 Although there is insufficient comprehensive evidence on
how and whether Member States would have changed their monitoring systems in the
absence of the AAQ Directives, it is likely that the differences would have remained,
imposing challenges in terms of data quality and comparability across Member States. It
further follows from the case studies that in the selected Member States the AAQ
Directives have contributed to a significant improvement of the monitoring network (e.g.
in Bulgaria, Germany or Ireland), shifted the focus of monitoring to areas where the most
population lives (Slovakia, Spain) or prompted national coordination and quality
assurance of monitoring of air pollution (Italy).
In addition to the common framework set out by the provisions of the AAQ Directives,
the Commission also provided various guideline documents (e.g. guidelines on setting up
common measuring stations for PM2.5) as well as networks to ensure the quality of
assessment information generated through monitoring, modelling or objective estimation.
Examples of such networks include the Forum for Air Quality Modelling in Europe
(‘FAIRMODE’) and the Network of Air Quality Reference Laboratories (‘AQUILA’).
Effective monitoring and assessment of air quality and collection and dissemination of
comparable and reliable data has been of key importance in ensuring awareness and
access to information on air quality to the wider public. The comparability and reliability
of data allows for direct and easy comparison of the air quality situation in different
Member States, which is further facilitated by the information products of the European
Environment Agency, such as the annual report ‘Air quality in Europe’176 or the
European Air Quality Index,177 where consolidated historic as well as near-real-time air
quality information across Europe is presented in a visually clear and user-friendly
manner.
To promote exchanges on successful air quality measures and lesson learnt between
practitioners, the Commission has supported Member States, both at national and local
level, via targeted awareness raising and dissemination of good practices.
In that regard, the Commission has engaged with Member States in bilateral structured
exchanges – Clean Air Dialogues – designed to foster the collaborative approach
required to deliver actions for enhancing air quality and reducing air pollution in the
future, with the involvement of national, regional, and local levels of governance and
other stakeholders. By the end of 2018, Clean Air Dialogues have been held with six
Member States, see Box 12.
175 COWI et al. (2019). Support study to inform this fitness check (see section 6.3.1.2).
176 Latest edition: EEA Report 10/2019. ‘Air quality in Europe – 2019 report’.
177 http://airindex.eea.europa.eu/

76
Box 12 – Clean Air Dialogues held in 2017 and 2018
• Clean Air Dialogue with Ireland – Dublin, 1-2 March 2017
• Clean Air Dialogue with Luxembourg – Luxembourg, 29-30 June 2017
• Clean Air Dialogue with Hungary – Budapest, 3-4 October 2017
• Clean Air Dialogue with Slovakia – Bratislava, 24-25 April 2018
• Clean Air Dialogue with Spain – Madrid, 8-9 October 2018
• Clean Air Dialogue with Czechia – Prague, 7-8 November 2018
A full overview as well as the shared conclusions from each Clean Air Dialogue are available at:
https://ec.europa.eu/environment/air/clean_air/dialogue.htm
Furthermore, in the context of the Environmental Implementation Review ‘Peer-to-Peer’
tool, several multi-country workshops focused on the implementation of clean air
policies, see Box 13. In addition, a biennial Clean Air Forum was launched by the
European Commission in 2017 to reinforce the capacity of stakeholders to improve air
quality.178
Box 13 – TAIEX-EIR PEER 2 PEER Workshops focussed on clean air policies in 2018
• Monitoring air pollution impacts on ecosystems, Lisbon (with 6 Member States)
• Road Transport Emission Reduction, Prague (with 4 Member States)
• Air pollution from household heating, Bratislava (with 13 Member States)
• Air quality programmes and their effectiveness, Graz (with 15 Member States)
• Ammonia emissions from agriculture, Budapest (with 24 Member States)
• Air quality policy implementation related to ozone, Madrid (with 22 Member States)
A full overview and links are available at: http://ec.europa.eu/environment/eir/p2p/index_en.htm
Raising citizen awareness and thus motivating action by competent authorities, making
comparable and reliable data available has supported enforcement efforts in the Member
States as well as by the Commission on EU level. This finding is corroborated by
numerous proceedings before national courts brought by NGOs demanding the
elaboration or implementation of appropriate air quality plans (for instance, in Austria,
Bulgaria, Czechia, France, Germany, Hungary, the Netherlands, Poland, Slovakia,
Sweden and the United Kingdom)179 as well as successful judicial action against Member
States with highest air pollutant concentrations before the Court of Justice of the
European Union.180
In relation to proceedings in front of national courts and the right to access to justice, the
European Court of Auditors pointed out that the AAQ Directives do not contain a
corresponding specific provision.181 It should be noted that the reason for this is that, at
the time of the adoption of Directive 2008/50/EC, the Council and Parliament had before
178 http://ec.europa.eu/environment/air/clean_air/forum.htm
179 Support study informing this Fitness Check, Appendix H; see also Annex 6 to this SWD for relevant
case law.
180 See Annex 6 to this SWD for an overview of completed and pending infringement proceeding before
the Court of Justice of the European Union.
181 European Court of Auditors Special Report on Air Pollution. See section 1 of Annex 9 to this SWD.

77
them a separate Commission proposal aimed at ensuring broad access to justice in
environmental matters.182 This would have rendered superfluous the need for specific
access-to-justice provisions in the AAQ Directives but there was insufficient Council
support for this separate proposal. Nevertheless, despite the lack of a specific legislative
provision, the AAQ Directives confer substantive health-related rights on individuals and
NGOs which national courts should be ready to protect, as illustrated by the case law of
the Court of Justice of the European Union.183 The Commission has drawn attention to
this case law in its 2017 notice on access to justice in environmental matters.184
The analysis also revealed aspects in which the AAQ Directives could have been more
effective in bringing EU added value. As evidenced in particular by reports from the
European Court of Auditors and from EUROSAI (see Annex 9 to this SWD), certain
provisions of the AAQ Directives on the siting of monitoring stations offer a degree of
flexibility to the Member States which may, within the boundaries of this flexibility, lead
to limited differences in monitoring and assessment. In addition, stakeholders have noted
the lack of coordination between different levels of governance in a single Member State
– i.e. between national, regional and local authorities, based on how the Member State
concerned has defined their respective competence in the field of air quality – in dealing
with exceedances of EU air quality standards.
Principles of subsidiarity and proportionality
The analysis shows that the AAQ Directives are in line with the principle of subsidiarity.
The AAQ Directives only require Member States to designate at the appropriate levels
competent authorities and bodies responsible for different aspects of air quality
management,185 while leaving the decision on the exact division of responsibility to the
Member States, which are best placed to make such a decision in full consideration of
their respective circumstances.
However, by prescribing minimum standards for air quality, the AAQ Directives impose
the same air quality objectives to all Member States with the freedom to go further. In
this way, they help create a level playing field between the Member States and contribute
to the reduction of transboundary air pollution by addressing pollution sources that
usually have both local and transboundary impact (see Annex 5 to this SWD).
In terms of the principle of proportionality, the AAQ Directives call for appropriate
measures and do not require to go beyond what is necessary to tackle the problem
efficiently. The approach does not generate unjustified costs as such and leaves as much
scope as possible for decisions to be taken at the local level.
182 COM(2003)624. ‘Proposal for a Directive of the European Parliament and of the Council on access to
justice in environmental matters’.
183 See section 3 of Annex 9 to this SWD.
184 C(2017)2616. ‘Commission Notice on Access to Justice in Environmental Matters’.
185 Article 3 of Directive 2008/50.

78
Views of stakeholders186
The views of stakeholders are in line with the above conclusions. Respondents in the
open public consultation agreed almost unanimously that EU level legislation is
necessary to improve air quality at national, regional and local level (94%), as well as to
address transboundary air pollution across different Member States (91%).
Also a recent representative survey in all Member States (Eurobarometer 2017, with
more than 27 000 respondents) confirmed that almost half of Europeans think the issue of
air pollution can best be addressed at the EU level (48%), while a third (33%) thinks that
it is better addressed at the national one, and 14% favour action focussed at the regional
or local level. When looking at the results per country, in as much as 20 Member States
the EU level is seen as the best suited to address the issue of air pollution.
Stakeholders across sectors, i.e. national, local and regional authorities, NGOs, industry
and the scientific community, agree that the AAQ Directives have been instrumental in
creating pressure and incentivising action to improve air quality. Stakeholders also
pointed out that this pressure was further increased by the enforcement action by the
Commission. There is also agreement among NGOs and authorities at different levels
that the AAQ Directives have improved air quality through the reduction of air pollutant
concentrations (e.g. of sulphur dioxide as the most prominent example).
Box 14 – Air Quality Partnership under the Urban Agenda for the EU
The Urban Agenda for the EU187 brings together Member States, cities, the European
Commission and other stakeholders in order to promote their cooperation across different levels
of governance on urban challenges such as economic growth, liveability, innovation and social
challenges. Under this umbrella a bespoke air quality partnership188 was established, and focussed
on Better Regulation, Better Funding and Better Knowledge to reduce air pollution.
When it comes to Better Regulation, the Partnership recommended a precautionary approach to
actions that may impact air quality and health, focusing on health improvements through better
air quality, and exploring the extension of source emission legislation. The Partnership also
identified a lack of communication on air quality plans and measures across levels of governance
as a factor hindering coherent action across these levels.
Specifically, members of the Partnership criticised that local and regional authorities are often
responsible for drafting and implementing air quality plans but do not have the competence to
implement all the measures defined in the plan. The Partnership also found a lack of EU funding
directly targeted towards air quality improvement in general, and for drafting and implementation
of air quality plans in particular.
As it follows from the responses to the targeted questionnaire, key factors identified by
stakeholders for making the AAQ Directives more effective than national legislation
alone are EU enforcement capacity, including through infringement procedures, reporting
186 For an overview of the stakeholder feedback, and details on views of expressed by different
stakeholder groups in the open consultation, please also see Annex 2 to this SWD.
187 https://ec.europa.eu/futurium/en/urban-agenda-eu/what-urban-agenda
188 https://ec.europa.eu/futurium/en/air-quality

79
and monitoring coordination by the EEA, and the establishment of supporting networks
facilitating the sharing of good practices.
Conversely, a main hindering factors mentioned include the lack of coordination between
different levels of governance within Member States, the distribution of responsibilities
between those levels (this aspect was particularly mentioned at the stakeholder
workshops but was not directly attributed to the AAQ Directives) as well as a lack of
guidance on the use of modelling in air quality assessment – as identified, for example,
the consolidated feedback by Air Quality Partnership under the Urban Agenda for the
EU, see Box 14.
Another limitation flagged by respondents was the limited mandate for action concerning
the cross-border air pollution in the AAQ Directives (as raised by several NGOs and
national authorities), see Box 15.
Box 15 – Transboundary cooperation
The AAQ Directives foresee cooperation between Member States and, where appropriate, joint
activities if air quality standards are not met due to significant transboundary transport of air
pollutants or their precursors (Article 25 of Directive 2008/50/EC). While this legal framework
has been used formally only once, EU support for transboundary cooperation on air quality has
been taken up in several instances, including projects under the LIFE programme,189 Interreg,190
and the TAIEX-EIR-Peer2Peer tool,191 which specifically facilitates exchanges of good practices
and knowledge between public administrations of different Member States. Progress in
monitoring and reporting over the past decade has also improved air quality data on
transboundary contributions to exceedance situations, resulting in potential for more coordinated
action across Member States.
189 http://ec.europa.eu/environment/life/project/Projects/index.cfm
190 Interreg provides a framework for joint action between Member States to address common challenges
such as air quality, including opportunities for cross-border, transnational and interregional
cooperation, https://ec.europa.eu/regional_policy/en/policy/cooperation/european-territorial
191 http://ec.europa.eu/environment/eir/p2p/index_en.htm

80
6. CONCLUSIONS192
Clean air is essential to human health. It is also essential to sustaining the environment,
and provides multiple economic and social benefits. There is well-established and robust
scientific evidence of the harmful effects of air pollution, and this points to a clear need
for action. Air quality continues to be relevant and of high concern to citizens across the
EU, with a clear expectation for policy to act. #Section5.1
The current AAQ Directives constitute the third generation of EU level air quality
policies since the early 1980s, and have inherited many provisions, including many air
quality standards, from predecessor legislation. This history has resulted in a degree of
maturity in the legislative framework, which, over the past decade, has delivered
measurable improvements of air quality in many, if not most parts, of the EU. #Annex4
The AAQ Directives have been partially effective in achieving their overall objectives of
reducing air pollution and curbing its adverse effects. While they have guided the
monitoring of air quality, set clear air quality standards, and facilitated the exchange of
information on air quality, they have not fully ensured that sufficient action is taken
throughout the EU to meet air quality standards and keep exceedances as short as
possible, resulting an overall mixed picture. #Section5.2
EU level air quality policies have had some success. The European Parliament earlier this
year acknowledged that ‘air quality in Europe has seen a slow but steady improvement
over the past decades and European legislation has been the main driver for this
beneficial development’.193 Similarly, the EU Council of Ministers stressed in December
2018 that air quality has significantly improved with the adoption of Union air quality
standards with the Ambient Air Quality Directives as major drivers of such
improvements.194 #Annex9
The number and magnitude of exceedances has decreased for most pollutants throughout
the EU between 2008 and 2017. Fewer Member States report exceedances today than ten
years ago, and the highest pollution peaks for particulate matter and nitrogen dioxide
have decreased substantially in most Member States. Similarly, the number of people
exposed to air pollution above EU air quality standards has declined steadily, see
Figure 11. #Section5.2, #Annex7
However, despite this overall improvement, the air quality challenge is far from solved.
For several air pollutants, especially particulate matter, nitrogen dioxide, ozone and
benzo(a)pyrene, widespread and persistent exceedances above EU air quality standards
continue, and still lead to significant impacts on human health and the environment as a
whole. Air pollution is still the number one environmental health risk in the EU (and
world-wide). #Section3.2, #Section5.2, #Figure8
192 For ease of read, each paragraph in this section includes a reference the section of the SWD it is based
on, marked in with a #, e.g. #Section5.2.
193 European Parliament resolution on ‘A Europe that protects: Clean air for all’. See also section 5 of
Annex 9 to this SWD.
194 Conclusions of the Council of the European Union no. 14794/18, 20 December 2018.

81
In this light, it is clear that the AAQ Directives have not met all of their objectives in full,
in particular due to the lack of implementation by Member States. The European Court of
Auditors, for example, concluded that EU action to protect human health from air
pollution had not delivered the expected impact. Their audit noted that the significant
human and economic costs of air pollution have not yet been reflected in adequate action
across the EU.195 Also, the EU Council of Ministers notes that not all goals of the AAQ
Directives have been fully met.196 #Annex8
Figure 11 – Urban population exposed to air pollution concentrations above selected
limit and target values197
6.1. Clear air quality standards
The AAQ Directives set air quality standards for a total of 13 air pollutants, namely for
sulphur dioxide (SO2), nitrogen dioxide (NO2) and nitrogen oxides (NOx), particulate
matter (PM10 and PM2.5), ozone (O3), benzene, lead (Pb), carbon monoxide (CO), arsenic
(As), cadmium (Cd), nickel (Ni), and benzo(a)pyrene. These standards take the form of
limit values, target values, critical values, alert and information thresholds or long term
objectives. #Section 2.3, #Section 3.2, #Section 5.1
Scientific evidence of the harmful effects of the air pollutants covered by the AAQ
Directives has been periodically reviewed and further consolidated: all the pollutants
covered by the AAQ Directives have harmful effects. On balance, the evidence does not
support including other pollutants: there are to date no established WHO Guidelines on,
for example, black carbon or ultrafine particles. The WHO Guidelines are currently
under revision with an expected publication date in the early 2020s.198 #Section5.1
195 European Court of Auditors Special Report on Air Pollution. See section 1 of Annex 9 to this SWD.
196 Conclusions of the Council of the European Union No. 14794/18, 20 December 2018.
197 Urban areas provide a home to more than 70% of the population of the EU. Their high population
densities in urban areas and related economic activities result in increased emissions of air pollutants,
which in turn lead to higher ambient concentrations of these pollutants and greater exposure to them.
https://www.eea.europa.eu/data-and-maps/indicators/exceedance-of-air-quality-limit-3/assessment-4.
198 http://www.euro.who.int/en/health-topics/environment-and-health/air-quality/activities/update-of-who-
global-air-quality-guidelines (accessed: 18 May 2019).

82
It should be noted that while the EU air quality standards have been set taking into
account the WHO Guidelines, other important considerations included information on the
technical feasibility of meeting different standards, and their costs and benefits. For some
pollutants, such as nitrogen dioxide, EU air quality standards are currently aligned with
the WHO Guidelines: for others, they are less ambitious than the levels recommended:
most notably for particular matter, especially fine particulate matter, sulphur dioxide,
benzene and benzo(a)pyrene (and to a lesser extent, ozone). #Section5.1
Especially the discrepancy in fine particulate matter (PM2.5) continues to cause concern,
as scientific evidence points to substantial health impacts attributable to exceedance of
the WHO Guidelines (noting that there are no observed safe levels of fine particulate
matter).199 The European Parliament thus also urges to act without delay on fine
particulate matter by proposing the introduction of more stringent compliance values for
these particles in EU legislation.200 #Section5.1
At the same time, the EU air quality standards are not fully met throughout Member State
territories and the quality of life of EU citizens remains hampered. A high number of 20
Member States still report exceedances above EU limit values for at least one pollutant -
in particular for particulate matter, nitrogen dioxide, ozone and benzo(a)pyrene. For fine
particulate matter (PM2.5) specifically, 7 Member States reported exceedances above EU
limit values and WHO Guidelines, in 2017. #Section5.2 #Annex7
Therefore, two somewhat contradictory shortcomings remain: on the one hand, EU air
quality standards are not fully aligned with existing scientific advice; on the other hand,
due to insufficiently effective air quality plans and lack of commitment to take
appropriate measures by Member States, there have been (and continue to be) substantial
delays in taking appropriate and effective measures to meet the existing air quality
standards. #Section5.1 #Section5.2
Air quality data over the past decade supports the conclusion that EU air quality
standards as such have been instrumental in driving concentrations of air pollutants
downward and reducing exceedance levels albeit subject to, at times considerable,
delays. More comprehensive requirements, complemented with appropriate guidance, as
regards air quality plans, their timeframes and implementation, might have made them
more operational and yielded faster and better results (see below).
6.2. Representative high-quality monitoring of air quality
Across the EU, Member States have established more than 4 000 monitoring stations,
based on common criteria and using common approaches defined by the AAQ
Directives. This includes criteria for determining minimum numbers of sampling points,
for data quality and acceptable uncertainty in monitoring and modelling, as well as for
macroscale and microscale siting of sampling points. #Section3.1
199 The World Health Organization (2013), ‘Review of evidence on health aspects of air pollution’ notes
that “the adverse effects on health of particulate matter (PM) are especially well documented” and
“there is no evidence of a safe level of exposure or a threshold below which no adverse health effects
occur.”
200 European Parliament resolution on ‘A Europe that protects: Clean air for all’. See also section 5 of
Annex 9 to this SWD.

83
The monitoring network set up by the competent authorities at national level, by and
large adheres to the provisions of the AAQ Directives, and ensures that reliable and
representative air quality measurements and data are available. There have been and still
are instances when and where, in specific air quality zones or agglomerations, air quality
monitoring does not live up to the criteria the AAQ Directives set: where this is the case,
the Commission has intervened, including via infringement proceedings. #Section5.3
The criteria, as defined by the annexes of the AAQ Directives, offer some flexibility to
competent authorities so that air quality monitoring networks are optimally set up
depending on the respective local circumstances. These flexibilities are limited by the
requirement to provide information both for where the highest concentrations of air
pollutants occur and for other areas which are representative of the exposure of the
general population. Both are difficult to verify objectively. #Section5.3
Concerns have been raised that the criteria as defined offer too much leeway to
competent authorities and that more restrictively defined siting criteria or (additional)
guidance would help ensure a higher degree of confidence in the comparability of
monitored air quality. A number of ambiguities as regards the siting criteria have been
identified, but these have not been found to have led to systemic shortcomings in the
monitoring network. On balance, air quality information collected and reported appears
to deliver air quality data that is robust and of satisfactory quality to act upon.
#Section5.3
It emerges from the above analysis that the monitoring network benefits from continuous
investment to ensure it is well maintained and adapted to local realities, and additional
guidance that address the ambiguities in the siting criteria or further strengthen the
approaches to air quality modelling would improve the comparability of air quality
information further.
6.3. Reliable, objective, comparable information on air quality
Effective monitoring and assessment of air quality and collection and dissemination of
comparable and reliable data has been of key importance in ensuring awareness and
access to information on air quality to the wider public. #Section 3.3
The AAQ Directives revised the provisions on reporting and dissemination of public
information enabling the establishment of improved reporting systems. As of 2014, the
EEA has successfully maintained an upgraded air quality e-Reporting database serving as
a hub for all reporting requirements, including both official reporting of validated air
quality data as well as up-to-date data reported by Member States. #Section 5.3
The air quality data reported by Member States is made available to the public by the
EEA (in full); both in their original form, as well as via aggregated assessment data. The
latter is the basis for annual air quality reports. This information has been increasingly
made available, and accessed, by a wider public: for example, the number of visits to the
EEA air quality website pages has increased nine-fold since 2008. #Section 3.5
Air quality information is also made available by national, regional and local authorities,
and more recently also by private operators (usually based on the officially reported data
made available via the EEA, and augmented by data from remote sensing and air quality
sensors). At this level, the information provided can be less comparable, partly because
the variety in approaches and metrics used. #Section 5.3

84
The AAQ Directives have not, for example, defined information and alert thresholds for
some pollutants (in particular, for particulate matter), which has resulted in a
non-harmonised approach in terms of information to the public for some pollutants
across Member States, entailing extensive differences also in government and/or media
coverage of alarming levels of air pollution. Similarly, the absence of a common metric
used for publicised Air Quality Indices often means that the same data is presented in
different ways in different locations. The Commission and the EEA have thus introduced
a European Air Quality Index in 2017. #Section 5.6
Overall, the AAQ Directives have facilitated the availability and accessibility of reliable
and comparable air quality data across the EU, including by providing a clear structure to
ensure the use of modern information technology – with a clear EU added value. Further
harmonisation of the way air quality information is presented would be both possible and
desirable, and help ensure even higher comparability. #Section 5.3, #Section5.6
It can be concluded that there might be further scope to make use of the possibilities
afforded by the use of e-Reporting, including an acceleration of reporting of validated air
quality data (currently due nine months after the end of any given year) – but this would
require additional feasibility assessments
6.4. Action to avoid, prevent and reduce the impact of poor air quality
The AAQ Directives introduced a specific requirement to take action when air quality
does not meet the agreed standards. Such action requires both the preparation and
implementation of air quality plans for zones and agglomerations within which
concentrations of pollutants in ambient air exceed the relevant air limit values under
Directive 2008/50/EC; or the adoption of all necessary measures not entailing
disproportionate costs when target values set by Directive 2004/107/EC are exceeded.
#Section 3.4
Stakeholder feedback and case studies confirm that the requirements to adopt air quality
plans or all necessary measures are among the most fundamental and compelling
elements of the AAQ Directives for incentivising remedial action by the Member States.
In practice, almost all Member States have had to prepare air quality plans as required by
the AAQ Directives for air quality zones and agglomerations that have seen exceedances
of the EU air quality standards. This split of responsibilities between different levels of
government is appropriate and reflects the principle of subsidiarity. #Section 5.2
While the AAQ Directives establish a common format and key elements that such plans
need to cover, it does not prescribe a clear timeframe and the measures that need to be
taken or considered: this is left to the competent national authorities with a view to
ensure that the most cost-effective measures are taken to end the exceedances as soon as
possible. Besides economic considerations, coordination and consistency of action
between authorities within and beyond the Member States is essential and has often been
insufficient. #Section5.5, #Section5.6
Improvements in air quality critically depend on action taken by Member States to
address the sources of air pollution that lead to the exceedances in the specific
circumstances, and typically require action in the transport sector, energy (including
domestic heating) and agricultural sectors or by industry actors. And such improvements
need to rely on coherent action. Measures to improve air quality are thus not solely
steered by the air quality plans but also influenced by other EU legislation as well as by

85
governance arrangements at national level, and this offers scope for synergies with other
Community objectives and policies in different fields. #Section 3.4, #Section 5.5
Synergies with climate, energy and transport policies have been strengthened over the
past decade, but would yield greater benefits if further improved and made more
coherent. The European Court of Auditors pointed out that some EU policies do not
sufficiently reflect the importance of air pollution. Specifically, stakeholder feedback
identified instances where the implementation of other EU policies may not fully support
the implementation of the AAQ Directives. This includes in particular the promotion of
biomass combustion for energy production under the climate and energy policy, the
shortcomings in the implementation of EU Type Approval Framework for cars in relation
to NOx emissions or the choices made by some Member States to support diesel over
petrol with a view of reducing greenhouse gas emissions. Some of the above
incoherencies or hindrances have been addressed by recent adjustments to related
regulatory frameworks (e.g revised Type Approval Framework). This fitness check can
feed into review processes and reflections regarding sectoral legislation. #Section 5.5
Furthermore, the persistent widespread exceedances for some pollutants indicate that
action taken to date has not been sufficient to improve air quality as quickly as possible.
The European Court of Auditors pointed out that air quality plans and measures suffered
from serious deficiencies, including a lack of coordination between national and local
authorities, the absence of costing or funding, and the non-provision of information about
the real impact of measures taken on air quality. #Annex 9
While the approach to air quality plans can certainly be improved, the clear requirement
to take remedial action when and where exceedances are observed has been decisive in
triggering improvement in air quality, yet often with delay.
6.5. Simplification and burden reduction potential
This fitness check evidenced a number of provisions of the AAQ Directives that have
become redundant since 2008, meaning that they have been exhausted or have lost
relevance. Whereas these provisions are no longer necessary, they do not affect the
implementation of the other provisions of the AAQ Directives. #Section 5.1
When it comes to monitoring and its costs, the AAQ Directives are designed in a way to
decrease the burden associated to fixed monitoring stations depending on the observed
levels of air pollutant concentrations. In other words, as air pollution decreases, so do the
minimum monitoring requirements. This means that the proportionality of the monitoring
costs is ensured by the very design of the AAQ Directives. #Section 5.3
The same cannot be said for the reporting requirements of the AAQ Directives which are
extensive and not decreasing as a function of air pollutant levels. However, the removal
of any of the reporting requirements in the AAQ Directives would involve a change in
the structure of e-reporting and would thus require further assessment of the broader
consequences and administrative burden implications of such changes. #Section 5.3
Redundant provisions have been identified in the AAQ Directives as well as elements
that could reduce administrative burden in terms of air quality reporting.

86
6.6. Some lessons learned
This fitness check shows that over the past decade, the AAQ Directives have guided the
establishment of a representative high-quality monitoring of air quality, set clear air
quality standards, and facilitated the exchange of reliable, objective, comparable
information on air quality, including to a wider public.
At the same time, the AAQ Directives have been less successful in ensuring that
sufficient action is taken to meet air quality standards and keep exceedances as short as
possible. Having said that, the evidence shows that they significantly contributed to a
downward trend in air pollution and reduced the number and magnitude of exceedances.
This partial success allows to conclude that the AAQ Directives have been broadly fit for
purpose, with clear shortcomings as regards achieving the overarching ambition to fully
meet all air quality standards for all pollutants and throughout the European Union
according to the timelines foreseen in the AAQ Directives at the time of adoption.
This points to scope for improvements to the existing framework for air quality
management. In particular, it emerges from this fitness check that additional guidance, or
clearer requirements in the AAQ Directives themselves, could help to make monitoring,
modelling and the provisions for plans and measures more effective and efficient.
Specifically, this fitness check identifies several lessons learnt to be considered in the
follow up to this fitness check, including the below:
• air pollution continues to be a major health and environmental concern to the citizens
of the EU, and surveys show it to be one of the two most important environmental
issues (the other being climate change) – a relative majority of citizens share the view
that the issue of air pollution can be best addressed at the EU level: this underlines
the continued relevance of the AAQ Directives;
• the EU air quality standards have been instrumental in driving a downward trend in
exceedances and exposure of population to exceedances – however, the current air
quality standards are not as ambitious as established scientific advice suggests for
several pollutants, especially fine particulate matter (PM2.5); the WHO Guidelines are
currently being reviewed, and the Commission is following this closely;
• trends in exceedance levels for fine particulate matter (PM2.5) indicate that limit
values have been more effective in facilitating downward trends than other types of
air quality standards, such as target values – especially where this has been done in
conjunction with an exposure concentration obligation requirement and national
emission reduction targets as established under the NEC Directive;
• enforcement action by the European Commission and in particular also by civil
society actors in front of national courts (under general right to access to justice
provisions, as there are no explicit provisions in the AAQ Directives on this) has
resulted in actionable rulings, shown that the legislation is enforceable, and proven to
be important to accelerate downward trends for air pollution;
• the AAQ Directives have given flexibility to competent national authorities to ensure
air quality monitoring and air quality measures optimally fit local circumstances in
line with the principle of subsidiarity – yet additional guidance or implementing acts

87
could help to further harmonise approaches applied to monitoring, information
provisions, and air quality plans and measures;
• for air quality data, not all data reported is equally useful and the successful
establishment of an EU-wide e-reporting based on machine-readable formats now
allows for further efficiency gains – and opens the way for further up-to-date
reporting of air quality data and to make further use of air quality modelling (which is
increasingly reported, but would benefit from further guidance).

88
Annex 1: Procedural information and evidence used
1. Lead DG, Decide Planning/CWP references
The fitness check of the Ambient Air Quality Directives is led by the Directorate General
for Environment. It was included as item PLAN/2016/88 in the Agenda Planning.
2. Organisation and timing
This fitness check started in July 2017.
An Interservice Group to steer the evaluation was set up in 2017 with representatives
from the Secretariat-General (SG), Directorates-General for Economic and Financial
Affairs (ECFIN); Agriculture and Rural Development (AGRI); Mobility and Transports
(MOVE); Energy (ENER); Environment (ENV); Climate Action (CLIMA); Research
and Innovation (RTD); Joint Research Centre (JRC) and Regional and Urban Policy
(REGIO). Invitations and regular updates were also sent throughout the process to the
Legal Service (SJ); Directorates-General for Internal Market, Industry, Entrepreneurship
and SMEs (GROW); Maritime Affairs and Fisheries (MARE); Taxation and Customs
Union (TAXUD) and Health and Food Safety (SANTE).
The Interservice Group met eight times during the evaluation process.
Timeline
12 Jul 2017 (COM) 1st ISG meeting: discussion of overall process, draft road map and
draft terms of reference for the support study
26 Jul 2017 (EXT) Publication of the Roadmap201 on the Better Regulation Portal
(public feedback closing date: 23 Aug 2017)
21 Sep 2017 (COM) 2nd ISG meeting: discussion of outcome of the public consultation
on the draft roadmap, discussion and finalisation of the draft terms
of reference for the support study
19 Oct 2017 (Other) Launch of the service request to the contractors under the
Framework Contract ENV.F.1/FRA/2014/0063
(Ares(2017)5105087) (closing date to submit offers: 9 Nov 2017)
16-17 Nov 2017 (Other) 1st Clean Air Forum202 in Paris, France
22 Dec 2017 (COM) Signature of the contract for the support study with the
consortium led by COWI
29-30 Jan 2018 (MS) Ambient Air Quality Expert Group meeting with a session on the
fitness check on 30 Jan 2018
201 https://ec.europa.eu/info/law/better-regulation/initiatives/ares-2017-3763998_en
202 https://ec.europa.eu/info/events/cities-events/clean-air-forum-2017-nov-16_en

89
1 Feb 2018 (COM) 3rd ISG meeting: discussion of the consultation strategy and the
draft inception report for the support study, feedback received from
the Ambient Air Quality Expert Group, results of stakeholder
consultation and 1st draft of evaluation report
8 May 2018 (EXT) Launch of the open public consultation203 of the fitness check
(closing date 31 Jul 2018)
21-25 May 2018 (Other) Green Week 2018 – Green cities for a greener future – session
dedicated to the fitness check
18 Jun 2018 (EXT) 1st stakeholder workshop204 on the fitness check of the Ambient
Air Quality Directives
5 Jul 2019 (MS) Ambient Air Quality Expert Group meeting focussed on AAQ
fitness check
10 Jul 2018 (COM) 4th ISG meeting: discussion of the results of the first stakeholder
workshop held on 18 June 2018 and the feedback from the Ambient
Air Quality Expert Group
31 Jul 2018 (EXT) End of the open public consultation
11 Sep 2018 (Other) Publication of the European Court of Auditors Special Report
no. 23/2018: ‘Air pollution: Our health still insufficiently
protected’205
18 Oct 2018 (COM) 5th ISG meeting: update on the conclusion of the open public
consultation, presentation of the initial findings emerging from the
support study
24-25 Oct 2018 (MS) Ambient Air Quality Expert Group meeting with a session on the
fitness check on 25 Oct 2018
12 Dec 2018 (Other) Opinion of the European Economic and Social Committee on the
‘Clean air for all’ Communication of the Commission206
12 Dec 2018 (Other) Exploratory opinion of the European Economic and Social
Committee: ‘Implementation of EU environmental legislation in
the areas of air quality, water and waste’207
203 https://ec.europa.eu/info/consultations/public-consultation-support-fitness-check-eu-ambient-air-
quality-directives_en
204 https://ec.europa.eu/info/events/stakeholder-workshop-support-fitness-check-eu-ambient-air-quality-
directives-2018-jun-18_en
205 See section 1 of Annex 9 to this SWD.
206 See section 2 of Annex 9 to this SWD.
207 NAT/744-EESC-2018-02510.

90
20 Dec 2018 (Other) Conclusions of the Council of the European Union on the
European Court of Auditors Special Report no. 23/2018 on air
pollution208
15 Jan 2019 (EXT) 2nd Stakeholder Workshop209 on the fitness check of the Ambient
Air Quality Directives
30 Jan 2019 (Other) Joint report on air quality by the European Organisation of
Supreme Audit Institutions (EUROSAI)210
12 Feb 2019 (COM) Up-stream meeting with the Regulatory Scrutiny Board
11-12 Mar 2019 (MS) Ambient Air Quality Expert Group meeting with a session on the
fitness check on 11 Mar 2019
12 Mar 2019 (COM) Written update in lieu of 6th ISG meeting, on the 2nd Stakeholder
workshop of 15 Jan 2019, upstream meeting with the Regulatory
Scrutiny Board of 12 Feb 2019 and on the support study
12 Mar 2019 (Other) European Parliament resolution on the Commission
Communication ‘A Europe that protects: Clean air for all’211
8 Apr 2019 (COM) 7th ISG meeting: discussion of the findings and the quality of the
draft final report of the support study
21 May 2019 (COM) 8th ISG meeting: discussion of the draft Staff Working Document
for the conclusion of the fitness check
17 Jul 2019 (COM) Meeting with the Regulatory Scrutiny Board
19 Jul 2019 (COM) First opinion of the Regulatory Scrutiny Board
23 Oct 2019 (COM) Finalisation of the support study ‘Supporting the fitness check of
the EU Ambient Air Quality Directives (2008/50/EC,
2004/107/EC)’
6 Nov 2019 (COM) Second opinion of the Regulatory Scrutiny Board
xx Nov 2019 (COM) Launch of the Inter-service consultation on the final Staff
Working Document
LEGEND
(COM)
(MS)
(EXT)
(Other)
Interservice Group or Regulatory Scrutiny Board
Member States input via Ambient Air Quality Expert Group
(External) stakeholder input (including stakeholder consultation)
Other key events or input
208 See section 3 of Annex 9 to this SWD.
209 https://ec.europa.eu/info/events/second-stakeholder-workshop-support-fitness-check-eu-ambient-air-
quality-directives-2019-jan-15-0_en
210 See section 4 of Annex 9 to this SWD.
211 See section 5 of Annex 9 to this SWD.

91
3. Exceptions to the Better Regulation Guidelines
No exceptions were made to the Better Regulation Guidelines212 during this fitness check.
4. Consultation of the Regulatory Scrutiny Board
In relation to this fitness check, the Regulatory Scrutiny Board (RSB) delivered a
positive opinion with comments on 6 November 2019. The following table provides
information on how the comments made have been addressed in this Staff Working
Document:
RSB comments Reflection in text
(1) The report does not sufficiently discuss how societal developments and changing awareness
of citizens about air pollution have influenced the relevance of the legislation and its air
quality standards.
Public perceptions and debate around air
pollution have evolved since the adoption of
the EU Ambient Air Quality Directives. The
report would benefit from a discussion of these
developments and their effect on the relevance
of the directives. It should analyse to what
extent the directives and their air quality
standards meet the population’s current needs
and requirements.
A new Annex 10 on public perceptions has
been added, providing an overview of relevant
Eurobarometer surveys carried out in the
evaluation period and a summary of the most
recent Eurobarometer survey on air quality.
Analysis has also been augmented with
additional considerations linking public
perceptions with the relevance of EU air
quality standards in section 5.1.
(2) The report does not justify having less ambitious air quality standards than those
recommended by the World Health Organisation.
The report should provide an evidence-based
discussion about the merits of having EU air
quality standards that are less stringent than
WHO Guidelines. It should assess whether the
socio-economic and feasibility factors that
argued for less ambitious standards remain
valid.
This has been addressed in greater detail in
section 5.1 and Annex 8, including via
additional evidence on model-based
projections assessing potential to reach WHO
Guidelines values for PM2.5 in a 2030
perspective. This indicates that while large
parts of the EU would be able to reach these,
for some regions efforts required would exceed
measures deemed cost-effective.
Additional considerations
Investigating case-by-case the potential for
simplification and burden reduction is a central
promise by the Commission. Throughout the
report, there are paragraphs discussing this
potential. However, it could be helpful to have
a dedicated section on why or why not there is
room for simplification or burden reduction.
A new section 6.5 on simplification and burden
reduction potential has been added, gathering
relevant considerations present throughout the
document and providing an overall conclusion
on the potential to simplify the AAQ
Directives’ requirements with a view of
reducing the burden.
212 https://ec.europa.eu/info/better-regulation-guidelines-and-toolbox_en

92
The Regulatory Scrutiny Board had previously provided a negative opinion with
comments on 19 July 2019. The following table provides information on how the
comments made have been addressed in this Staff Working Document:
RSB Opinion Reflection in text
(1) The report does not present an unbiased reading of the data with respect to the objective
of meeting specific air quality standards by certain deadlines.
The report should be clear that one objective
of the legislation was to meet certain air
quality standards by certain deadlines. The
effectiveness analysis should assess
achievements against this benchmark.
This has been addressed extensively
throughout the revised text, and in particular
via revisions to Section 2.3, Section 3.2,
Section 5.2, as well as to the Conclusions.
Note that the existing standards are now
introduced clearly in Section 2.3, including
the typology (Box 1). Also the Conclusions
and Executive Summary have been revised to
reflect this emphasis on achieving standards.
New Figures 4a, 4b and 4c in Section 3.2
provide a detailed assessment against the air
quality standards, as the key benchmark and
point for comparison between 2008 and 2017,
noting changes in the number and magnitude
of exceedances.
The report should show the air quality trends
in more detail, in particular, by how much
standards were breached in how many zones.
The report should provide likely reasons for
failures to achieve goals, making clear any
material differences across Member States.
The comparison of the situation in 2008 with
2017 has been significantly improved and
expanded, in particular by adding new
Figures 4a, 4b and 4c that show changes in
number and magnitude of exceedances per
Member State for PM10, PM2.5 and NO2 (see
Section 3.2). Section 5.2 makes also clear and
more detailed references to the observed
improvements and differences across Member
States for two key pollutants (PM and NO2),
including identifying key reasons for these
differences.
The report should answer the question
whether the current design and enforcement
structure of the directives are likely to meet
the air quality standards if given enough time
(i.e. whether they are fit for purpose).
This is now being more clearly argued in the
Conclusions and Executive Summary. The
fitness check finds the AAQ Directives to be
partially effective and broadly fit for purpose,
but also stresses a need to improve the
existing framework in order to fully meet all
objectives. The Conclusions offer more
detailed lessons learned that can be drawn
from the fitness check as regards potential
improvements.

93
RSB Opinion Reflection in text
(2) The report does not sufficiently present successes and shortcomings of different
intermediate steps towards end objectives, including measuring air quality, acting on the
data and enforcing standards.
The report should provide a nuanced
discussion of each step between measuring air
quality and achieving benchmark air quality
standards.
The effectiveness of the steps foreseen in the
AAQ Directives (i.e. monitor pollution, set
standards, report data, improve air) as
outlined in the Intervention Logic is now
more clearly discussed in Section 5.2 and
Conclusions.
For example, it could mention that the system
to measure air quality still has room for
improvement, but delivers data that is good
enough to act upon; that enforcement is
partially effective, also thanks to NGOs
successfully taking legal action; that
implementation respects the subsidiarity
principle, but has suffered from a lack of
political commitment and coordination
between levels of government. This
discussion should point to those aspects that
would need to improve in order to achieve the
original objective of meeting air quality
standards.
Clear indications added to the document that
the system to measure air quality still has
room for improvement but delivers data that
is reliable enough to act upon (this is now
explicitly concluded in Section 5.3). Legal
action by NGOs now further elaborated
(Section 3.5 and Annex 6). A prevailing lack
of political commitment and shortcomings in
coordination between levels of government
highlighted as important reason for the AAQ
Directives only being partially effective to
date is addressed in Section 5.2. Further
reference is made to the polluter pays
principle and the need to rectify pollution at
source have been added to Section 5.2. The
above points are also reflected in the lessons
learned presented in the final part of the
Conclusions.
It might also indicate if data collection
capabilities have matured enough for the
policy emphasis to shift towards more co-
ordinated action across Member States.
Text on transboundary cooperation (Box 15)
has been expanded to stress the availability of
good air quality data on transboundary
contributions to air quality exceedances.
(3) The report does not sufficiently investigate the issue of aligning EU air quality standards
with the WHO Guidelines.
The report should provide an evidence-based
discussion about the merits of having EU air
quality standards that are less stringent than
WHO Guidelines.
The enhanced Section 5.1 and a new Annex 8
presents analysis as provided by the 2018
Clean Air Outlook – and discuss the
comparison between EU air quality standards
and WHO Guidelines in more detail, noting
that “there are cases where measures are
technically feasible but not cost-effective,
leading to a situation where some regions in
the EU would not reach the WHO Guidelines
in a 2030 projection.”

94
RSB Opinion Reflection in text
It should assess whether the socio-economic
and feasibility factors that argued for less
ambitious standards are still valid.
In addition to the above, the socio-economic
and feasibility factors are discussed in
Section 5.1, with additional text added on
socio-economic aspects. This section now
also elaborates further on the process of
setting WHO Guidelines (Box 3), and the
trade-offs to consider in translating these into
EU standards.
It should also conclude more clearly about the
state of play of evidence on pollutants not
covered in the legislation.
The text in Section 5.1 on additional
pollutants has been expanded, now including
also a bespoke box on the state of evidence
for ultrafine particles (Box 4). The related
findings are mirrored in the Executive
Summary.
The relevance section could also present the
changed societal context, for example,
evidence of higher awareness of the public,
increased demand for monitoring data, and
adjusted expectations. The report should
consider what this implies for the level of
ambition of the air quality directives.
Reference to the changed societal context, and
evidence of higher public awareness and
engagement is addressed in revised Sections
3.4 and 5.1, including new text to highlight
public engagement in using low cost sensors
to augment official monitoring (Box 2). Also
further reference to increased awareness
added as a lesson learned to the Conclusions.
(4) The report does not make clear which stakeholder groups thought what.
The report should differentiate stakeholders’
responses across stakeholder groups. It should
investigate how representative or relevant
presented criticisms are.
Stakeholder responses have been elaborated
in more detail throughout. In Annex 2, a
detailed analysis of feedback as differentiated
by stakeholder group has been added for each
of the five criteria (see Box A2.1 through
A2.5)
The report needs to explicitly cover the
opinions voiced by local and regional
authorities during the consultation activities.
In addition to the above, which includes
feedback from national, regional and local
authorities, two further boxes have been
added to summarise the views offered by
local and regional authorities (Box 9), another
on the EU Urban Agenda (Box 14).
Additional considerations
The efficiency analysis should discuss
whether it is possible to simplify rules and
reduce burdens without compromising the
objectives.
Section 5.1 includes specific references to
redundant elements in the current AAQ
Directives. In addition, section 5.3 now
indicates that not all data reported is equally
relevant, which offers scope for some
simplification.

95
RSB Opinion Reflection in text
It should also discuss the proportionality of
the monitoring costs.
Section 5.3 now emphasises the approach to
proportionality of monitoring and stresses that
related requirements (and thus related costs)
decrease when air quality improves. Also this
section now more clearly states that the costs
of monitoring and reporting are several
magnitudes smaller than the cost of pollution.
5. Evidence, sources and quality
Support study
A contract study ‘Supporting the fitness check of the EU Ambient Air Quality Directives
(2008/50/EC, 2004/107/EC)’ (ENV.F.l/FRA/2014/0063/25, procurement procedure of 17
May 2014) informed the conclusions presented in this document. The contract for the
support study was signed on 22 December 2017 and covered a period of 18 months
(070201/2017/772581/SER/C3). The contract was carried out by a consortium of experts
led by COWI A/S, and also comprised of Milieu Ltd and Eunomia. The final report for
the study contract was accepted in October 2019.
The Interservice Group confirmed that the support study sufficiently satisfies the
necessary quality requirements.
Consultation strategy
A consultation strategy213 guided the gathering stakeholder input to this fitness check, and
included the following:
• an open public consultation allowing the interested public and stakeholders to express
their views;
• targeted stakeholder consultation, addressed at selected stakeholders in all Member
States and at EU level;
• stakeholder workshops in order to confirm the scope and the hypotheses of the fitness
check, and to validate the findings towards the end of the process.
A synopsis on the stakeholder consultation process are provided in Annex 2.
Bespoke modelling
For the analysis of the efficiency criterion, and in addition to the sources of information
presented above (which informed mostly the analysis of the costs), the support study
undertook specific computations based on previously published methodology, in order to
estimate some of the health benefits of the AAQ Directives and some of the damage costs
to society in case of their insufficient implementation. The precise steps of these
computations together with the limitations of the modelling are described in Annex 3.
213 http://ec.europa.eu/environment/air/pdf/AQDs%20Fitness%20Check_consultation%20strategy.pdf

96
Evidence from air quality monitoring and reporting
Under the two Directives, Member States make available the information they use for
reporting and reciprocal exchange of information via and air quality data repository
(http://www.eionet.europa.eu/aqportal), including:
• monitoring and assessment regimes, including assessment methods:
http://aidec.apps.eea.europa.eu and http://aided.apps.eea.europa.eu
• attainment of environmental objectives, including information on exceedance
situations: http://aideg.apps.eea.europa.eu
• air quality plans and programmes, as well as air quality measures:
http://aideh.apps.eea.europa.eu and http://aidek.apps.eea.europa.eu
• information on source apportionment in zones and agglomerations:
http://aidei.apps.eea.europa.eu
• and information on air data and aggregated validated assessment data as summarised
in the annual air quality reports published by the European Environment Agency
• online EEA indicators, such as:
o Exceedance of air quality standards in urban areas: www.eea.europa.eu/data-and-
maps/indicators/exceedance-of-air-quality-limit-3/assessment-4
o Transport fuel prices and taxes: https://www.eea.europa.eu/data-and-
maps/indicators/fuel-prices-and-taxes/assessment-2
Evidence from selected studies and policy documents
• COM(2005)446. ‘Thematic Strategy on air pollution’
• COM(2013)918. ‘A Clean Air Programme for Europe’, including, in particular:
SWD(2013)531. ‘Clean Air Programme for Europe Impact Assessment’
• COM(2017)312. ‘Actions to Streamline Environmental Reporting’
• COM(2018)446. ‘The First Clean Air Outlook’
• COM(2018)330. ‘A Europe that protects: Clean air for all’
• COM(2019)149. ‘Environmental Implementation Review 2019’
• EEA Annual Air Quality Reports published from 2011 to 2018:
o https://www.eea.europa.eu/publications/air-quality-in-europe-2018
o https://www.eea.europa.eu/publications/air-quality-in-europe-2017
o https://www.eea.europa.eu/publications/air-quality-in-europe-2016
o https://www.eea.europa.eu/publications/air-quality-in-europe-2015
o https://www.eea.europa.eu/publications/air-quality-in-europe-2014
o https://www.eea.europa.eu/publications/air-quality-in-europe-2013
o https://www.eea.europa.eu/publications/air-quality-in-europe-2012
o https://www.eea.europa.eu/publications/air-quality-in-europe-2011
• EEA Briefing 9/2018. ‘Improving Europe’s air quality — measures reported by
countries’
• EEA Report 11/2014. ‘Effects of air pollution on European ecosystems’
• EEA Report 6/2018. ‘European Union emission inventory report 1990-2016’

97
• EEA Report 22/2018. ‘Unequal exposure and unequal impacts’
• EEA Report 24/2018. ‘Europe’s urban air quality’
• ETC/ACC Technical paper 2010/1. ‘The state of the air quality in 2008’
• ETC/ACM Technical paper 2011/20. ‘Co-benefits of climate and air pollution
regulations’
• European Commission (2013). Flash Eurobarometer 360: ‘Attitudes of Europeans
towards air quality’
• European Commission (2017). Special Eurobarometer 468: ‘Attitudes of European
citizens towards the environment’
• European Commission (2019). Special Eurobarometer 497: ‘Attitudes of Europeans
towards air quality’
• European Court of Auditors Special Report 05/2018 on Renewable Energy
• European Court of Auditors Special Report 23/2018 on Air Pollution
• European Parliament (2017). ‘Report on the inquiry into emission measurements in
the automotive sector’
• European Parliament (2019). ‘Sampling points for air quality: Representativeness and
comparability of measurements in accordance with Directive 2008/50/EC on ambient
air quality and cleaner air in Europe’ (study requested by the ENVI Committee)
• EUROSAI (2019). ‘Joint report on air quality by the European Organisation of
Supreme Audit Institutions’
• IIASA (2014). ‘Complementary Impact Assessment on interactions between EU air
quality policy and climate and energy policy’
• IIASA (2017). ‘Costs, benefits and economic impacts of the EU Clean Air Strategy
and their implications on innovation and competitiveness’
• IIASA (2018). ‘Progress towards the achievement of the EU’s air quality and
emissions objectives’
• JRC (2013). ‘Assessment on siting criteria, classification and representativeness of
air quality monitoring stations’
• JRC (2017). ‘Urban PM2.5 Atlas: Air Quality in European Cities’
• JRC (2017). ‘Global Energy and Climate Outlook 2017: How climate policies
improve air quality’
• Nationale Akademie der Wissenschaften Leopoldina (2019). ‘Saubere Luft.
Stickstoffoxide und Feinstaub in der Atemluft: Grundlagen und Empfehlungen’
• OECD (2016). ‘The Economic Consequences of Outdoor Air Pollution’
• OECD (2019). ‘The economic cost of air pollution – Evidence from Europe’
• Urban Agenda for the EU (2018). ‘Position Paper on the Fitness Check of the EU
Ambient Air Quality Directives’
• World Health Organization (2006). ‘Air quality guidelines – global update 2005’
• World Health Organization (2013). ‘Review of evidence on health aspects of air
pollution’
Additional sources of evidence, including relevant academic literature and scientific
articles, reports and conference papers, online and data sources, as well as further policy
documents and guidelines, are listed in Appendix C of the support study informing this
fitness check or cited as footnotes where referred to.

98
Annex 2: Stakeholder consultation
1. Aim of the consultation
The stakeholder consultation aimed to collect supporting information, data and
knowledge on the implementation of various aspects of the AAQ Directives, with a view
to fill any potential information/data gaps in the course of the fitness check and inform
the analysis of the evaluation questions. Consultation activities also aimed at gathering
stakeholders’ views and opinions on the extent to which AAQ Directives have
successfully met their objectives.
2. Consultation strategy214
The consultation focused on gathering stakeholders’ responses on the following aspects:
• awareness of the air quality issues in general and knowledge of the AAQ Directives'
provisions;
• views regarding the contribution of the AAQ Directives to improved air quality;
• whether the provisions of the AAQ Directives continue to be relevant, effective,
efficient, and coherent with other EU and national policies, as well as the extent to
which an EU-level approach to air quality has added value.
A broad range of stakeholders were consulted for the fitness check, including Member
State competent authorities at all relevant levels (i.e. national, regional and local), civil
society and non-governmental organisations, organisations representing industry and
trade, researchers and the scientific community, international organisations (such as the
World Health Organization), as well as citizens.
The consultation has aimed to ensure that, in each Member State, stakeholders
representing government, civil society and industry were provided the opportunity to
provide input. Particular attention was paid to consulting stakeholders in regions and
sectors where air quality issues were problematic.
3. Consultation activities
Feedback on the fitness check roadmap
The public consultation on the roadmap of the fitness check of the AAQ Directives
resulted in 13 responses online and one additional response was received via email. Five
replies were received at the EU-level and nine at Member state level.215 By stakeholder
group, two replies were received from business organisations, four from business
associations, five from NGO/civil society, one from public authorities, one from a private
214 http://ec.europa.eu/environment/air/pdf/AQDs%20Fitness%20Check_consultation%20strategy.pdf
215 Germany (3), Austria (1), Denmark (1), Italy (1), Hungary (1), Netherlands (1), United Kingdom (1).

99
citizen and one from a city. The full responses are available online and were considered
in the analysis underpinning this fitness check.216
Table A2.1 - Respondents to roadmap
Organisation name Member State Organisation type
European Environmental Bureau Belgium NGO
German Chamber of Commerce (DIHK) Germany Company / business org.
AEGPL – European LPG Association Belgium Business association
European Respiratory Society Belgium NGO
Zentralverband des Deutschen Handwerks (ZDH) Germany Business association
Anonymous Italy EU citizen
Danish Environment Technology Association Denmark Business association
European Federation of Allergy and Airways Diseases
Patients' Associations (EFA)
Belgium NGO
Austrian Federal Economic Chamber (WKO) Austria Business association
ClientEarth United Kingdom NGO
SHV Energy Netherlands Company / business org.
Senior Corporate Silver Spoon, Environment and Nature
Association
Hungary NGO
German Federal Environment Agency (UBA Germany) Germany Public authorities
Targeted questionnaire
The targeted questionnaire aimed at collecting evidence and information relevant to
answer the evaluation questions from a selected number of stakeholders at national and
EU level. It was sent to approximately 160 representatives of public institutions at
national, regional and local level; 100 representatives of NGOs at national and EU level;
80 representatives of industry and trade at national (including national chambers of
commerce) and EU level; and 90 research institutes or universities in EU Member States
covering environmental, health and industry sectors. The associations at EU level were
selected in order to ensure a multiplier effect. The targeted questionnaire was sent out on
5 June 2018 with a deadline for responses on 24 July 2018, which was then extended to
15 September 2018.
In total, 43 responses were received. Of these, two organisations submitted position
papers in lieu of completing the questionnaire and one provided feedback in email form.
Respondents included 16 national authorities and five local or regional authorities (or
associations of local governments) in Member States, ten NGOs, six educational or
scientific organisations, five industry associations and one local authority employee
responding in an individual capacity. The 43 responses represented around 10% of
stakeholders approached. All major stakeholder groups were represented in the
responses, except for EU and international organisations who nonetheless participated in
other consultation activities (e.g. the stakeholder workshops).
216 https://ec.europa.eu/info/law/better-regulation/initiatives/ares-2017-3763998/feedback_en

100
Table A2.2 - Respondents to targeted questionnaire
Organisation name Member State Organisation type
WKO Austrian Federal Economic Chamber Austria Industry
IRCEL-CELINE Belgium National authority
Executive Environment Agency Bulgaria National authority
Ministry of Environment and Energy Croatia National authority
Ministry of the Environment Czechia National authority
HSY Helsinki Region Environmental Services and City of
Helsinki (joint response)
Finland Local / regional authority
ATMO France France NGO
Airparif France NGO
Atmo Grand Est France NGO
City of Munich Germany Local / regional authority
Local authority employee responding in individual capacity Germany Citizen / individual expert
Clean Air Action Group Hungary NGO
Environmental Protection Agency Ireland National authority
Environmental Sustainability Lab University of Brescia Italy Scientific / research org.
Riga City Council Latvia Local / regional authority
Ministry of Environment Protection Latvia National authority
Administration de l’environnement Luxembourg National authority
Environment and Resources Authority Malta National authority
VNG Association of Netherlands Municipalities Netherlands Local /regional authority
Ministry of Infrastructure and Water Management Netherlands National authority
RIVM Netherlands Scientific/ research org.
Environment Agency Norway National authority
Norwegian Institute for Air Research Norway Scientific / research org.
Polish environmental authorities (joint response) Poland National authority
Romanian environmental authorities (joint response) Romania National authority
Ministry of Environment Slovakia National authority
Ecologistas en Accion Spain NGO
Ministry for the Ecological Transition Spain National authority
Environmental Protection Agency Sweden National authority
IVL Swedish Environmental Research Institute Sweden Scientific / research org.
British Heart Foundation United Kingdom NGO
Department for Environment, Food and Rural Affairs United Kingdom National authority
Greater London Authority United Kingdom Local / regional authority
Clean Air London United Kingdom NGO
Organisation name International Organisation type
Industrial Minerals Association Europe EU Industry
EPHA European Public Health Alliance EU NGO
CEMBUREAU - European Cement Association EU Industry
EUROFER EU Industry
ISEE International Society for Environmental Epidemiology EU Scientific / research org.
EFANET European Federation of Allergy and Airways
Disease Patients' Associations
EU NGO
CONCAWE EU Industry
ClientEarth, EEB, AirClim, HEAL and T&E (joint response) EU NGO
European Respiratory Society EU Scientific / research org.
101
Open public consultation
The aim of the open public consultation was to gather views from citizens and
stakeholders on general awareness of air quality issues, and opinions on the
implementation of AAQ Directives according to five evaluation criteria (relevance,
effectiveness, efficiency, coherence and EU added value).
This survey was open to any interested party, including private citizens, companies, civil
society organisations, researchers and public authorities. The open public consultation
survey was accessible in 23 official EU languages (excluding Irish) and published online
from the European Commission’s public consultation portal website.217 Supporting
documentation in any of the EU official languages were also accepted. The public
consultation was conducted on EUSurvey from 8 May 2018 to 31 July 2018.
The survey was structured into two parts. The first part focussed on background
information about the respondent and general questions on views and concerns of air
quality, awareness of the AAQ Directives, and effects of EU policy and legislation on air
quality. The second part consisted of specific questions related to the effectiveness,
relevance, efficiency, coherence and EU added value of the AAQ Directives. Participants
could provide additional statements by uploading submission papers with the survey.
The open public consultation generated a total of 489 responses. The majority (248
responses) of respondents replied as individuals, followed by representatives in the
‘Public Administration and Defence sector’ (64 responses) and ‘Professions, Scientific
and Technical Activities’ (33 responses). In addition, there were 29 responses
representing ‘Other Service Activities’, which includes activities of professional
membership organisations, trade unions, lobbyists and support groups, environmental
and ecological groups, etc., with specific interests in issues related to air quality.
Of the 489 responses to the open public consultation, 122 responses identified as replying
on behalf of an organisation and provided the name of this organisation. An analysis of
this subset showed it to comprise 46 representatives of industry, 52 representatives of
NGOs or scientific bodies, and 24 representatives of national, regional or local
authorities. An additional 39 responses did not provide the name of this organisation and
where thus treated as responses by individuals. A further 22 responses indicated their
replies to be from individual in a professional capacity and provided the name of the
organisation. The remainder either replied in a personal (248 responses) or professional
capacity (58 responses) without providing further details.
Respondents came from 27 of the 28 EU Member States (with no response from
stakeholders in Luxembourg) with the largest share from Belgium (102 responses),
Germany (81 responses) and Italy (71 responses). The larger share of respondents from
Belgium can be explained by a presence of EU-level and industry/civil society entities
with headquarters in Brussels, Belgium. Furthermore, the large number of responses
from Germany and Italy could be due to a prominence of specific types of industries
directly or indirectly impacted by measures to improve air quality (for example, energy
production and supply).
217 https://ec.europa.eu/info/law/better-regulation/initiatives/ares-2017-3763998/public-consultation_en

102
As many as 90% of respondents either completely agreed or somewhat agreed with the
statement that poor air quality is an issue of concern in Europe. Underlying these
concerns were 75% or more who completely agreed that poor quality has negative
impacts on individual health, wellbeing of the population, the health of the overall
population in the EU and the environment. More than 60% of respondents reported
feeling either very well informed or moderately informed about EU clean air policies, the
AAQ Directives, or national/regional/local level air quality policy and plans.
Respondents as a whole felt the issue of air quality should be tackled more or less equally
at all levels of governments, with a majority of respondents indicating the EU as most
appropriate. In thinking about how EU policy and legislation on air quality has helped to
improve a number of objectives, the largest share of respondents (60%) agreed either
somewhat or completely on the objective of ensuring consistent rules on the levels of air
pollution to which citizens were exposed. The weakest level of agreement related to the
question regarding the provision of comparable information to citizens on air pollution
levels (just under 40%).
The majority of respondents agreed either completely or somewhat that EU policies and
legislation have helped prevent deteriorating air quality in Europe (86%), in the
respondent’s country (82%), and in the respondent’s city or region (76%).
Workshops with stakeholders
Two workshops with stakeholders were held, in June 2018218 and January 2019.219 The
purpose of the workshops was to gather evidence, confirm issues for the evaluation,
solicit views on the performance and implementation of the AAQ Directives and seek
feedback on emerging findings. Participants included representatives from national,
regional and local governments in the EU, environmental and other public bodies,
business and trade organisations, civil society, international bodies (WHO), academia
and the research community.
Ad hoc contributions
During the fitness check, stakeholders made a number of ad hoc contributions to the
process. These included a meeting between Commission staff and a port authority, where
the port authority emphasised the need to ensure alignment between the AAQ Directives
and source legislation and to support effective multi-level governance. An industry
stakeholder also provided input in late-2018 in a position paper which noted concerns
about the challenges faced by Member States in meeting the limit values from Directive
2008/50/EC and the need for a supporting regulatory framework addressing all relevant
emission sources. Following the workshops, a small number of ad hoc contributions were
made to the Commission and/or the consultants carrying out the support study:
218 https://ec.europa.eu/info/events/stakeholder-workshop-support-fitness-check-eu-ambient-air-quality-
directives-2018-jun-18_en
219 http://ec.europa.eu/environment/air/pdf/AAQD%20Fitness%20Check%20-
%20Background%20document-%20Stakeholder%20workshop%20final.pdf

103
Table A2.3 – Ad Hoc contributions
Organisation name Member State Organisation type
WKO Austrian Federal Economic Chamber Austria Industry
Veolia France Industry
Deutscher Industrie- und Handelskammertag Germany Industry
Reine Luft für Wetzlar Germany NGOs
Regione Lombardia Italy Local / regional authority
Association of Dutch Provinces Netherlands Local / regional authority
Randstad Region Netherlands Local / regional authority
Port of Rotterdam Netherlands Industry
Omgevingsdienst Zuid-Holland Zuid Netherlands Local / regional authority
Air Quality Partnership under the Urban Agenda of the EU EU Authorities and NGOs
Greater London Authority United Kingdom Local / regional authority
Other activities
Other stakeholder consultation activities included a workshop at Green Week 2018220 and
follow-up with individual stakeholders in response to direct inquiries with the fitness
check team and/or the consultants carrying out the supporting study. The Green Week
session had the purpose to provide a city-level perspective on what works well, and what
does not, as regards EU Clean Air policies. In addition, the European Commission’s
Ambient Air Quality Expert Group221 was consulted throughout the fitness check.
4. Results of the stakeholder consultation
Relevance
An overwhelming majority of open public consultation respondents agreed either to a
large or very large extent that air pollution poses a major concern to public health (94%)
and the environment (88%). Respondents considered the following four provisions of the
AAQ Directives as the most important in delivering air quality improvements: ‘defining
and establishing objectives and common EU standards for ambient air quality’ (95%);
‘assessing air quality on the basis of common measurement and monitoring methods and
criteria’ (96%); ‘obtaining accurate information on air quality’ (92%); and ‘maintaining
air quality where it is good and improving it in other cases’ (91%). With regard to the
limit values for pollutants under the AAQ Directives, respondents mostly felt that
standards were set at about the right level for most pollutants, but limits were considered
too lenient for particulate matter (PM10 and PM2.5), nitrogen dioxide, and
benzo(a)pyrene.
Similar views were echoed at the stakeholder workshops. Participants noted that despite
air pollution being the fifth most important risk factor for non-communicable diseases,
current standards do not fully reflect scientific evidence suggesting health impacts at
concentration levels below the current limit values. Particular concern was expressed
regarding PM2.5, where stakeholders noted the need for short-term limit values. Others
pointed to the limitations of EU legislation in reacting swiftly to evolving knowledge
220 http://ec.europa.eu/environment/air/pdf/20180524%20web%20summary%20FC%20session%20
Green%20Week.pdf%20
221 http://ec.europa.eu/transparency/regexpert/index.cfm?do=groupDetail.groupDetail&groupID=2790

104
about pollutants and their effects. In this regard, the need for specific measures on
microparticles was mentioned and greater alignment of standards with WHO Guidelines
was sought, especially in the case of SO2, where EU limit values are significantly higher
than WHO recommendations. Other comments focused on the need for the air quality
legal framework to be adaptable to new approaches to measure air quality, such as citizen
science methods, which can help raise awareness but is not suitable for assessing
compliance with air quality standards as the of precision of data is lacking.
Box A2.1 – Feedback by stakeholder groups on relevance
Out of the total of 489 responses to the open public consultation, 122 responses identified as
replying on behalf of an organisation and provided the name of this organisation.
While a majority of representatives of industry or business associations (46 replies in total)
agreed that poor air quality is an issue of concern in Europe, three respondents explicitly
disagreed. All but one respondent considered all objectives of the AAQ Directives to be either
‘very important’, ‘important’ or ‘moderately important’, and particularly the objective to assess
air quality on the basis of common methods and criteria was considered ‘very important’ (31 out
of 46 replies). Views on the level of the air quality standards set in the AAQ Directives were
mixed: 14 out of 46 considered them ‘too strict’ (especially for nitrogen dioxide and fine
particulate matter), 8 considered them ‘too lenient’ (especially for particulate matter), and 21
considered them to be at the appropriate level (and a further 3 left the question unanswered). Four
respondents explicitly stressed that no further pollutants should be included in the scope of the
AAQ Directives, while several others noted a need to address black carbon and/or ultrafine
particles.
Conversely, all but one representatives of non-government organisations or scientific bodies
(52 replies in total) agreed that poor air quality is an issue of concern in Europe (1 respondent
replied to ‘neither disagree nor agree’), and a clear majority even ‘completely agree’ that it had
negative impacts on health and on the environment (in both cases 49 out of 52 replies). Most
respondents in this group considered all objectives of the AAQ Directives to be ‘very important’,
especially common methods and criteria (47 out of 52 replies) and setting air quality standards
(45 out of 52 replies); note that the remainder noted both to be ‘important’ still. Having said this,
a clear majority considered the level of the air quality standards set in the AAQ Directives to be
either ‘far too lenient’ (21 out of 52 replies) or ‘somewhat too lenient’ (23 out of 52 replies): in
particular as regards particulate matter, and too a slightly lesser degree also ozone,
benzo(a)pyrene, nitrogen dioxide and sulphur dioxide. A majority of this subset of respondents
explicitly noted a need to address black carbon, ultrafine particles and/or ammonia as part of the
AAQ Directives.
Also, representatives of national, regional or local authorities (24 replies in total) in their
majority agreed (and mostly ‘completely agree’) that poor air quality is an issue of concern in
Europe, with negative impacts on health and on the environment (22 out of 24 responses). This
group of respondents too considered all objectives of the AAQ Directives to be ‘very important’,
especially common methods and criteria (21 out of 24 replies) and setting air quality standards
(22 out of 24 replies). In relative terms, the promoting of increased cooperation across Member
States was regards to be the least important objective. Questions about the levels at which the
standards were set either rendered concerns about levels being ‘too lenient’ (11 out of 24 replies,
especially for particulate matter, but also for nitrogen dioxide), or was saw them to be set at the
‘appropriate level’ (9 out of 24 replies). Only three considered them to be too strict (one referred
to nitrogen dioxide, two to ozone, and one to particulate matter and all heavy metals). Half of the
replies from this group noted a need to address black carbon and ultrafine particles.
Responses to the targeted questionnaire indicated that the AAQ Directives were still
relevant and address important citizens' needs. The need to consider regulation of black
carbon and ultrafine particles (or nanoparticles) were indicated by 18 of 43 replies each.

105
Other pollutants mentioned more than once included background levels of ozone,
ammonia, pesticides, and polycyclic aromatic hydrocarbons other than benzo(a)pyrene.
Some national organisations (5 of 16 respondents to the targeted questionnaire)
mentioned pollutants they considered less relevant, in particular sulphur dioxide and
carbon monoxide. Most respondents observed that one or more limit values were less
strict than WHO Guidelines and should approach them (23 of 43 respondents), in
particular for PM10 and PM2.5, but also SO2, O3, and BaP. Several mentioned the need for
24-hour limit value for PM2.5, and information and alert thresholds for PM10 and PM2.5.
Replies from industry and industry associations (4 of 5 respondents), however, indicated
that they considered current limit values sufficient or too stringent.
Effectiveness
In general, respondents from the open public consultation perceived the AAQ Directives
to be effective in achieving their objectives. Most respondents agreed either completely
or somewhat that standards are well-established (71%), monitoring is in place (61%), and
information is being made available (61%). There was less agreement in respect to the
objective of taking coherent action to avoid, prevent or reduce the effect of poor air
quality, with only 45% of respondents indicating that they completely or somewhat
agreed that the Directives have been effective. More than half (58%) of the respondents
agreed that sufficient criteria are defined at the EU level for monitoring and assessment,
and that the measurement techniques are sufficiently standardised across the MS (46%).
However, respondents were more likely to disagree that there are sufficient sampling
points and measurements to assess air quality (52%). Finally, 88% of open public
consultation respondents believed that monitoring and reporting regimes under the AAQ
Directives has helped deliver reliable, accurate and comparable air quality information
across the EU to a very large or large extent.
Similar findings were echoed in the stakeholder workshops, with participants identifying
several factors that may limit the effectiveness of air quality objectives. Representatives
from national authorities and NGOs raised the issues of widespread exceedances of air
quality standards as an issue limiting the effectiveness of the Directives. Comments from
NGOs and local and regional governments also focused on the lack of clear provisions
and guidance on modelling. NGOs in particular also raised the issue of unclear
distribution of responsibilities within Member States for the implementation of air
quality plans which contributes to reduced effectiveness of the Directives. National
officials emphasised that more attention should be given to measuring emissions in areas
where vulnerable populations are present, with consideration given to applying more
stringent limit values in these areas. A number of comments were raised by
representatives of authorities, industry and NGOs on the siting of monitoring stations:
some stakeholders suggested the AAQ Directives’ criteria on siting is too flexible, while
some suggested that it was too restrictive. Participants also acknowledged that the
AAQ Directives facilitated air quality improvements.
Concerning the targeted questionnaire, 35 of the 43 respondents had provided
contributions and examples on effectiveness, and 26 of these provided a quantitative
estimate on their perceptions regarding the effectiveness of the AAQ Directives. Most
commonly mentioned positive examples included that common methods for measuring
and assessing air quality established by the AAQ Directives allow for comparison of
information between different cities and countries in Europe, that provisions for fixed
measurements are clear and detailed, that the Directives have encouraged availability of
reliable and comparable data, that mandatory air quality standards has been a driving

106
force for Member States to ensure that the necessary policies and measures are put in
place, that the AAQ Directives provisions on information availability, monitoring and
reporting have facilitated public awareness and that AAQ Directives have contributed to
maintaining or improving air quality. References were also made to the difficulties due
the room for interpretation in the AAQ Directives regarding criteria for siting of stations.
In terms of shortcomings, the respondents also pointed to continued exceedances,
ongoing enforcement action, and action plans or measures considered ineffective (in
particular by national authorities and NGOs).

107
Box A2.2 – Feedback by stakeholder groups on effectiveness
Out of the total of 489 responses to the open public consultation, 122 responses identified as
replying on behalf of an organisation and provided the name of this organisation.
A large majority of representatives of industry or business associations (46 replies in total)
agreed that the AAQ Directives have been effective in ensuring a representative, high quality
monitoring and assessment of air quality (38 out of 46 ‘agree’, 10 of which ‘completely agree’),
in establishing clean air quality standards (40 out of 46 ‘agree’, 28 of which ‘completely agree’),
and ensuring relevant information is made available (39 out of 46 ‘agree’, 20 of which
‘completely agree’). This overall positive view also included that there are sufficient criteria for
monitoring provided by the AAQ Directives (36 out of 46 ‘agree’) and that sampling point
monitor both the highest exceedance (27 out of 46 ‘agree’, while 7 out of 46 ‘disagree’). and
general exposure well (25 out of 46 ‘agree’, while 9 out of 46 ‘disagree’). Views were slightly
less positive on whether they were effective in achieving coherent action to avoid, prevent or
reduce poor air quality: 8 out of 46 ‘disagree’, while 21 out of 46 ‘agree’.
Representatives of non-government organisations or scientific bodies (52 replies in total)
offered a slightly less positive view on the effectiveness of the AAQ Directives in ensuring
representative, high quality monitoring and assessment of air quality (30 out of 52 ‘agree’, while
12 out of 52 ‘disagree’). Even if a majority of replies considered the criteria for monitoring
provided by the AAQ Directives to be sufficient (29 out 52 ‘agree’), concerns were expressed by
this group as to whether there are sufficient sampling points (41 out of 52 ‘disagree’) and whether
the current network is representative of the highest pollution exposure (41 out of 52 ‘disagree’).
Conversely, this group strongly agreed on the effectiveness of setting air quality standards (41
out 52 ‘agree’, 33 of which ‘completely agree’), and ensuring relevant information is made
available (33 out of 52 ‘agree’). Views on the effectiveness in achieving coherent action to avoid,
prevent or reduce poor air quality were split: 27 out of 52 ‘agree’ versus 18 out of 52 ‘disagree’.
In particular, 32 out of 52 saw coordination across governance levels to have contributed ‘very
little’ or ‘not at all’. Finally, it is worth noting that 18 out of 52 replies considered access to
justice via national court cases to have contributed to a ‘large extent’ or a ‘very large extent’ to
better air quality.
Also, representatives of national, regional or local authorities (24 replies in total) were
overwhelmingly positive as regards the effectiveness of the AAQ Directives in ensuring a
representative, high quality monitoring and assessment of air quality (21 out of 24 ‘agree’), in
establishing clean air quality standards (24 out of 24 ‘agree’), and ensuring relevant information
is made available (21 out of 24 ‘agree’). Public authorities also expressed satisfaction that the
criteria for sampling points being sufficient, measurement techniques are sufficiently harmonised
and that sampling points are representative of general population exposure (19 out of 24 ’agree’
with each of the three statements). And a clear majority of this group agreed that the AAQ
Directives had been effective in achieving coherent action to avoid, prevent or reduce poor air
quality (17 out of 24 ‘agree’, while 3 out of 24 ‘disagree’), and resulted in effective air quality
plans and/or measures (19 out of 24 noted they did to a ‘large extent’ or a ‘very large extent’).
This group also, more than other groups, considered enforcement action by the Commission to be
a key factor.
Efficiency
A relative majority of open public consultation respondents believed that AAQ
Directives have delivered significant benefits to a large or very large extent for protecting
human health (42%) and the environment (39%). The sectors considered to provide the
most sectoral benefits of the implementation of the AAQ Directives were innovative
industries (all sectors) (58%), healthcare (48%), competent public authorities (43%),
transport (personal mobility service providers) (40%) and energy providers (40%). While

108
the sectors considered to have benefitted the least from implementation of the AAQ
Directives were transport (logistic service providers) (24%), agriculture sector (24%),
waste sector (22%), and construction (22%). Just over half of the respondents indicated
that they agree with the view that the transport sector (including mobility and logistic
service providers) had borne costs to comply with the AAQ Directives. Also
manufacturing industries (47%) and energy producers (46%) were most frequently
identified as bearing the costs, along with the competent public authorities (37%).
Box A2.3 – Feedback by stakeholder groups on efficiency
Out of the total of 489 responses to the open public consultation, 122 responses identified as
replying on behalf of an organisation and provided the name of this organisation.
A large majority of representatives of industry or business associations (46 replies in total)
agreed that the costs from abatement measures taken to comply with the AAQ Directives have
been significant (32 out of 46, 26 of which ‘completely agree’). Respondents from different
sectors of industry indicated that their respective sectors had born significant costs, i.e. especially
from the manufacturing sector (11 out of 12 replies ‘agree’), from the energy sector (10 out of 12
replies ‘agree’), and from the construction sector (6 out of 6 ‘agree’), but slightly less so from the
transport service sector (4 out of 8 replies ‘agree’). A majority of respondent from this
stakeholder group also agreed that other costs of implementation were significant, such as
monitoring equipment (31 out of 46 ‘agree’) or preparation of air quality plans (26 out of 46
‘agree’). At the same time this stakeholder group also pointed to some sectors that benefitted
from the implementation of the AAQ Directive, especially innovative industries and mobility
services.
Representatives of national, regional or local authorities (24 replies in total) also pointed to
significant costs from abatement measures taken to comply with the AAQ Directives (20 out of
24 ‘agree’). Similarly more than half of the authorities that replied agreed that the monitoring
equipment, administrative costs for reporting and preparation of air quality plans (18, 17, 16 out
of 24 replies, respectively) led to significant costs: and noted that related costs have been
primarily borne by local (20 out of 24 ‘agree’), regional (19 out of 24 ‘agree’) and national (13
out of 24 ‘agree’) authorities. Public authorities at all levels expressed overwhelming agreement
that all segments of society had benefitted from the implementation of the AAQ Directives: all
citizens (22 out of 24 ‘agree’), both in urban areas (22 out of 24 ‘agree’) and rural areas (16 out
of 24 ‘agree’), as well as particularly vulnerable population groups (21 out of 24 ‘agree’).
In contrast to the above, representatives of non-government organisations or scientific bodies
(52 replies in total) disagreed that the costs from abatement measures taken to comply with the
AAQ Directives have been significant (30 out of 52 ‘disagree’, 25 of which ‘completely
disagree’). Furthermore, a majority of respondents from this group disagreed that the monitoring
equipment, administrative costs for reporting or other tasks associated with the AAQ Directives
have led to significant costs. This group also expressed the view that the implementation of the
AAQ Directives had benefitted all citizens (39 out of 52 ‘agree) and especially citizens in urban
areas (38 out of 52 ‘agree’), as well as a range of industries (with most agreement for innovative
industries, the healthcare sector, mobility services and energy providers).
The comments in the stakeholder workshops focused on how to quantify the costs of
measures taken to improve air quality in line with the limit values from the AAQ
Directives, and quantifying benefits other than health benefits. Specifically, the costs of
air quality measures were viewed as being more important than those of complying with
other requirements from the AAQ Directives (e.g. costs of establishing monitoring
networks, administrative costs such as reporting, etc). Participants suggested developing
a common methodology to quantify the costs of air pollution not only to health but also
to agriculture and ecosystems, as this would help to show the value of addressing air

109
pollution. Others pointed to the difficulty in attributing costs (and benefits) of improved
air quality to the AAQ Directives, due to the interactions between the AAQ Directives
and other policy interventions, e.g. in sectors such as transport. Finally, it was also noted
that the majority of action plans do not have a cost-effectiveness analysis despite there
being many low-cost measures available at the local level.
The evaluation of efficiency much benefitted from the input of evidence via the targeted
questionnaire, which included questions focused on the administrative costs and burdens
associated with the AAQ Directives. In addition to providing data, questionnaire
respondents commented on the challenges of quantifying the costs and benefits
associated with the AAQ Directives. While national authorities provided significant
useful information, they also commented on the data limitations. NGOs were
significantly more likely to express concerns about the costs of non-implementation than
other respondents. Responses by local authorities tended to stress that they bear a
disproportionate share of the costs of implementing measures needed to ensure
compliance with the AAQ Directives. Industry stakeholders provided very little comment
on the topic of efficiency.
Coherence
Respondents to the open public consultation considered the National Emissions Ceiling
Directive to be strongly coherent with the AAQ Directives, with 70% indicating that it
either supports or strongly supports the implementation of AAQ Directives. Also the
coherence with the Industrial Emissions Directive (71%) was rated highly. On coherence
with other EU policies, open public consultation respondents believed that the AAQ
Directives support the EU Energy Union and Climate (low-emission mobility), the
Energy Union and Climate (climate policy), the Energy Union and Climate (Energy
policy) and Research and Innovation (Horizon 2020). In regard to policies/legislations
aimed at reducing emissions from specific sources, the highest proportion of respondents
saw coherence with the emission standards for heavy goods vehicles (73%) and emission
standards for cars and vans (70%). The common agricultural policy, on the other hand,
was deemed to hamper implementation of the AAQ Directives. Also a significant number
of respondents in the open public consultation felt the EU Emissions Trading Scheme
hampered the implementation of the AAQ Directives (17%). As regards the coherence
with planning efforts at the national, regional and local levels, respondents felt that the
objectives of the AAQ Directives were not coherently addressed in a number of national
policies, notably, taxation policy, public procurement policy, urban development policy
and industrial policy.
Stakeholder workshop participants highlighted several areas where there is a lack of
internal coherence between the AAQ Directives. In addition, participants across all
stakeholder groups expressed concerns about the coherence between air quality goals and
transport, energy and climate policy. On the issue of vehicle emission limits, a
representative of a regional authority noted the EU should consider adopting
requirements applying to existing cars. According to stakeholder comments at the
workshops, Member States have struggled to meet air quality standards due to
weaknesses in the EU legal framework for vehicle emissions. Concerns about the
coherence with agricultural and biomass related policies were raised in the workshops
with a representative of a national NGO noting EU funding schemes such as those
promoting biomass and the common agricultural policy supporting various measures that
in-crease air pollution. These have in turn made it difficult to obtain EU funding
mechanisms that support actions for air quality at national level – including under the

110
CAP’s rural development funding. It also worth noting that in the workshop, a
representative of a government health institute noted that permitting and spatial planning
decisions in their Member State do consider whether new activities are aligned with air
quality limit values, but this is not the case across the EU.
Box A2.4 – Feedback by stakeholder groups on coherence
Out of the total of 489 responses to the open public consultation, 122 responses identified as
replying on behalf of an organisation and provided the name of this organisation.
Representatives of industry or business associations (46 replies in total) agreed that the NEC
Directive supports the implementation of the AAQ Directives (40 out of 46 replies, of these
17 replies indicated ‘strongly support’). Stakeholders from this group in particular noted that the
AAQ Directives were supported by the Industrial Emission Directive and Medium Combustion
Plans (in both cases: 38 out of 46 noted ‘support’, more than half of which even noted ‘strongly
support’). Only for four policies, 7 or more out of the 46 replies (i.e. 15% or more) indicated that
the implementation of the AAQ Directives is hampered by other legislation, namely for Emission
Standards ("Euro") for cars and vans (10 replies), CO2 emissions performance standards for new
cars and vans (10 replies), the EU Emissions Trading Directive (7 replies), and the Energy
Taxation Directive (7 replies). But even for these policies more respondents considered these
policies to be of ‘support’ rather than ‘hamper’ the implementation of the AAQ Directives.
Representatives of non-government organisations or scientific bodies (52 replies in total)
agreed that the NEC Directive supports the implementation of the AAQ Directives (42 out of 52
replies, of these 30 replies indicated ‘strongly support’, this is the highest proportion of the three
stakeholder groups analysed). Respondents from this group were particular positive about the
support of most policies to the implementation of the AAQ Directives, including Energy Union
and Climate (39 replies), Emission Standards ("Euro") both for cars and vans, and for trucks
(each 39 replies), Emission Standards for Non-Road Mobile Machinery (34 replies), the Fuel
Quality Directive (36 replies), the Directive on Sulphur Content of certain liquid fuels (33
replies), the Industrial Emissions Directive (35 replies), the Medium Combustion Plants Directive
(36 replies), as well as funding via Horizon 2020 (35 replies) or the LIFE Programme (30
replies). Conversely, a relative majority of this group explicitly indicated that the implementation
of the AAQ Directives is hampered by the common agriculture policy (27 replies indicated
‘hamper’ or ‘strongly hamper’, versus only 3 replies that indicated they ‘support’ the
implementation of the AAQ Directives) and by the Trans-European Networks-Transport /
Connecting Europe Facility (20 replies indicated ‘hamper’ versus 6 replies that indicated they
‘support’ AAQ Directives implementation).
Representatives of national, regional or local authorities (24 replies in total) agreed that the
NEC Directive supports the implementation of the AAQ Directives (19 out of 24 replies, 11 of
which indicated ‘strongly support’). Feedback indicated that respondents from this group
generally considered other policies to be of ‘support’ rather than ‘hamper’ the implementation of
the AAQ Directives. Only for 3 policies a significant subset of 4 or more out of the 24 replies
(i.e. 15% or more) indicated that the implementation of the AAQ Directives is hampered by other
legislation, namely for the common agriculture policy (4 replies), ‘Emission Standards ("Euro")
for cars and vans (4 replies), and CO2 emissions performance standards for new cars and vans (4
replies).
In responses to the targeted questionnaire, a number of respondents commented on
issues relating to the internal coherence of the AAQ Directives (for example as regards
consistent approaches in setting limit values, consistency in the requirements of siting of
monitoring stations, coherence of alert thresholds). Comments on the coherence of the
AAQ Directives with other sectoral policy areas were very much focused on transport,
with 21 out of 43 respondents specifically commenting on this. Many of these responses
focused on climate measures taken in the transport sector, usually at the national or local

111
level, to reduce greenhouse gas emissions and were concerned with the potential for such
measures to undermine air quality. Other comments on sectoral policy focused on the
treatment of biomass under the Renewable Energy Directive (this was mentioned in
particular by government authorities), emissions standards for boilers under the
Ecodesign Directive, and emissions from agricultural activities. Of the small number of
industry respondents, most (4 out of 5) emphasised the need to ensure coherence between
the AAQ Directives and other legislation relevant to air quality, notably the National
Emission Ceilings Directive and the Industrial Emissions Directives – two commented
that air quality standards should be informed by what is feasible within the framework of
the Industrial Emissions Directive.
EU added value
Open public consultation respondents were generally positive about the added value of
the AAQ Directives. On the one hand, just over 50% felt that the influence of the AAQ
Directives had been strongest in increasing public awareness of air quality. On the other
hand, a significant share (37%) of respondents believed the implementation of AAQ
Directives had very little or no effect on the positive coordination at different governance
levels within the respondents’ countries. A significant majority of respondents also
agreed that EU level legislation is necessary to improve air quality at national, regional
and local level (94%), as well as to address transboundary air pollution across different
Member States (91%). In addition, the majority (54%) disagreed that national legislation
could have achieved the same results as the Air Quality Directives in reducing air
pollution. Most respondents (56%) agreed that EU enforcement capacity (e.g.
infringement procedures), reporting and monitoring coordination by the European
Environment Agency (52%) and establishment of supporting networks (41%) were key
factors in making the AAQ Directives more effective than national legislation alone.
Comments from the stakeholder workshops focused on areas where the AAQ Directives
were considered to be more effective than national legislation alone. For example, a
representative from an NGO emphasised the importance of Article 23 of Directive
2008/50/EC, which introduced the obligation to adopt air quality plans to keep
exceedances of air quality standards as short as possible, and as a result provided EU
added value driving local and national action for air quality. However, the same NGO
noted that Annex XV of the same Directive is not sufficiently clear in relation to public
participation and that AAQ Directives do not provide explicit access to justice for
challenging authorities in court when air quality standards are breached.
Overall, the respondents to the targeted questionnaire commented on a number of
aspects of EU added value of the AAQ Directives, including amongst others the added
value brought by the introduction of common air quality standards, the requirements for
monitoring and assessment, the requirements for setting up air quality plans. Most
commonly mentioned the added value of the AAQ Directives was in terms of common
air quality standards (16 respondents covering national authorities, local and regional
authorities, NGOs, scientific or research organisations, industry), monitoring and
assessment (8 respondents covering national authorities, local and regional authorities,
NGOs), air quality plans (7 respondents covering national authorities, NGOs),
information and awareness raising (6 respondents covering national authorities, NGOs).
112
Box A2.5 – Feedback by stakeholder groups on EU Added Value
Out of the total of 489 responses to the open public consultation, 122 responses identified as
replying on behalf of an organisation and provided the name of this organisation. Across all three
groups an overwhelming majority agreed that EU level legislation is necessary to improve air
quality at national, regional and/or local level (117 out of 122 replies ‘agree’) and that the AAQ
Directives are necessary to address transboundary air pollution (111 out of 122 replies ‘agree’).
Representatives of national, regional or local authorities (24 replies in total) had mixed views
about whether national legislation could have achieved the same results as the AAQ Directives in
reducing air pollution (9 out of 24 ‘agree’, versus 10 out of 24 ‘disagree’). A majority of this
group, however, still acknowledged to a ‘large extent’ or ‘very large extent’ that the
implementation of the AAQ Directives had resulted in positive change at local and/or regional
level (21 out of 24 replies), as well as to a lesser degree at national level (17 out of 24 replies).
Also this group noted that the AAQ Directives had been more effective than national legislation
alone especially in the context of reporting and monitoring coordination by the European
Environment Agency (19 out 24 replies indicated this to be the case to ‘large extent’ or ‘very
large extent’). The establishment of supporting networks (such as AQUILA or FAIRMODE)
received similar large positive feedback. Finally, this group indicated that EU enforcement
capacity, including through infringement procedures had made the AAQ Directives more
effective than national legislation alone (20 out of 24 replies indicated this to be the case to a
‘large extent’ or ‘very large extent’).
Also representatives of industry or business associations (46 replies in total) had mixed views
about whether national legislation could have achieved the same results as the AAQ Directives in
reducing air pollution (21 out of 46 ‘agree’, versus 14 out of 46 ‘disagree’). They noted that the
implementation of the AAQ Directives has resulted to ‘large extent’ or ‘very large extent’ in
increased enforcement action at EU level (24 out of 46 replies) as well as at national level (20 out
of 46 replies). Respondents from this group were less positive than other groups about the AAQ
Directives having resulted in effective coordination between Member States (9 out of 46 felt that
it did versus 7 out of 46 felt it did not, while 21 out 46 opted for the middle ground reply).
A clear majority of non-government organisations or scientific bodies (52 replies in total)
disagreed with the statement that national legislation could have achieved the same results as the
AAQ Directives in reducing air pollution (37 out of 52 ‘disagree’). This group too noted the
implementation of the AAQ Directives has resulted to ‘large extent’ or ‘very large extent’ in
increased enforcement action at EU level (31 out of 52 replies) as well as at national level (22 out
of 52 replies). They explicitly noted that EU enforcement capacity, including through
infringement procedures, was more effective than national legislation alone (36 out of 52 agreed,
of 28 to a ‘very large extent’, plus 8 to ‘a large extent’). Also, respondents from this group was
particularly critical of the mechanisms in place to promote coordinated action in implementing
the AAQ Directives between different levels of government (30 out of 52 replies) and between
different ministries (34 out of 52 replies) in their respective Member States.
Fitness for purpose of the AAQ Directives as a whole

113
Open public consultation respondents were mixed in their views on the AAQ Directives
being fit for purpose on protecting citizen’s health and the environment from the harmful
effects of air pollution. Some 25% answered ‘yes’ in addition to 22% who answered ‘no’,
while a notable proportion (35%) did not answer and 17% were neutral. The reasons
provided in support of the AAQ Directives being fit for purpose ranged from
contributions in terms of increased awareness of air pollution, positive impacts on
transboundary air pollution, contributions to improvements in health and better
protection of the environment. Other respondents believed air quality would be worse in
Europe without the AAQ Directives, and that they had set clear and binding objectives
and defined Member State responsibilities.
Similarly, a significant share of open public consultation respondents (93 respondents)
that described the AAQ Directives as not being fit for purpose, did so noting that they
were not being strict enough. Of those, a notable share (45 respondents) mentioned the
WHO Guidelines and the fact that the limits set in the Directives are lower than those
recommended by the WHO. This comment was also raised by NGO representatives in
the stakeholder workshops who called for better alignment with WHO Guidelines.
Generally, there was agreement that the AAQ Directives brought added value amongst
stakeholders that commented on this issue (national authorities, local and regional
authorities, NGOs, scientific or research organisations, industry). Differences in views
were most notable when it comes to the added value of air quality standards and (legal)
action taken by the European Commission. More specifically, while national authorities,
local and regional authorities, NGOs and scientific organisations broadly commended the
added value of the AAQ Directives in setting air quality standards and incentivising
(legal) action which led to improvements in pollution levels, one industry representative
raised concerns about EU infringement procedures and the fact that these were causing
‘politically motivated (unrealistic and not science-based) measures’. Another notable
aspect raised by one respondent (local authority) was related to the clarity of allocations
of responsibilities between and across different levels of governance at national level.
5. Inclusion of the consultation results in the support study
Contributions made by stakeholders during the consultation activities have been an
important input into the study supporting the fitness check. All stakeholder contributions
have been analysed by the consultants and taken into account in evaluation of each
criterion in the support study to the extent possible.
In general, the stakeholder comments broadly support the conclusion that the AAQ
Directives continue to be relevant, are effective, efficient, coherent and bring EU added
value; nonetheless, there are issues that require attention.

114
Annex 3: Methods and analytical models
This annex provides background to the support study design and how the more detailed
evaluation subquestions addressed in the support study relate to the six evaluation
questions presented in this Staff Working Document. This annex also provides a
typology of costs and benefits, as well as the methods and analytical models applied to
this exercise, and the limitations these carry.
1. Support study – ten evaluation sub-question
This fitness check was guided by a Roadmap222 that outlined issues, looking in particular
at the five evaluation criteria outlined in the Better Regulation agenda. This translated
into five overarching evaluation questions, one each looking at the criteria of relevance,
effectiveness, coherence and EU added value. A sixth evaluation question specifically
looked at the effectiveness and efficiency of air quality monitoring.
To inform the responses to these six evaluation questions a separate support study
analysed a total of ten more detailed evaluation sub-questions which were derived from
the above. These ten more detailed evaluation sub-questions address the same criteria,
but do so from different angles, also to allow cross-checks and further scrutiny in the
support study that cannot be replicated in this Staff Working Document.
The support study also details the judgement criteria and indicators used to guide the
analysis of the ten more detailed evaluation sub-questions. For the responses provided in
this Staff Working Document the evidence collated under these evaluation (sub-)
questions have been re-aggregated guided by Table A3.1.
Table A3.1 – Mapping the six evaluation questions of this SWD against the ten
evaluation sub-questions addressed via the support study.
Criterion Evaluation question (SWD) Evaluation sub-question (support study)
Rel
evan
ce
(1) Do the AAQ Directives still
set appropriate objectives,
address the most pressing air
pollutants, and set meaningful
standards to protect human
health and ecosystems in
accordance with evolving
scientific understanding?
EQ1 - How relevant are the goals and objectives of
the AAQ Directives to the needs of citizens; do the
AAQ Directives still address the most relevant
pollutants and set relevant standards and obligations
to protect human health and the environment; are the
AAQ Directives sufficiently adapted or adaptable to
evolving technical and scientific progress, and which
elements have become redundant in the light of key
EU air quality priorities?
222 https://ec.europa.eu/info/law/better-regulation/initiatives/ares-2017-3763998_en

115
Criterion Evaluation question (SWD) Evaluation sub-question (support study)
Eff
ecti
ven
ess
(2) To what degree have the
AAQ Directives acted as an
incentive to implement effective
measures to improve air quality,
reach the EU air quality
standards and thus reduce the
adverse impacts of air pollution?
EQ2 - What factors have contributed to meeting the
objectives of the AAQD or to failing to meet these
objectives, in terms of: 1) defining common methods
to monitor and assess air quality; 2) assessing ambient
air quality in order to monitor trends; 3) establishing
standards of air quality to achieve across the EU; 4)
ensuring that information on air quality is made
public; 5) maintaining good air quality, improving it
where it is not good; to what level can these factors
be attributed to provisions of the AAQ Directives?
Eff
ecti
ven
ess
an
d e
ffic
ien
cy
of
air
qu
ali
ty
mo
nit
ori
ng (3) To what degree are the
monitoring and reporting
approaches mandated by the
AAQ Directives (and their
respective implementation) fit
for purpose?
EQ3 - How efficient are monitoring, reporting and
assessment regimes, what are the administrative costs
to the Member States and to the Commission; taking
account of the objectives and benefits of the
directives is there evidence that they have caused
unnecessary or excessive administrative burden?
Eff
icie
ncy
(4) To what degree do the
benefits of improved air quality
justify the costs of improving air
quality? Are there significant
differences in costs (or benefits)
between Member States, and if
so, what is causing them?
EQ4 - Where there are significant cost differences
between Member States and/or between different
sectors and/or as regards costs to stakeholders
(including social costs as a consequences of poor
implementation), what is causing them; and are the
costs of compliance proportionate to the benefits
brought by the directives?
EQ5 - What are the costs and benefits (monetary and
non-monetary) associated with implementation of the
AAQ Directives in the Member States, and in the EU;
have the benefits (improved air quality) been
achieved in a cost-effective manner and to what
extent have costs been equitably distributed across
different sectors?
EQ6 - Has the implementation of the AAQ Directives
supported or hampered EU competitiveness in the
global economy; has the implementation of the AAQ
Directives improved or been detrimental to economic,
social and environmental sustainability?
Coh
eren
ce
(5) Are the AAQ Directives
coherent internally, with other
EU Clean Air policies, with
other EU legislation (e.g. on
transport, energy, agriculture or
nature protection), and with
international commitments?
EQ7 - To what extent do the AAQ Directives
complement or interact with other environmental
policies that affect air quality, or that are affected by
it, at EU level and at Member State level (such as the
NEC Directive and IED Directive as well as EU
climate legislation and policy); and how do these
policies and legislation support or hamper the
implementation of the EU air quality legislation?
EQ8 - To what extent do the AAQ Directives
complement or interact with sectoral policies that
affect air quality, or that are affected by it, at EU level
and at Member State level (such as energy, transport,
agriculture, cohesion, fiscal policies); and how do
these policies support or hamper the implementation
of the EU air quality legislation?
EU
ad
de
d
valu
e
(6) To what degree have
common EU air quality
EQ9 - To which degree have the AAQ Directives,
including common EU air quality standards and
comparable air quality assessment, management and

116
Criterion Evaluation question (SWD) Evaluation sub-question (support study)
standards and comparable
monitoring, reporting and
assessment regimes enabled
Member States to take
successful action beyond what
would have been possible
without EU action?
information approaches enabled Member States and
their competent authorities to take successful action
to improve beyond what would have been possible
without EU action?
EQ10 -What has been the EU added value of the
AAQ Directives, do the Directives and their means of
implementation create synergies or overlaps with
other Community objectives, and how has the
distribution of responsibilities between EU, Member
State, regional and local level impacted on air quality
management?
2. Typology of costs and benefits223
In this fitness check, the following types of costs of the AAQ Directives have been
distinguished:
Administrative costs and administrative burdens. Administrative costs result directly
from fulfilling the Directives’ requirements linked to monitoring and reporting activities.
In line with Commission Better Regulation Toolbox, costs incurred by public authorities
in meeting legal obligations to provide information (including reporting, monitoring and
assessment needed to provide the information) are administrative costs. These costs can
be referred to as the direct costs of the AAQ Directives, as they directly results from the
requirements set in the Directives.
Note that administrative burdens are a sub-set of the administrative costs, as they stem
from the part of the information gathering process which is done solely because of a legal
obligation. Part of the information gathering would be done even in the absence of a
legislation: some air quality monitoring was done even before the entry into force of the
AAQ Directives – this is referred to as business-as-usual administrative costs. The fitness
check distinguishes, to the extent the information is available from Member States,
between administrative costs and administrative burdens.
Costs of the measures implemented in order to reduce emissions and therefore exposure
to air pollutants and, indirectly, to fulfil the air quality standards. These measures and
their associated costs are presented in the Support Study, Appendix F. These costs can be
referred to as the indirect costs of the AAQ Directives, as they result from actions that are
not directly required by the Directives but needed in order to fulfil the standards set in the
legislation.
223 Support study informing this Fitness Check, Appendix F.

117
3. Modelling approach
In the analysis undertaken for assessing the efficiency of the AAQ Directives, modelling
was used to provide quantitative estimates of both the health benefits brought by the
implementation of the Directives and the social cost of their poor implementation
(foregone benefits). For these two aspects of the analysis, the same modelling method
was used, which is described below and in more extent in the Appendix F to the Support
Study.
The model used is ALPHA-RiskPoll (ARP), developed by EMRC specifically for air
policy scenarios assessment. The model is privately owned, though all technical details
are public.224 The model has been used for several air policy analysis, by the European
Commission, the EEA, the OECD, while specific national versions of the model are used
in France and Sweden.
The model is structured around a logical and sequential impact pathway, going from
pollution exposure to health benefits assessment. It can be applied at any scale for which
exposure (population x concentration) data are available. The main external inputs to the
model are therefore pollution concentration data, derived either from monitoring or from
other models (e.g. CHIMERE).
The model uses response functions for health impact that follow the recommendations of
the HRAPIE225 study carried out by WHO-Europe on behalf of the European
Commission. Background data on incidence and prevalence of healthy conditions come
from WHO sources. The model assesses health impacts through mortality (premature
deaths) and morbidity effects (such as hospital admissions, incidence of bronchitis, lost
work days).
The model has been extensively reviewed and debated since its development and it has
been used extensively to provide benefits assessment of air policies,226 alongside the cost-
effectiveness analysis of the GAINS model.
The modelling steps followed for both the estimation of the social costs of poor
implementation of the AAQ Directives and the health benefits they have brought are the
following (for each year between 2008 and 2016):
224 http://www.ec4macs.eu/content/report/EC4MACS_Publications/MR_Final%20in%20pdf/Alpha_
Methodologies_Final.pdf
225 Health Response to Air Pollutants in Europe:
http://www.euro.who.int/__data/assets/pdf_file/0017/234026/e96933.pdf?ua=1
226 http://www.ec4macs.eu/content/report/EC4MACS_Publications/MR_Final%20in%20pdf/Alpha_
Methodologies_Final.pdf

118
Steps Sources and potential limitations
1. Identify the fraction of the population living in
areas where concentrations of pollutants most
widely exceeded (PM10, NO2, O3) are above the
AAQ Directives limit values.
EEA data for each year (2008 to 2016)
2. Quantify extent of exceedance above limit
values in each year to quantify:
a) Reduction in exposure since 2008 for benefit
estimates
b) Residual excess exposure in each year for
quantification of social costs of poor
implementation
Quantification of exposure is reliant, for both
quantification of benefits and costs of poor
implementation, on the EEA’s frequency
distribution of exposure (see Support Study
Appendix F).
Based on this distribution, calculations are based on
a change in average exceedance with benefits
counted only for the population that has moved
from exceedance to non-exceedance.
3. Attribute reduction in exposure to the AAQ
Directives
Assumptions are made on this point, see section
below on limitations and Support Study Appendix
F1.7.
4. Quantify health impacts HRAPIE recommendations and associated data as
described in 2014 report on implementation of
HRAPIE for the earlier review of the Thematic
Strategy on Air Pollution.
5. Value health impacts Uses same values as adopted for the review of the
Thematic Strategy on Air Pollution.
4. Potential bias in the modelling, limitations:
There are several factors biasing the modelling results towards under-estimation of the
AAQ Directives benefits:
• The benefits captured in the modelling only include health benefits, omitting benefits
to natural ecosystems, agriculture, forestry and materials, which can be substantial.
• Not all health benefits are captured in the modelling. For instance, the effects of air
pollution on mental health are not accounted for (even if there is growing evidence of
those).227
• Benefits of reduced exposure are not limited to the area of exceedance as there is a
spill over into surrounding areas. These additional benefits are not accounted for in
the modelling.
• Benefits of reducing exposure do not cease once the limit values are reached but will
grow as emissions are further reduced and / or kept below the standards, as required
by the Directive requirement to maintain air quality when it is good. These are not
accounted for in the modelling.
227 See for instance Psychiatry Research, vol.272, Feb 2019, p. 8-17.

119
• On the other hand, benefits of reduced exposure occur when the exceedance
diminishes even when remaining above the standards, and this is not considered in
the modelling.
• Possible co-benefits associated with air quality measures on other policy areas (in
particular in transport and climate policies) are not accounted for.
These under-estimation bias are very likely to be much higher than the identified
potential over-estimation bias, which relate to the following limitations in the modelling:
• the change in exposure also includes some effects of other pieces of legislation (e.g.
Industrial Emission Directive, Euro Standards for vehicles) which were impossible to
disentangle from the AAQ Directives effects. However, in many cases, at least part of
the motivation to implement these other pieces of legislation is in response to the
AAQ Directives, and thus the benefit achieved via these other legislation might also
be (partially) attributed to the AAQ Directives.
It is therefore important to recognise that there are some uncertainties in the modelling
results and that they should serve for broad order of magnitude but should definitely not
be regarded as precise estimates.

120
Annex 4: Historical overview of air quality policy
The first European directives on air quality were adopted in the 1980s to establish limit
and guide values for concentrations of a limited number of pollutants.
First generation of directives on air quality
Council Directive 80/779/EEC of 15 July 1980 on air quality limit values and guide values for sulphur
dioxide and suspended particulates
Council Directive 85/203/EEC of 7 March 1985 on air quality standards for nitrogen dioxide
The experience in implementing the first directives showed that air quality assessment
was incomplete, that the data on measurements were not comparable and that information
provided to the public was insufficient. In 1996, a new Framework Directive was
adopted. It established a first comprehensive legal framework for air quality assessment,
management and setting of air quality standards. It was progressively put into operation
via its daughter directives, dealing with different (sets of) pollutants.
Air Quality Framework Directive and its Daughter Directives
Council Directive 96/62/EC on ambient air quality assessment and management (Air Quality Framework
Directive)
Council Directive 1999/30/EC relating to limit values for sulphur dioxide, nitrogen dioxide and oxides of
nitrogen, particulate matter and lead in ambient air (First Daughter Directive)
Directive 2000/69/EC of the European Parliament and of the Council relating to limit values for benzene
and carbon monoxide in ambient air (Second Daughter Directive)
Directive 2002/3/EC of the European Parliament and of the Council relating to ozone in ambient air (Third
Daughter Directive)
Directive 2004/107/EC of the European Parliament and of the Council relating to arsenic, cadmium,
mercury, nickel and polycyclic aromatic hydrocarbons in ambient air (Fourth Daughter Directive)
In addition:
Council Decision 97/101/EC establishing a reciprocal exchange of information and data from networks and
individual stations measuring ambient air pollution within the Member States (EoI Decision)
Commission Decision 2004/461/EC laying down a questionnaire for annual reporting on ambient air
quality assessment under Council Directives 96/62/EC and 1999/30/EC and under Directives 2000/69/EC
and 2002/3/EC
Commission Decision 2004/224/EC laying down the obligation of Member States to submit within two
years so-called Plans and Programmes for those air quality zones where certain assessment thresholds set
in the Directives are exceeded

121
In 2005, under the 6th Environment Action Plan, the Commission adopted the Thematic
Strategy on air pollution.228 It established targets for 2020 in terms of reductions of
exposure of EU citizens to particulate matter and ozone and with a view of protecting
ecosystems from acid rain, excess nitrogen nutrients and ozone. It also envisaged an
update of existing ambient air quality legislation through simplification and merging of
previous directives.
Hence, since 2008, the legislative framework for ambient air quality standards,
assessments, management and reporting is reflected in two main acts, i.e. Directive
2008/50/EC and Directive 2004/107/EC.
Currently in force: Ambient Air Quality Directives
Directive 2008/50/EC on ambient air quality and cleaner air for Europe (Ambient Air Quality Directive),
including the following elements:
• The merging of most of existing legislation into a single directive (except for the Fourth Daughter
Directive) with no change to existing air quality objectives
• New air quality objectives for PM2.5 (fine particles) including the limit value and exposure related
objectives.
• The possibility to discount natural sources of pollution when assessing compliance against limit
values.
• The possibility for time extensions of three years (PM10) or up to five years (NO2, benzene) for
complying with limit values.
Directive 2004/107/EC of the European Parliament and of the Council relating to arsenic, cadmium,
mercury, nickel and polycyclic aromatic hydrocarbons in ambient air (Fourth Daughter Directive)
Commission Directive (EU) 2015/1480 of 28 August 2015 amending several annexes to Directives
2004/107/EC and 2008/50/EC of the European Parliament and of the Council laying down the rules
concerning reference methods, data validation and location of sampling points for the assessment of
ambient air quality.
In addition:
Commission Implementing Decision 2011/850/EU laying down rules for Directives 2004/107/EC and
2008/50/EC of the European Parliament and of the Council as regards the reciprocal exchange of
information and reporting on ambient air quality
Consolidates and updates Council Decision 97/101/EC, Commission Decision 2004/461/EC and
Commission Decision 2004/224/EC
Between 2011 and 2013 the Commission conducted a review of the EU air policy which
resulted in the adoption of the Clean Air Policy Package. As part of the package, the
Commission proposed a Clean Air Programme for Europe,229 updating the 2005 Thematic
228 COM(2005)446. ‘Thematic Strategy on air pollution’.
229 COM(2013)918. ‘A Clean Air Programme for Europe’.

122
Strategy on Air Pollution in order to set new objectives for EU air policy for 2020 and
2030.
In 2015, the Ambient Air Quality Directives were updated by the Commission Directive
(EU) 2015/1480, which amended several of their AAQ Directives’ annexes as regards
reference methods, data validation and the location of sampling points for the assessment
of ambient air quality. These amendments were needed partly in order to clarify the
existing criteria, but also to complement the criteria taking into account, among other
things, the experience gained in implementing the Directive and most recent standards
for the sampling and measurement of particulate matter.
In 2018, the Commission adopted the Communication ‘A Europe that protects: Clean air
for all’230 that provides national, regional and local actors practical help to improve air
quality in Europe.
230 COM(2018)330. ‘A Europe that protects: Clean air for all’.

123
Annex 5: Air pollutants, their sources and abatement measures
1. Overview of air pollutant impacts, main sources, and abatement measures
Pollutant Effects and impacts Main sources
(EU-28)
Abatement measures
(examples only)
Sulphur dioxide
(SO2)
Exposure to SO2 can affect
the respiratory system and
the function of the lungs.
SO2 can aggravate asthma
and chronic bronchitis as
well as increase the risk of
infection. In addition,
sulphur compounds have
acidifying effects on soil
and freshwater damaging
plant and animal life.
• Energy production and
distribution (51 %)
• Energy use in industry
(20 %)
• Industrial processes and
product use (17 %)
• Installation of de-
sulfurisation
technologies in power
generation and industry.
• Increase the use of
renewable energy in
power generation.
• Switch to lower-sulphur
fuels.
• Improve efficiency of
energy production and
use
• Other BAT requirements
for industrial processes
Nitrogen
dioxide (NO2)
- and -
Nitrogen
oxides (NOx)
NO₂ can increase
symptoms of bronchitis
and asthma, as well as lead
to respiratory infections
and reduced lung function
and growth.
NOx are also ozone
precursors and affect
ecosystems by causing
acidification and
eutrophication.
• Road transport
(39 %) 1, 2
• Energy production and
distribution (17 %)
• Commercial and
households (14 %)
1 The relative contribution
of traffic at ground-level is
much higher.
2 Of the total emitted NOx
from traffic, around 80%
comes from diesel powered
vehicles.
• Better on-road engine
technologies (including
retrofitting of vehicles).
• Reliable and clean public
transport
• Shift to walking and
cycling (in cities)
• Urban vehicle access
regulations and low
emission zones
• Installation of de-NOx
technologies in industry
and power generation.

124
Pollutant Effects and impacts Main sources
(EU-28)
Abatement measures
(examples only)
Particulate
matter
(PM2.5)
PM2.5 is capable of
penetrating deep into lung
passageways and entering
the bloodstream causing
cardiovascular,
cerebrovascular and
respiratory impacts.
For primary PM2.5:
• Commercial and
households (56 %)
• Road transport (11 %)
• Industrial processes and
product use (10 %)
In addition, SO2, NOx, NH3
(ammonia)3 and VOCs for
secondary PM2.5 in the
atmosphere.
3 Note that the main source
for ammonia emission is
agriculture (92%)
• Substitution of dirty
stoves and boilers,
• Increase energy
efficiency (of buildings)
• City or district heating
• Use of cleaner fuels
• Use particle filters
• Shift to walking and
cycling (in cities)
• Installation of abatement
equipment at industrial
facilities, e.g. fabric
filters, electrostatic
precipitators.
Plus all measures to reduce
the precursor emissions of
SO2, NOx or NH3.
Particulate
matter
(PM10)
Health effects of PM10
include respiratory and
cardiovascular morbidity,
such as aggravation of
asthma, cardiovascular and
respiratory diseases and
lung cancer.
• Commercial and
households (39 %)
• Industrial processes and
product use (19 %)
• Agriculture (15 %)
• All the above measures
to reduce PM2.5
• Other BAT requirements
for industrial processes
• Ban of open burning of
agricultural residuals
Carbon
monoxide (CO)
CO can be harmful to
humans by impairing the
amount of oxygen
transported in the
bloodstream to critical
organs.
• Commercial and
households (48 %)
• Road transport (20 %)
• Energy use in industry
(12 %)
• Euro vehicle standards
• Increase the use of
renewable energy in
power generation
• Optimise combustion
conditions
Benzene (C6H6) Benzene is carcinogenic in
humans (IARC group 1)
and has been associated
with a range of acute and
long-term adverse health
effects and diseases.
• Road transport
• Energy use in industry
• Shift to cleaner vehicles
and low-emissions
vehicles

125
Pollutant Effects and impacts Main sources
(EU-28)
Abatement measures
(examples only)
Ozone (O3) Exposure to O3
concentrations can cause
breathing problems, trigger
asthma, reduce lung
function and cause lung
diseases. O3 also affects
ecosystems by damaging
crops, forests and other
vegetation.
Sources of O3 precursors
NOX, CO and VOCs
include:
• Road transport
• Energy production and
distribution
• Reduce energy
consumption through
energy efficiency
measures.
• Reduce NOX and
particle concentrations
(indirect effects)
Plus measures to reduce
the precursor emissions of
NOx, CO or VOCs.
Lead (Pb) Lead can damage the
nervous system, memory
and responsiveness. Toxic
metals like As, Cd, Ni and
Pb also have severe
impacts on ecosystems by
causing problems to
animals and plants through
bioaccumulation.
• Energy use in industry
(32 %)
• Industrial processes and
product use (29 %)
• Road transport (17 %)
• Adopt BAT requirements
for industrial processes,
in particular controls on
dust emissions
• Phase out / ban the use of
leaded petrol.
• Shift to zero and low-
emissions vehicles.
• Restrict or close older
and more polluting
industrial facilities.
Arsenic (As) As is carcinogenic in
humans (IARC group 1)
and causes damage to the
kidneys and negatively
affects foetal development
and the immune system.
• Energy use in industry
(40 %)
• Industrial processes and
product use (25 %)
• Energy production and
distribution (22 %)
• Adopt BAT requirements
for industrial processes,
in particular controls on
dust emissions
• Restrict or close older
and more polluting
industrial facilities.
Cadmium (Cd) Cd is carcinogenic in
humans (IARC group 1)
and causes damage to the
kidneys.
• Energy use in industry
(29 %)
• Industrial processes and
product use (29 %)
• Commercial, institutional
and households (21 %)
• Adopt BAT requirements
for industrial processes,
in particular controls on
dust emissions in metal
refining and smelting
facilities.
• Restrict or close older
and more polluting
industrial facilities.

126
Pollutant Effects and impacts Main sources
(EU-28)
Abatement measures
(examples only)
Nickel (Ni) Nickel compounds are
carcinogenic (IARC group
1) and cause damage to the
kidneys and affecting foetal
development and the
immune system.
• Energy production and
distribution (37 %)
• Energy use in industry
(17 %)
• Commercial, institutional
and households (16 %)
• Adopt BAT requirements
for industrial processes,
in particular controls on
dust emissions
• Restrict or close older
and more polluting
industrial facilities.
Benzo[a]pyrene
(BaP, C20H12)
BaP is carcinogenic in
humans (IARC Group 1)
and is an indicator of the
carcinogenic effect of the
total polycyclic aromatic
hydrocarbons (PAH).
• Industrial processes and
product use (77 %)
• Commercial and
households (especially
wood burning) (16 %)
• Agriculture (6 %)
• Energy production and
distribution (1 %)
• BAT requirements for
industrial processes, in
particular controls on
dust emissions.
• Reduce wood burning,
e.g. reduce energy
consumption, improve
energy efficiency
• Ban of open burning of
agricultural residuals
Source: Adapted from COWI Support Study based on EEA Air Quality in Europe 2016, 2017 and 2018 Reports, and WHO
Ambient (outdoor) air quality and health 2018.
Note: The data on the main sources responsible for different pollutants is from 2016 and extracted from the EEA Air Quality in
Europe – 2018 report, and EEA 2018 report European Union emission inventory report 1990-2016 under the UNECE
Convention on Long-range Transboundary Air Pollution (LRTAP). Data on the main sources responsible for NO₂ is
based on the data concerning NOx in the reports.
2. Examples of air pollution measures referred to in Directive 2008/50/EC
Directive 2008/50/EC in its Annex XV.B(3) lists a number of air pollution abatement
measures for consideration at appropriate local, regional or national level for
implementation in connection with the attainment of air quality objectives:
• reduction of emissions from stationary sources by ensuring that polluting small and
medium sized stationary combustion sources (including for biomass) are fitted with
emission control equipment or replaced;
• reduction of emissions from vehicles through retrofitting with emission control
equipment. The use of economic incentives to accelerate take-up should be
considered;
• procurement by public authorities, in line with the handbook on environmental public
procurement, of road vehicles, fuels and combustion equipment to reduce emissions,
including the purchase of:
o new vehicles, including low emission vehicles,

127
o cleaner vehicle transport services,
o low emission stationary combustion sources,
o low emission fuels for stationary and mobile sources,
• measures to limit transport emissions through traffic planning and management
(including congestion pricing, differentiated parking fees or other economic
incentives; establishing low emission zones);
• measures to encourage a shift of transport towards less polluting modes;
• ensuring that low emission fuels are used in small, medium and large scale stationary
sources and in mobile sources;
• measures to reduce air pollution through the permit system under Directive
2008/1/EC, the national plans under Directive 2001/80/EC, and through the use of
economic instruments such as taxes, charges or emission trading.
3. Source allocation of fine particulate matter PM2.5
Source allocation illustrates that air pollution is the result of contributions from multiple
sources of emissions, and originates from different geographical scales. The eight
examples below (Figure A5.1) for the sources of fine particulate matter concentrations in
cities – both primary and secondary fine particulate matter (PM2.5) – correspond to the
seven case studies illustrated in this fitness check (see Annex 11 to this SWD).
Air pollutant emissions originate from different human activities as well as from natural
sources. The examples in Figure A5.1 distinguish between emissions from transport (T),
industry (I), agriculture (A), residential (R), natural (N) or other sources (O), and
emissions from outside the EU (E). Note that in addition to primary emissions of PM2.5,
also secondary PM2.5 is formed in the atmosphere from precursor pollutants, such as
nitrogen oxides, sulphur oxides and ammonia from different sectors.
The resulting concentrations of air pollutants in a given location are the result of such
emissions contributions of different origins: transboundary pollution, emission from
other parts of the country, emissions in the immediate ‘commuting zone’ (where
relevant), and emissions that occur in the respective location (city) itself.
For details on the methodology used, please see the Urban PM2.5 Atlas: Air Quality in
European Cities published by the Joint Research Centre.
This analysis indicates that (1) there are significant differences between cities when it
comes to the dominant origins of PM2.5, both regarding the dominant sectors and
regarding the dominant geographical scale (city, rest of the country or transboundary)
(2) for many cities, local actions at the city scale would be an effective means of
improving air quality in that city, as well as having regional benefits; (3) for many cities,
sectoral measures addressing agriculture have a clear benefit on urban air quality.

128
Plovdiv (Bulgaria) Berlin (Germany)
Dublin (Ireland) Palermo (Italy)
Kosice (Slovakia) Madrid (Spain)
Stockholm (Sweden) Malmö (Sweden)
Figure A5.1 – Source apportionment and source allocation in 8 cities (examples)231
231 JRC (2017). ‘Urban PM2.5 Atlas: Air Quality in European Cities’.

129
Annex 6: Infringements and litigation under the AAQ
Directives
1. EU Court proceedings against Member States for failure to fulfil obligations
under ambient air quality legislation (2008 to 2018)
This section provides an overview of the cases referred to the Court of Justice of the EU
on the basis of Article 258 TFEU (previously Article 226 TEC) during the evaluation
period.
In a first wave of cases (2008 to 2012), the Commission initially decided to refer seven
Member States to the Court of Justice of the EU due to exceedances of PM10 limit values:
Italy, Portugal, Slovenia, and Sweden, as well as Cyprus, France and Spain.
The decision was executed only against the first four of the above Member States.
Judgements delivered by the Court of Justice of the EU in these four cases (see
Table A6.1) confirmed the violations for a specific period in the past, but did not address
the lack of appropriate measures to keep exceedance periods as short as possible.
The Commission saw a need to also address the absence or insufficiency of the measures
dealing with the different sources of PM10 pollution. Accordingly, the earlier decisions
regarding the other three Member States (Cyprus, Spain and France) were not confirmed
at the time, as the Commission considered necessary to review its strategy.
Table A6.1 – Period 2008 to 2012: Focus on breaches of limit values over a given
period, based on Directive 1999/30/EC (i.e. former First Daughter Directive) Member
State Case Pollutant Judgment
Italy C-68/11 PM10 Infringement established (EU:C:2012:815)
Portugal C-34/11 PM10 Infringement established (EU:C:2012:712)
Slovenia C-365/10 PM10 Infringement established (EU:C:2011:183)
Sweden C-479/10 PM10 Infringement established (EU:C:2011:287)
A second wave of infringements was initiated and resulted in a number of referrals to and
judgments of the Court of Justice of the EU, in the period 2013 to 2018 (see Table A6.2).
Table A6.2 – Period 2013 to 2018: Focus on persistent breaches of limit values and the
lack of adequacy of the measures aimed at attaining compliance (based on Directive
2008/50, i.e. Ambient Air Quality Directive) Member
State Case Pollutant Judgment
Bulgaria C-488/15 PM10 Infringement established (EU:C:2017:267)
Bulgaria C-730/19 SO2 Pending case
France C-636/18 NO2 Infringement established (EU:C:2019:900)

130
2. Infringement cases initiated by the Commission for non-compliance with ambient
air quality legislation (2008 to 2018, and up to October 2019 for information)
This section provides an overview of the infringement cases initiated on the basis of
Article 258 TFEU (previously Article 226 TEC) during the evaluation period, either for
excessive NO2 (Table A6.3), excessive PM10 (Table A6.4), excessive SO2 (Table A6.5),
or related to monitoring shortcomings (Table A6.6).
Table A6.3 – Infringement cases for excessive nitrogen dioxide (NO2)
Germany C-635/18 NO2 Pending case
Hungary C-637/18 PM10 Pending case
Italy C-644/18 PM10 Pending case
Italy C-573/19 NO2 Pending case
Poland C-336/16 PM10 Infringement established (EU:C:2018:94)
Romania C-638/18 PM10 Pending case
United
Kingdom C-664/18 NO2 Pending case
Member
State Case no. Current status
Austria 2016/2006 Letter of formal notice (February 2016)
Belgium 2016/2005 Additional letter of formal notice (November 2018)
Czechia 2016/2062 Letter of formal notice (July 2016)
Germany 2015/2073 Referral to Court (October 2018)
Denmark 2016/2080 Letter of formal notice (July 2016)
France 2015/2074 Judgment establishing infringement (Oct 2019)
Greece 2018/2361 Letter of formal notice (January 2019)
Spain 2015/2053 Decision to issue Referral to Court (July 2019)
Hungary 2016/2085 Letter of formal notice (July 2016)
Italy 2015/2043 Referral to Court (July 2019)
Luxembourg 2017/2101 Letter of formal notice (October 2017)
Poland 2016/2010 Letter of formal notice (February 2016)
Portugal 2015/2045 Letter of formal notice (May 2015)
United
Kingdom 2014/4000 Referral to Court (October 2018)

131
Table A6.4 – Infringement cases for excessive particulate matter (PM10)
** The case was closed due to a change of legal basis; a new case initiated to accommodate for this.
Table A6.5 – Infringement cases for excessive sulphur dioxide (SO2)
Member
State Case no. Current status
Austria 2008/2183 Closure (April 2015)
Belgium 2008/2184 Closure (September 2018)
Bulgaria 2010/2109 Letter of formal notice (Art. 260) following a judgment (November 2018)
Cyprus 2008/2185 Closure (February 2012)
Czechia 2008/2186 Additional reasoned opinion (March 2015)
Denmark 2008/2187 Closure (June 2010)
Estonia 2008/2188 Closure (May 2011)
France 2008/2190 Additional reasoned opinion (April 2015)
Germany 2008/2191 Additional reasoned opinion (November 2014)
Greece 2008/2192 Additional reasoned opinion (October 2014)
Hungary 2008/2193 Referral to Court (October 2018)
Italy 2008/2194
2014/2147
Closure (June 2013)**
Referral to Court (October 2018)
Latvia 2008/2195 Additional reasoned opinion (July 2014)
Malta 2008/2197 Closure (September 2010)
Poland 2008/2199 Judgment establishing infringement (Feb 2018)
Portugal 2008/2200
2013/2135
Closure (June 2013)**
Reasoned opinion (September 2014)
Romania 2009/2296 Referral to Court (October 2018)
Slovakia 2008/2201 Additional reasoned opinion (November 2014)
Slovenia 2008/2202
2012/2212
Closure (October 2011)**
Additional letter of formal notice (April 2016)
Spain 2008/2203 Additional reasoned opinion (October 2014)
Sweden 2008/2204
2012/2216
Closure (October 2011)**
Reasoned opinion (June 2015)
United
Kingdom 2008/2205 Closure (February 2013)
Member
State Case no. Current status*
Bulgaria 2009/2135 Referral to Court (October 2019)
Czechia 2009/2136 Closure (January 2010)

132
Table A6.6 – Infringement cases related to the monitoring network
3. Selected case law of the Court of Justice of the EU related to the implementation
of the AAQ Directives
C-237/07, Janecek (EU:C:2008:447)
Entitlement of a third party, whose health has been impaired, to have an action plan
drawn up
The case involved a dispute between Mr Dieter Janecek and Bavaria, over excessive
PM10 pollution in the city of Munich. Mr Janecek filed a lawsuit, requesting an air
quality plan to address the exceedances. The question was raised via a preliminary
reference whether he would have such a right, based on the Air Quality Framework
Directive (Directive 96/62/EC) applicable at the time.
The Court of Justice of the EU decided that where there is a risk that the emission limit
values in respect of particulate matter PM10 or alert thresholds may be exceeded, persons
directly concerned must be in a position to require the competent national authorities to
draw up an action plan. This applies even in cases where, under national law, those
persons may have other courses of action available to them for requiring those authorities
to take measures to combat atmospheric pollution.
Furthermore, Member States are obliged, subject to judicial review by the national
courts, to take measures – in the context of an action plan and in the short term – that are
capable of reducing to a minimum the risk that the emission limit values in respect of
particulate matter PM10 or alert thresholds may be exceeded.
France 2007/2181 Closure (November 2010)
Italy 2007/2182 Closure (May 2009)
Poland 2009/2137 Closure (January 2011)
Portugal 2009/2138 Closure (May 2011)
Romania 2009/2337 Closure (November 2013)
Slovenia 2007/2183 Closure (November 2008)
Spain 2007/2180 Closure (June 2010)
United
Kingdom 2007/2184 Closure (May 2008)
Member
State Case no. Current status
Romania 2017/2024 Letter of formal notice (June 2017)
Slovakia 2017/2116 Letter of formal notice (October 2017)

133
C-404/13, ClientEarth (EU:C:2014:2382)
National courts’ obligation to ensure an air quality plan is established in case of
exceedances
Due to excessive nitrogen dioxide (NO2) pollution in many zones in the UK, the NGO
ClientEarth brought a claim in front of UK courts, seeking an order requiring the
Secretary of State for the Environment, Food and Rural Affairs to revise the air quality
plans to ensure that they demonstrate how conformity with the nitrogen dioxide limit
values will be achieved as soon as possible. One of the questions raised via a preliminary
reference was related to remedies that national courts must provide in cases like this one.
In its decision, building up on the Janecek judgement (see above), the Court of Justice of
the EU decided that where a Member State has failed to comply with limit and target
values under Directive 2008/50/EC, it is for the national court having jurisdiction, should
a case be brought before it, to take, with regard to the national authority, any necessary
measure, such as an order in the appropriate terms, so that the authority establishes the
plan required by the directive in accordance with the conditions laid down by the latter.
As regards the content of the plan, while Member States have a degree of discretion in
deciding which measures to adopt, those measures must, in any event, ensure that the
period during which the limit values are exceeded is as short as possible.
C-723/17, Craeynest (EU:C:2019:533)
Locating sampling points and establishing exceedances
A number of residents of the Belgian Brussels-Capital Region and the environmental
organisation ClientEarth were in dispute with the Brussels competent authorities as to
whether an adequate air quality plan had been established for the Brussels zone. In that
regard, the court in Brussels deciding on the dispute asked the Court of Justice of the
European Union to give interpretation on the relevant provisions of Directive
2008/50/EC. It sought to clarify, first, the extent to which national courts may review the
siting of sampling points and, second, whether the results from different sampling points
may be averaged in order to assess compliance with the limit values.
Building up on the above case law, the Court of Justice of the EU decided that it is for a
national court, hearing an application submitted for that purpose by individuals directly
affected by the exceedance of the limit values from Directive 2008/50/EC, to verify
whether the sampling points located in a particular zone have been established in
accordance with the criteria laid down in that directive (i.e. that the sampling points are
placed in areas where the highest concentrations occur) and, if they were not, to take all
necessary measures in respect of the competent national authority, such as, if provided
for by national law, an order, with a view to ensuring that those sampling points are sited
in accordance with those criteria. Furthermore, in order to establish whether a limit value
with an averaging period of one calendar year has been exceeded, it is sufficient that a
pollution level higher than that value be measured at a single sampling point, and in that
case the obligation to draw up an air quality plan is triggered.

134
3. Illustrative overview of clean air cases before national courts232
Austria: One of a number of lawsuits in Austria went to the Higher Administrative Court
whose decision in October 2017 gave citizens a sound legal basis to demand measures to
protect them from health hazards arising from air pollutants. The Higher Administrative
Court with jurisdiction, ruled on 19 February 2018 that based on Aarhus Convention
environmental NGOs can order a review of compliance with the legal provisions arising
from EU environmental law.
Belgium: In a lawsuit by the NGO ‘ClientEarth’ and Brussels residents against the
Brussels government, the court decided that environmental organisations and citizens
have the right to demand appropriate measures to be implemented in the air quality plan.
After the court asked for further guidance from the Court of Justice of the EU, the
advocate general recommended the Court of Justice of the EU to rule that national courts
are obliged to review monitoring stations and that an annual average above the legal limit
at a single monitoring site is already to be regarded as exceedance. 233
Czechia: The first complaint against the air quality plan in Ostrava was filed by the NGO
‘Frank Bold’ in 2016. In December 2017, the Supreme Administrative Court rejected the
air quality plan as not being appropriate. In 2018, ‘Frank Bold’ filed another lawsuit
against the Czech Ministry of Environment to claim effective steps to improve air quality
in the cities Radvanice and Bartovice.
France: The NGO ‘Les Amis de la Terre’ with support of ‘ClientEarth’ brought a case
against the French government. In its judgment of 11 July 2017 (n° 394254), the Conseil
d‘État departed sharply from its previous decisions, stated that the air quality directive
sets an obligation of results and ordered the adoption of new and more effective air
quality plans by 31 march 2018.
Germany: Since the first case in 2005, 35 cases have been brought to court by Deutsche
Umwelthilfe, many of them with support from ClientEarth. In February 2018, the Federal
Administrative Court ruled that health protection takes precedence over economic
interest and thus cleared the way for diesel restrictions. Since January 2019, Stuttgart is
the first German city with a valid diving ban zone for driving cars of the category Euro 4
and below.
Hungary: In November 2018, the Clean Air Action Group (CAAG) with support of
ClientEarth, filed a complaint against the authorities of Hungary’s capital Budapest
concerning the ongoing exceedance of the annual NO2 and particulate matter limits in
Budapest. They call for a concrete air quality plan to be drawn up and implemented.
232 This illustrative overview reproduces a publication of Deutsche Umwelthilfe on legal actions for clean
air, and is adapted from Deutsche Umwelthilfe (2019). ‘Legal Actions for Clean Air’. The full
document is available at: https://www.right-to-clean-air.eu/fileadmin/Redaktion/Downloads/Right-to-
Clean-Air_Europe_Backgroundpaper_2019_english_final.pdf
233 Note that the information on the case in Belgium is not up-to-date, given that the Court of Justice of
the EU has delivered a judgment in the case in the meantime – for its contents, see Section 3 of this
Annex under C-723/17, Craeynest (EU:C:2019:533).

135
Italy: In the European Commission’s case against Italy, the Court of Justice of the EU
ruled on 19 December 2012 that even drastic economic measures required to comply
with air quality limit values can be demanded of member states if they are necessary to
take account of the limit values.234
The Netherlands: Following a court ruling from September 2017 by the Court of The
Hague, the Netherlands must take immediate action against air pollution. The
environmental protection organisation ‘Milieudefensie’ achieved this success. The state
was sentenced to concrete measures to comply with all European limit values in a
‘foreseeable and demonstrable’ manner.
Poland: In Poland, residents, supported by the NGO ‘Frank Bold’, are currently claiming
their right to challenge air quality plans at the Constitutional Court. Although no ruling
was passed at the time of writing, the increased pressure on the authorities has already
led to considerably improved air quality plans.
Slovakia: In February 2017, a group of citizens from Bratislava and NGOs
‘Cyklokoalicia’ and ‘ClientEarth’, with the assistance of Via Iuris, took legal action
against the Bratislava air quality plan. In November 2018, the Slovak Regional
Administrative Court dismissed the air quality plan, saying it was vague and insufficient.
The Municipality of Bratislava did not appeal the ruling and is now drafting a new plan
that, according to the court’s guidelines, must include effective measures to improve air
quality in the city in the shortest possible time.
Spain: The environmental NGO ‘Ecologistas en Accion’ filed a lawsuit against the lack
of an air quality plan addressing illegally high levels of ozone in the region Castilla y
Leon. In particular, the court found that the lack of a national air quality plan could not
excuse the failure to act of the regional authorities. On 19 October 2018, the High Court
of Valladolid ordered to the Regional Government to prepare within one year an air
quality plan to tackle levels of ozone in the region exceeding the EU target values.
Sweden: In 2008 the ‘Swedish Society for Nature Conservation (SSNC)’ brought a case
against the city of Stockholm for failing to take measures included in its air quality plan.
Despite a 2012 court ruling in SSNC’S favour, the lack of any effective remedy has
allowed the city to continue to delay taking action.
United Kingdom: In February 2018 ‘ClientEarth’ won for the third time against UK
government. The High Court ruled that the court should have effective oversight of the
UK government’s next air quality plans. It means, for the first time ever, that
‘ClientEarth’ will be able to immediately bring the government back to court if it
prepares an air quality plan which is unlawful.
234 Note that the original publication of ‘Deutsche Umwelthilfe’ which this Annex reproduces lists a case
related to Italy that is in fact Commission proceedings against Italy before the Court of Justice of the
EU, and not citizen or NGO action before a national court.

136
Annex 7: Comparison of the situation in 2008 with 2018
1. Key air quality indicators for 2008 and 2018 (or latest available data)
Table A7.1 Comparison of the current situation with the situation prior to the AAQ
Directives for selected key indicator (using the latest published data as proxy for 2018) Key indicators 235 Prior to AAQ Directives Current Situation (2017)
Air quality monitoring
- Number of monitoring stations More than 3 000 (a) More than 4 000 (b)
- PM10 sampling points 2 694 (in 2008) (c) 3 117 (in 2017) (b)
- PM2.5 sampling points 540 (in 2008) (c) 1 536 (in 2017) (b)
- SO2 sampling points 2 114 (in 2008) (c) 1 579 (in 2017) (b)
- NO2 sampling points 3 140 (in 2008) (c) 3 102 (in 2017) (b)
Air quality standards
- limit values established for: 6 pollutants (PM10, NO2, SO2,
Pb, CO, Benzene) (d)
7 pollutants (as before, plus
PM2.5 - since 2015) (e)
- target values established for: 1 pollutant (O3) (d) 5 pollutants (O3, plus As, Cd,
Ni, BaP- since 2012) (e)
Number of air quality exceedances (share of air quality zones that report exceedances)
- PM10 (daily limit value) 37 % (in 2008) (f),(c) 18 % (in 2017) (f)
- PM2.5 (annual limit value) 6 % (in 2008) (f),(c) 7 % (in 2017) (f)
- NO2 (annual limit value) 28 % (in 2008) (f),(c) 23 % (in 2017) (f)
- O3 (8-hours mean target value) 45 % (in 2008) (f),(c) 28 % (in 2017) (f)
- BaP (annual target value) 22 % (in 2008) (f),(c) 18 % (in 2017) (f)
- for all other pollutants 2% or less (in 2008) (f),(c) 1% or less (in 2017) (f)
Magnitude of air quality exceedances (highest level of exceedance reported)
- PM10 (daily limit value) 280 days (h) 130 days (h)
- PM10 (annual limit value) 99 µg/m3 (h) 64 µg/m3 (h)
- PM2.5 (annual limit value) 42 µg/m3 (h) 41 µg/m3 (h)
- NO2 (annual limit value) 115 µg/m3 (h) 84 µg/m3 (h)
235 Sources: (a) SEC(2005)1132: ‘Thematic Strategy on air pollution’;
(b) https://tableau.discomap.eea.europa.eu/t/Aironline/views/Content_stats/SPO-1year-npollutants;
(c) ETC/ACC Technical paper 2010/1. ‘The state of the air quality in 2008’;
(d) Directives 96/62/EC, 1999/30/EC, 2000/69/EC, 2002/3/EC;
(e) Directives 2008/50/EC and 2004/107/EC;
(f) Support study informing this Fitness Check, Table 6-6; based on EEA data;
(g) https://www.eea.europa.eu/data-and-maps/indicators/exceedance-of-air-quality-limit-3/assessment-4;
(h) Also see Figures 4a, 4b, 4c, respectively, for details per Member State; based on EEA data.

137
Urban population exposed to air pollution above selected limit or target values
- PM10 (daily limit value) 23.9 % (in 2008) (g) 13.2 % (in 2016) (g)
- PM2.5 (annual limit value) 12.6 % (in 2008) (g) 5.5 % (in 2016) (g)
- NO2 (annual limit value) 12.3 % (in 2008) (g) 7.3 % (in 2016) (g)
- O3 (8-hours mean target value) 15.3 % (in 2008) (g) 12.4 % (in 2016) (g)
Air quality reporting and information
- reporting of air quality data via questionnaires and bespoke
spreadsheets
via e-reporting (i.e. machine
readable reporting formats)
- visits to EEA air quality website ca. 100 000 visits (in 2008) ca. 900 000 visits (in 2018)
2. Changes over time of the health impacts of air pollution
The 2018 EEA annual air quality report presented the long-term evolution of exposure of
the European population to fine particulate matter (PM2.5) concentrations from 1990 to
2016, based on a range of different datasets. These datasets included methodological
differences but all of them were based on a combination of observed data and modelled
results. Based on this the report assumes with confidence that the risk associated with air
pollution has, at least, halved in the period 1990 to 2015; but the report also indicates that
the reductions have been larger in the 1990s than after 2000 (see Figure A7.1).236
Figure A7.1 – Premature deaths due to exposure to PM2.5 in Europe over the period 1990
to 2016 for various datasets of PM2.5 concentration
236 EEA Report 12/2018. ‘Air quality in Europe – 2018 report’.

138
Annex 8: The 2018 Clean Air Outlook
Key findings of relevance for the AAQ Directives
In 2013, when the Clean Air Policy Package (comprising the Clean Air Programme for
Europe237 and the NEC Directive proposal238) was adopted, it was announced that the
underpinning modelling analysis would be updated regularly via a regular report on air
quality in Europe. Accordingly, the First Clean Air Outlook was published in June
2018.239 It was supported by several modelling studies that also provided indication of the
extent to which, by delivering on a wider set of air and climate legislation, Member
States would move towards lower air pollution levels.240
The modelling analysis underpinning the First Clean Air Outlook primarily shows, based
on cost-effectiveness optimisation, the extent of the additional measures that Member
States would need to take to attain their emissions reductions commitments for 2030, as
set in the NEC Directive. Most Member States would have to take additional measures,
at least for some pollutants,241 which would lead them to just achieve their commitments.
However, some Member States would already over-achieve their emissions reductions
commitments set in the NEC Directive, without additional measures.
This is due to the joint effect of the implementation of the legislation limiting emissions
sources (e.g. Ecodesign Directive, Industrial Emissions Directive, Medium Combustion
Plant Directive), of the measures taken in view of the climate and energy 2030 targets
and of the synergies in the reduction of some pollutants (some measures aimed at one
pollutant actually also reduce others, at no cost). Member States in this category, which
would over-achieve their NEC Directive emissions reduction commitments, would also
see an improvement in their air pollutants concentration levels moving them closer to
WHO Guidelines values.
Overall, at EU level, the modelling analysis projects larger emissions reductions than
required by the NEC Directive for 2030,242 and therefore also higher health benefits,243
237 http://ec.europa.eu/environment/air/clean_air/index.htm
238 COM proposal which became Directive 2016/2284/EU.
239 COM(2018)446. ‘The First Clean Air Outlook’.
240 In particular relevance here:
http://ec.europa.eu/environment/air/pdf/clean_air_outlook_overview_report.pdf and
http://ec.europa.eu/environment/air/pdf/clean_air_outlook_economic_impact_report.pdf
241 14 Member States would have to take additional action to reach SO2; 13 for NOx; 15 for PM2.5; 25 for
VOC and 26 for NH3.
242 7% over-achievement for SO2, 9% for NOx, 13% for PM2.5 and 8% for VOC. There is no over-
achievement projected for NH3.

139
provided all the synergies and interactions described above take place. The modelling
also projects that, in the most positive case of all synergies between policies being
reaped, the share of EU population exposed to PM2.5 concentrations over the WHO
Guidelines value would decrease from 88% in 2005 to 13% in 2030.
Figure A8.1 – Distribution of population exposure in the EU-28 to PM2.5 levels in 2005
and 2030 (Note: ERR 2030 depicts the results of a model-based projection that assumes
all emission reduction commitments under the NEC Directive are indeed delivered) 244
However, this EU-level result hides disparities in pollutants concentrations, across and
within Member States, leading to some regions in EU still overpassing the WHO
Guidelines values in the 2030 modelling results. In these parts of EU, even with the
implementation of all cost-effective measures available to meet the NEC Directive
commitments, additional measures (hence not cost-effective although technically feasible
under the modelling framework) would still be needed to reach WHO Guidelines values.
Two areas in Europe are expected to face continued exceedances of WHO Guidelines
value for PM2.5, i.e., Northern Italy and Southern Poland. Source apportionment analyses
for these areas indicate that, after implementation of all measures that are required to
meet the emission reduction commitments under the NEC Directive, secondary particles
formed in the atmosphere in the presence of ammonia will still contribute about half of
the WHO Guidelines value for PM2.5, despite the expected reductions in NH3 emissions.
Another large fraction of remaining ambient PM2.5 is expected to be due to primary
emissions of particles from the residential combustion of solid fuels, i.e., predominantly
wood stoves in Italy, and coal and wood stoves in Poland. However, it should be noted
243 By 2030, premature deaths would drop by 54% in relation to 2005, compared to the 52% of the 2013
Commission proposal for the Clean Air Policy package.
244 IIASA (2018). Progress towards the achievement of the EU’s air quality and emissions objectives.
https://ec.europa.eu/environment/air/pdf/clean_air_outlook_overview_report.pdf
0
100
200
300
400
500
600
2005 ERR 2030
milli
on pe
ople
Exposure range
Below WHO guideline (< 10 µg/m3) 10-15 µg/m3 15-25 µg/m3 >25 µg/m3

140
that also this analysis confirms that with the technical measures available, the WHO
Guidelines value for PM2.5 could be reached at almost all stations.
In any event, measures are not always chosen based on cost-effectiveness only, with
social and political considerations often playing a significant role. The modelling
analysis shows that the cost-effectiveness criteria would lead to a shift in the cost-sharing
away from the economic sectors that have already implemented several cost-effective
measures (e.g. road transport) towards sectors where many cost-effective measures are
still available (e.g. agriculture).
However, if the choice of actual measures follows other than cost-effectiveness
considerations only, this would increase the overall cost and/or hamper the attainment of
the reduction commitments, with impacts on the pollutants concentrations levels.

141
Annex 9: Air quality policy and other European institutions
Summaries of recent input of other institutions to air quality policy
1. European Court of Auditors Special Report no. 23/2018: ‘Air pollution: Our
health still insufficiently protected’245
11 September 2018
In this audit, the European Court of Auditors assessed whether EU actions to protect
human health from air pollution have been effective. To do this, it examined whether (i)
the AAQ Directive was well designed to tackle the health impact of air pollution; (ii)
Member States’ effectively implemented the Directive; (iii) the Commission monitored
and enforced implementation of the Directive; (iv) air quality was adequately reflected in
other EU policies and adequately supported by EU funds; and (v) the public has been
well informed on air quality matters.
The European Court of Auditors concluded that EU action to protect human health from
air pollution had not delivered the expected impact. The significant human and economic
costs have not yet been reflected in adequate action across the EU.
– The EU’s air quality standards were set almost twenty years ago and some of them are
much weaker than WHO Guidelines and the level suggested by the latest scientific
evidence on human health impacts.
– While air quality has been improving, most Member States still do not comply with
the EU’s air quality standards and were not taking enough effective action to
sufficiently improve air quality. Air pollution can be underestimated as it might not be
monitored in the right places. Air quality plans – a key requirement of the Ambient
Air Quality Directive – often did not deliver expected results.
– The Commission faces limitations in monitoring Member States’ performance.
Subsequent enforcement by the Commission could not ensure that Member States
complied with the air quality limits set by the Ambient Air Quality Directive. Despite
the Commission taking legal action against many Member States and achieving
favourable rulings, Member States continue to frequently breach air quality limits.
– Many EU policies have an impact on air quality, but, given the significant human and
economic costs, we consider that some EU policies do not yet sufficiently well reflect
the importance of improving air quality. Climate and energy, transport, industry, and
agriculture are EU polices with a direct impact on air quality, and choices made to
implement them can be detrimental to clean air. The European Court of Auditors
noted that direct EU funding for air quality can provide useful support, but funded
245 https://www.eca.europa.eu/Lists/ECADocuments/SR18_23/SR_AIR_QUALITY_EN.pdf

142
projects were not always sufficiently well targeted. It also saw some good projects –
particularly some projects supported by the LIFE programme.
– Public awareness and information has a critical role in addressing air pollution, a
pressing public health issue. Recently, citizens have been getting more involved in air
quality issues and have gone to national courts, which have ruled in favour of their
right to clean air in several Member States. Yet, the Ambient Air Quality Directive
protects citizens’ rights to access to justice less explicitly than some other
environmental Directives. The information made available to citizens on air quality
was sometimes unclear.
The European Court of Auditors made recommendations to the Commission aimed at
improving air quality. Its recommendations cover more effective actions which should be
taken by the Commission; the update of the Ambient Air Quality Directive; the
prioritisation and mainstreaming of air quality policy into other EU policies; and the
improvement of public awareness and information.
2. Opinion of the European Economic and Social Committee on the ‘Clean air for
all’ Communication of the Commission246
12 December 2018
In its exploratory opinion on the Commission Communication ‘Clean air for all’, the
European Economic and Social Committee (EESC) reached the following conclusions.
The EESC considers that it is imperative to reduce pollution in the commercial,
institutional, household and transport sectors. The institutions and Member States must
set a good example here, and more support programmes must be set up to help
individuals shift to clean, modern and more energy efficient forms of heating.
The additional legislative measures proposed by the European Commission to remedy
certain problems, such as ‘Dieselgate’, or action taken against Member States which have
failed to comply with current rules on air pollution are a step in the right direction and the
EESC endorses this approach.
The EESC firmly believes that the new environmental and transport regulations must be
flanked by economic support measures to promote innovation and the development of
new clean technologies, such as fuel cells, electric cars and alternative heating and
ventilation systems.
International cooperation is crucial for combating pollution and climate change, and the
EESC welcomes the broad consensus among Member States on meeting the Paris
Agreement objectives. The exchange of good practices in this area and the Green
246 NAT/751-EESC-2018-03845.

143
Diplomacy Network are very important. Furthermore, specific measures are needed to
reduce pollutants in the Member States in order to meet the Agreement's targets.
3. Conclusions of the Council of the European Union on the European Court of
Auditors Special Report no. 23/2018 on air pollution247
20 December 2018
In its conclusion of 20 December 2018, the Council of the European Union welcomed the
Special Report No 23/2018 by the European Court of Auditors entitled ‘Air pollution:
Our health still insufficiently protected’, taking note of the conclusions and
recommendations contained in that report. It also acknowledged that these conclusions
and recommendations are timely and an important contribution for the ongoing fitness
check of the Ambient Air Quality Directives.
Citizens’ health is still affected by air pollution, which remains the biggest environmental
risk to health in the Union causing more than 400 000 premature deaths each year and the
significant human and economic costs have not yet been reflected in adequate action
across the Union.
The Council stressed that air quality has significantly improved over the past decades
with the adoption of Union air quality standards with the Ambient Air Quality Directives
as major drivers of such improvements. Admittedly, however, not all goals of the
Ambient Air Quality Directives have been fully met.
The Council emphasised the need for further effective air quality measures and coherent
legislation across Union policies and for an enhanced emphasis on and prioritisation of
air quality policies therein. It is also important to design and align other sectoral policies
such as energy, agriculture, spatial planning and transport and make the necessary
investments to contribute to reducing air pollution as the benefits of air quality policies
greatly exceed their implementation cost.
The Council also welcomed that the Commission is performing a fitness check of the
Ambient Air Quality Directives and it invited the Commission to consider a revision of
the existing legal framework in order to enable a more efficient and effective
implementation and enforcement of air quality provisions. It also advised to take the
latest scientific evidence on human health impacts into account and to take the WHO
Guidelines into consideration.
247 Conclusions of the Council of the European Union no. 14794/18, 20 December 2018.

144
4. Joint report on air quality by the European Organisation of Supreme Audit
Institutions (EUROSAI)248
30 January 2019
This joint report was prepared by 15 supreme audit institutions (SAIs) from EU Member
States and neighbouring countries, i.e. the national audit offices in Albania, Bulgaria,
Estonia, Georgia, Hungary, Israel, Kosovo, Northern Macedonia, Moldova, the
Netherlands, Poland, Romania, Slovakia, Spain and Switzerland, together with the
European Court of Auditors.
The joint audit uncovered wide discrepancies between the 15 countries covered by the
audit. At one end of the scale was Estonia, which was found to comply with all the
relevant standards. At the other end were Poland and Bulgaria, two countries that the
European Commission recently brought before the European Court of Justice on account
of their continued failure to meet the limit values.
Based on the findings of the joint audit, the participants make the following six
recommendations:
1. prepare and implement air quality plans;
2. measure the effectiveness of action taken;
3. improve coordination between governments and executive agencies;
4. collect relevant data and perform cost-benefit analyses;
5. improve monitoring systems;
6. raise public awareness of the problem.
5. European Parliament resolution on the Commission Communication ‘A Europe
that protects: Clean air for all’249
13 March 2019
In its resolution on the ‘Clean air for all’ Communication, the European Parliament i.a.
urged the Commission to act without delay on PM2.5 by proposing the introduction of
more stringent compliance values for these particles in EU air quality legislation, as
recommended by the World Health Organization. It also urged the Commission to assess
and review the legislation only on the basis of robust, up-to-date, independent and peer-
reviewed scientific evidence.
The European Parliament expressed regret that, despite being competent for air pollution,
DG Environment’s objectives are often undermined by policies and interests coming out
of other departments. It also supported the continuation of the Clean Air Dialogues
between the Commission and Member States.
248 https://english.rekenkamer.nl/publications/reports/2019/01/30/joint-report-air-quality
249 European Parliament resolution on ‘A Europe that protects: Clean air for all’ (2018/2792(RSP)).

145
The European Parliament expressed regret that the criteria for locating sampling points to
measure pollutants leave Member States a certain amount of leeway and risk not
achieving the aim of representativeness and it called on the Commission to analyse the
impact this leeway has on the comparability of samples and its direct consequences.
The European Parliament called for various measures to reduce air pollution from the
transport (focussed on urban areas and vehicle emissions, and also referring to shipping),
agriculture (particulate matter, ammonia and methane), energy sector (welcoming
commitments made to phase out coal) - as well as highlighting the needed to address
indoor air pollution. It furthermore highlighted air pollution science and research needs
as well as funding considerations.
6. Study for the European Parliament: ‘Sampling points for air quality’250,251
March 2019
A study carried out on request by the Committee on the Environment, Public Health and
Food Safety, Policy Department for Economic, Scientific and Quality of Life Policies of
the European Parliament assessed whether the criteria for the monitoring and assessment
of air quality laid down in the AAQ Directives allow for a harmonised and consistent
implementation of the AAQ Directives throughout the EU.
It analysed the criteria for the location of monitoring sites in five Member States252 to
identify ambiguous provisions that might lead to different assessments of air pollution
exposure. Furthermore, the study investigated differences in exposure and exposure
trends in the selected Member States and provides an overview of measures implemented
to improve air quality and of information provided to the public.
The study concluded that most of the requirements of the AAQ Directives are fulfilled in
the air quality zones analysed in this study. However, the information available does not
allow an analysis of whether the pollution hotspots have been identified in all zones and
Member States. It also pointed to a number of ambiguities in the provisions of the AAQD
that can lead to different interpretations
The study offered a number of specific recommendations, including a need for clearer
provisions for the identification of highest concentrations and general population
exposure, for clarification of ambiguities in criteria of and guidance for the siting of
sampling points, for more obligatory modelling to complement fixed monitoring, and for
and an increase in the required minimum number of PM2.5 sampling points.
250 Nagl, C., Spangl, W., Buxbaum, I., Sampling points for air quality, Study for the Committee on the
Environment, Public Health and Food Safety, Policy Department for Economic, Scientific and Quality
of Life Policies, European Parliament, Luxembourg, 2019.
251 http://www.europarl.europa.eu/RegData/etudes/ATAG/2019/631058/IPOL_ATA(2019)631058_EN.pdf
252 Based on a representative selection of sampling points in Austria, Germany, France, Italy, and Poland.

146
Annex 10: Evolving public perceptions on air quality
Overview of Eurobarometer surveys and the most recent results
1. Overview of conducted Eurobarometer surveys
Over the evaluation period there have been three Eurobarometer surveys carried out on
the topic of air quality.
• Flash Eurobarometer 360 (2013) – ‘Attitudes of Europeans towards air quality’;
• Special Eurobarometer 468 (2017) – ‘Attitudes of European citizens towards the
environment’ with a focus on air pollution, and
• Special Eurobarometer 497 (2019) – ‘Attitudes on air quality in the EU’.
The two Special Eurobarometer survey in 2017 and 2019 relied on gathered public
opinion from face-to-face interviews at home and in the native language of the
interviewees. In 2017, some 27,881 EU citizens from different social and demographic
categories were interviewed, whereas in 2019 there were 27,565 interviews conducted
following the same methodology.
The Flash Eurobarometer published in 2013, based on interviews carried out in 2012,
relied on a different method, with interviews by telephone (fixed-line and mobile phone)
carried out with some 25,525 European citizens in 2012.
The next section provides an overview of the results of the 2019 Special Eurobarometer,
reflecting the current view of EU citizens on air quality.
2. The 2019 Special Eurobarometer: Attitudes on Air Quality in the EU
Overall conclusions from the 2019 Special Eurobarometer253
Overall, the results of this survey reveal that air quality is a serious concern for European
citizens who feel that the situation has deteriorated in the last ten years, and who are
calling for more actions at all levels to tackle a problem that is perceived to be growing.
Citizens do not feel well-informed, and they feel that air quality is deteriorating
A majority of Europeans still do not feel informed about air quality issues in their
countries (54%), as was the case in the previous Eurobarometer Flash conducted 2012.
This is the case in 20 of the 28 European Union Member States.
While Europeans do not feel well-informed, most of them say that air quality has
deteriorated in the last ten years (58%). They are now even more likely to say this than
253 Conclusion as appear in European Commission (2019). Special Eurobarometer 497: ‘Attitudes of
Europeans towards air quality’.

147
they were in 2017, with an 11-percentage point increase observed. In 19 Member States,
more than half of the respondents agree. The less they feel informed, the more they feel
air quality has deteriorated in the last 10 years.
Concerns about the health and environmental consequences due in part or mostly to
air quality issues were tested. Most Europeans think that respiratory diseases (90%),
cardio-vascular diseases (89%), and asthma and allergy (90%), and acidification and
eutrophication (82%) are serious problems in their countries.
Despite the fact that a majority of respondents have taken some action to reduce
harmful emissions, they still believe that not enough is being done and that actions
should be carried out at a more global level.
While Europeans feel concerned about air quality issues, they believe that not enough is
being done to address these issues. Around half of the respondents think that farmers
(49%) and households (52%) are not doing enough. An even larger proportion of
respondents think that car manufacturers (64%), energy producers (65%) and public
authorities (66%) are not doing enough.
Despite the fact that a majority of respondents think that households should do more,
seven in ten respondents have carried out at least one action to reduce harmful
emissions into the air. This has increased by eight percentage points since 2017 and is
one of the most positive results measured in this survey. This increase is mostly due to
the increased proportion of respondents who say they have replaced older energy-
intensive equipment with new equipment with a better energy rating, which
represents 41% of the respondents (+9 percentage points since 2017). The more informed
respondents feel about air quality, the more likely they are to have taken actions to
address this issue.
The most effective measure to address air quality issues according to respondents is
stricter pollution controls on industrial and energy-producing activities. This is
mentioned by 44% of the respondents and is the first answer in 25 Member States. Their
preferred level of action is the international level (72%) followed by the European and
national levels (both 50%). The international level is the main level of action mentioned
in 24 Member States. A significant proportion of the respondents believe that actions
should be carried out at all levels (28%): international, European, national and regional
levels.
Respondents want more actions on air quality standards at the EU level despite low
awareness of the existing EU air quality standards
A minority of Europeans have heard of the EU air quality standards (31%). Except in
Slovenia (51%), less than half of the respondents say they are aware of them. A large
majority of the respondents who have heard of them, however, say that they should be
strengthened (63%) [see Figure A10.1]. In all but five Member States, more than half of
the respondents are of this opinion. Finally, more than seven in ten respondents think that
the EU should take additional measures to address these issues (71%). This is the
case in all Member States surveyed [see Figure A10.2].

148
Figure A10.1: Replies to the question ‘Do you believe the existing EU air quality
standards are adequate or not?’ (% - EU).
Source: Special Eurobarometer 497 (2019).
Figure A10.2: Replies to the question ‘Do you think the EU should propose additional
measures to address air quality related problems in Europe?’ (% - EU).
Source: Special Eurobarometer 497 (2019).

149
Annex 11: Summaries of the seven case studies
Seven case studies have been carried out for the purpose of gathering more in-depth
information for some of the evaluation questions. The main purpose of the case studies
was to examine, in more detail, the situation regarding the experience and lessons learnt
in the implementation of the AAQ Directives.
The case studies include a more detailed review of implementation and integration
successes and problems, the costs of implementation and of non-implementation of the
legislation and the administrative burden of implementation and opportunities for
improving implementation without compromising the integrity of the purpose of the
AAQ Directives. As such, the case studies complement the information gathered through
other sources, such as desk review, targeted questionnaire, open public consultation,
interviews, focus groups and stakeholder workshops (see section 4 of this SWD).
The focus for detailed case studies have been selected to include examples in Member
States based on the following criteria:
• the level of compliance, including at least one Member State which is largely
compliant and one which is not;
• the level of progress in addressing air quality issues: one Member State which has
made high levels of progress and one Member State which has had poor progress in
addressing air quality issues;
• at least one Member State that is faced with ongoing infringement proceedings and at
least one that is not;
• ensuring a geographical balance, between northern and southern as well as eastern
and western Member States;
• ensuring coverage of different scales of agglomerations and population density;
• at least one Member State with a higher level of economic development, and least
one country with a lower level of economic development and funding for air quality;
• at least one Member State with a federal and at least one Member State with a
centralized governance structure;
• there should be an availability of evidence in the Member State.
Based on the above criteria, the following seven Member States were selected: Bulgaria,
Germany, Ireland, Italy, Slovakia, Spain and Sweden.
The seven case studies follow the same template and consistent methodology and
questions. At the same time, each case study is unique and provides different insights
into the country specific challenges and best practices in relation to the implementation
of the AAQ Directives. Each case study is focusing on the implementation of the AAQ
Directives and then on a specific topic or geographical area, in particular:
• Bulgaria with focus on air quality zone Plovdiv Agglomeration
• Germany with focus on Berlin Agglomeration
• Ireland with focus on public information provision
• Italy with focus on the Sicily region

150
• Slovakia with focus on Kosice region
• Spain with focus on Madrid
• Sweden with focus on rural environment and ecosystem impacts
The case studies relied on extensive desk research of relevant documents, 40 in-depth
interviews with relevant national authorities (central, regional and local), representatives
of businesses and business associations, representatives of NGOs, environmental and
municipalities’ associations, research institutions and health foundations.
Air quality continues to be a source of concern across all selected Member States
although some variations exist depending on the situation in the specific country.
Overall, the case studies find that the AAQ Directives are relevant in terms of their
objectives and in terms of responding to current needs. Broadly speaking, the type of
pollutants regulated by the AAQ Directives are relevant and there are some variations in
terms of the types of pollutants relevant for different Member States.
However, some findings suggest that important pollutants which are a source of concern
in certain Member States are not regulated by the AAQ Directives (e.g. black carbon,
ammonia, ultrafine particles). Furthermore, the provisions related to the air quality
standards are considered to be relevant across all country case studies but, in some
instances, the need for more stringent air quality standards was noted.
Table A11.1 – Assessment of relevance of the AAQ Directives in the case studies254
Bulgaria Air quality is considered to have deteriorated in the past 10 years by 59% of the
respondents to Special Eurobarometer 468 (2017).
The AAQ Directives are assessed to address the needs at national level (e.g. in terms of
monitoring of air quality, provision of information and planning of measures).
The AAQ Directives are considered to target relevant pollutants but the limit values do
not sufficiently reflect specific local, climate or social conditions.
Germany Air quality is considered to have deteriorated in the past 10 years by 29% of the
respondents to Special Eurobarometer 468 (2017).
The AAQ Directives are assessed to address the needs at national level and are considered
to be essential (in particular the monitoring and assessment and the limit values)
Pollutants regulated by AAQ Directives remain relevant and there is a need to further
focus on pollutants with a high effect on human health (e.g. PM2.5, ultrafine particles).
Ireland Air quality is positively regarded by citizens as only 17% of Irish citizens consider that air
quality has deteriorated in the last 10 years, while 33% suggest that it has improved,
according to Special Eurobarometer 468 (2017)
The AAQ Directives provisions are considered to be relevant, in particular limit values;
there is also evidence that the regulatory framework should be expanded to include PM1.
254 Based on: support study informing this Fitness Check, Appendix I.

151
Italy A majority of citizens responding to Special Eurobarometer 468 (2017) perceived air
quality as having deteriorated in the past 10 years (61% of respondents).
The AAQ Directives provisions have been and remain relevant, in particular in relation to
air quality plans and limit values which are important to mitigate the negative effects of
air pollution.
Slovakia Air quality is a source of concern for 43% of respondents to Special Eurobarometer 468
(2017) that consider air quality in Slovakia remained the same over the past 10 years and
a similar amount considered it has deteriorated.
The objectives of the AAQ Directives, in particular those related to the availability of
information to the public and monitoring of long-term trends were considered to be
relevant.
There are different views amongst stakeholders in terms of the air quality standards and
whether the existing air quality standards are too lenient.
Spain Air quality is a concern for Spanish citizens, with 68% of respondents of Special
Eurobarometer 468 (2017) considering air quality in the country to have deteriorated over
the past 10 years.
The current AAQ Directives provisions were considered to be relevant, but findings
suggest that the AAQ Directives should be stricter with new pollutants added and
stronger limits imposed.
Sweden Air quality continues to be a concern in Sweden, as Special Eurobarometer 468 (2017)
indicates that 46% of respondents perceived air quality stayed the same in the past 10
years and 24% that it has deteriorated.
Air quality standards imposed by the AAQ Directives are relevant but the Swedish
legislation goes beyond the values imposed in the AAQ Directives and a need to set a
daily limit for PM2.5 was indicated.
The case study findings indicate that the selected Member States have monitoring and
assessment networks that are generally in line with the requirements of the AAQ
Directives.
Table A11.2 – Air quality monitoring in the case studies255
Bulgaria Responsibility of the local authorities together with the ministry of environment: comprises
48 monitoring stations: 30 fixed automated measuring, 5 differential optical absorption
spectroscopy, and 9 stations for manual sampling).
Germany Responsibility of the German states and the Environment Agency (Umweltbundesamt): Air
quality is measured in 650 monitoring station throughout Germany.
Ireland Responsibility of EPA and local authorities; the monitoring network meets the
requirements of the AAQ Directives but some rural and urban areas are left without
assessment.
255 Based on: support study informing this Fitness Check, Appendix I.

152
Italy Responsibility of the regions and autonomous provinces (regional/local) and the Italian
National Institute for Environmental Protection and Research – ISPRA (national).
Improvements of the monitoring network planned under Sicily's Operational Programme.
Slovakia Responsibility of the Slovak Hydrometeorological Institute and local authorities.
Monitoring network had 34 monitoring stations (2007). In 2016, the monitoring network
had 38 stations. Shortcomings in the monitoring in terms of number of sampling points.
Spain Responsibility of the autonomous communities and municipalities: 600 fixed measurement
stations at national level.
Sweden Responsibility of the Swedish EPA (rural) and municipalities (urban).
Each municipality monitors NOx, SOx, CO, PM10, PM2.5, benzene, BaP, As, Cd, Ni, Pb.
Swedish EPA monitors PM2.5, NO2, SO2, O3.
Some Member States provide real-time data on air quality through a variety of tools but
the quality of the information is of varying levels (see examples in the table below). This
is supported also by the findings from the European Court of Auditors, which flagged
some good practices in this regard and pointed out that the quality and availability of
public information on air quality in the Member States was not always found to be clear
or useful for the citizens regarding the health impacts and measures to take to mitigate
risks.256 Also, the study found that Member States, regions and cities defined air quality
indices differently, resulting in different assessments of the same air quality, somewhat
compromising the credibility of the information provided
Table A11.3 – Information to the public in the case studies257
Bulgaria Daily bulletin on exceedances on air quality
Quarterly bulletins on air quality
Common SMS system for exceedances and alert thresholds
Information boards and information on websites of municipalities
Germany Website of the German Environment Agency (UBA)
Annual Report of the German Environment Agency (UBA)
Dedicated websites of federal states
256 European Court of Auditors Special Report on Air Pollution. See section 1 of Annex 9 to this SWD.
257 Based on: support study informing this Fitness Check, Appendix I.

153
Ireland Air Quality Index for Health (AQIH)
Periodic Air Quality bulletins and reports
Citizen engagement and citizen science
Historical data on air quality publicly accessible
Real-time localised particulate matter monitoring data
Italy Websites of regions containing air quality information
Forecasting tool providing real time data (48-72 hours forecast)
Annual Report on Quality of the Urban Environment, ISPRA
Spatial maps using modelling
Notification during pollution peaks (SMS or email)
Data series that are downloadable for analysis
Slovakia Website providing air quality and exceedances information (Slovak Hydrometeorological
Institute and district offices)
Near real-time data on concentrations on the website (most recent hourly and daily values)
Annual Report on air quality
Spain Website proving information (Ministry of Environment)
Smartphone app
Sweden Website providing air quality information (EPA
Datasets with air quality measurements
Annual Reports
Information on air quality provided by municipalities
The case studies also addressed the issue of costs of the implementation and the costs of
non-implementation of the AAQ Directives in the Member States. Data on the costs of
implementation and the costs of non-implementation of the AAQ Directives was difficult
to find; this is primarily due to the limited number of studies at national level looking
into these aspects.
Table A11.4 – Costs of implementation in the case studies258
Bulgaria
(national)
Monitoring (of environment): EUR 1.9 million
Air quality plans: EUR 1.5 million (approx. EUR 50 000 per plan)
Air quality measures: EUR 156.8 million
Germany No data available for this case study
258 Based on: support study informing this Fitness Check, Appendix I.

154
Ireland
(Dublin)
Monitoring (infrastructure): EUR 160 000 (since 2008)
EPA annual capital replacement cost: EUR 380 000 per year
EPA annual staff cost for AAQ Directives: EUR 493 000 per year
Dublin City Council monitoring infrastructure capital cost: EUR 160 000
Dublin City Council monitoring infrastructure operating cost: EUR 15 000 per year
Costs of time spent by the relevant persons involved in making measurements,
calculations, predictions or estimations in Dublin: EUR 300 000 per year
Total annual costs (EPA and Dublin Council): EUR 1 806 735
Italy Monitoring (varies across regions): between EUR 20 000 – EUR 32 000 per station
(approx. EUR 5 million per year for all stations)
Monitoring (maintenance): EUR 300 000 per year
Slovakia Ministry of Environment: estimated in the range of EUR tens of millions per year
Monitoring (operating): EUR 1.2 million per year
Spain Plan AIRE implementation: EUR 600 000
Monitoring network maintenance (national): variable according to area (between
EUR 100 000 and over EUR 1 million)
Contracts with laboratories: EUR 30 000 per year.
Sweden EPA budget for AAQ: EUR 400 000 per year (approx. EUR 200 000 to EUR 300 000 for
AAQ Directives).
Total estimated annual cost for all fixed measurements (EUR): EUR 1 859 490
Modelling (regional background concentrations of O3, NO₂ , SO₂ ) annual cost: EUR
65 000
Reference laboratory quality check of data: EUR 50 000
Table A11.5 – Costs of non-implementation in the case studies259
Bulgaria Health related external costs: EUR 3 billion per year (2010)
Premature deaths: 14,200 (PM), 640 (NO2), 350 (O3) (2015)
Total costs (health and non/health) due to traffic pollution: EUR 612 to EUR 778 million
(2016)
Germany No data was available for this case study.
Ireland No data was available for this case study.
Italy No data was available for this case study.
259 Based on: support study informing this Fitness Check, Appendix I.

155
Slovakia Health related external costs: EUR 3 billion per year (2010)
Direct economic costs: 1.3 million workdays lost due to sickness, for healthcare of above
EUR 10 million per year (income adjusted, 2010), and for agriculture (crop losses) of
EUR 35 million per year (2010).
Premature deaths: 5 160 (2014)
Spain Costs of road pollution (both health and non-health related): between EUR 3 916 million
and EUR 4 836 million
Sweden Health related external costs: EUR 3 billion per year (2010)
Premature deaths: 7 600 (2015)
Socio-economic costs: EUR 5.4 billion (2015)
The majority of the selected Member States made use of EU funding to improve air
quality to varying degrees.
Table A11.6 – Use of EU funding to fund air quality improvements (examples from the
case studies)260
Bulgaria Cohesion policy funds: under OP Environment 2007-2013, adjacent measures (e.g. waste
management, public transport) which also supported air quality objectives
Cohesion policy funds: under OP Environment 2014-2020 specific objective Reducing
ambient air pollution by lowering the quantities of PM10 and NOx (EUR 50 million)
Germany ERDF: 6 programmes related to air quality 2014-2020 (EUR 92.3 million).
LIFE: use of funding to finance 30 projects related to air quality.
Ireland Horizon 2020: iSCAPE project
LIFE Programme includes air quality and emissions as a thematic priority
Italy ERDF: Air quality priority (priority code 47) for the 2007-2013 period (EUR 25.4 million)
ERDF: Air quality priority (priority code 83) for the 2014-2020 period (EUR 30.7 million)
EAFRD: Rural Development programmes include funding for reducing agricultural
emissions
LIFE Programme: PREPAIR Project (EUR 10 million – EU); OPERA
Slovakia ESF: environmental investments for the 2007-2013 period (EUR 1.82 billion)
ESF: environmental investments for the 2014-2020 period (EUR 215 million)
Spain ERDF: OP ‘Actions to improve the environment in cities’ including air quality measures
(EUR 24 million)
Sweden LIFE Programme: supported air quality actions (e.g. CLEANTRUCK project)
The allocation of responsibilities in relation to air quality is split between the national,
regional and local level across selected Member States, as illustrated in the table below.
260 Based on: support study informing this Fitness Check, Appendix I.

156
Broadly speaking, the central governance (Ministry of Environment or Environmental
Protection Agency) is responsible for the regulation and supervision of air quality.
Monitoring and assessment is devolved at regional and local level in all Member States
with the oversight of the national authorities. Air quality plans are generally the
responsibility of local and regional levels.
The case studies highlighted that, in some cases, difficulties in effective coordination
amongst different levels of government within Member States can be noted. The issue of
coordination seems to arise especially when different levels of governance are involved
(e.g. local-central, local-regional). This is due to the fact that in some instances, air
quality plans contain measures that fall in the remit of responsibility of other national or
regional authorities. Such situations can lead to a decreased effectiveness and added
value of air quality plans
Table A11.7 – Examples of instances of coordination (or lack of coordination) of air
quality plans measures identified in the case studies261
Bulgaria Central level: Instances of good coordination between national authorities (ministries)
were found (e.g. coordination of Ministry of Environment with Ministry of Labour,
Ministry of Transport). However, further coordination can be sought in relation to energy
(Ministry of Energy).
Local/regional level: Coordination between local and central level is insufficient. For
example, 25 Bulgarian municipalities have signed the Covenant of Mayors and prepared
Sustainability Energy Action Plans. Of those, two have signed also the Mayors Adapt
initiative and are expected to prepare Sustainable Energy and Climate Action Plans
(SECAPs). Even though some of these municipalities also have air quality problems, links
between the SEAPs/SECAPs and the municipal air quality plans are hardly found. In
addition, the municipalities rarely update their SEAPs and thus do not take advantage of
the available guidance on how to integrate different policy concerns in their SEAPs. Few
municipalities in Bulgaria have a Sustainable Urban Mobility Plan (SUMPs) but in general
air quality has not been a focus area of those plans. Air quality plans could also be
integrated or linked with municipal/urban/regional level planning e.g. in the area of land
use and spatial planning.
Italy Central level: Instances of good coordination between national authorities (ministries)
were found (e.g. 2013 Action Plan). Coordination has also improved as a result of the
work of a coordination body that prepared national guidelines to avoid regional
fragmentation.
Local/regional level: Coordination on air quality plans at local level has improved and has
spurred coordination with mobility plans, rural development and energy efficiency
initiatives. The plans have strengthened coordination between regional and municipal
levels and among municipal governments.
261 Based on: support study informing this Fitness Check, Appendix I.

157
Ireland Central level: Coordination between authorities at central level is found. For example,
coordination has taken place when it comes to the setup of the National Clean Air
Strategy.
Local/regional level: Strong and productive culture of collaborative partnership working
between the Irish authorities and institutions at subnational level. This has facilitated the
integration of air quality objectives into a broad range of linked policy areas including
urban planning and climate change, suggesting that the AAQ Directives have been
cohesive with other areas of policy.
Spain Central level: Coordination between authorities has taken place but can be further
improved in particular between authorities responsible for air quality and authorities
responsible for transport measures.
Local/regional level: Coordination between authorities at local and regional level can be
further improved. The coherence of the governance structure imposes difficulties when it
comes to the implementation of measures to improve air quality that can fall in the remit
of responsibility of authorities other than those at local level that are drafting the air
quality measures.
Slovakia Central level: Coordination between the authorities at central level has taken place when
it comes to the Strategy for the Improvement of Air Quality in Slovakia.
Local/regional level: Allocation of responsibilities and the somewhat limited coordination
between different actors constituted a major barrier to the effective implementation of the
AAQ Directives in Slovakia and in the Košice region. While, in principle, it is possible to
elaborate effective measures for the air quality plans, it is not always possible to see them
materialise. For example, the authorities in Slovakia may be well aware that a city bypass
would likely improve air quality, but in practice it would be difficult to get such a bypass
built because the district office, elaborating the measure, does not have the powers
necessary to make the development decision.
Sweden Central level: The central authorities coordinate in the adoption of strategic framework.
Local/regional level: Coordination in terms of air quality plans between the local and
central level can be further improved in some cases. In particular when it comes to the
implementation of air quality plans certain measures that are included in the plans are in
the remit of responsibilities of national authorities which makes it difficult to ensure their
implementation. For example, air quality plans may require a reduction of pollutants in the
proximity of national roads but the regulation of national roads is in the area of
responsibility of the National Roads Administration. This imposed certain challenges in
terms of translating measures into reality. In recent years cooperation has improved and
the National Roads Administration has taken measures to secure air quality.

158
Annex 12: Overview of costs and benefits identified
Overview of costs and benefits identified in the evaluation262
Type of costs and
benefits
Definition / subset Estimates
Cost of air pollution (for
EU)
Cost of air pollution
(total)
EUR 330 and 940 billion per year (based on
source IA for Clean Air Programme, 2013)
EUR 730 billion in 2015 (based on OECD)
Cost of poor
implementation of AAQ
Directives (foregone
benefits)
EUR 240 billion for period 2008 to 2016 (based on
Support Study)
Costs of all measures
that result in air quality
improvements
This includes costs of
measures taken for other
than air purposes
EUR 70 to 80 billion per year (based on Amman et
al, 2017)
Cost of measures
directly linked to AAQ
Directives
Estimate of Plovdiv agglomeration: EUR 25
million over period 2011 to 2015 (based on case
study in the Support Study)
Health Benefits of
measures taken to
respond to AAQ
Directives
This is only a small sub-
set of overall benefits
EUR 50 billion for 2008 to 2016 (based on
Support Study)
Administrative costs of
AAQ Directives
Cost linked to the legal
obligation to provide
information (includes
monitoring, reporting and
assessment
Per capita administrative costs of all air quality
monitoring and reporting estimated EUR 0.14 and
0.98 per year, based on data from 8 Member States
(based on Support Study)
Ex ante estimate: EUR 24 000 per monitoring
station, broadly in line with case study findings
(which pointed to between EUR 7 500 and
EUR 70 000, depending on Member State) (based
on Thematic Strategy on Air Pollution, and case
studies in the Support Study).
Annual cost for the EEA estimated at
EUR 760 000 for period 2014 to2016 (based on
Fitness Check Reporting & Monitoring)
Administrative burden
(subset of administrative
costs stemming
specifically from the
AAQ Directives)
Per capita estimate: EUR 0.12 to 0.38 per year,
based on data from 3 Member States
(based on Support Study)
262 Note that methodologies differ for the different estimates; these should therefore not be compared (see
section 5.3 and Annex 3 to this SWD for context and limitations).


![STRATEGY - Cairngorms National Park · [CAIRNGORM AND GLENMORE STRATEGY ENVIRONMENTAL REPORT] December 2015 Cairngorms National Park Authority | Cover Note i Cover Note PART 1 To:](https://img.pdfslide.net/doc/110x75/5fa22760951f7b3de03eb267/strategy-cairngorms-national-park-cairngorm-and-glenmore-strategy-environmental.jpg)