Embed Size (px)
Citation preview
Creating a 21st Century National Innovation System for a 21st Century Latvian Economy
by
Alfred Watkins and Natalia Agapitova
Alfred Watkins Lead Private Sector Development Specialist Europe and Central Asia Region World Bank [email protected] 202-473-7277 Natalia Agapitova Consultant Europe and Central Asia Region World Bank [email protected] World Bank Policy Research Working Paper 3457, November 2004 The Policy Research Working Paper Series disseminates the findings of work in progress to encourage the exchange of ideas about development issues. An objective of the series is to get the findings out quickly, even if the presentations are less than fully polished. The papers carry the names of the authors and should be cited accordingly. The findings, interpretations, and conclusions expressed in this paper are entirely those of the authors. They do not necessarily represent the view of the World Bank, its Executive Directors, or the countries they represent. Policy Research Working Papers are available online at http://econ.worldbank.org. We would like to thank William Maloney, Shahid Yusuf, and Yevgeny Kuznetsov from the World Bank, Tatyana Soubottina ([email protected]), formerly of the World Bank Institute, and Tom Ruddy of Trykor Technology Corporation (www.trykor.com) for their time and extraordinarily helpful comments and suggestions.
Pub
lic D
iscl
osur
e A
utho
rized
Pub
lic D
iscl
osur
e A
utho
rized
Pub
lic D
iscl
osur
e A
utho
rized
Pub
lic D
iscl
osur
e A
utho
rized
Pub
lic D
iscl
osur
e A
utho
rized
Pub
lic D
iscl
osur
e A
utho
rized
Pub
lic D
iscl
osur
e A
utho
rized
Pub
lic D
iscl
osur
e A
utho
rized
2
Abstract The Latvian economy made great strides in recovering from the economic shock of the early transition and the adverse after-effects of the 1998 Russian financial crisis. Nevertheless, Latvia faces serious challenges to its future growth and prosperity despite these impressive achievements and the outward appearance of macroeconomic stability and economic progress. However, a wide variety of recent studies suggest that the Latvian economy is not particularly competitive and, even more worrisome, they indicate that Latvia is not well positioned to gain ground in the race for global competitiveness, prosperity, and rising standards of living. Most of Latvia’s growth to date has come from one-off gains generated by structural reforms, privatization, and reallocating resources, not inexhaustible reservoirs of growth. Latvian enterprises will be able to sustain economic growth and create high wage jobs only by becoming internationally competitive, innovating, accumulating new knowledge and technology, and finding a high value added niche in the European and global division of labor. This paper is designed to help Latvian leaders (i) develop and clear diagnosis of the innovation and competitiveness challenges facing Latvia as it prepares to enter the EU and, more importantly (ii) design and implement policies and programs to ensure that Latvia reaps the maximum possible benefits from EU structural funds. Section II analyzes the current structure of Latvia’s production, imports, and exports. Section III utilizes data from a number of competitiveness reports to benchmark Latvia’s current progress against a number of comparator countries and to pinpoint Latvia’s strengths and weaknesses as an innovative economy. Section IV offers a detailed list of potential policies and programs that could improve the competitiveness of Latvian enterprises and the efficiency of the Latvian NIS. The recommendations include specific policies and programs to improve (i) the production of knowledge in Latvia, (ii) the commercialization of technology produced by Latvian scientists, small companies, and research institutes, and perhaps most importantly, (iii) local firms’ capacity to absorb, adapt, and adopt existing knowledge produced outside Latvia for use inside Latvia.
3
List of Contents
I. Introduction............................................................................................................... 5
II. Latvia’s Industrial Structure................................................................................. 12 A. Productivity........................................................................................................... 12 B. Technology Vs. Labor Intensive Industries .......................................................... 14 C. FDI Flows ............................................................................................................. 19 D. The Forestry Sector: Microcosm of Latvia’s Problems and Prospects................. 22
III. Benchmarking Latvia ............................................................................................. 26 A. Global Competitiveness Report ............................................................................ 26 B. World Bank Knowledge Economy Index (KEI)................................................... 29 C. Porter and Stern: National Innovation Capacity .................................................. 32
IV. Reforming Latvia’s National Innovation System ................................................ 35 A. Enterprise Sector – Little Innovation and Less R&D ........................................... 35
V. Latvia’s NIS – Change without Reform ............................................................... 40 A. Production of Knowledge ..................................................................................... 40 B. Technology Commercialization............................................................................ 55 C. Absorption and Diffusion of Knowledge.............................................................. 64
List of Figures
Figure 1 Labor productivity per employed person in 2002 .............................................. 12 Figure 2 Structure of Latvia’s Manufacturing Exports in 2001, as % of Total ................ 13 Figure 3 Productivity gains in selected manufacturing sectors compared to.................... 13 Figure 4 Technology Driven & Labor Intensive Industries' Share in Manufacturing
Production, 1999....................................................................................................... 14 Figure 5 Human Resources Utilization, 2000-2001 ......................................................... 15 Figure 6 Exports Produced in Technology-Driven Industries .......................................... 16 Figure 7 Exports Generated by Labor-Intensive Industries.............................................. 16 Figure 8 Indicators of intra-industry trade with the EU (15) ............................................ 17 Figure 9 Exports to the EU by Labor Skill Requirements:............................................... 18 Figure 10 Relative market shares in the EU by industry clusters, 1999 ........................... 19 Figure 11 FDI stock in manufacturing industry................................................................ 22 Figure 12 Forest Sector Share of Total Latvian Exports .................................................. 22 Figure 13 Trade Balance of Latvia ................................................................................... 23 Figure 14 Export of Wood and Wood Products, 2001...................................................... 24 Figure 15 Exports of Forest Cluster in Latvia and Finland .............................................. 24 Figure 16 Forest Cluster Structure in Finland................................................................... 25 Figure 17 KE Index in Latvia and Selected European Countries ..................................... 29 Figure 18 Economic and Institutional Regime in Global Context.................................... 30 Figure 19 Latvia’s Education in Global Context .............................................................. 31 Figure 20 ICT in Global Context ...................................................................................... 31
4
Figure 21 Innovation Index in Global Context ................................................................. 32 Figure 22 Embodied Technology Flows in the United States .......................................... 36 Figure 23 Innovation Expenditures in Latvia in 2001 ...................................................... 37 Figure 24 Innovation Expenditures in Manufacturing...................................................... 37 Figure 25 Strategic and organizational changes in innovative and non-innovative
enterprises in 1999-2001, % ..................................................................................... 39 Figure 26 The Industrial Technology Development System: A Schematic Framework .. 41 Figure 27 Hierarchy of the Structure of Industrial Technology ....................................... 42 Figure 28 New S&E Graduates in 2000 ........................................................................... 44 Figure 29 Gross domestic expenditure on R&D (GERD) as % of GDP, 2001 ................ 45 Figure 30 A EPO patent applications (per million population) ........................................ 55 Figure 31 Patents Issued by the US to Residents of Foreign Countries (per million
population) ................................................................................................................ 56 Figure 32 From Academy to Industry............................................................................... 62 Figure 33 Nine dimensions of Technological Capability ................................................. 65 Figure 34 Groups of Firms According to Technological Capability ................................ 66
List of Tables
Table 1 FDI Stock in Knowledge Intensive Sectors, 2001.............................................. 20 Table 2 Foreign Investment Stock by Sector of Economy ............................................... 21 Table 3 Global Competitiveness Indexes for Latvia and Selected Economies ................ 27 Table 4 National Innovation Capacity Index and Sub-Indexes ........................................ 34 Table 5 Innovative enterprises by enterprise size group, 1999-2001 ............................... 35 Table 7 Factors Hampering Innovative Activity, in %..................................................... 38 Table 8 Changes in R&D Personnel in Latvia, 1989-1999 .............................................. 43 Table 9 Age Distribution of Researchers in Latvia, 2000 ................................................ 44 Table 10 Breakdown of Education Programs by Area ..................................................... 45 Table 11 R&D Expenditures in 2001............................................................................... 46 Table 12 Private Sector Participation in R&D in 2001..................................................... 47 Table 13 The WIFO taxonomies of manufacturing industry............................................ 71
List of Annexes Annex 1 Industry Groupings: WIFO Taxonomies........................................................... 71 Annex 2 Commercializing IP: The US Experience ........................................................ 74 Annex 3 Sample Technology Commercialization Course Outline.................................. 80 Annex 4 Technology Audits ........................................................................................... 81 Annex 5 Technology Transfer Offices ............................................................................ 88 Annex 6 Technology Transfer Office Procedures ........................................................... 89 Annex 7 Technology Incubators...................................................................................... 92 Annex 8 The US Government’s SBIR Program.............................................................. 94
5
I. Introduction The Latvian economy made great strides in recovering from the economic shock of the early transition and the adverse after-effects of the 1998 Russian financial crisis. GDP growth has been robust, averaging close to 6% p.a. over the past five years. Inflation is low. The currency is stable. Internal and external deficits are at sustainable levels. Annual FDI inflows and gross fixed capital formation, which grew at a 19% annual rate between 1996 and 2001,1are both at relatively healthy levels. Standards of living and consumption are both growing at a steady pace. And perhaps most importantly, Latvia became a member of the European Union on May 1, 2004. Nevertheless, Latvia faces serious challenges to its future growth and prosperity despite these impressive achievements and the outward appearance of macroeconomic stability and economic progress. Most of Latvia’s growth to date has come from pent up consumer demand and efficiency gains generated by structural reforms, privatization, and reallocating resources from loss making enterprises to more profitable enterprises. Unfortunately, these are one-off gains, not inexhaustible reservoirs of growth. Latvian enterprises will be able to sustain economic growth and create high wage jobs only by becoming internationally competitive, innovating, accumulating new knowledge and technology, and finding a high value added niche in the European and global division of labor. Looked at from this vantage point, the picture is not so rosy. Simply and starkly stated, a wide variety of recent studies suggest that the Latvian economy is not particularly competitive and, even more worrisome, they indicate that Latvia is not well positioned to gain ground in the race for global competitiveness, prosperity, and rising standards of living. All this bodes poorly for Latvia’s future competitiveness and prosperity unless leaders of Latvia’s business, government, university, and scientific communities develop and implement clear, concrete policies to address these challenges. Successive Latvian governments have formally approved and adopted a number of policy papers including a National Concept on R&D (1998), a National Concept on Innovation (2001), the National Innovation Program (2003) and the Draft Programme Complement of the Single Programming Document for Latvia 2004-2006 (2003).2 These documents clearly describe some of the most critical weaknesses and pressing challenges that Latvia
1 Latvia Innovation survey, chapter 3, page 17. 2 Priority 2 of the Single Programming Document is devoted to “Promotion of Enterprise and
Innovation” and lists such objectives as creating new enterprises and increasing competitiveness of existing enterprises via transition to knowledge-intensive production and designing, producing and marketing internationally competitive products and services.
6
must overcome if it wishes to develop a National Innovation System (NIS)3 that can be an instrument for creating wealth, raising standards of living, and increasing global competitiveness. These documents acknowledge the importance of upgrading the technological base and global competitiveness of traditional Latvian industrial sectors.4 But the recommendations emphasize (i) the production and commercialization of domestic R&D and (ii) the development of new high tech industries. They tend to downplay or ignore policies and programs that would (i) help to upgrade the technological capability and productivity of those traditional economic sectors that account for the largest share of Latvian employment and exports and (ii) help Latvia develop an efficient system to absorb and diffuse knowledge produced elsewhere. This is not surprising. Latvia is struggling with two related challenges. The first is reforming the NIS so that it becomes a tool for converting the country’s considerable scientific capacity and human capital into an asset for economic growth, competitiveness, and rising standards of living. The second is enhancing competitiveness and productivity in non-high tech sectors. In confronting these twin challenges, Latvian policy makers need to address several policy dilemmas. Specifically:
• Dilemma #1: Basic Research vs. Innovation and Technology Upgrading. Basic research and innovation are not synonymous concepts, especially in countries like Latvia where most enterprises operate far below the technological frontier. As we will show in more detail below, very few Latvian enterprises innovate and most of these firms innovate by importing capital equipment rather than by either conducting basic research themselves or purchasing research services from Latvian or foreign research institutes. For better or worse, in other words, innovation and basic research in Latvia are separate, distinct, and discrete activities. Policy makers may be missing an important opportunity to increase employment, wages, and overall standards of living if they focus on basic research to the exclusion of the more “mundane” tasks of technology upgrading -- design and engineering, the ability to acquire technology developed outside the country, and the managerial, organizational and technical capacity simply to
3 The NIS can be defined as the way in which the private sector, universities, R&D institutes, and
government policies interact to generate inventions and innovations that can be converted into new products or production processes that enhance the competitive advantage of firms in that country.
4 For example, Chapter 1 of the National Innovation Program for 2003-2006 states, “Restructuring of the
Latvian economy must be carried by stimulating the transformation of the traditional economic sectors on a productive technical and technological basis as well as creating for the first time in Latvia new branches based upon new knowledge and up-to-date technologies.” Similarly, the Innovation Survey (Chapter 3, page 18, declares, “GDP growth can be ensured only by increasing the value added of the manufactured goods and services. This can be achieved by increasing the material input and labor capital involved in the production process. Due to the limited possibilities to increase input the main way how to ensure GDP growth is to boost the amount of the intellectual capital in business.”
7
utilize more advanced technology – in those core industries which operate far below the technology frontier.5
• Dilemma #2: High Tech Sectors Vs. High Value Added. Contrary to popular
opinion, high tech is not always synonymous with high value added, high wages and rapid growth. On the contrary, transition economies such as Latvia may get more development “bang for the buck” by helping such “low tech” sectors as forestry and food processing increase value added than by trying to develop a few high tech niche products and industries. Policy makers, however, tend to view high tech as the surest route to competitiveness and prosperity. They mistakenly devote considerable resources to building up a small high tech sector while ignoring the competitive enhancing opportunities available from the much larger non-high tech part of the economy.6 At a minimum, some balance needs to be restored to the high tech/non-high tech equation. An imbalance could be especially damaging to long run growth and economic stability if government support of high-tech sectors creates a dual economy: on the one hand a low wage, low productivity traditional sector responsible for the bulk of employment, GDP and exports and, on the other hand, a small high-tech sector that is more or less disconnected from the rest of the economy.
• Dilemma #3: Production and Sale of Knowledge Produced Inside Latvia vs.
the Import, Absorption, and Diffusion of Knowledge Produced Outside Latvia. Policy makers should not focus solely on the commercialization of knowledge produced inside Latvia at the expense of helping firms import innovative technology produced outside Latvia and adapting it for local use. This issue is especially critical for Latvia. Total annual R&D spending in Latvia from all public, private and foreign sources is about equal to one week’s R&D spending by one large US corporation. And the total number of R&D personnel in Latvia is equivalent to the total R&D personnel in one mid-sized US laboratory. Thus, even if Latvia boosts R&D spending (as a share of GDP) to the EU average, vastly improves the targeting and efficiency of its R&D spending, and commercializes a large share of those technological innovations generated in Latvian laboratories, Latvia will still be a minor player in the global R&D arena. Like it or not, therefore, most of the economically relevant knowledge that Latvian firms will need to boost productivity and compete internationally will be produced is produced elsewhere. Latvia’s success in the global economy will depend as much on the ability and willingness of Latvian enterprises (both foreign-owned and domestic) to adapt and utilize knowledge produced outside
5 It is also important to note that adopting, adapting, and applying the results of basic research requires
advanced managerial and organizational capacities. When firms do not have these capacities, it will be futile for governments to finance large amounts of basic research in the hope that this will generate increased levels of innovation and enterprise productivity.
6 For example, computers are generally regarded as high-tech activities. However, assembling computers is not a high wage, high tech activity, even though computers are classified as a high tech export in international trade statistics. Similarly, forestry sector exports are classified as a low tech export, although as we will show in more detail below, forestry activities can be either high tech or low tech depending on how much skill, knowledge, and research is applied.
8
Latvia as it will be for Latvian scientists to commercialize the knowledge produced inside Latvia. Latvian policy makers and business executives, therefore, need to devote more attention to enhancing Latvia’s ability to scour the world for knowledge, import it into Latvia, adapt it for local use, and integrate it into local production processes.
• Dilemma #4: SMEs vs. Large Enterprises. Policy recommendations to
improve the functioning of the R&D and innovation systems typically focus on the promotion of high tech SMEs. This is prompted by a desire to replicate the success of Silicon Valley. But it is also based on a misunderstanding of the Silicon Valley phenomenon. True, Silicon Valley is a hotbed of small, high tech startups. But these SMEs did not arise in a vacuum or in isolation from large dynamic enterprises. On the contrary, SMEs which operate without a dense network of linkages to dynamic larger (foreign or domestic) enterprises will most likely not become a source of well paying jobs, economic competitiveness and rapid growth. Instead, they are likely to become little more than low productivity, subsistence operations. Put differently, links to dynamic large enterprises may be a critical pre-requisite for the emergence of dynamic SMEs. If so, policy makers may be making a serious blunder if their SME policies do not pay sufficient attention to helping large Latvian enterprises become more dynamic and competitive and helping Latvian SMEs become qualified suppliers to dynamic Latvian, EU, or international large enterprises. Developing these supplier relationships through well targeted training policies, supplier development programs, and entrepreneurship education, should become a more prominent feature of Latvia’s SME policy, innovation policy, and competitiveness strategy.
• Dilemma #5: Innovation Vs. Everything Else. Innovation policy covers many issues that at first glance would appear to have little to do with innovation. For example, one influential analysis of factors that influence the “national environment for innovation”7 refers to such items as “sophisticated and demanding local customers,” “home customer needs that anticipate those elsewhere,” the “presence of capable local suppliers and related companies,” “vigorous competition among locally based rivals,” and the “presence of clusters instead of isolated industries.” These business environmental factors help to establish a strong demand for innovation. They give local enterprises the incentive to innovate, the knowledge about what innovation could be most profitable, the capacity to assess technology options. In this respect, they are a critical complement to local R&D capacity. Unfortunately, Latvia and many other transition economies rank rather well on indices of scientists and engineers and perform rather poorly on indices of clusters and linkages. Their major weakness, in other words, is their relative inability to utilize knowledge and human capital effectively and efficiently. This suggests that policy makers will
7 Michael E. Porter and Scott Stern, “National Innovation Capacity,” Chapter 2.2 in Porter, Sachs,
Cornelius, McArthur and Schwab, The Global Competitiveness Report 2001-2002, New York, Oxford University Press, 2002.
9
maximize the effectiveness of education, training, and R&D initiatives if they embed them in a broader policy of competitiveness, linkages, cluster formation, and entrepreneurship.
• Dilemma #6: Scientists vs. Entrepreneurs. It is generally accepted that
entrepreneurs cannot use their entrepreneurial skills to become good scientists. But the converse is also true. Most good scientists cannot use their scientific skills to become good entrepreneurs. Unfortunately, this truism is often overlooked when policy makers attempt to promote technology commercialization. Policy makers establish incubators and technoparks to nurture new businesses started and operated by scientist-entrepreneurs. These commercialization institutions frequently fail to live up to their founders’ expectations, in part because they tacitly assume that top notch scientists can handle the marketing, sales, financial, legal and overall managerial tasks performed by a top notch entrepreneurs. This is rarely the case. Therefore, if policy makers want to promote technology commercialization, they will need to establish linkages between top notch scientists on the one hand and top notch entrepreneurs on the other hand.
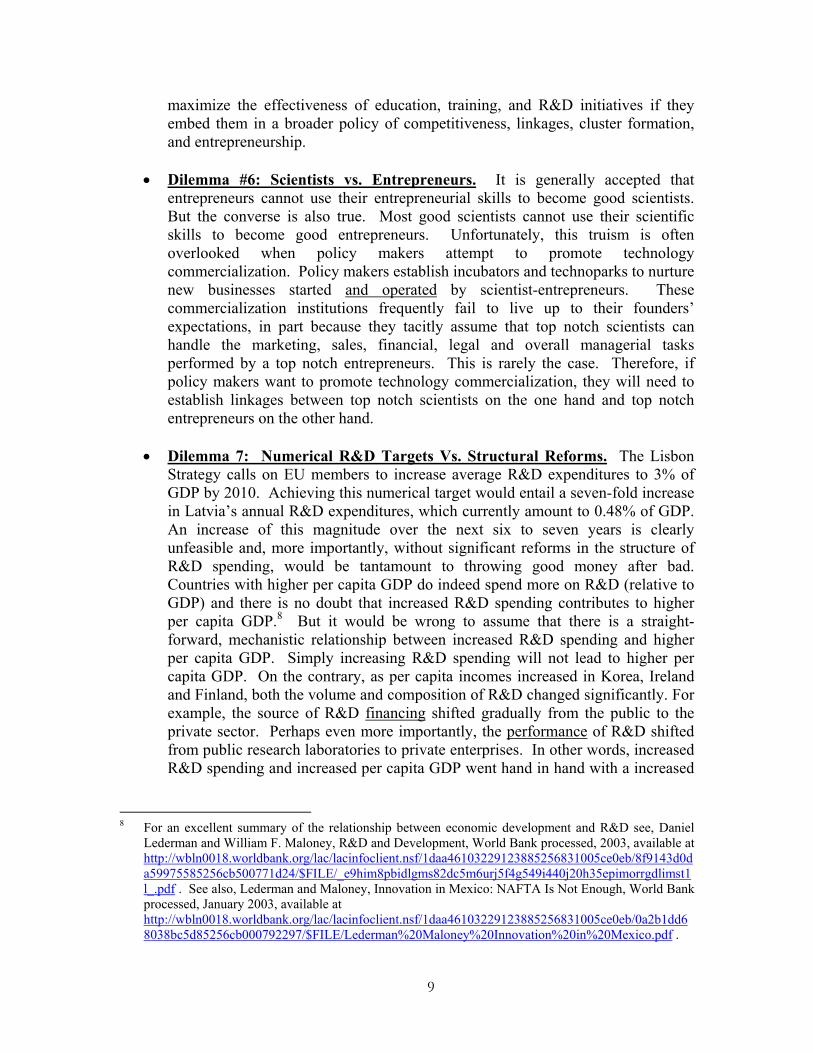
• Dilemma 7: Numerical R&D Targets Vs. Structural Reforms. The Lisbon
Strategy calls on EU members to increase average R&D expenditures to 3% of GDP by 2010. Achieving this numerical target would entail a seven-fold increase in Latvia’s annual R&D expenditures, which currently amount to 0.48% of GDP. An increase of this magnitude over the next six to seven years is clearly unfeasible and, more importantly, without significant reforms in the structure of R&D spending, would be tantamount to throwing good money after bad. Countries with higher per capita GDP do indeed spend more on R&D (relative to GDP) and there is no doubt that increased R&D spending contributes to higher per capita GDP.8 But it would be wrong to assume that there is a straight-forward, mechanistic relationship between increased R&D spending and higher per capita GDP. Simply increasing R&D spending will not lead to higher per capita GDP. On the contrary, as per capita incomes increased in Korea, Ireland and Finland, both the volume and composition of R&D changed significantly. For example, the source of R&D financing shifted gradually from the public to the private sector. Perhaps even more importantly, the performance of R&D shifted from public research laboratories to private enterprises. In other words, increased R&D spending and increased per capita GDP went hand in hand with a increased
8 For an excellent summary of the relationship between economic development and R&D see, Daniel
Lederman and William F. Maloney, R&D and Development, World Bank processed, 2003, available at http://wbln0018.worldbank.org/lac/lacinfoclient.nsf/1daa46103229123885256831005ce0eb/8f9143d0da59975585256cb500771d24/$FILE/_e9him8pbidlgms82dc5m6urj5f4g549i440j20h35epimorrgdlimst1l_.pdf . See also, Lederman and Maloney, Innovation in Mexico: NAFTA Is Not Enough, World Bank processed, January 2003, available at http://wbln0018.worldbank.org/lac/lacinfoclient.nsf/1daa46103229123885256831005ce0eb/0a2b1dd68038bc5d85256cb000792297/$FILE/Lederman%20Maloney%20Innovation%20in%20Mexico.pdf .
10
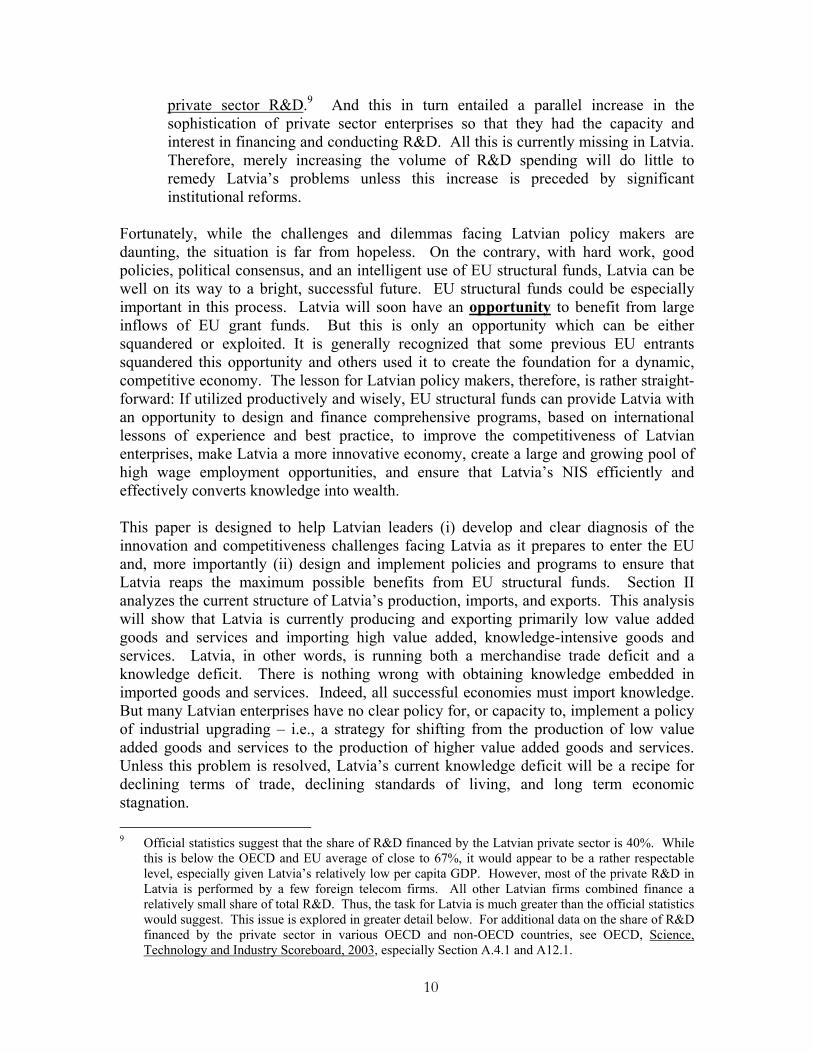
private sector R&D.9 And this in turn entailed a parallel increase in the sophistication of private sector enterprises so that they had the capacity and interest in financing and conducting R&D. All this is currently missing in Latvia. Therefore, merely increasing the volume of R&D spending will do little to remedy Latvia’s problems unless this increase is preceded by significant institutional reforms.
Fortunately, while the challenges and dilemmas facing Latvian policy makers are daunting, the situation is far from hopeless. On the contrary, with hard work, good policies, political consensus, and an intelligent use of EU structural funds, Latvia can be well on its way to a bright, successful future. EU structural funds could be especially important in this process. Latvia will soon have an opportunity to benefit from large inflows of EU grant funds. But this is only an opportunity which can be either squandered or exploited. It is generally recognized that some previous EU entrants squandered this opportunity and others used it to create the foundation for a dynamic, competitive economy. The lesson for Latvian policy makers, therefore, is rather straight-forward: If utilized productively and wisely, EU structural funds can provide Latvia with an opportunity to design and finance comprehensive programs, based on international lessons of experience and best practice, to improve the competitiveness of Latvian enterprises, make Latvia a more innovative economy, create a large and growing pool of high wage employment opportunities, and ensure that Latvia’s NIS efficiently and effectively converts knowledge into wealth. This paper is designed to help Latvian leaders (i) develop and clear diagnosis of the innovation and competitiveness challenges facing Latvia as it prepares to enter the EU and, more importantly (ii) design and implement policies and programs to ensure that Latvia reaps the maximum possible benefits from EU structural funds. Section II analyzes the current structure of Latvia’s production, imports, and exports. This analysis will show that Latvia is currently producing and exporting primarily low value added goods and services and importing high value added, knowledge-intensive goods and services. Latvia, in other words, is running both a merchandise trade deficit and a knowledge deficit. There is nothing wrong with obtaining knowledge embedded in imported goods and services. Indeed, all successful economies must import knowledge. But many Latvian enterprises have no clear policy for, or capacity to, implement a policy of industrial upgrading – i.e., a strategy for shifting from the production of low value added goods and services to the production of higher value added goods and services. Unless this problem is resolved, Latvia’s current knowledge deficit will be a recipe for declining terms of trade, declining standards of living, and long term economic stagnation. 9 Official statistics suggest that the share of R&D financed by the Latvian private sector is 40%. While
this is below the OECD and EU average of close to 67%, it would appear to be a rather respectable level, especially given Latvia’s relatively low per capita GDP. However, most of the private R&D in Latvia is performed by a few foreign telecom firms. All other Latvian firms combined finance a relatively small share of total R&D. Thus, the task for Latvia is much greater than the official statistics would suggest. This issue is explored in greater detail below. For additional data on the share of R&D financed by the private sector in various OECD and non-OECD countries, see OECD, Science, Technology and Industry Scoreboard, 2003, especially Section A.4.1 and A12.1.
11
Section III utilizes data from a number of competitiveness reports to benchmark Latvia’s current progress against a number of comparator countries and to pinpoint Latvia’s strengths and weaknesses as an innovative economy. The analysis will suggest that Latvia is currently behind many EU New Member States (NMS’s) on many critical measures of innovative capacity. If Latvia is going to compete and prosper within the EU as well as in the broader global economy, remedying these weaknesses in the NIS must become an urgent priority. Finally, Section IV offers a detailed list of policies and programs to improve the competitiveness of Latvian enterprises and the efficiency of the Latvian NIS. In particular, this section will highlight programs to improve (i) the production of knowledge generated by the Latvian R&D system; (ii) the commercialization of the knowledge produced by the Latvian R&D system; and (iii) the absorption and diffusion of knowledge produced outside Latvia and the ability of Latvian enterprises to integrate this knowledge into their production processes. The recommendations in this section are consistent with the broad policies and objectives which successive Latvian governments approved and endorsed in such documents as the National Concept on R&D (1998), the National Concept on Innovation (2001), the National Innovation Program (2003) and Priority 2 (Promotion of Enterprise and Innovation) of the Draft Programme Complement of the Single Programming Document for Latvia 2004-2006 (2003). Our primary contribution, therefore, is to help policy makers convert their broad policy objectives into concrete, specific programs that can produce tangible economic results in five years.
12
II. Latvia’s Industrial Structure During the Soviet period, Latvia was one of the USSR’s major high tech production centers – along with Russia, Ukraine, and Kazakhstan. But despite its abundance of human capital and legacy of science-intensive production, Latvia’s principal attraction today for foreign investors and its principal comparative advantage is its supply of low wage labor performing relatively unskilled tasks while working in comparatively low productivity, low technology enterprises. For example: A. Productivity
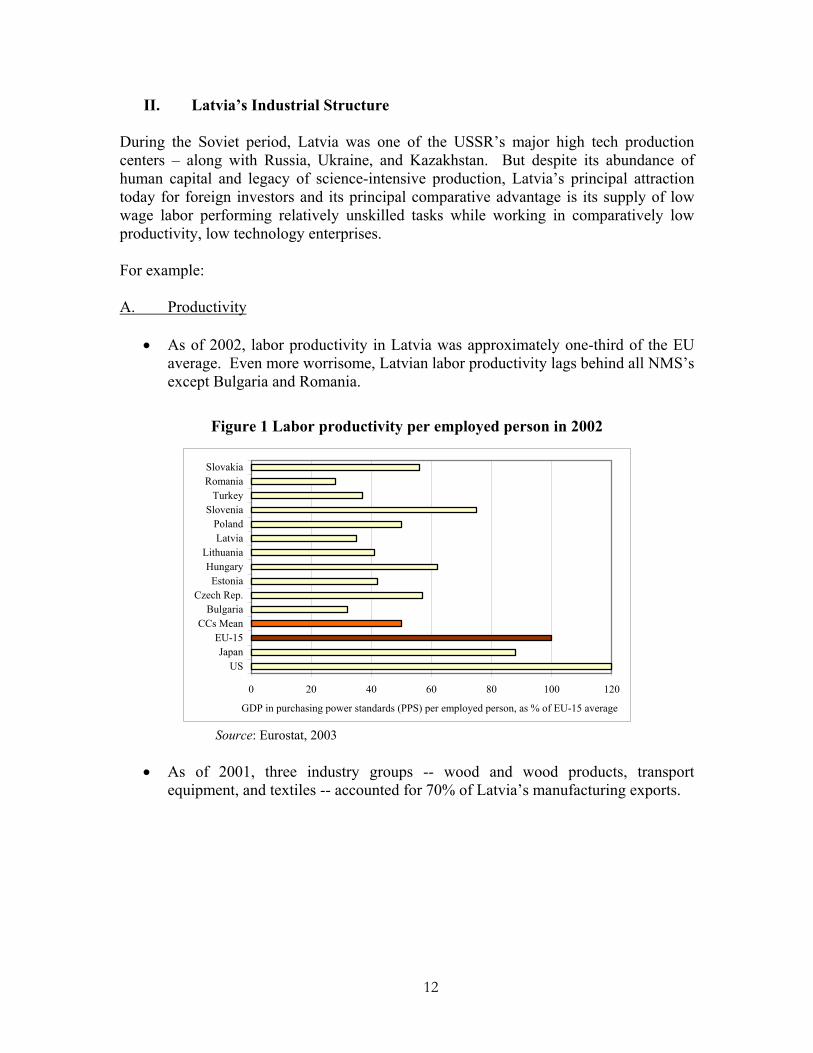
• As of 2002, labor productivity in Latvia was approximately one-third of the EU average. Even more worrisome, Latvian labor productivity lags behind all NMS’s except Bulgaria and Romania.
Figure 1 Labor productivity per employed person in 2002
0 20 40 60 80 100 120
USJapan
EU-15CCs Mean
BulgariaCzech Rep.
EstoniaHungary
LithuaniaLatviaPoland
SloveniaTurkey
RomaniaSlovakia
GDP in purchasing power standards (PPS) per employed person, as % of EU-15 average
Source: Eurostat, 2003
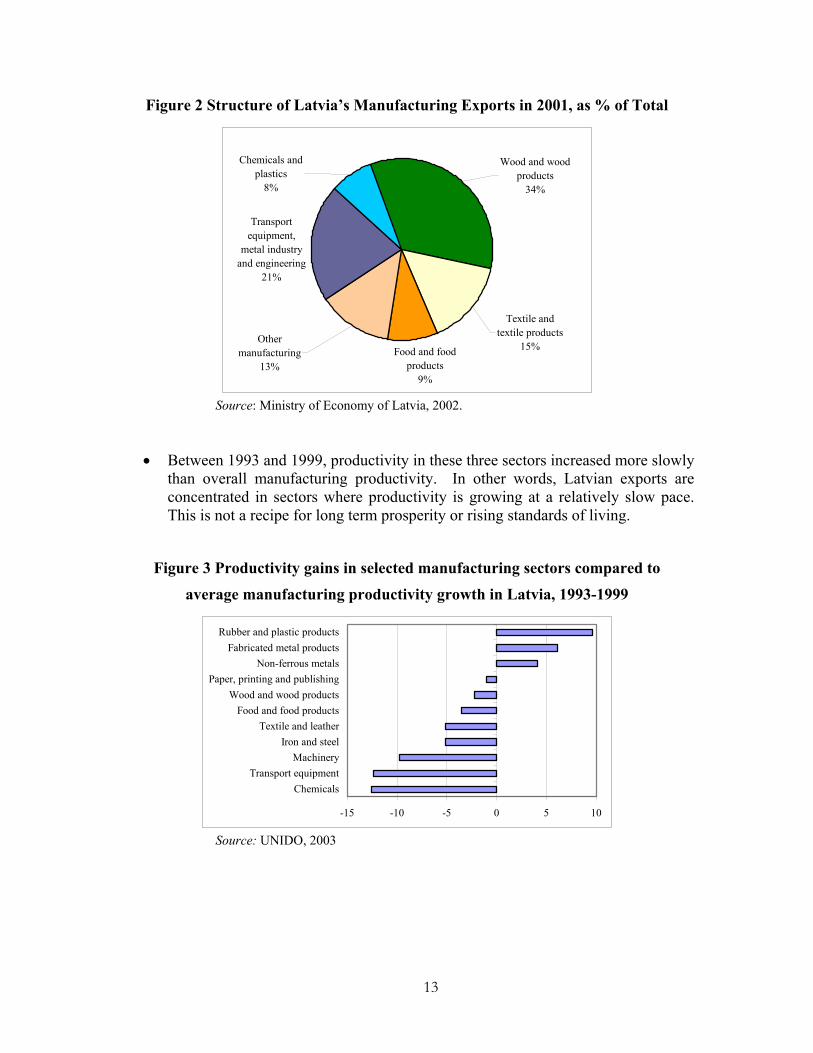
• As of 2001, three industry groups -- wood and wood products, transport equipment, and textiles -- accounted for 70% of Latvia’s manufacturing exports.
13
Figure 2 Structure of Latvia’s Manufacturing Exports in 2001, as % of Total
Food and food products
9%
Transport equipment,
metal industry and engineering
21%
Chemicals and plastics
8%
Textile and textile products
15%Other
manufacturing13%
Wood and wood products
34%
Source: Ministry of Economy of Latvia, 2002.
• Between 1993 and 1999, productivity in these three sectors increased more slowly than overall manufacturing productivity. In other words, Latvian exports are concentrated in sectors where productivity is growing at a relatively slow pace. This is not a recipe for long term prosperity or rising standards of living.
Figure 3 Productivity gains in selected manufacturing sectors compared to
average manufacturing productivity growth in Latvia, 1993-1999
-15 -10 -5 0 5 10
ChemicalsTransport equipment
MachineryIron and steel
Textile and leatherFood and food products
Wood and wood productsPaper, printing and publishing
Non-ferrous metalsFabricated metal products
Rubber and plastic products
Source: UNIDO, 2003
14
B. Technology Vs. Labor Intensive Industries
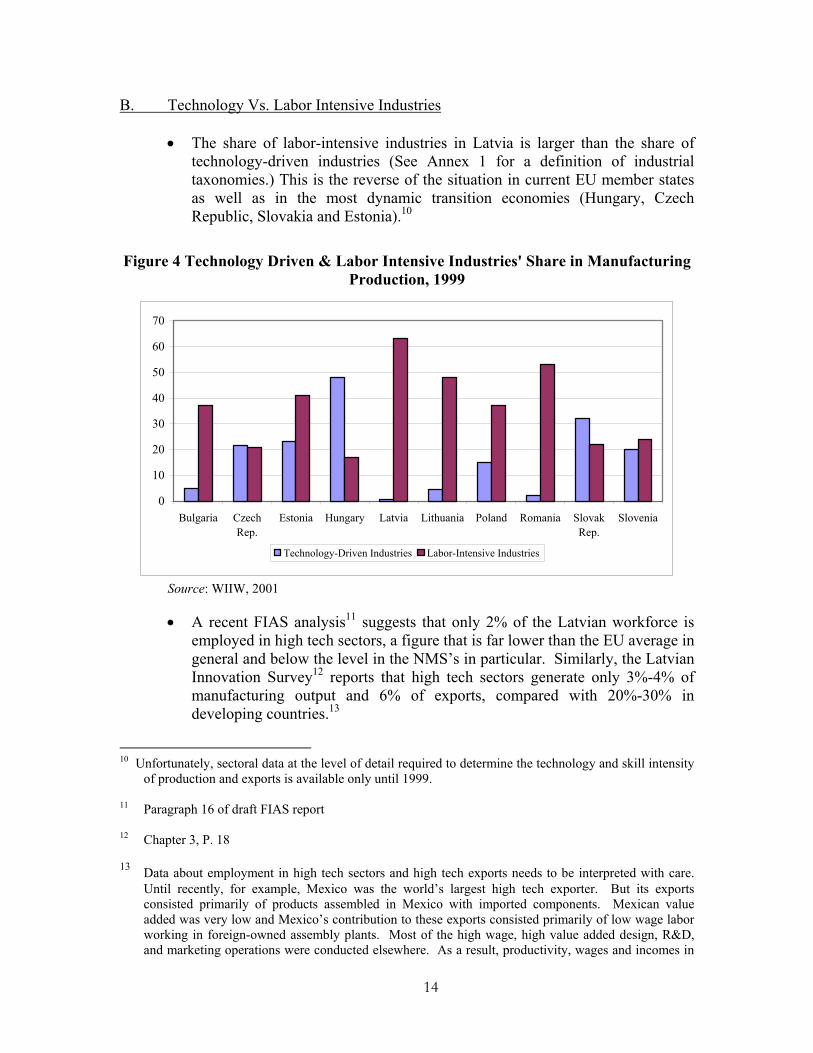
• The share of labor-intensive industries in Latvia is larger than the share of technology-driven industries (See Annex 1 for a definition of industrial taxonomies.) This is the reverse of the situation in current EU member states as well as in the most dynamic transition economies (Hungary, Czech Republic, Slovakia and Estonia).10
Figure 4 Technology Driven & Labor Intensive Industries' Share in Manufacturing Production, 1999
0
10
20
30
40
50
60
70
Bulgaria CzechRep.
Estonia Hungary Latvia Lithuania Poland Romania SlovakRep.
Slovenia
Technology-Driven Industries Labor-Intensive Industries
Source: WIIW, 2001
• A recent FIAS analysis11 suggests that only 2% of the Latvian workforce is employed in high tech sectors, a figure that is far lower than the EU average in general and below the level in the NMS’s in particular. Similarly, the Latvian Innovation Survey12 reports that high tech sectors generate only 3%-4% of manufacturing output and 6% of exports, compared with 20%-30% in developing countries.13
10 Unfortunately, sectoral data at the level of detail required to determine the technology and skill intensity
of production and exports is available only until 1999. 11 Paragraph 16 of draft FIAS report 12 Chapter 3, P. 18 13 Data about employment in high tech sectors and high tech exports needs to be interpreted with care.
Until recently, for example, Mexico was the world’s largest high tech exporter. But its exports consisted primarily of products assembled in Mexico with imported components. Mexican value added was very low and Mexico’s contribution to these exports consisted primarily of low wage labor working in foreign-owned assembly plants. Most of the high wage, high value added design, R&D, and marketing operations were conducted elsewhere. As a result, productivity, wages and incomes in
15
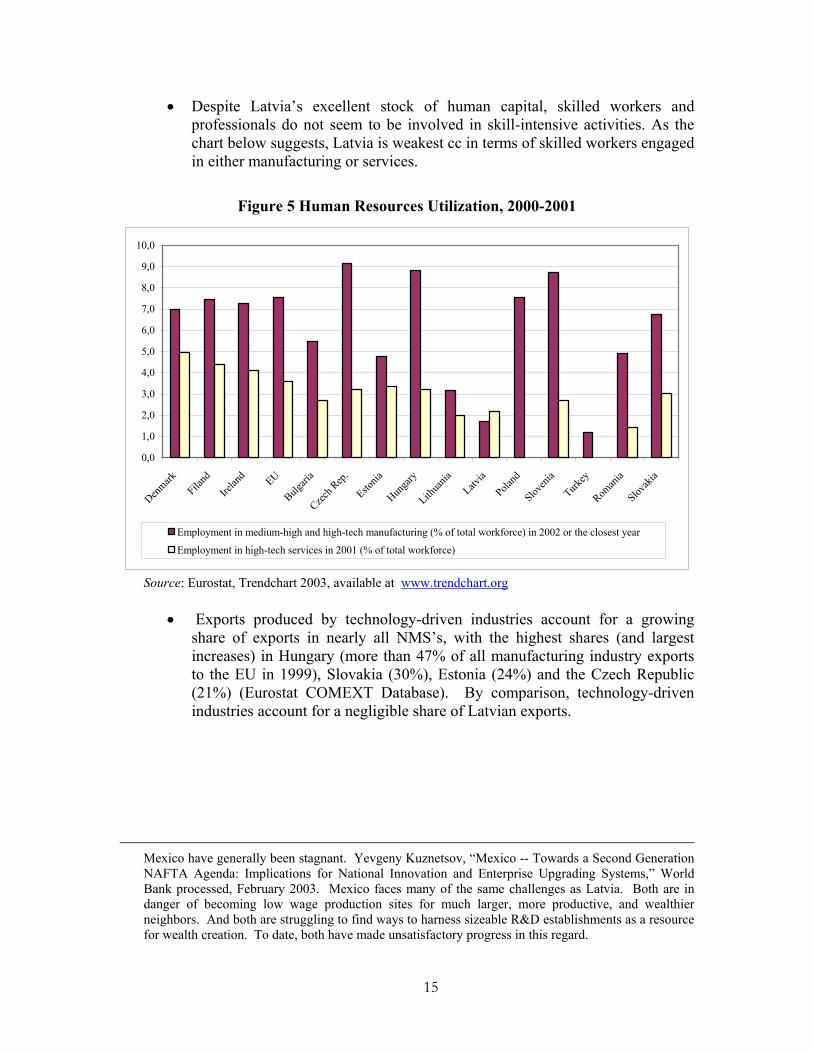
• Despite Latvia’s excellent stock of human capital, skilled workers and professionals do not seem to be involved in skill-intensive activities. As the chart below suggests, Latvia is weakest cc in terms of skilled workers engaged in either manufacturing or services.
Figure 5 Human Resources Utilization, 2000-2001
0,0
1,0
2,0
3,0
4,0
5,0
6,0
7,0
8,0
9,0
10,0
Denmark
Filand
Irelan
d EU
Bulgari
a
Czech R
ep.
Estonia
Hunga
ry
Lithua
niaLatv
ia
Poland
Sloven
ia
Turkey
Roman
ia
Slovak
ia
Employment in medium-high and high-tech manufacturing (% of total workforce) in 2002 or the closest year
Employment in high-tech services in 2001 (% of total workforce)
Source: Eurostat, Trendchart 2003, available at www.trendchart.org
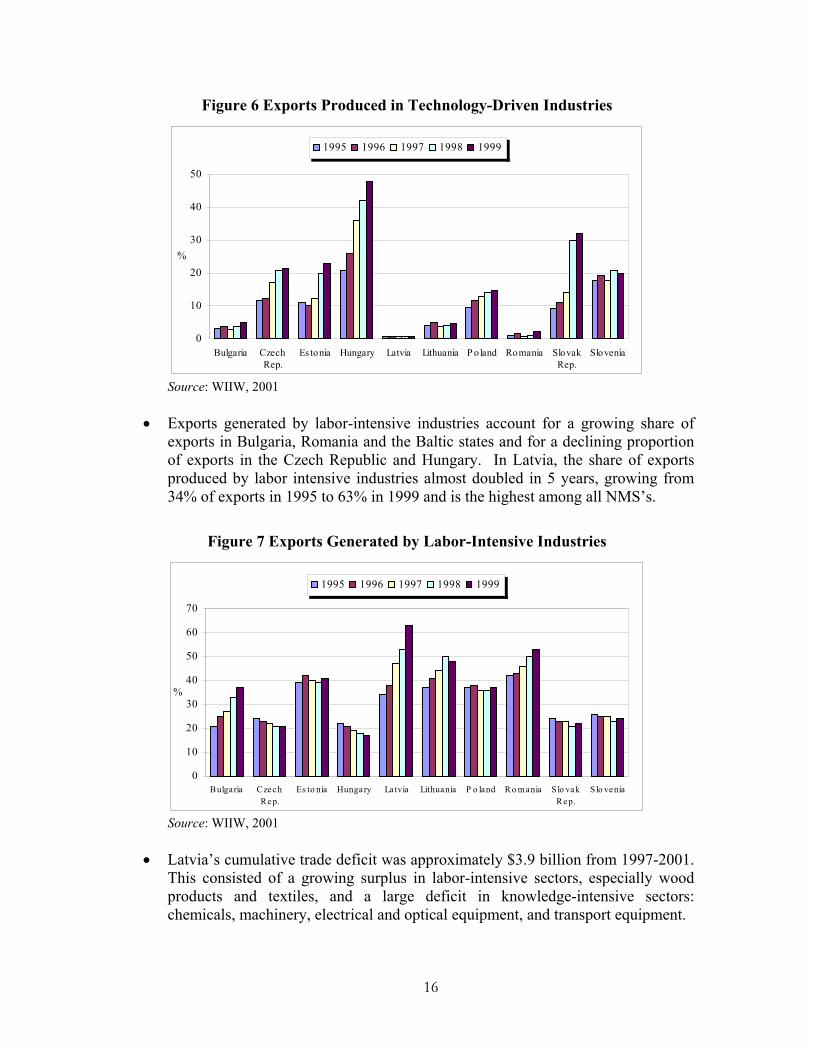
• Exports produced by technology-driven industries account for a growing share of exports in nearly all NMS’s, with the highest shares (and largest increases) in Hungary (more than 47% of all manufacturing industry exports to the EU in 1999), Slovakia (30%), Estonia (24%) and the Czech Republic (21%) (Eurostat COMEXT Database). By comparison, technology-driven industries account for a negligible share of Latvian exports.
Mexico have generally been stagnant. Yevgeny Kuznetsov, “Mexico -- Towards a Second Generation NAFTA Agenda: Implications for National Innovation and Enterprise Upgrading Systems,” World Bank processed, February 2003. Mexico faces many of the same challenges as Latvia. Both are in danger of becoming low wage production sites for much larger, more productive, and wealthier neighbors. And both are struggling to find ways to harness sizeable R&D establishments as a resource for wealth creation. To date, both have made unsatisfactory progress in this regard.
16
Figure 6 Exports Produced in Technology-Driven Industries
0
10
20
30
40
50
Bulgaria CzechRep.
Es tonia Hungary Latvia Lithuania P oland Romania SlovakRep.
Slovenia
%
1995 1996 1997 1998 1999
Source: WIIW, 2001
• Exports generated by labor-intensive industries account for a growing share of
exports in Bulgaria, Romania and the Baltic states and for a declining proportion of exports in the Czech Republic and Hungary. In Latvia, the share of exports produced by labor intensive industries almost doubled in 5 years, growing from 34% of exports in 1995 to 63% in 1999 and is the highest among all NMS’s.
Figure 7 Exports Generated by Labor-Intensive Industries
0
10
20
30
40
50
60
70
Bulgaria CzechRep.
Es to nia Hungary La tvia Lithuania P o land Ro mania Slo vakRep.
S lo venia
%
1995 1996 1997 1998 1999
Source: WIIW, 2001
• Latvia’s cumulative trade deficit was approximately $3.9 billion from 1997-2001.
This consisted of a growing surplus in labor-intensive sectors, especially wood products and textiles, and a large deficit in knowledge-intensive sectors: chemicals, machinery, electrical and optical equipment, and transport equipment.
17
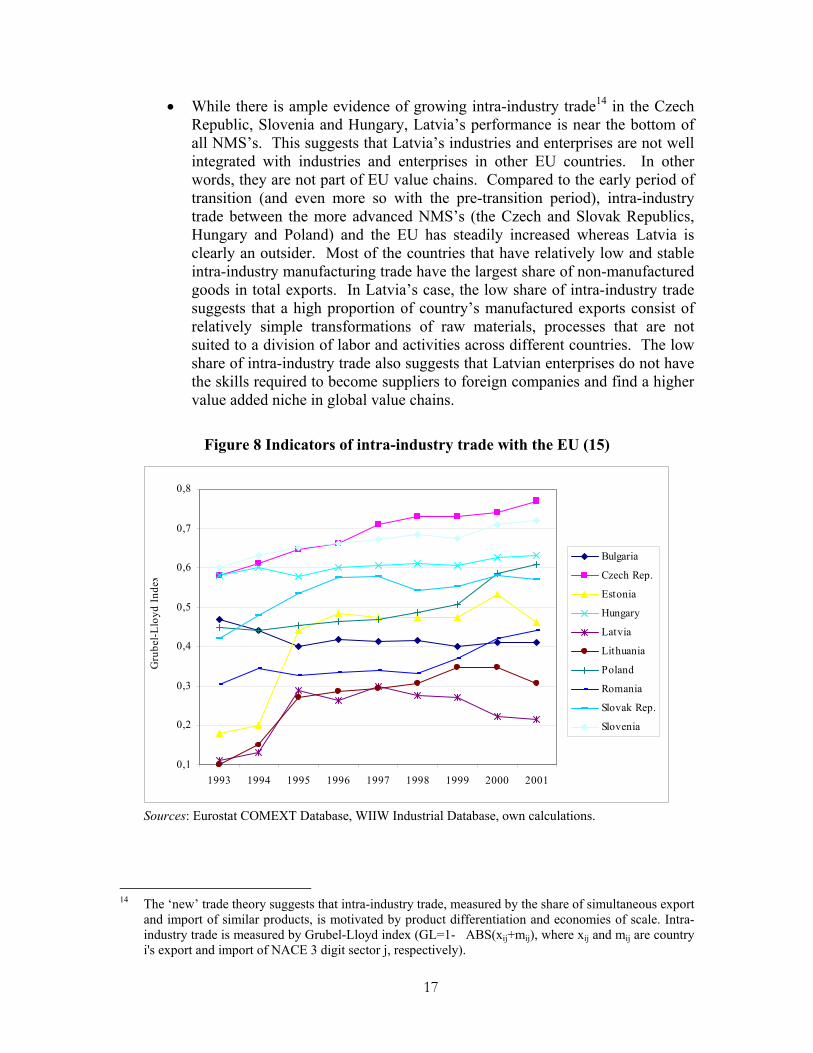
• While there is ample evidence of growing intra-industry trade14 in the Czech Republic, Slovenia and Hungary, Latvia’s performance is near the bottom of all NMS’s. This suggests that Latvia’s industries and enterprises are not well integrated with industries and enterprises in other EU countries. In other words, they are not part of EU value chains. Compared to the early period of transition (and even more so with the pre-transition period), intra-industry trade between the more advanced NMS’s (the Czech and Slovak Republics, Hungary and Poland) and the EU has steadily increased whereas Latvia is clearly an outsider. Most of the countries that have relatively low and stable intra-industry manufacturing trade have the largest share of non-manufactured goods in total exports. In Latvia’s case, the low share of intra-industry trade suggests that a high proportion of country’s manufactured exports consist of relatively simple transformations of raw materials, processes that are not suited to a division of labor and activities across different countries. The low share of intra-industry trade also suggests that Latvian enterprises do not have the skills required to become suppliers to foreign companies and find a higher value added niche in global value chains.
Figure 8 Indicators of intra-industry trade with the EU (15)
0,1
0,2
0,3
0,4
0,5
0,6
0,7
0,8
1993 1994 1995 1996 1997 1998 1999 2000 2001
Gru
bel-L
loyd
Inde
x
Bulgaria
Czech Rep.
Estonia
Hungary
Latvia
Lithuania
Poland
Romania
Slovak Rep.
Slovenia
Sources: Eurostat COMEXT Database, WIIW Industrial Database, own calculations.
14 The ‘new’ trade theory suggests that intra-industry trade, measured by the share of simultaneous export
and import of similar products, is motivated by product differentiation and economies of scale. Intra-industry trade is measured by Grubel-Lloyd index (GL=1-�ABS(xij+mij), where xij and mij are country i's export and import of NACE 3 digit sector j, respectively).
18
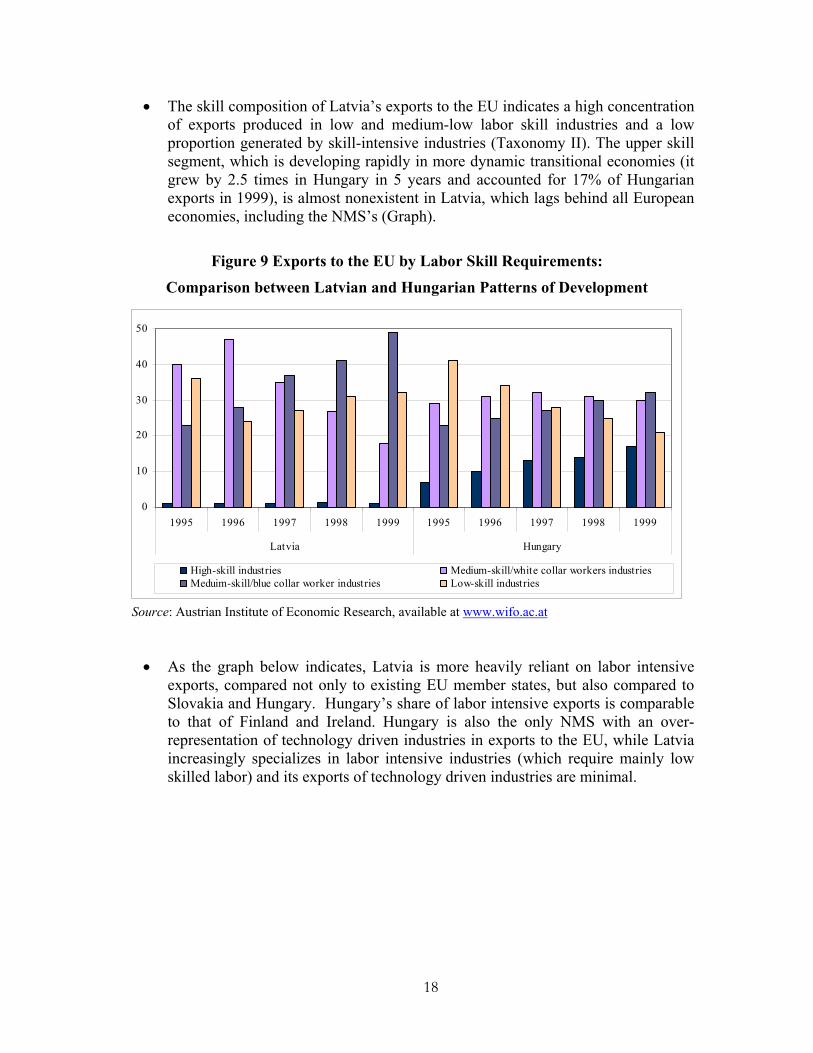
• The skill composition of Latvia’s exports to the EU indicates a high concentration of exports produced in low and medium-low labor skill industries and a low proportion generated by skill-intensive industries (Taxonomy II). The upper skill segment, which is developing rapidly in more dynamic transitional economies (it grew by 2.5 times in Hungary in 5 years and accounted for 17% of Hungarian exports in 1999), is almost nonexistent in Latvia, which lags behind all European economies, including the NMS’s (Graph).
Figure 9 Exports to the EU by Labor Skill Requirements:
Comparison between Latvian and Hungarian Patterns of Development
0
10
20
30
40
50
1995 1996 1997 1998 1999 1995 1996 1997 1998 1999
Latvia Hungary
High-skill industries Medium-skill/white collar workers industriesMeduim-skill/blue collar worker industries Low-skill industries
Source: Austrian Institute of Economic Research, available at www.wifo.ac.at
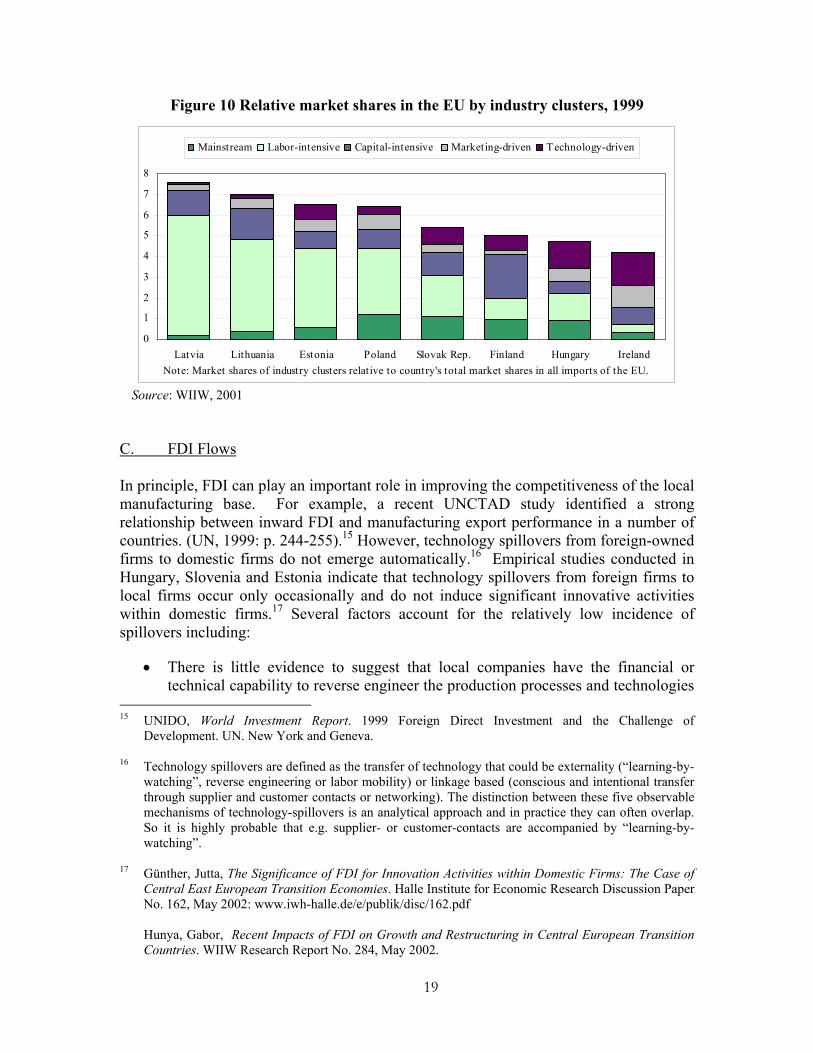
• As the graph below indicates, Latvia is more heavily reliant on labor intensive exports, compared not only to existing EU member states, but also compared to Slovakia and Hungary. Hungary’s share of labor intensive exports is comparable to that of Finland and Ireland. Hungary is also the only NMS with an over-representation of technology driven industries in exports to the EU, while Latvia increasingly specializes in labor intensive industries (which require mainly low skilled labor) and its exports of technology driven industries are minimal.
19
Figure 10 Relative market shares in the EU by industry clusters, 1999
0
1
2
3
4
5
6
7
8
Latvia Lithuania Estonia Poland Slovak Rep. Finland Hungary IrelandNote: Market shares of industry clusters relative to country's total market shares in all imports of the EU.
Mainstream Labor-intensive Capital-intensive Marketing-driven Technology-driven
Source: WIIW, 2001
C. FDI Flows In principle, FDI can play an important role in improving the competitiveness of the local manufacturing base. For example, a recent UNCTAD study identified a strong relationship between inward FDI and manufacturing export performance in a number of countries. (UN, 1999: p. 244-255).15 However, technology spillovers from foreign-owned firms to domestic firms do not emerge automatically.16 Empirical studies conducted in Hungary, Slovenia and Estonia indicate that technology spillovers from foreign firms to local firms occur only occasionally and do not induce significant innovative activities within domestic firms.17 Several factors account for the relatively low incidence of spillovers including:
• There is little evidence to suggest that local companies have the financial or technical capability to reverse engineer the production processes and technologies
15 UNIDO, World Investment Report. 1999 Foreign Direct Investment and the Challenge of
Development. UN. New York and Geneva. 16 Technology spillovers are defined as the transfer of technology that could be externality (“learning-by-
watching”, reverse engineering or labor mobility) or linkage based (conscious and intentional transfer through supplier and customer contacts or networking). The distinction between these five observable mechanisms of technology-spillovers is an analytical approach and in practice they can often overlap. So it is highly probable that e.g. supplier- or customer-contacts are accompanied by “learning-by-watching”.
17 Günther, Jutta, The Significance of FDI for Innovation Activities within Domestic Firms: The Case of
Central East European Transition Economies. Halle Institute for Economic Research Discussion Paper No. 162, May 2002: www.iwh-halle.de/e/publik/disc/162.pdf
Hunya, Gabor, Recent Impacts of FDI on Growth and Restructuring in Central European Transition Countries. WIIW Research Report No. 284, May 2002.
20
introduced by foreign-owned firms. In other words, local firms do not have the capacity to learn from foreign companies operating in their midst.
• Local companies cannot pay sufficient wages to attract workers from foreign-owned companies. Consequently, this potential spillover channel is negligible.
• Studies in Hungary (Ministry of Economic Affairs and Economic Research Institute of the Hungarian Chamber of Commerce and Industry in 2000), Slovenia and Estonia suggest that foreign-owned companies typically continue to rely on foreign suppliers. They rarely develop local supplier networks or devote the time and resources needed to improve the technical competence of local suppliers. Thus, while FDI may lead to an increase in the technological sophistication of exports, without specific joint government/industry programs to foster local supplier networks, FDI does not automatically bring local supplier skills and competencies up to international norms.
• Inward FDI does not necessarily help local firms establish linkages with foreign customers. Foreign-owned firms produce mainly for export or for other foreign investment enterprises within the transitional countries.
• Joint R&D projects between foreign-owned firms and domestic companies rarely spring up spontaneously. In the first place, local firms frequently do not have the local technical skills needed to participate in these projects. And in addition, foreign-owned firms acquire most of their required R&D in the context of their parent company’s global R&D strategy. Foreign-owned firms have little scope for independent local R&D efforts.
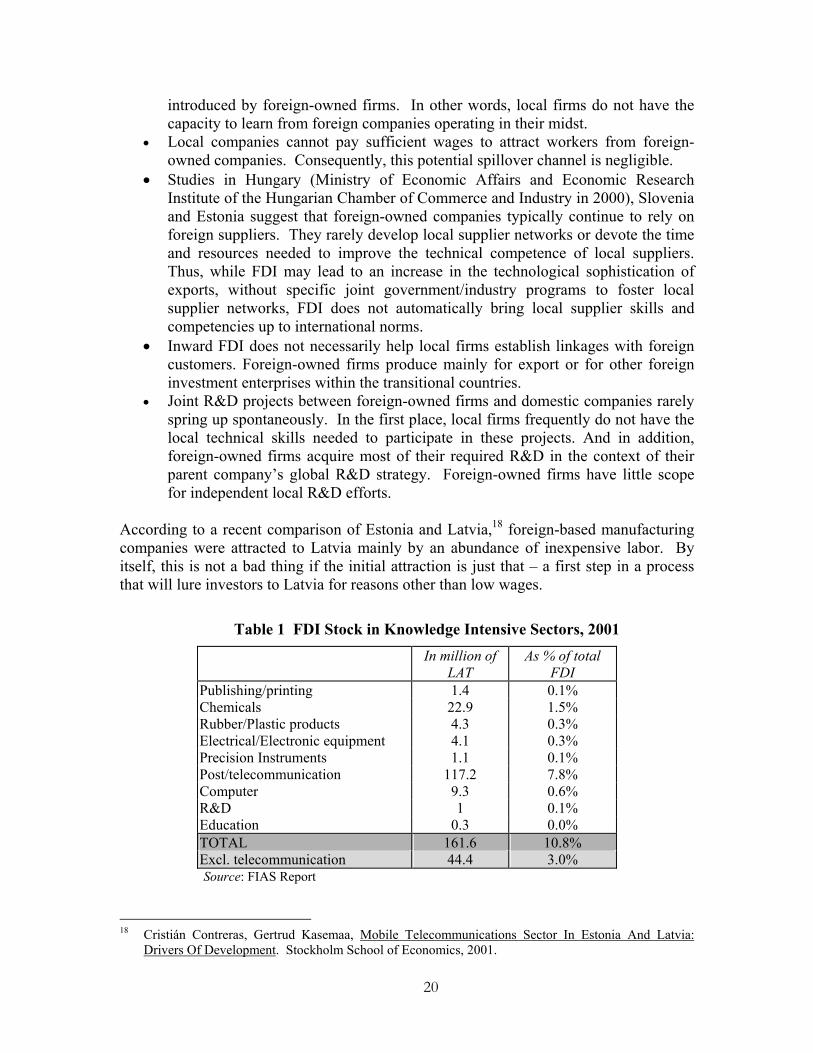
According to a recent comparison of Estonia and Latvia,18 foreign-based manufacturing companies were attracted to Latvia mainly by an abundance of inexpensive labor. By itself, this is not a bad thing if the initial attraction is just that – a first step in a process that will lure investors to Latvia for reasons other than low wages.
Table 1 FDI Stock in Knowledge Intensive Sectors, 2001 In million of
LAT As % of total
FDI Publishing/printing 1.4 0.1% Chemicals 22.9 1.5% Rubber/Plastic products 4.3 0.3% Electrical/Electronic equipment 4.1 0.3% Precision Instruments 1.1 0.1% Post/telecommunication 117.2 7.8% Computer 9.3 0.6% R&D 1 0.1% Education 0.3 0.0% TOTAL 161.6 10.8% Excl. telecommunication 44.4 3.0% Source: FIAS Report
18 Cristián Contreras, Gertrud Kasemaa, Mobile Telecommunications Sector In Estonia And Latvia:
Drivers Of Development. Stockholm School of Economics, 2001.
21
To date, however, there is no indication that Latvia has succeeded in moving beyond this first step. More than ¾ of total FDI was concentrated in low and medium-low technology industries. And according to a recent FIAS analysis, knowledge intensive sectors, excluding telecommunications, only attracted 3% of the total FDI flows. Even though the FDI grew steadily in recent years, as the table below indicates, there is reason to believe that it generated limited knowledge transfers to the Latvian business community in terms of know-how, technology, or access of Latvian firms to global markets.
Table 2 Foreign Investment Stock by Sector of Economy Sector 1997 1998 1999 2000 Total 1997-2000 millions of dollars % of total Transport, storage and communications
309.5 346.8 331.7 475.2 26.5%
Financial Intermediation 179.3 264.9 252.1 429 20.3% Manufacturing 235.3 199.1 228.6 401.5 19.2% Wholesale and retail trade, maintenance and repairs
74 185.2 217 349 14.9%
Real estate, leasing, R&D, and other commercial activities
18.4 50.4 98.5 203.3 6.7%
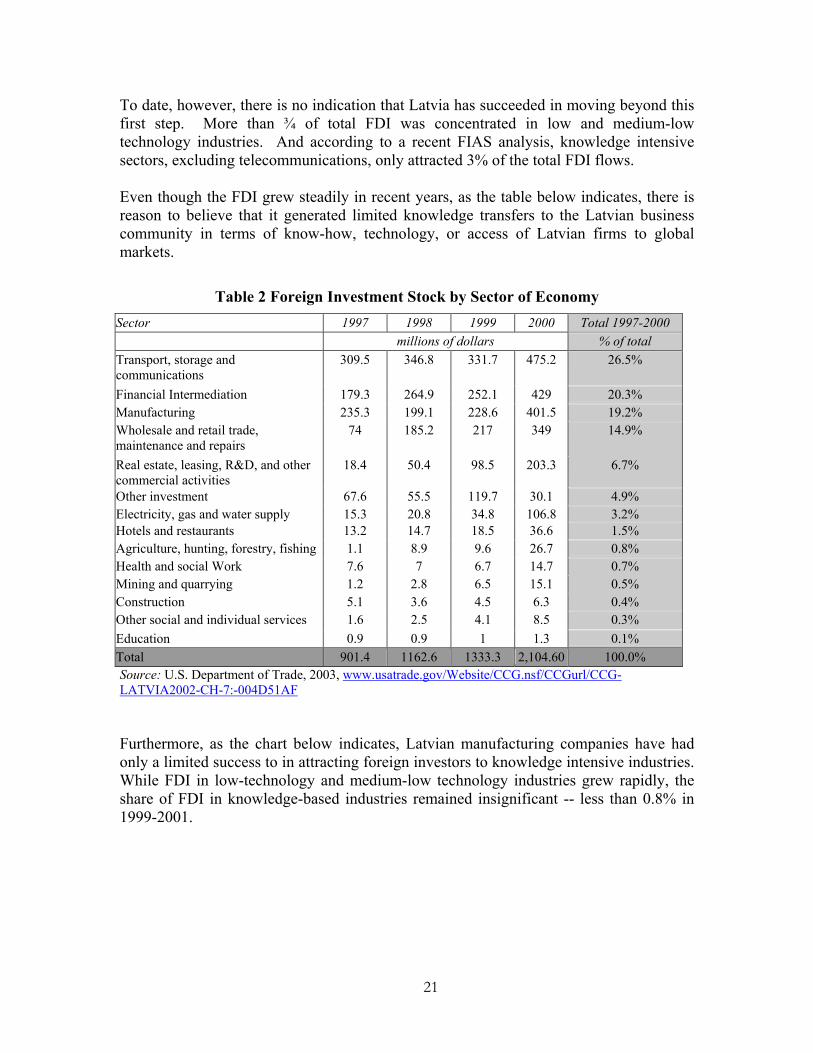
Other investment 67.6 55.5 119.7 30.1 4.9% Electricity, gas and water supply 15.3 20.8 34.8 106.8 3.2% Hotels and restaurants 13.2 14.7 18.5 36.6 1.5% Agriculture, hunting, forestry, fishing 1.1 8.9 9.6 26.7 0.8% Health and social Work 7.6 7 6.7 14.7 0.7% Mining and quarrying 1.2 2.8 6.5 15.1 0.5% Construction 5.1 3.6 4.5 6.3 0.4% Other social and individual services 1.6 2.5 4.1 8.5 0.3% Education 0.9 0.9 1 1.3 0.1% Total 901.4 1162.6 1333.3 2,104.60 100.0% Source: U.S. Department of Trade, 2003, www.usatrade.gov/Website/CCG.nsf/CCGurl/CCG-LATVIA2002-CH-7:-004D51AF Furthermore, as the chart below indicates, Latvian manufacturing companies have had only a limited success to in attracting foreign investors to knowledge intensive industries. While FDI in low-technology and medium-low technology industries grew rapidly, the share of FDI in knowledge-based industries remained insignificant -- less than 0.8% in 1999-2001.
22
Figure 11 FDI stock in manufacturing industry
0
20
40
60
80
100
120Fo
od,
beve
rage
s&to
bacc
o
Text
ile&
text
ilepr
oduc
ts
Woo
d&w
ood
prod
ucts
Pulp
, pap
er&
pape
rpr
oduc
ts
Rubb
er&
plas
ticpr
oduc
ts
Oth
er n
on–m
etal
licm
iner
al p
rodu
cts
Basic
met
als &
fabr
icat
ed m
etal
prod
ucts
Chem
ical
s, ch
emic
alpr
oduc
ts &
man
–mad
efib
re
Mac
hine
ry&
equi
pmen
t
Elec
trica
l& o
ptic
aleq
uipm
ent
Tran
spor
t equ
ipm
ent
Low-technology industries Medium-low technology industries Knowledge-based industries
US$
Mill
ion
1999 2000 2001
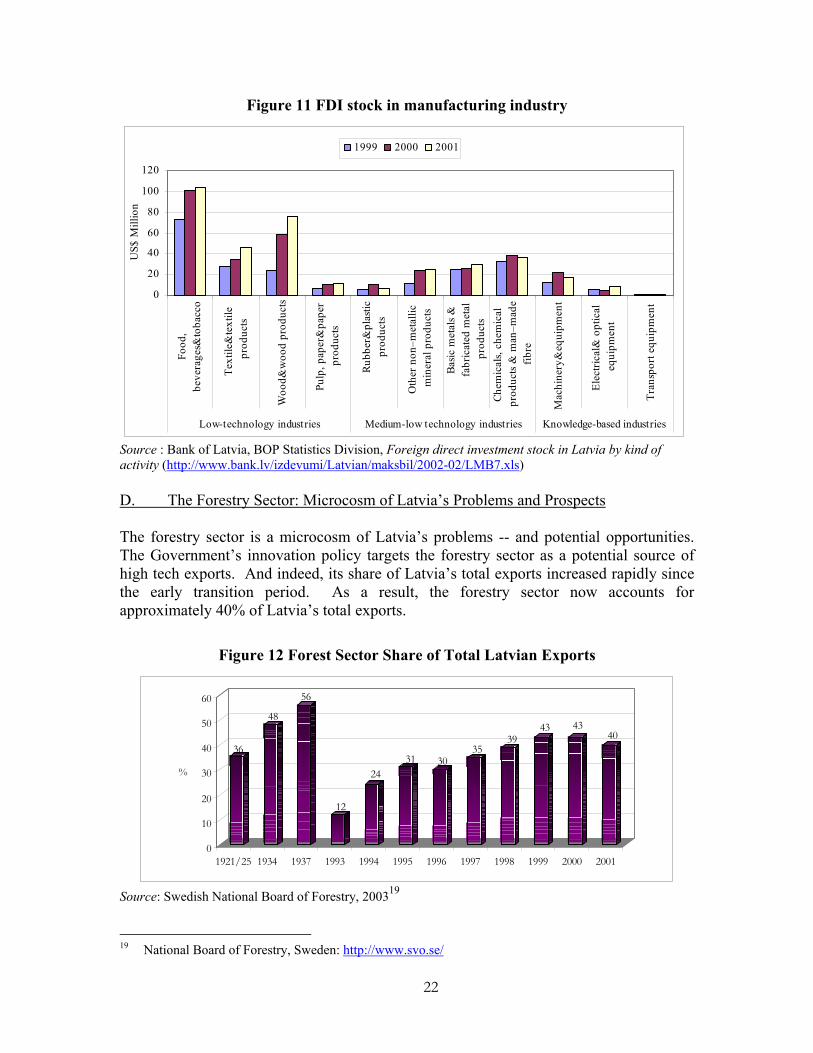
Source : Bank of Latvia, BOP Statistics Division, Foreign direct investment stock in Latvia by kind of activity (http://www.bank.lv/izdevumi/Latvian/maksbil/2002-02/LMB7.xls) D. The Forestry Sector: Microcosm of Latvia’s Problems and Prospects The forestry sector is a microcosm of Latvia’s problems -- and potential opportunities. The Government’s innovation policy targets the forestry sector as a potential source of high tech exports. And indeed, its share of Latvia’s total exports increased rapidly since the early transition period. As a result, the forestry sector now accounts for approximately 40% of Latvia’s total exports.
Figure 12 Forest Sector Share of Total Latvian Exports
36
48
56
12
2431 30
3539
43 4340
0
10
20
30
40
50
60
%
1921/25 1934 1937 1993 1994 1995 1996 1997 1998 1999 2000 2001
Source: Swedish National Board of Forestry, 200319
19 National Board of Forestry, Sweden: http://www.svo.se/
23
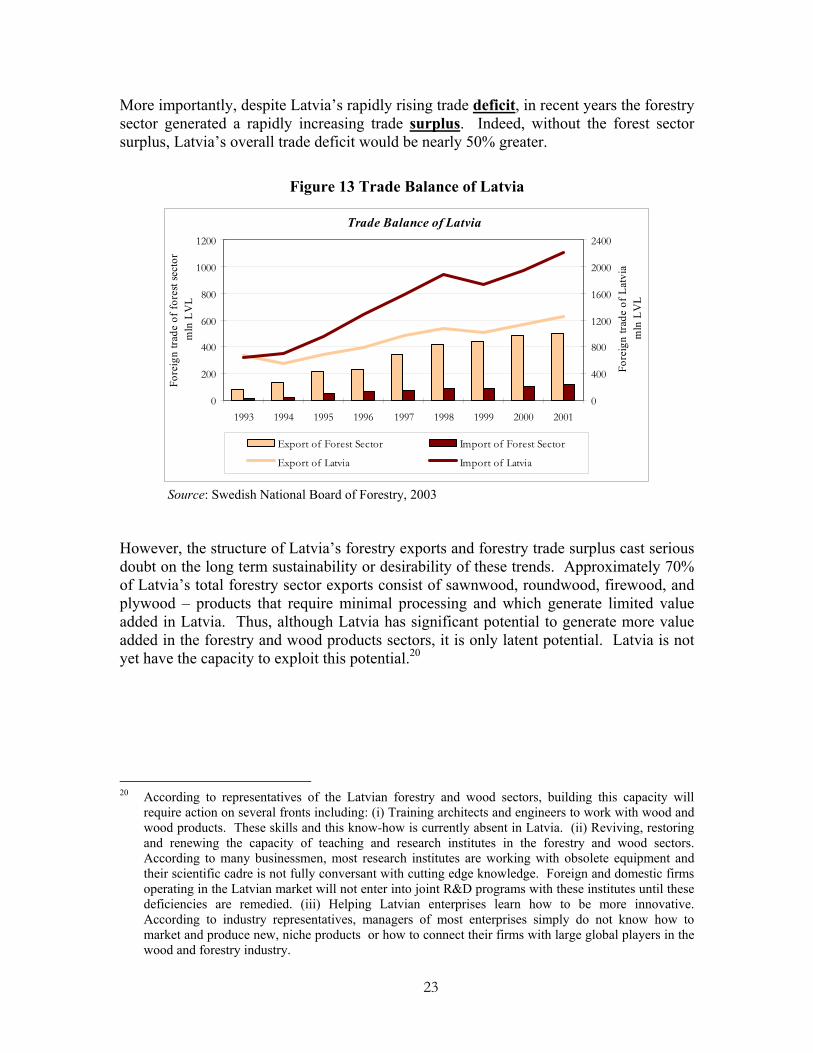
More importantly, despite Latvia’s rapidly rising trade deficit, in recent years the forestry sector generated a rapidly increasing trade surplus. Indeed, without the forest sector surplus, Latvia’s overall trade deficit would be nearly 50% greater.
Figure 13 Trade Balance of Latvia
Trade Balance of Latvia
0
200
400
600
800
1000
1200
1993 1994 1995 1996 1997 1998 1999 2000 2001
Fore
ign
trade
of f
ores
t sec
tor
mln
LV
L
0
400
800
1200
1600
2000
2400
Fore
ign
trade
of L
atvi
a m
ln L
VL
Export of Forest Sector Import of Forest Sector
Export of Latvia Import of Latvia
Source: Swedish National Board of Forestry, 2003
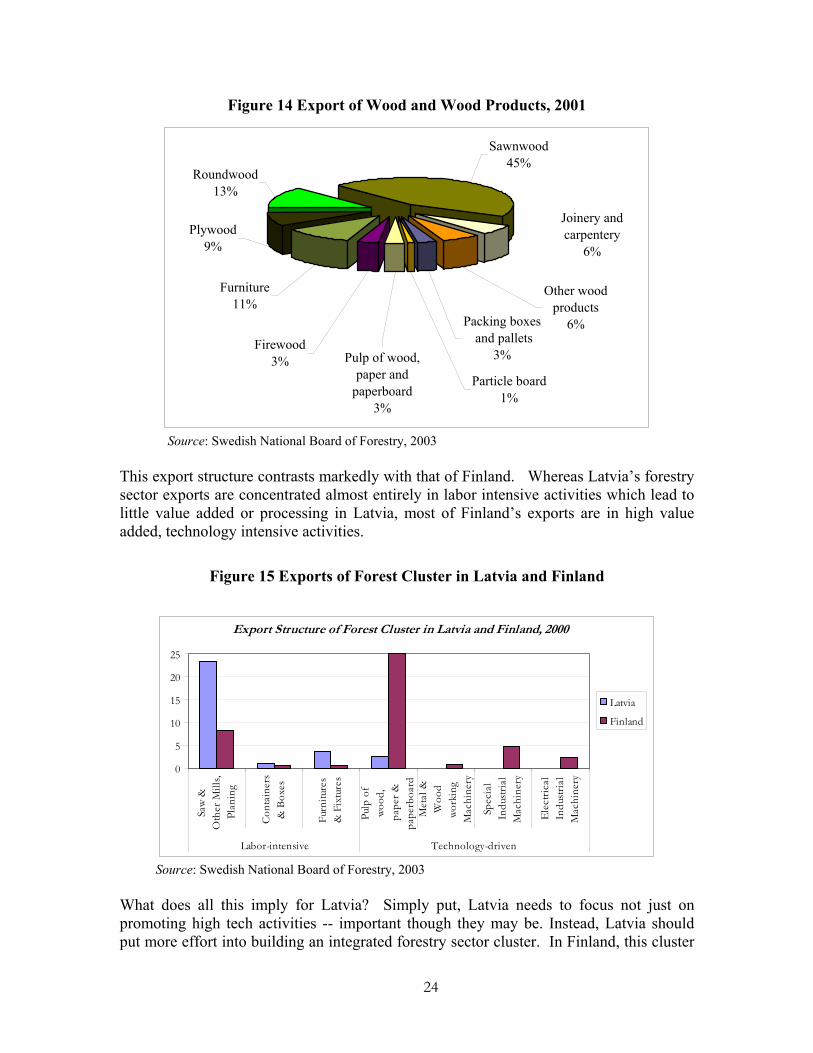
However, the structure of Latvia’s forestry exports and forestry trade surplus cast serious doubt on the long term sustainability or desirability of these trends. Approximately 70% of Latvia’s total forestry sector exports consist of sawnwood, roundwood, firewood, and plywood – products that require minimal processing and which generate limited value added in Latvia. Thus, although Latvia has significant potential to generate more value added in the forestry and wood products sectors, it is only latent potential. Latvia is not yet have the capacity to exploit this potential.20
20 According to representatives of the Latvian forestry and wood sectors, building this capacity will
require action on several fronts including: (i) Training architects and engineers to work with wood and wood products. These skills and this know-how is currently absent in Latvia. (ii) Reviving, restoring and renewing the capacity of teaching and research institutes in the forestry and wood sectors. According to many businessmen, most research institutes are working with obsolete equipment and their scientific cadre is not fully conversant with cutting edge knowledge. Foreign and domestic firms operating in the Latvian market will not enter into joint R&D programs with these institutes until these deficiencies are remedied. (iii) Helping Latvian enterprises learn how to be more innovative. According to industry representatives, managers of most enterprises simply do not know how to market and produce new, niche products or how to connect their firms with large global players in the wood and forestry industry.
24
Figure 14 Export of Wood and Wood Products, 2001
Joinery and carpentery
6%
Sawnwood45%
Roundwood 13%
Plywood 9%
Other wood products
6%
Particle board 1%
Packing boxes and pallets
3%Firewood
3%
Furniture 11%
Pulp of wood, paper and
paperboard3%
Source: Swedish National Board of Forestry, 2003
This export structure contrasts markedly with that of Finland. Whereas Latvia’s forestry sector exports are concentrated almost entirely in labor intensive activities which lead to little value added or processing in Latvia, most of Finland’s exports are in high value added, technology intensive activities.
Figure 15 Exports of Forest Cluster in Latvia and Finland
Export Structure of Forest Cluster in Latvia and Finland, 2000
0
5
10
15
20
25
Saw
&O
ther
Mill
s,Pl
anin
g
Cont
aine
rs&
Box
es
Furn
iture
s&
Fix
ture
s
Pulp
of
wood
,pa
per &
pape
rboa
rd
Met
al &
Woo
dwo
rkin
gM
achi
nery
Spec
ial
Indu
stria
lM
achi
nery
Elec
trica
lIn
dustr
ial
Mac
hine
ry
Labor-intensive Technology-driven
Latvia
Finland
Source: Swedish National Board of Forestry, 2003
What does all this imply for Latvia? Simply put, Latvia needs to focus not just on promoting high tech activities -- important though they may be. Instead, Latvia should put more effort into building an integrated forestry sector cluster. In Finland, this cluster
25
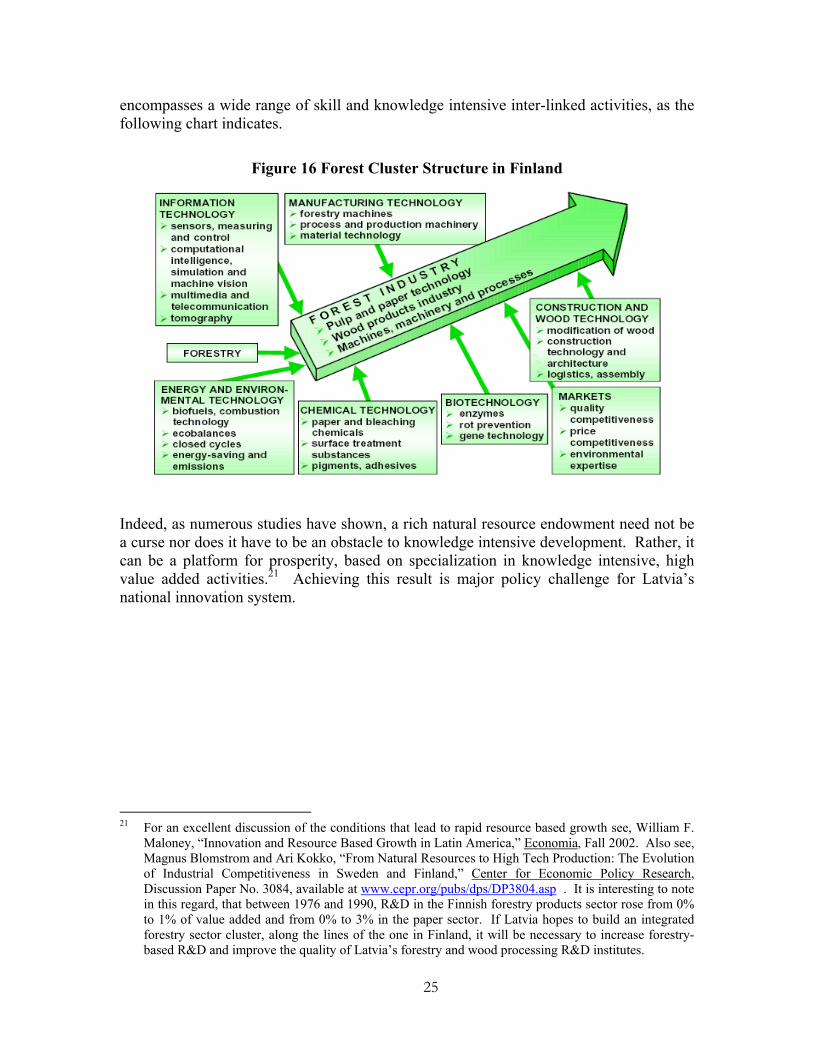
encompasses a wide range of skill and knowledge intensive inter-linked activities, as the following chart indicates.
Figure 16 Forest Cluster Structure in Finland
Indeed, as numerous studies have shown, a rich natural resource endowment need not be a curse nor does it have to be an obstacle to knowledge intensive development. Rather, it can be a platform for prosperity, based on specialization in knowledge intensive, high value added activities.21 Achieving this result is major policy challenge for Latvia’s national innovation system.
21 For an excellent discussion of the conditions that lead to rapid resource based growth see, William F.
Maloney, “Innovation and Resource Based Growth in Latin America,” Economia, Fall 2002. Also see, Magnus Blomstrom and Ari Kokko, “From Natural Resources to High Tech Production: The Evolution of Industrial Competitiveness in Sweden and Finland,” Center for Economic Policy Research, Discussion Paper No. 3084, available at www.cepr.org/pubs/dps/DP3804.asp . It is interesting to note in this regard, that between 1976 and 1990, R&D in the Finnish forestry products sector rose from 0% to 1% of value added and from 0% to 3% in the paper sector. If Latvia hopes to build an integrated forestry sector cluster, along the lines of the one in Finland, it will be necessary to increase forestry-based R&D and improve the quality of Latvia’s forestry and wood processing R&D institutes.
26
III. Benchmarking Latvia Three recent studies – the World Economic Forum’s Global Competitiveness Report, the World Bank Knowledge Economy Index, and Porter and Stern’s analysis of national innovation capacity -- highlight some of the complex challenges that Latvia will have to surmount if it is to create a globally competitive, high value added 21st century economy. A. Global Competitiveness Report The 2002-2003 Global Competitiveness Report seeks to understand “the microeconomic bases of a nation’s prosperity measured by its level of GDP per capita. The focus is on whether current prosperity is sustainable, and on the specific areas that must be addressed if GDP per capita is to achieve higher levels in the future.”22 Microeconomic competitiveness is important, the report observes, because “sound monetary and fiscal policies and the removal of distortions in exchange rates and other prices will eliminate impediments to productivity, but microeconomic foundations must be in place if productivity is actually to increase….Without microeconomic reforms, growth will be snuffed out as exports and jobs fail to materialize, wages stagnate, and the return on investment proves disappointing.”23 The Microeconomic Competitiveness Index (MICI) attempts to measure the quality of a country’s microeconomic foundations of development. The index is a weighted average of two inter-related sets of variables: (i) “the sophistication with which domestic companies or foreign subsidiaries operating in the country compete, and (ii) the quality of the microeconomic business environment.”24 The first set of variables attempts to measure whether a nation’s companies have the managerial, organizational and technical capacity to shift from a competitive model based on the production of simple products with low wage labor to a competitive model based on the production of sophisticated products utilizing sophisticated production processes and high wage, skilled labor. The second set of variables measures, in effect, measures the extent of cluster development in a particular country. As the report observes, “In developing countries, clusters are normally shallow or underdeveloped. Firms compete on the basis of cheap labor or local natural resources and they depend heavily on imported components, machinery and technology. Specialized local infrastructure and institutions are absent. As economies advance, clusters advance and deepen to include suppliers of specialized inputs, components, machinery and services; specialized infrastructure; and institutions providing specialized training, education, information, research, and technical support….The challenge for an economy is to move from isolated firms to an array of
22 Michael E. Porter, “Building the Microeconomic Foundations of Prosperity: Findings from the
Microeconomic Competitiveness Index,” in Peter K. Cornelius (ed.), The Global Competitiveness Report 2002-2003, Oxford University Press 2003, p. 24.
23 Ibid., p. 29 24 Ibid., p. 25
27
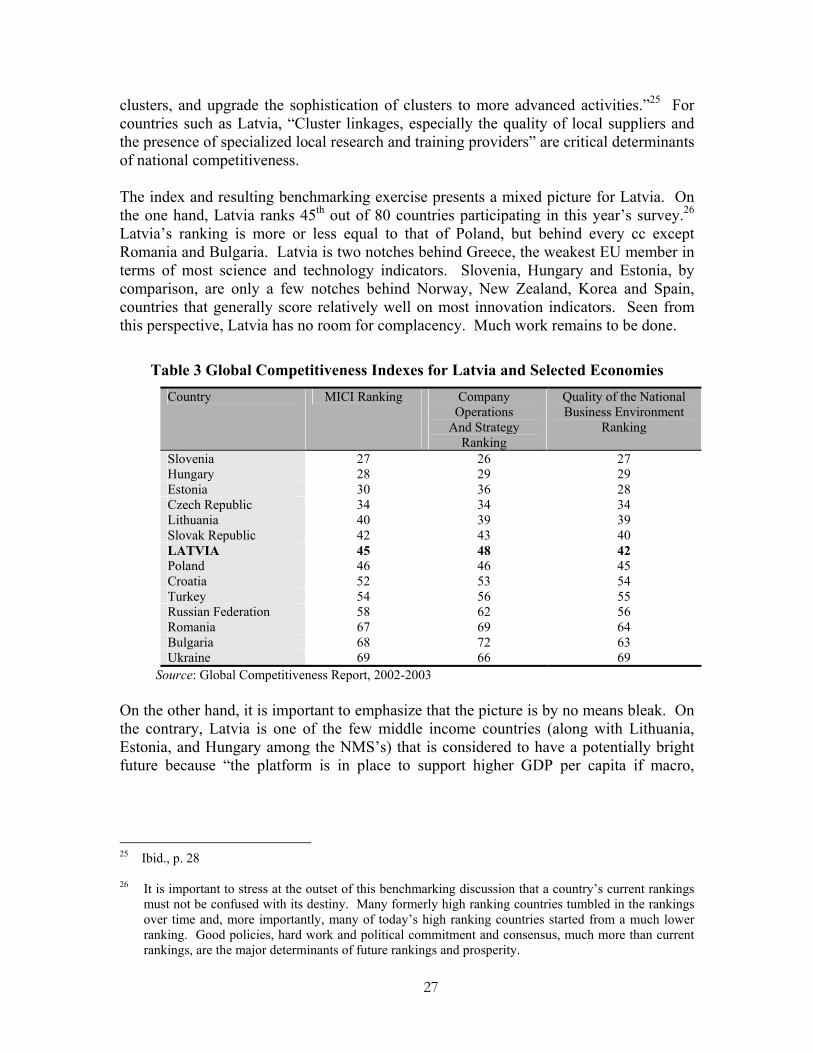
clusters, and upgrade the sophistication of clusters to more advanced activities.”25 For countries such as Latvia, “Cluster linkages, especially the quality of local suppliers and the presence of specialized local research and training providers” are critical determinants of national competitiveness. The index and resulting benchmarking exercise presents a mixed picture for Latvia. On the one hand, Latvia ranks 45th out of 80 countries participating in this year’s survey.26 Latvia’s ranking is more or less equal to that of Poland, but behind every cc except Romania and Bulgaria. Latvia is two notches behind Greece, the weakest EU member in terms of most science and technology indicators. Slovenia, Hungary and Estonia, by comparison, are only a few notches behind Norway, New Zealand, Korea and Spain, countries that generally score relatively well on most innovation indicators. Seen from this perspective, Latvia has no room for complacency. Much work remains to be done.
Table 3 Global Competitiveness Indexes for Latvia and Selected Economies Country MICI Ranking Company
Operations And Strategy
Ranking
Quality of the National Business Environment
Ranking
Slovenia 27 26 27 Hungary 28 29 29 Estonia 30 36 28 Czech Republic 34 34 34 Lithuania 40 39 39 Slovak Republic 42 43 40 LATVIA 45 48 42 Poland 46 46 45 Croatia 52 53 54 Turkey 54 56 55 Russian Federation 58 62 56 Romania 67 69 64 Bulgaria 68 72 63 Ukraine 69 66 69
Source: Global Competitiveness Report, 2002-2003 On the other hand, it is important to emphasize that the picture is by no means bleak. On the contrary, Latvia is one of the few middle income countries (along with Lithuania, Estonia, and Hungary among the NMS’s) that is considered to have a potentially bright future because “the platform is in place to support higher GDP per capita if macro,
25 Ibid., p. 28 26 It is important to stress at the outset of this benchmarking discussion that a country’s current rankings
must not be confused with its destiny. Many formerly high ranking countries tumbled in the rankings over time and, more importantly, many of today’s high ranking countries started from a much lower ranking. Good policies, hard work and political commitment and consensus, much more than current rankings, are the major determinants of future rankings and prosperity.
28
political or other constraints can be eased.”27 What sort of constraints are most critical can be discerned from the fact that Latvia scores lowest (relative to its overall ranking) on the company operations and strategy sub-index. Countries in this situation have companies that are not competing with sophisticated enough strategies. Critical microeconomic competitiveness objectives, therefore, should include helping companies improve the sophistication of production processes, become more customer oriented, and more attuned to marketing. Research collaboration also becomes important as companies strive to produce world quality products. Finally, cluster formation and development, along with efforts to develop higher value added links with international customers and suppliers, should also become important components of an overall company development strategy. However, just as interesting as the rankings is the discussion of the challenges that any economy must surmount as it moves through three stages of economic development. Nations at different levels of development face distinctly different challenges, competitive advantages, and modes of competition, the report observes. In the Factor-Driven stage, firms produce relatively simple, low-skill intensive, low value added products. Technology is assimilated primarily through imports or FDI. Firms compete primarily on the basis of price. In the Investment-Driven stage, efficiency in mass production is the dominant source of competitive advantage. Technology is accessed through licensing, joint ventures and FDI. Countries at this stage of development assimilate technology as well as develop the capacity to improve on it. Companies are capable of producing more sophisticated products and, as a result, are able to find more lucrative niches in global value chains and the global division of labor. Finally, in the Innovation-Driven stage, growth is driven primarily by the development and sale of new technologies and innovative products. Competitive advantage is based primarily on the ability to produce innovative products that are at the global technology frontier. Each stage has its own unique set of challenges and policy requirements. During the “Factor-Driven” phase, the main challenge is the establishment of policies that are conducive to the organization of efficient markets for land, labor and capital and the establishment of a business climate that supports capital accumulation. During the “Investment-Driven” stage, the main public policy task is the absorption and diffusion of knowledge produced elsewhere and the integration of the national economy into the global division of labor. And finally, during the “Innovative-Driven” stage, public policy must foster the rapid and repeated development and commercialization of new technologies. The authors note that “many of the failures in economic development in recent years involve countries getting stuck at critical junctures of economic transition: between Factor Driven and Investment Driven or Between Investment Driven and Innovation Driven stages….The shift from one phase of development to the next often requires new ways of organizing governments, markets and enterprises so it is not altogether surprising
27 Russia, in comparison to Latvia, is listed as a so called overachiever. It’s per capita GDP, although
bolstered by high oil prices, is not judged to be sustainable based on its overall microeconomic competitiveness.
29
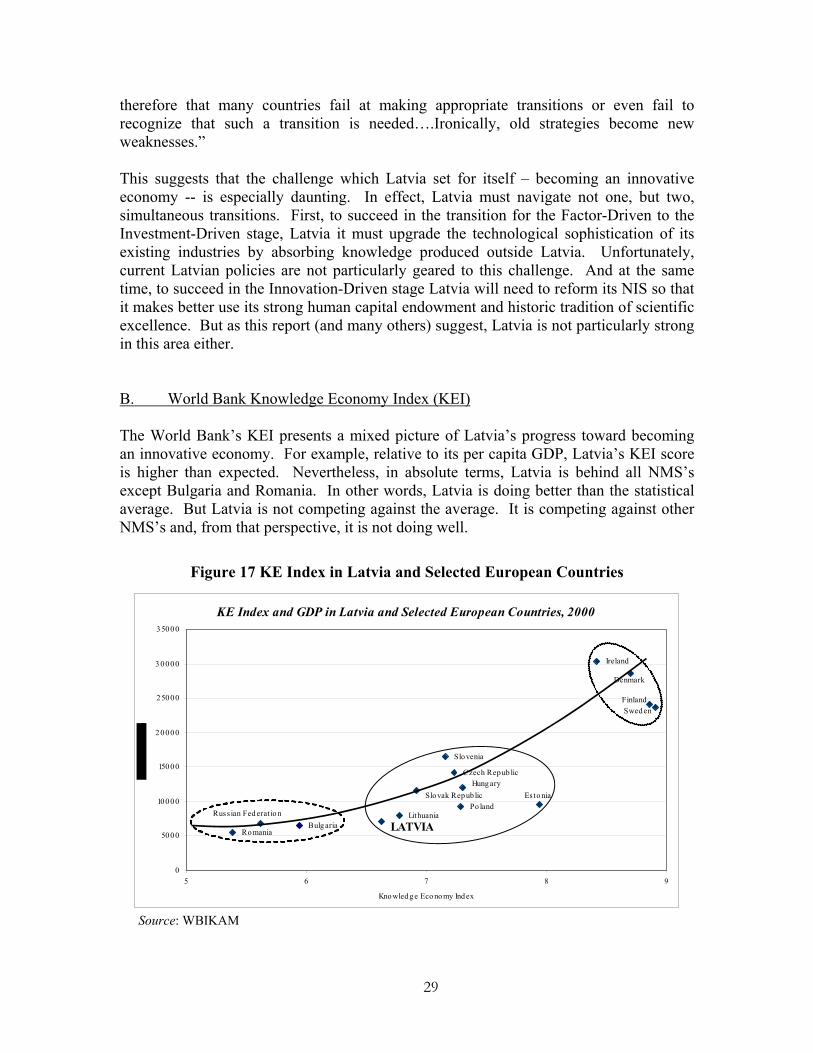
therefore that many countries fail at making appropriate transitions or even fail to recognize that such a transition is needed….Ironically, old strategies become new weaknesses.” This suggests that the challenge which Latvia set for itself – becoming an innovative economy -- is especially daunting. In effect, Latvia must navigate not one, but two, simultaneous transitions. First, to succeed in the transition for the Factor-Driven to the Investment-Driven stage, Latvia it must upgrade the technological sophistication of its existing industries by absorbing knowledge produced outside Latvia. Unfortunately, current Latvian policies are not particularly geared to this challenge. And at the same time, to succeed in the Innovation-Driven stage Latvia will need to reform its NIS so that it makes better use its strong human capital endowment and historic tradition of scientific excellence. But as this report (and many others) suggest, Latvia is not particularly strong in this area either. B. World Bank Knowledge Economy Index (KEI) The World Bank’s KEI presents a mixed picture of Latvia’s progress toward becoming an innovative economy. For example, relative to its per capita GDP, Latvia’s KEI score is higher than expected. Nevertheless, in absolute terms, Latvia is behind all NMS’s except Bulgaria and Romania. In other words, Latvia is doing better than the statistical average. But Latvia is not competing against the average. It is competing against other NMS’s and, from that perspective, it is not doing well.
Figure 17 KE Index in Latvia and Selected European Countries
KE Index and GDP in Latvia and Selected European Countries, 2000
Bulg aria
Czech Repub lic
Ireland
LithuaniaPo land
Romania
Slovenia
Denmark
Es tonia
Finland
Hungary
LATVIARussian Fed erat ion
Slovak Repub lic
Sweden
0
5000
10000
15000
2 0000
25000
3 0000
35000
5 6 7 8 9
Knowled ge Eco nomy Index
Source: WBIKAM
30
Several key conclusions emerge from this analysis:
• Although Latvia belongs to the middle group of the countries, within this group it ranks lowest in terms of both KEI and GDP. Furthermore, the gap that Latvia needs to bridge in order to move to a leading position within this middle group is almost as large as the gap between leading NMS’s (Czech Republic, Slovenia, Hungary and Estonia) and Ireland, Denmark, Finland and Sweden. In other words, Latvia’s task is daunting.
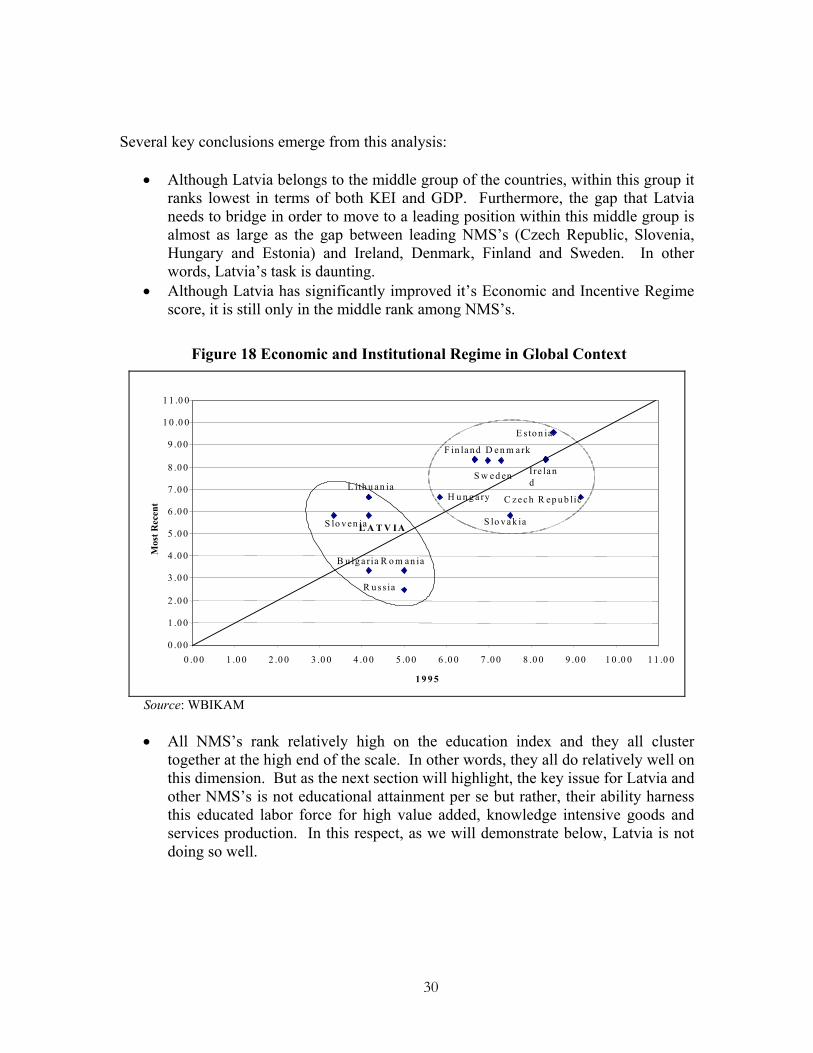
• Although Latvia has significantly improved it’s Economic and Incentive Regime score, it is still only in the middle rank among NMS’s.
Figure 18 Economic and Institutional Regime in Global Context
D e n m a rk
E s to n ia
Ire la nd
L A T V IA
L ith u an ia
S lo v en ia
C z e c h R ep u b lic
F in la n d
S w e d en
S lo v a k ia
H u n g a ry
R o m an iaB u lg a ria
R u ss ia
0 .0 0
1 .0 0
2 .0 0
3 .0 0
4 .0 0
5 .0 0
6 .0 0
7 .0 0
8 .0 0
9 .0 0
1 0 .0 0
1 1 .0 0
0 .0 0 1 .0 0 2 .0 0 3 .0 0 4 .0 0 5 .0 0 6 .0 0 7 .0 0 8 .0 0 9 .0 0 1 0 .0 0 1 1 .0 0
1 9 9 5
Mos
t Rec
ent
Source: WBIKAM
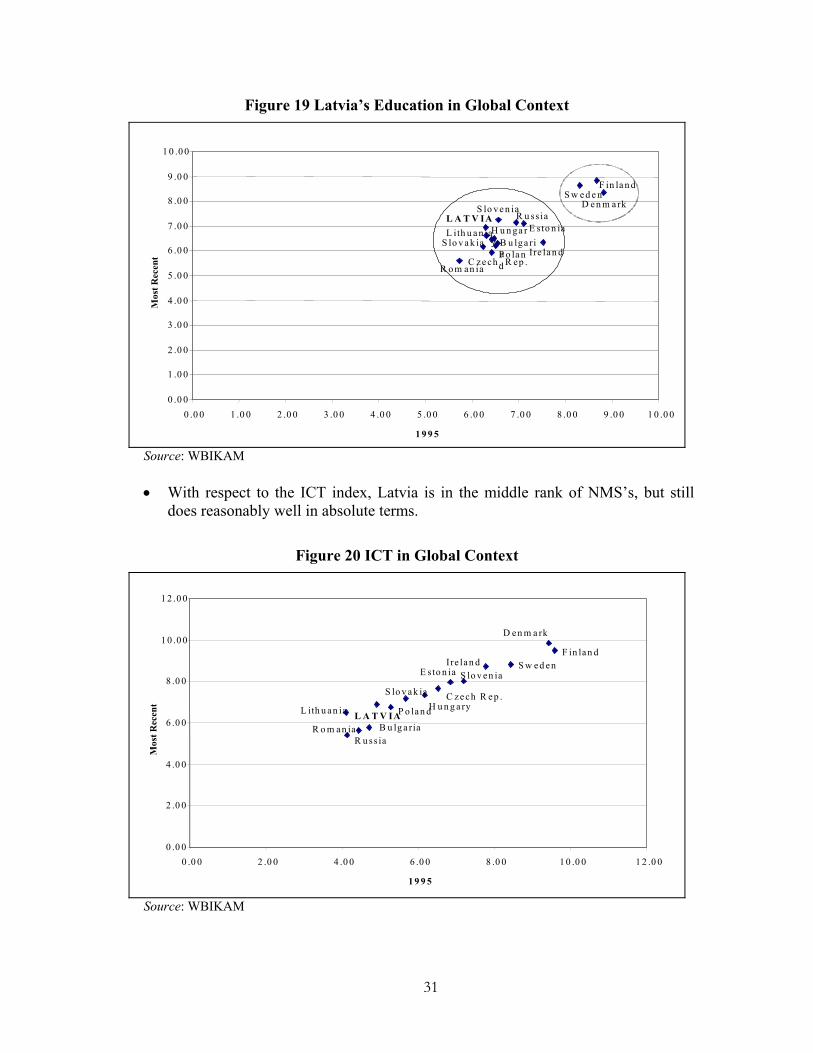
• All NMS’s rank relatively high on the education index and they all cluster
together at the high end of the scale. In other words, they all do relatively well on this dimension. But as the next section will highlight, the key issue for Latvia and other NMS’s is not educational attainment per se but rather, their ability harness this educated labor force for high value added, knowledge intensive goods and services production. In this respect, as we will demonstrate below, Latvia is not doing so well.
31
Figure 19 Latvia’s Education in Global Context
D e n m a rkS w e d e n
F in la n d
R u ss iaE s to n ia
S lo v e n ia
R o m an ia
Ire la n dP o la nd
S lo v a k iaL ith u a n iaH u n ga r
y B u lga ria
C z e ch . R ep .
L A T V IA
0 .0 0
1 .0 0
2 .0 0
3 .0 0
4 .0 0
5 .0 0
6 .0 0
7 .0 0
8 .0 0
9 .0 0
1 0 .0 0
0 .0 0 1 .0 0 2 .0 0 3 .0 0 4 .0 0 5 .0 0 6 .0 0 7 .0 0 8 .0 0 9 .0 0 1 0 .0 0
1 9 9 5
Mos
t Rec
ent
Source: WBIKAM
• With respect to the ICT index, Latvia is in the middle rank of NMS’s, but still
does reasonably well in absolute terms.
Figure 20 ICT in Global Context
I re lan d S w ed enF in lan d
D en m a rk
S lo v en ia
C ze ch R e p .
E s to n ia
H u n g a ryS lo v ak ia
P o lan dL A T V IAL ith u an ia
B u lg a riaR u ss ia
R o m an ia
0 .0 0
2 .0 0
4 .0 0
6 .0 0
8 .0 0
1 0 .0 0
1 2 .0 0
0 .0 0 2 .0 0 4 .0 0 6 .0 0 8 .0 0 1 0 .0 0 1 2 .0 0
1 9 9 5
Mos
t Rec
ent
Source: WBIKAM
32
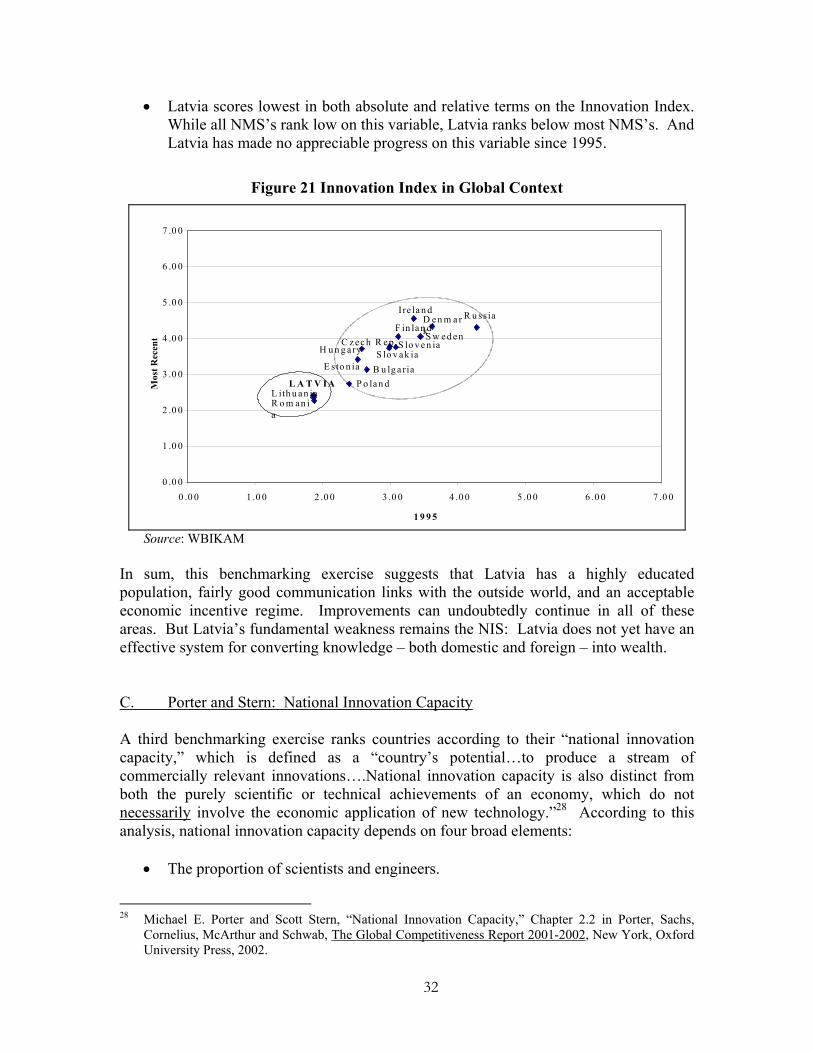
• Latvia scores lowest in both absolute and relative terms on the Innovation Index. While all NMS’s rank low on this variable, Latvia ranks below most NMS’s. And Latvia has made no appreciable progress on this variable since 1995.
Figure 21 Innovation Index in Global Context
F in la n dS w ed enC z ec h R ep .
S lo v ak iaS lo v e n ia
E s to n ia
H u n g a ry
B u lg a riaP o lan dL A T V IA
L ith u an ia
D en m a rk
R u ss iaIre la n d
0 .0 0
1 .0 0
2 .0 0
3 .0 0
4 .0 0
5 .0 0
6 .0 0
7 .0 0
0 .0 0 1 .0 0 2 .0 0 3 .0 0 4 .0 0 5 .0 0 6 .0 0 7 .0 0
1 9 9 5
Mos
t Rec
ent
R o m an ia
Source: WBIKAM
In sum, this benchmarking exercise suggests that Latvia has a highly educated population, fairly good communication links with the outside world, and an acceptable economic incentive regime. Improvements can undoubtedly continue in all of these areas. But Latvia’s fundamental weakness remains the NIS: Latvia does not yet have an effective system for converting knowledge – both domestic and foreign – into wealth. C. Porter and Stern: National Innovation Capacity A third benchmarking exercise ranks countries according to their “national innovation capacity,” which is defined as a “country’s potential…to produce a stream of commercially relevant innovations….National innovation capacity is also distinct from both the purely scientific or technical achievements of an economy, which do not necessarily involve the economic application of new technology.”28 According to this analysis, national innovation capacity depends on four broad elements:
• The proportion of scientists and engineers.
28 Michael E. Porter and Scott Stern, “National Innovation Capacity,” Chapter 2.2 in Porter, Sachs,
Cornelius, McArthur and Schwab, The Global Competitiveness Report 2001-2002, New York, Oxford University Press, 2002.
33
• The common innovation infrastructure which is defined as the broad set of policies affecting innovation including tax incentives, the protection of intellectual property, anti-trust enforcement and openness to competition. It also includes such purely scientific technological factors as excellence in basic research. But in general, the innovation infrastructure is more closely related to general business climate issues than to technology measures.
• The cluster-specific environment for innovation.29 This dimension of innovation capacity recognizes that “the commercialization of new technologies takes place disproportionately in clusters -- geographic concentrations of interconnected companies and institutions in a particular field.” This in turn leads to “the presence of high quality and specialized inputs, a context that encourages investment coupled with intense local rivalry, pressure and insight gleaned from sophisticated local demand, and the local presence of related and supporting industries.” The key point here is that isolated firms are at a competitive disadvantage. A precondition for success in today’s global economy is a dense web of relationships between suppliers, customers, competitors, researchers and universities. Establishing this dense web is a pre-requisite for innovation and a challenge for innovation policy.
• The quality of linkages is the glue that binds the other elements together. This variable measures the communications links between these various institutions. But communications links in this context do not refer to such mechanical items as ICT and the internet. Instead, they refer to the formal and informal social organizations and networks that bind organizations and institutions to each other within the cluster. “Without strong linkages,” the authors explain, a nation’s upstream scientific and technical advances can diffuse to other countries more quickly than they can be exploited at home.”
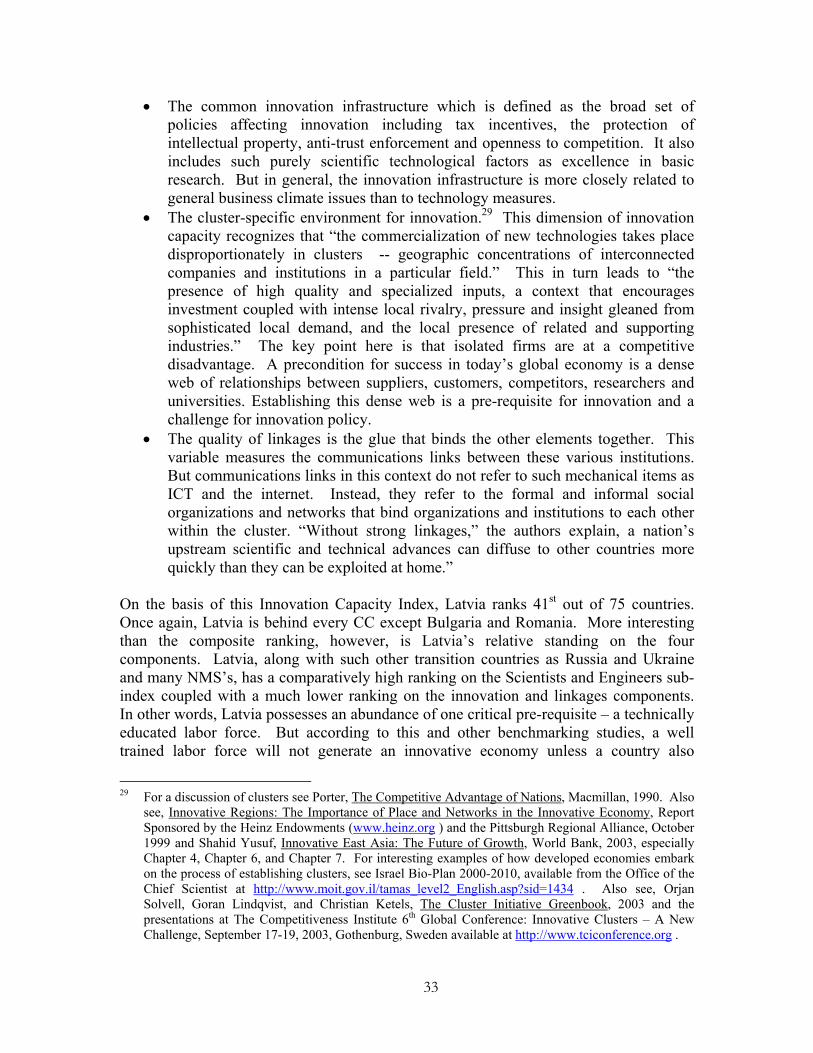
On the basis of this Innovation Capacity Index, Latvia ranks 41st out of 75 countries. Once again, Latvia is behind every CC except Bulgaria and Romania. More interesting than the composite ranking, however, is Latvia’s relative standing on the four components. Latvia, along with such other transition countries as Russia and Ukraine and many NMS’s, has a comparatively high ranking on the Scientists and Engineers sub-index coupled with a much lower ranking on the innovation and linkages components. In other words, Latvia possesses an abundance of one critical pre-requisite – a technically educated labor force. But according to this and other benchmarking studies, a well trained labor force will not generate an innovative economy unless a country also
29 For a discussion of clusters see Porter, The Competitive Advantage of Nations, Macmillan, 1990. Also
see, Innovative Regions: The Importance of Place and Networks in the Innovative Economy, Report Sponsored by the Heinz Endowments (www.heinz.org ) and the Pittsburgh Regional Alliance, October 1999 and Shahid Yusuf, Innovative East Asia: The Future of Growth, World Bank, 2003, especially Chapter 4, Chapter 6, and Chapter 7. For interesting examples of how developed economies embark on the process of establishing clusters, see Israel Bio-Plan 2000-2010, available from the Office of the Chief Scientist at http://www.moit.gov.il/tamas_level2_English.asp?sid=1434 . Also see, Orjan Solvell, Goran Lindqvist, and Christian Ketels, The Cluster Initiative Greenbook, 2003 and the presentations at The Competitiveness Institute 6th Global Conference: Innovative Clusters – A New Challenge, September 17-19, 2003, Gothenburg, Sweden available at http://www.tciconference.org .
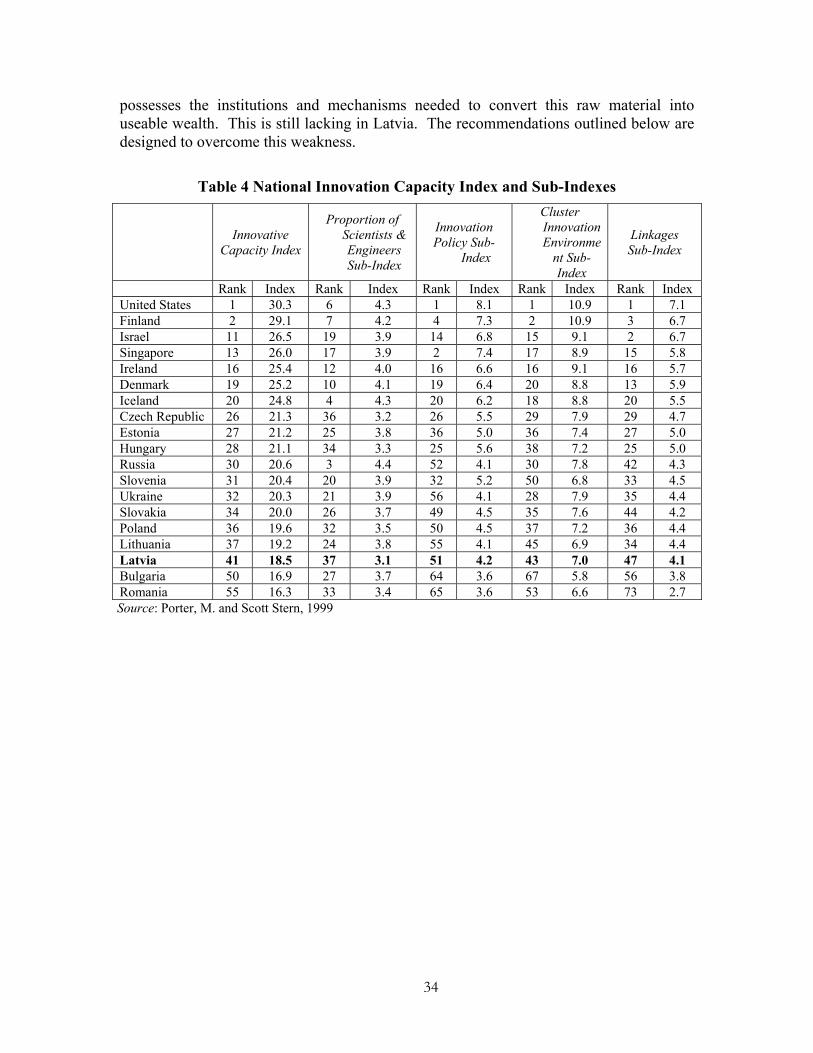
34
possesses the institutions and mechanisms needed to convert this raw material into useable wealth. This is still lacking in Latvia. The recommendations outlined below are designed to overcome this weakness.
Table 4 National Innovation Capacity Index and Sub-Indexes
Innovative Capacity Index
Proportion of Scientists & Engineers Sub-Index
Innovation Policy Sub-
Index
Cluster Innovation Environme
nt Sub-Index
Linkages Sub-Index
Rank Index Rank Index Rank Index Rank Index Rank Index United States 1 30.3 6 4.3 1 8.1 1 10.9 1 7.1 Finland 2 29.1 7 4.2 4 7.3 2 10.9 3 6.7 Israel 11 26.5 19 3.9 14 6.8 15 9.1 2 6.7 Singapore 13 26.0 17 3.9 2 7.4 17 8.9 15 5.8 Ireland 16 25.4 12 4.0 16 6.6 16 9.1 16 5.7 Denmark 19 25.2 10 4.1 19 6.4 20 8.8 13 5.9 Iceland 20 24.8 4 4.3 20 6.2 18 8.8 20 5.5 Czech Republic 26 21.3 36 3.2 26 5.5 29 7.9 29 4.7 Estonia 27 21.2 25 3.8 36 5.0 36 7.4 27 5.0 Hungary 28 21.1 34 3.3 25 5.6 38 7.2 25 5.0 Russia 30 20.6 3 4.4 52 4.1 30 7.8 42 4.3 Slovenia 31 20.4 20 3.9 32 5.2 50 6.8 33 4.5 Ukraine 32 20.3 21 3.9 56 4.1 28 7.9 35 4.4 Slovakia 34 20.0 26 3.7 49 4.5 35 7.6 44 4.2 Poland 36 19.6 32 3.5 50 4.5 37 7.2 36 4.4 Lithuania 37 19.2 24 3.8 55 4.1 45 6.9 34 4.4 Latvia 41 18.5 37 3.1 51 4.2 43 7.0 47 4.1 Bulgaria 50 16.9 27 3.7 64 3.6 67 5.8 56 3.8 Romania 55 16.3 33 3.4 65 3.6 53 6.6 73 2.7 Source: Porter, M. and Scott Stern, 1999
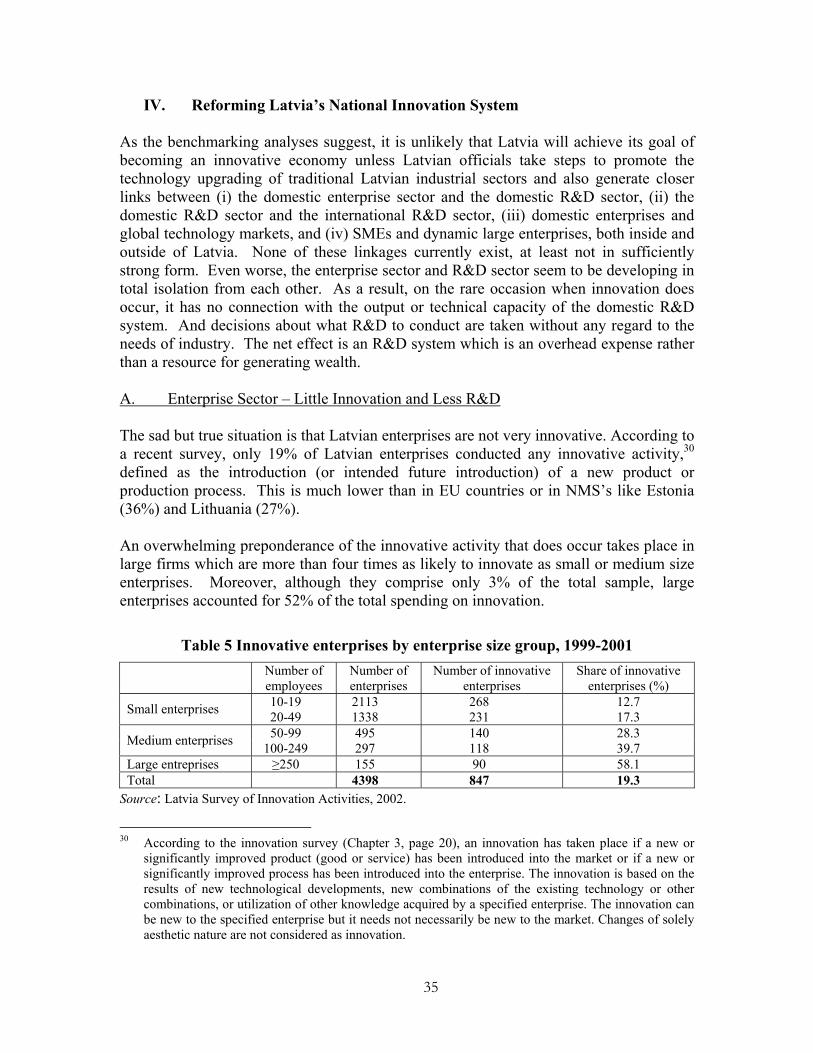
35
IV. Reforming Latvia’s National Innovation System As the benchmarking analyses suggest, it is unlikely that Latvia will achieve its goal of becoming an innovative economy unless Latvian officials take steps to promote the technology upgrading of traditional Latvian industrial sectors and also generate closer links between (i) the domestic enterprise sector and the domestic R&D sector, (ii) the domestic R&D sector and the international R&D sector, (iii) domestic enterprises and global technology markets, and (iv) SMEs and dynamic large enterprises, both inside and outside of Latvia. None of these linkages currently exist, at least not in sufficiently strong form. Even worse, the enterprise sector and R&D sector seem to be developing in total isolation from each other. As a result, on the rare occasion when innovation does occur, it has no connection with the output or technical capacity of the domestic R&D system. And decisions about what R&D to conduct are taken without any regard to the needs of industry. The net effect is an R&D system which is an overhead expense rather than a resource for generating wealth. A. Enterprise Sector – Little Innovation and Less R&D The sad but true situation is that Latvian enterprises are not very innovative. According to a recent survey, only 19% of Latvian enterprises conducted any innovative activity,30 defined as the introduction (or intended future introduction) of a new product or production process. This is much lower than in EU countries or in NMS’s like Estonia (36%) and Lithuania (27%). An overwhelming preponderance of the innovative activity that does occur takes place in large firms which are more than four times as likely to innovate as small or medium size enterprises. Moreover, although they comprise only 3% of the total sample, large enterprises accounted for 52% of the total spending on innovation.
Table 5 Innovative enterprises by enterprise size group, 1999-2001
Number of employees
Number of enterprises
Number of innovative enterprises
Share of innovative enterprises (%)
10-19 2113 268 12.7 Small enterprises 20-49 1338 231 17.3 50-99 495 140 28.3 Medium enterprises 100-249 297 118 39.7
Large entreprises ≥250 155 90 58.1 Total 4398 847 19.3
Source: Latvia Survey of Innovation Activities, 2002.
30 According to the innovation survey (Chapter 3, page 20), an innovation has taken place if a new or
significantly improved product (good or service) has been introduced into the market or if a new or significantly improved process has been introduced into the enterprise. The innovation is based on the results of new technological developments, new combinations of the existing technology or other combinations, or utilization of other knowledge acquired by a specified enterprise. The innovation can be new to the specified enterprise but it needs not necessarily be new to the market. Changes of solely aesthetic nature are not considered as innovation.
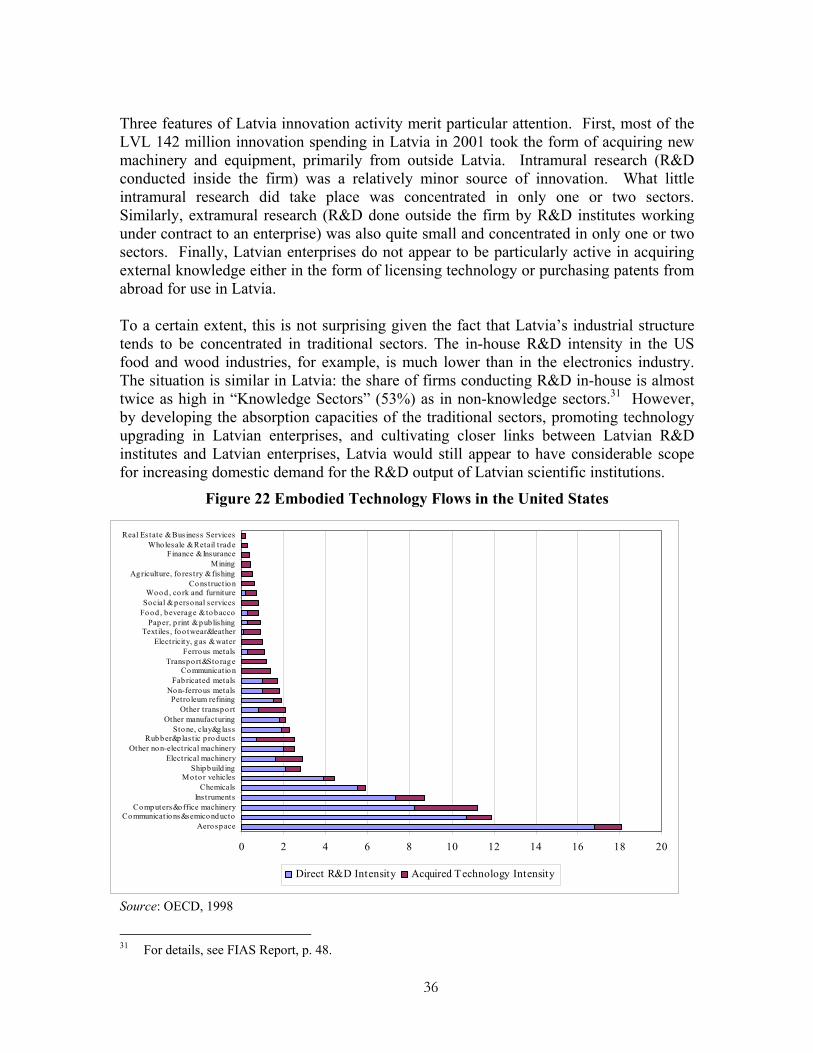
36
Three features of Latvia innovation activity merit particular attention. First, most of the LVL 142 million innovation spending in Latvia in 2001 took the form of acquiring new machinery and equipment, primarily from outside Latvia. Intramural research (R&D conducted inside the firm) was a relatively minor source of innovation. What little intramural research did take place was concentrated in only one or two sectors. Similarly, extramural research (R&D done outside the firm by R&D institutes working under contract to an enterprise) was also quite small and concentrated in only one or two sectors. Finally, Latvian enterprises do not appear to be particularly active in acquiring external knowledge either in the form of licensing technology or purchasing patents from abroad for use in Latvia. To a certain extent, this is not surprising given the fact that Latvia’s industrial structure tends to be concentrated in traditional sectors. The in-house R&D intensity in the US food and wood industries, for example, is much lower than in the electronics industry. The situation is similar in Latvia: the share of firms conducting R&D in-house is almost twice as high in “Knowledge Sectors” (53%) as in non-knowledge sectors.31 However, by developing the absorption capacities of the traditional sectors, promoting technology upgrading in Latvian enterprises, and cultivating closer links between Latvian R&D institutes and Latvian enterprises, Latvia would still appear to have considerable scope for increasing domestic demand for the R&D output of Latvian scientific institutions.
Figure 22 Embodied Technology Flows in the United States
0 2 4 6 8 10 12 14 16 18 20
Aerosp aceCommunicat ions&semicond ucto
Co mputers&office machineryIns t ruments
ChemicalsMoto r vehicles
Shipb uild ingElectrical machinery
Other no n-electrical machineryRub ber&p las tic p ro ducts
Sto ne, clay&g lassOther manufacturing
Other transpo rtPetro leum refining
No n-ferrous metalsFab ricated metals
Co mmunicatio nTranspo rt&Sto rag e
Ferrous metalsElectricity, gas & water
Text iles , fo o twear&leatherPap er, p rint & p ub lishing
Fo od , beverage & to baccoSocial & personal servicesWoo d , co rk and furniture
Co ns tructio nAgriculture, fo res t ry & fishing
MiningFinance & Insurance
Wholesale & Retail t rad eReal Es tate & Bus iness Services
Direct R&D Intensity Acquired Technology Intensity
Source: OECD, 1998
31 For details, see FIAS Report, p. 48.
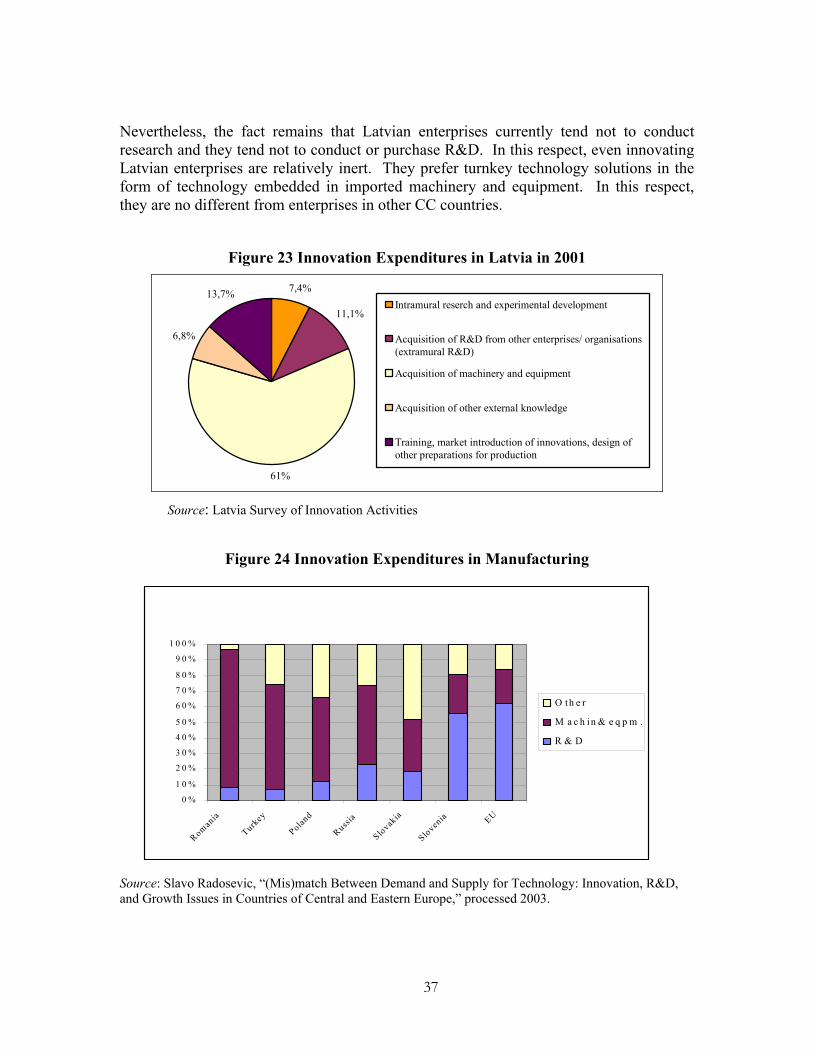
37
Nevertheless, the fact remains that Latvian enterprises currently tend not to conduct research and they tend not to conduct or purchase R&D. In this respect, even innovating Latvian enterprises are relatively inert. They prefer turnkey technology solutions in the form of technology embedded in imported machinery and equipment. In this respect, they are no different from enterprises in other CC countries.
Figure 23 Innovation Expenditures in Latvia in 2001
11,1%
7,4%13,7%
6,8%
61%
Intramural reserch and experimental development
Acquisition of R&D from other enterprises/ organisations(extramural R&D)
Acquisition of machinery and equipment
Acquisition of other external knowledge
Training, market introduction of innovations, design ofother preparations for production
Source: Latvia Survey of Innovation Activities
Figure 24 Innovation Expenditures in Manufacturing
9
0 %
1 0 %
2 0 %
3 0 %
4 0 %
5 0 %
6 0 %
7 0 %
8 0 %
9 0 %
1 0 0 %
Romania
Turkey
Poland
Russia
Slovakia
Slovenia EU
O th e r
M a c h in & e q p m .
R & D
Source: Slavo Radosevic, “(Mis)match Between Demand and Supply for Technology: Innovation, R&D, and Growth Issues in Countries of Central and Eastern Europe,” processed 2003.
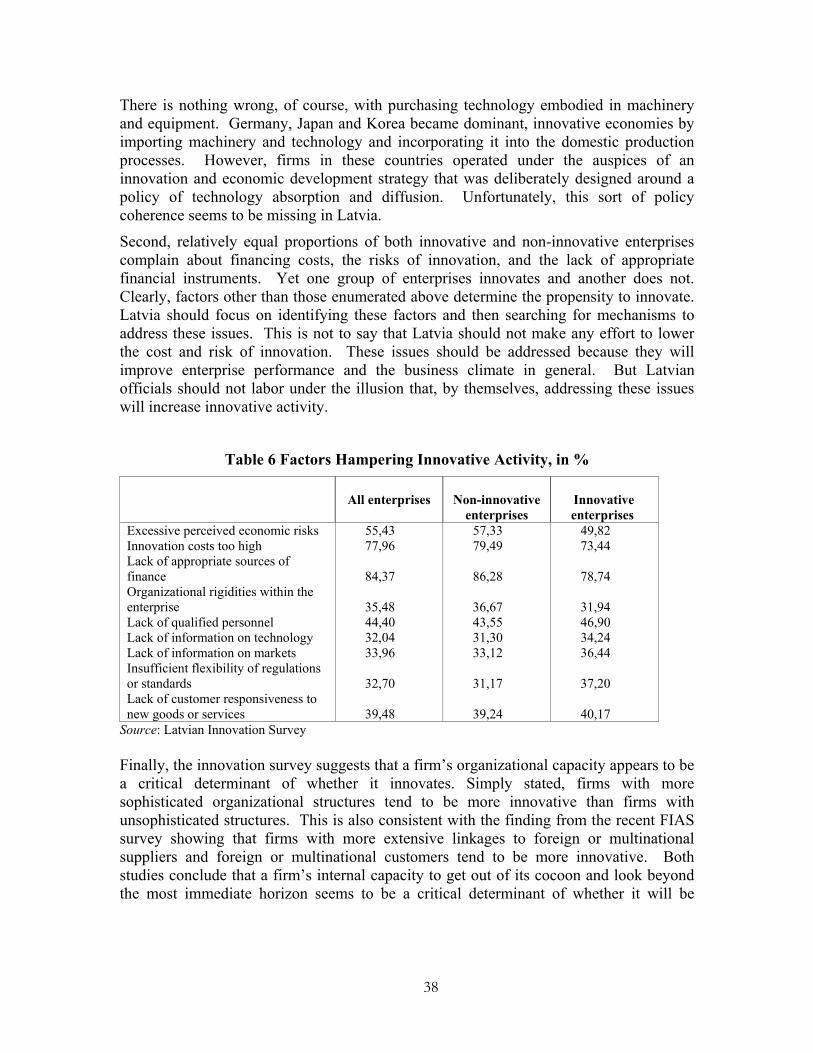
38
There is nothing wrong, of course, with purchasing technology embodied in machinery and equipment. Germany, Japan and Korea became dominant, innovative economies by importing machinery and technology and incorporating it into the domestic production processes. However, firms in these countries operated under the auspices of an innovation and economic development strategy that was deliberately designed around a policy of technology absorption and diffusion. Unfortunately, this sort of policy coherence seems to be missing in Latvia.
Second, relatively equal proportions of both innovative and non-innovative enterprises complain about financing costs, the risks of innovation, and the lack of appropriate financial instruments. Yet one group of enterprises innovates and another does not. Clearly, factors other than those enumerated above determine the propensity to innovate. Latvia should focus on identifying these factors and then searching for mechanisms to address these issues. This is not to say that Latvia should not make any effort to lower the cost and risk of innovation. These issues should be addressed because they will improve enterprise performance and the business climate in general. But Latvian officials should not labor under the illusion that, by themselves, addressing these issues will increase innovative activity.
Table 6 Factors Hampering Innovative Activity, in %
All enterprises
Non-innovative
enterprises
Innovative enterprises
Excessive perceived economic risks 55,43 57,33 49,82 Innovation costs too high 77,96 79,49 73,44 Lack of appropriate sources of finance 84,37 86,28 78,74 Organizational rigidities within the enterprise 35,48 36,67 31,94 Lack of qualified personnel 44,40 43,55 46,90 Lack of information on technology 32,04 31,30 34,24 Lack of information on markets 33,96 33,12 36,44 Insufficient flexibility of regulations or standards 32,70 31,17 37,20 Lack of customer responsiveness to new goods or services 39,48 39,24 40,17
Source: Latvian Innovation Survey Finally, the innovation survey suggests that a firm’s organizational capacity appears to be a critical determinant of whether it innovates. Simply stated, firms with more sophisticated organizational structures tend to be more innovative than firms with unsophisticated structures. This is also consistent with the finding from the recent FIAS survey showing that firms with more extensive linkages to foreign or multinational suppliers and foreign or multinational customers tend to be more innovative. Both studies conclude that a firm’s internal capacity to get out of its cocoon and look beyond the most immediate horizon seems to be a critical determinant of whether it will be
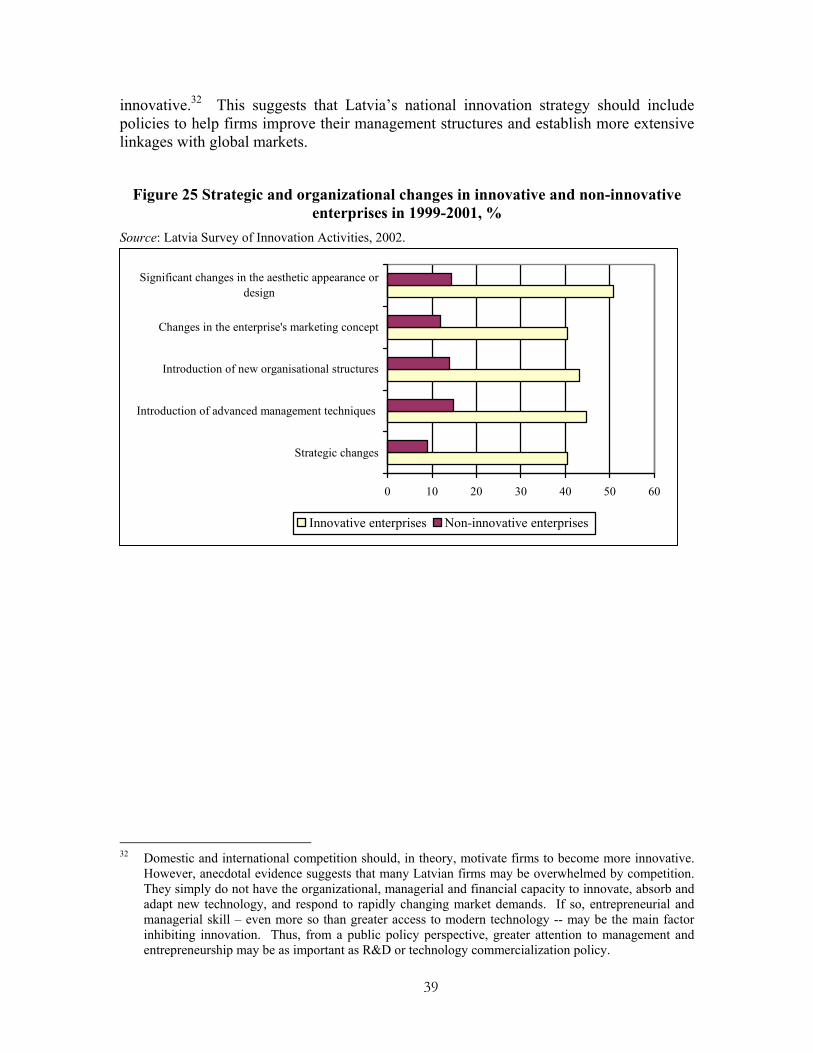
39
innovative.32 This suggests that Latvia’s national innovation strategy should include policies to help firms improve their management structures and establish more extensive linkages with global markets.
Figure 25 Strategic and organizational changes in innovative and non-innovative enterprises in 1999-2001, %
Source: Latvia Survey of Innovation Activities, 2002.
32 Domestic and international competition should, in theory, motivate firms to become more innovative.
However, anecdotal evidence suggests that many Latvian firms may be overwhelmed by competition. They simply do not have the organizational, managerial and financial capacity to innovate, absorb and adapt new technology, and respond to rapidly changing market demands. If so, entrepreneurial and managerial skill – even more so than greater access to modern technology -- may be the main factor inhibiting innovation. Thus, from a public policy perspective, greater attention to management and entrepreneurship may be as important as R&D or technology commercialization policy.
0 10 20 30 40 50 60
Strategic changes
Introduction of advanced management techniques
Introduction of new organisational structures
Changes in the enterprise's marketing concept
Significant changes in the aesthetic appearance ordesign
Innovative enterprises Non-innovative enterprises
40
V. Latvia’s NIS – Change without Reform A. Production of Knowledge Unfortunately, the existing Latvian NIS is not geared to meeting these challenges. Nor have any of the changes that occurred in the past 12 years moved the system closer to this goal. On the contrary, most of the changes to date were designed to preserve the existing NIS in its old Soviet form. This preservation strategy was predicated on the assumption that the resumption of growth and aggregate demand in the Latvian economy would lead to a resumption of demand for R&D. In other words, the old Soviet relations between R&D and the enterprise sector would be restored as soon as the pace of economic activity accelerated from the immediate post-transition trough. That has not materialized. Aggregate demand and industrial production are both up, but demand for R&D has not accelerated.33 Consequently, preservation has proven illusory. Reform was postponed, but at the expense of weakening Latvia’s R&D capacity. As a result, Latvia faces the worst of both worlds – change without fundamental reform and a weak NIS at a time when a strong NIS is an increasing imperative for growth. It was initially expected that preservation would be the least painful, least expensive strategy since it would enable Latvia to preserve its rich legacy of R&D excellence. But now it is turning out that this is a very expensive strategy since Latvia is in danger of losing what little R&D capacity remains. Technology development during the Soviet period can be compared to a river flowing downhill. R&D institutes were at the top of the hill, performing fundamental research. Their knowledge and scientific findings flowed down to branch or applied research institutes which conducted the additional R&D, including the detailed design and engineering operations, required to transform basic research into useable production technologies and products. Enterprises were at the end of the stream, passively receiving technology developed in upstream branch institutes and utilizing it to produce goods and services. While this approach generated major scientific achievements, it also had serious economic shortcomings. For example:
• Research was compartmentalized on the basis of technical specialties. This restricted the cross fertilization of ideas and multi-disciplinary new technical developments.
• Research capacity was (and remains today) concentrated in public research institutes. As a matter of policy, educational institutions and especially (non-defense) enterprises had little or no research capacity and were not expected to play an active role in technology development;
• Enterprises were passive recipients of knowledge supplied by others and generated elsewhere. They had no incentive to adapt or utilize new technologies since doing so would disrupt production operations and fulfillment of the “plan.”
33 For a fuller development of this argument ee, Slavo Radosevic, “Patterns of Preservation, Restructuring,
and Survival: Science and Technology Policy in Russia in the Post-Soviet Era,” Research Policy 32 (2003) 1105-1124.
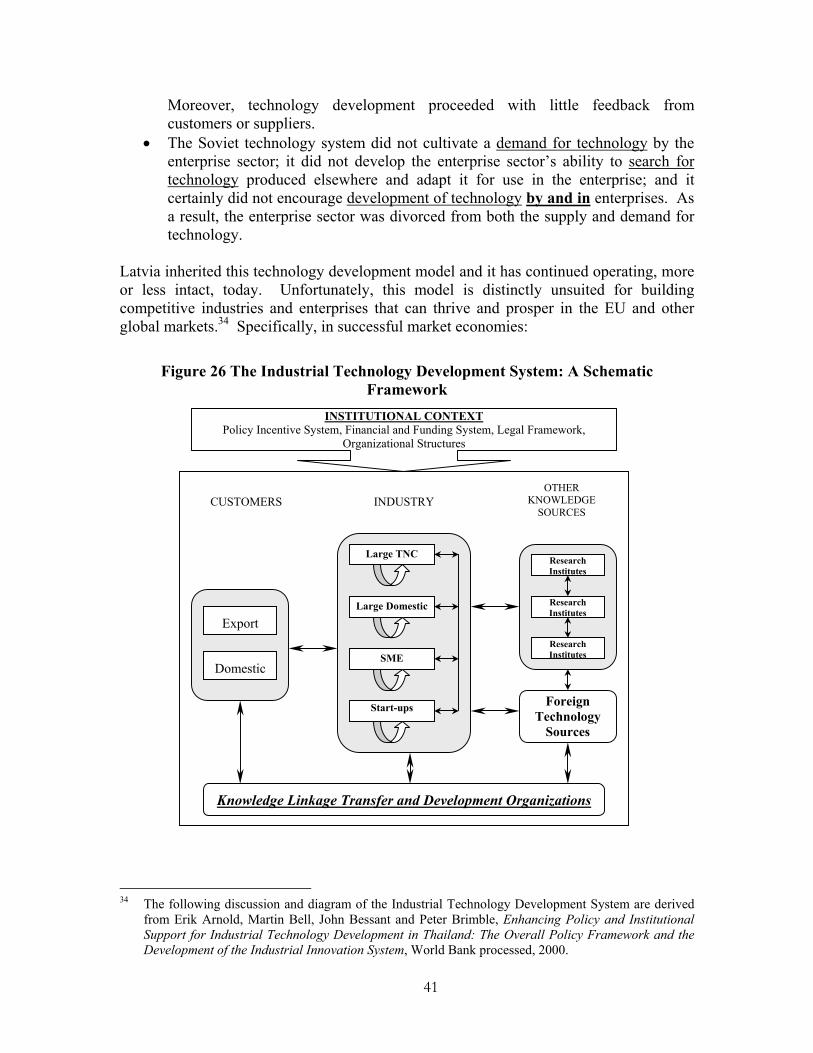
41
Moreover, technology development proceeded with little feedback from customers or suppliers.
• The Soviet technology system did not cultivate a demand for technology by the enterprise sector; it did not develop the enterprise sector’s ability to search for technology produced elsewhere and adapt it for use in the enterprise; and it certainly did not encourage development of technology by and in enterprises. As a result, the enterprise sector was divorced from both the supply and demand for technology.
Latvia inherited this technology development model and it has continued operating, more or less intact, today. Unfortunately, this model is distinctly unsuited for building competitive industries and enterprises that can thrive and prosper in the EU and other global markets.34 Specifically, in successful market economies:
Figure 26 The Industrial Technology Development System: A Schematic Framework
34 The following discussion and diagram of the Industrial Technology Development System are derived
from Erik Arnold, Martin Bell, John Bessant and Peter Brimble, Enhancing Policy and Institutional Support for Industrial Technology Development in Thailand: The Overall Policy Framework and the Development of the Industrial Innovation System, World Bank processed, 2000.
Research Institutes
Large TNC
Start-ups
SME
Large Domestic
Foreign Technology
Sources
Research Institutes
Research Institutes
Research Institutes
Knowledge Linkage Transfer and Development Organizations
CUSTOMERS
Domestic
Export
INDUSTRY OTHER
KNOWLEDGE SOURCES
INSTITUTIONAL CONTEXT Policy Incentive System, Financial and Funding System, Legal Framework,
Organizational Structures
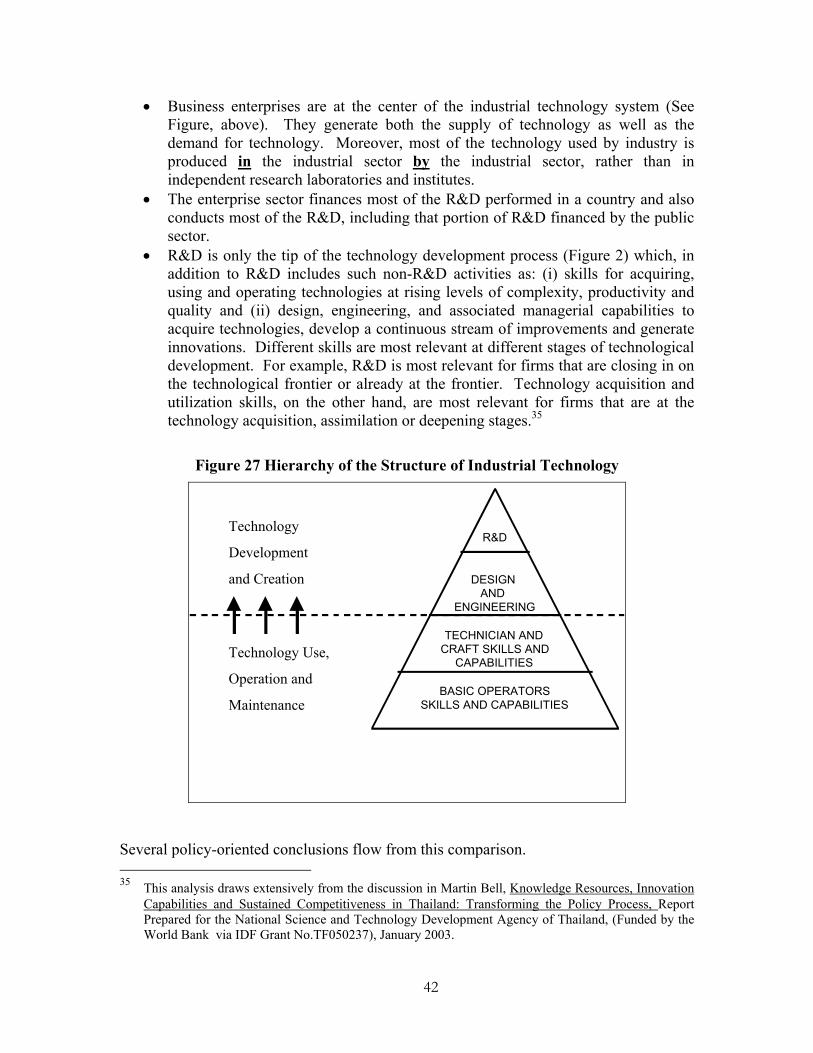
42
• Business enterprises are at the center of the industrial technology system (See Figure, above). They generate both the supply of technology as well as the demand for technology. Moreover, most of the technology used by industry is produced in the industrial sector by the industrial sector, rather than in independent research laboratories and institutes.
• The enterprise sector finances most of the R&D performed in a country and also conducts most of the R&D, including that portion of R&D financed by the public sector.
• R&D is only the tip of the technology development process (Figure 2) which, in addition to R&D includes such non-R&D activities as: (i) skills for acquiring, using and operating technologies at rising levels of complexity, productivity and quality and (ii) design, engineering, and associated managerial capabilities to acquire technologies, develop a continuous stream of improvements and generate innovations. Different skills are most relevant at different stages of technological development. For example, R&D is most relevant for firms that are closing in on the technological frontier or already at the frontier. Technology acquisition and utilization skills, on the other hand, are most relevant for firms that are at the technology acquisition, assimilation or deepening stages.35
Figure 27 Hierarchy of the Structure of Industrial Technology
R&D
DESIGN AND
ENGINEERING
TECHNICIAN ANDCRAFT SKILLS AND
CAPABILITIES
BASIC OPERATORSSKILLS AND CAPABILITIES
Technology
Development
and Creation
Technology Use,
Operation and
Maintenance
Several policy-oriented conclusions flow from this comparison. 35 This analysis draws extensively from the discussion in Martin Bell, Knowledge Resources, Innovation
Capabilities and Sustained Competitiveness in Thailand: Transforming the Policy Process, Report Prepared for the National Science and Technology Development Agency of Thailand, (Funded by the World Bank via IDF Grant No.TF050237), January 2003.
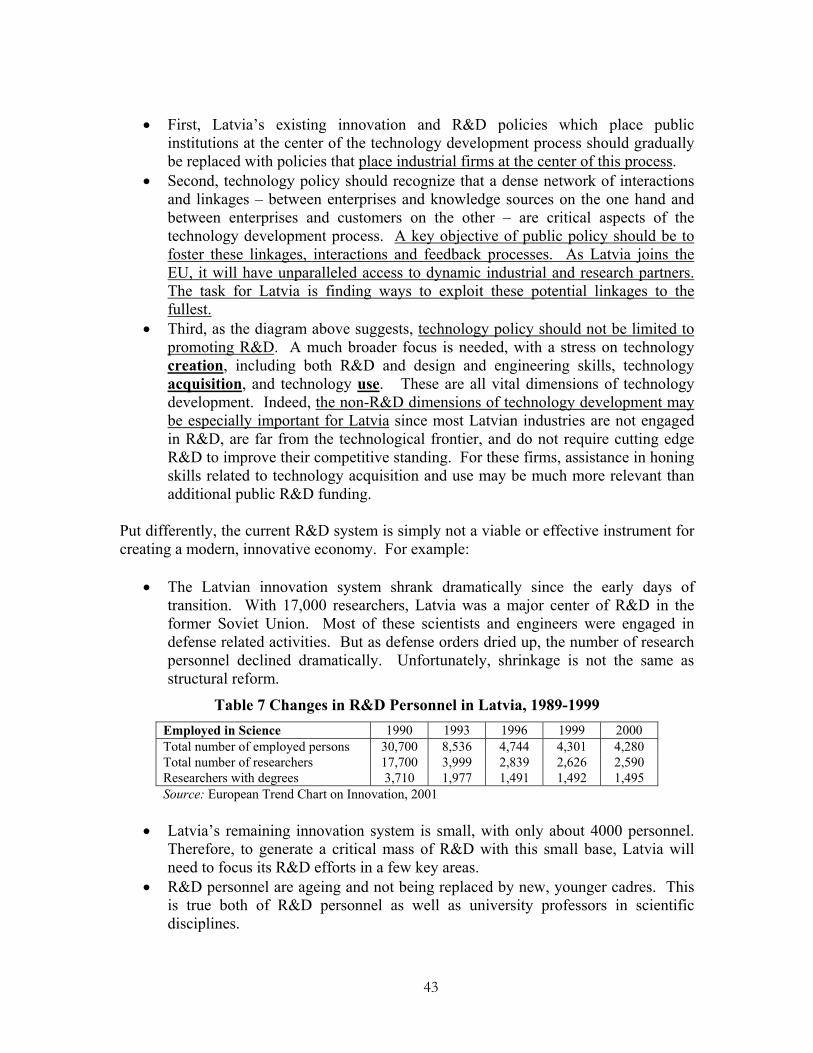
43
• First, Latvia’s existing innovation and R&D policies which place public
institutions at the center of the technology development process should gradually be replaced with policies that place industrial firms at the center of this process.
• Second, technology policy should recognize that a dense network of interactions and linkages – between enterprises and knowledge sources on the one hand and between enterprises and customers on the other – are critical aspects of the technology development process. A key objective of public policy should be to foster these linkages, interactions and feedback processes. As Latvia joins the EU, it will have unparalleled access to dynamic industrial and research partners. The task for Latvia is finding ways to exploit these potential linkages to the fullest.
• Third, as the diagram above suggests, technology policy should not be limited to promoting R&D. A much broader focus is needed, with a stress on technology creation, including both R&D and design and engineering skills, technology acquisition, and technology use. These are all vital dimensions of technology development. Indeed, the non-R&D dimensions of technology development may be especially important for Latvia since most Latvian industries are not engaged in R&D, are far from the technological frontier, and do not require cutting edge R&D to improve their competitive standing. For these firms, assistance in honing skills related to technology acquisition and use may be much more relevant than additional public R&D funding.
Put differently, the current R&D system is simply not a viable or effective instrument for creating a modern, innovative economy. For example:
• The Latvian innovation system shrank dramatically since the early days of transition. With 17,000 researchers, Latvia was a major center of R&D in the former Soviet Union. Most of these scientists and engineers were engaged in defense related activities. But as defense orders dried up, the number of research personnel declined dramatically. Unfortunately, shrinkage is not the same as structural reform.
Table 7 Changes in R&D Personnel in Latvia, 1989-1999 Employed in Science 1990 1993 1996 1999 2000 Total number of employed persons 30,700 8,536 4,744 4,301 4,280 Total number of researchers 17,700 3,999 2,839 2,626 2,590 Researchers with degrees 3,710 1,977 1,491 1,492 1,495 Source: European Trend Chart on Innovation, 2001
• Latvia’s remaining innovation system is small, with only about 4000 personnel.
Therefore, to generate a critical mass of R&D with this small base, Latvia will need to focus its R&D efforts in a few key areas.
• R&D personnel are ageing and not being replaced by new, younger cadres. This is true both of R&D personnel as well as university professors in scientific disciplines.
44
Table 8 Age Distribution of Researchers in Latvia, 2000 Age <35 36-45 46-55 56-65 >65
% 3.1 17.4 32.4 36.5 10.6 Source: Data of the Ministry of Education and Science of Latvia
• As the two charts below indicate, most university students (70%) prefer to study
liberal arts, business and law rather than science and engineering (less than 15%). Therefore, the system is not generating enough new science and engineering students to renew the rapidly ageing existing cadre. Furthermore, Latvia is generating new science and engineering graduates at a rate that is less than half of the rate of the EU as a whole and less than a third of the rate of Ireland and Finland. This is not the least bit surprising. Why study science and engineering if there is no demand in Latvia for these skills?36 Nevertheless, these trends do not bode well for Latvia’s future scientific and innovative potential.
Figure 28 New S&E Graduates in 2000
0,0 5,0 10,0 15,0 20,0 25,0
DenmarkFinlandIreland
EUBulgaria
Czech Rep.Estonia
HungaryLithuania
LatviaPoland
SloveniaTurkey
New S&E graduates (‰ of 20 -29 years age class) in 2000 or theclosest year
Source: Eurostat, Trendchart S&T Indicators, 2003, available at www.trendchart.org
36 Although there may not be demand in Latvia for these skills, Latvians with high quality scientific and
education skills will soon be able to work elsewhere in the EU. In the first instance, this will help Latvians, although it will not necessarily generate any immediate benefits for the Latvian economy. However, over the longer run, this is where emigration and return migration can play a useful role. Latvians can obtain training inside and outside Latvia, work outside Latvia for a while, and return when and if demand arises with skills, knowledge, and contacts which they can use inside Latvia. This process of outmigration and subsequent inmigration has proven to be enormously beneficial for the development of Korea, Taiwan, and India. It is also important to note that Latvian firms do not have to fill their managerial ranks only with Latvian managers. Indeed, in the EU context, Finnish or French managers might be preferable.
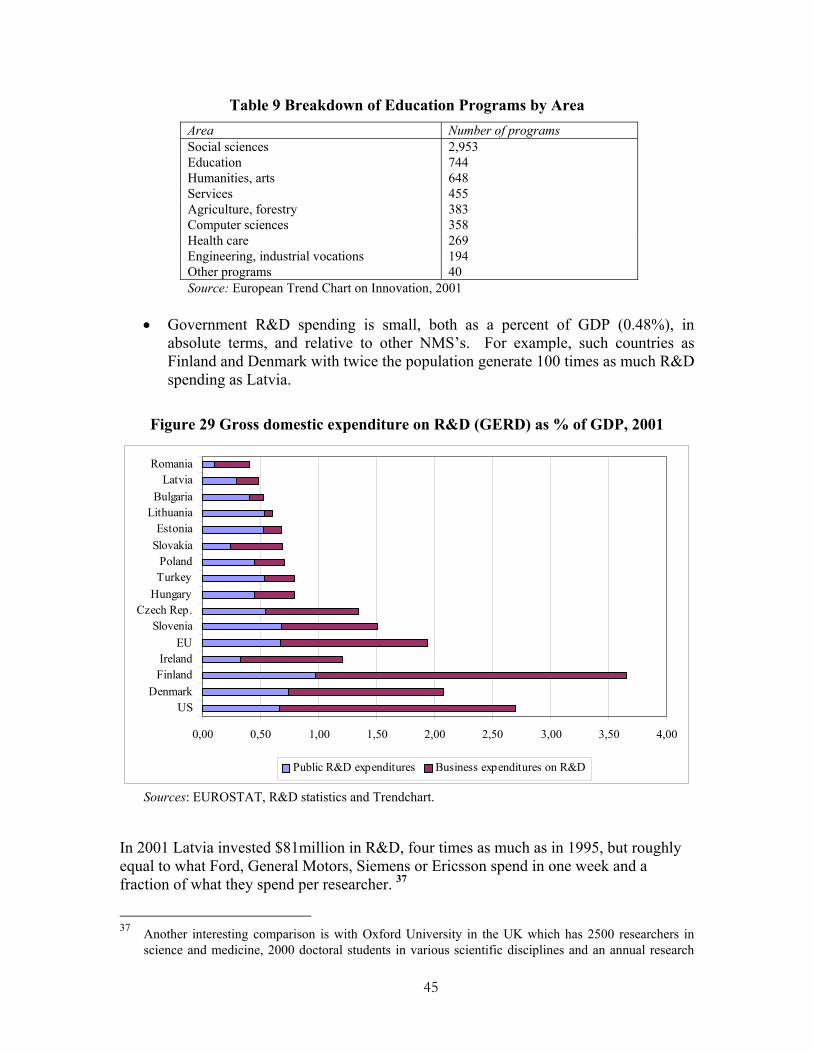
45
Table 9 Breakdown of Education Programs by Area Area Number of programs Social sciences 2,953 Education 744 Humanities, arts 648 Services 455 Agriculture, forestry 383 Computer sciences 358 Health care 269 Engineering, industrial vocations 194 Other programs 40 Source: European Trend Chart on Innovation, 2001
• Government R&D spending is small, both as a percent of GDP (0.48%), in
absolute terms, and relative to other NMS’s. For example, such countries as Finland and Denmark with twice the population generate 100 times as much R&D spending as Latvia.
Figure 29 Gross domestic expenditure on R&D (GERD) as % of GDP, 2001
0,00 0,50 1,00 1,50 2,00 2,50 3,00 3,50 4,00
USDenmark
FinlandIreland
EUSlovenia
Czech Rep.Hungary
TurkeyPoland
SlovakiaEstonia
LithuaniaBulgaria
LatviaRomania
Public R&D expenditures Business expenditures on R&D
Sources: EUROSTAT, R&D statistics and Trendchart. In 2001 Latvia invested $81million in R&D, four times as much as in 1995, but roughly equal to what Ford, General Motors, Siemens or Ericsson spend in one week and a fraction of what they spend per researcher. 37
37 Another interesting comparison is with Oxford University in the UK which has 2500 researchers in
science and medicine, 2000 doctoral students in various scientific disciplines and an annual research
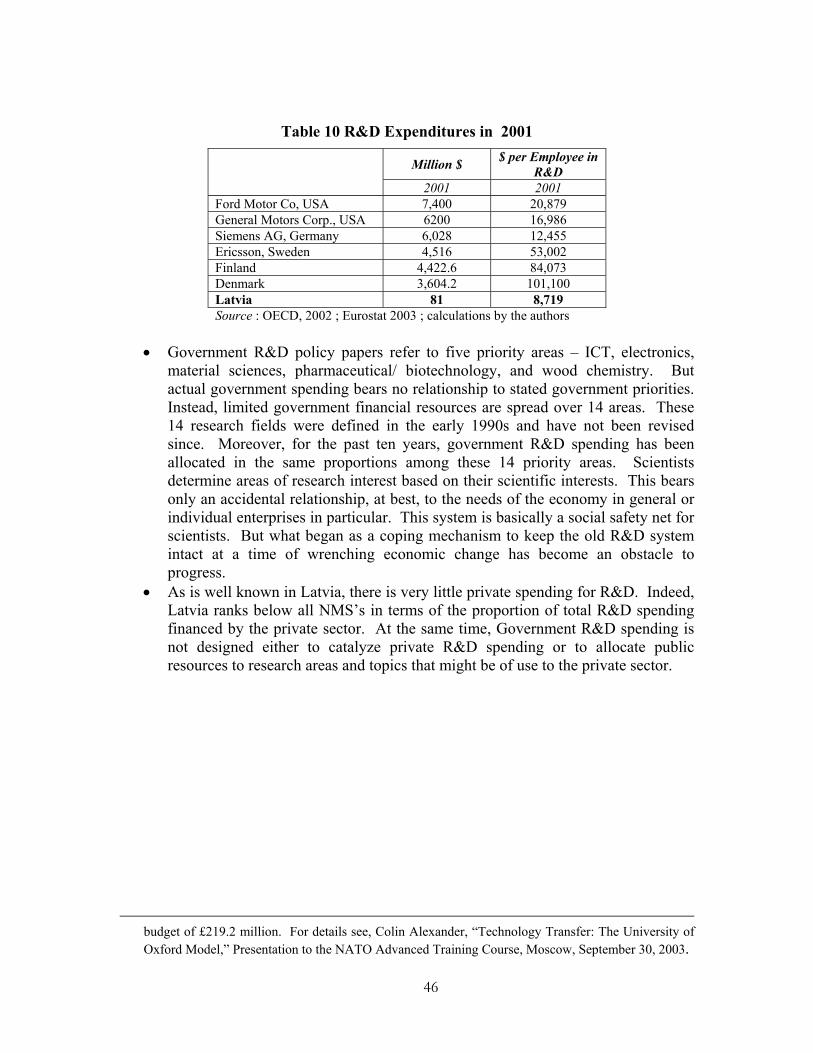
46
Table 10 R&D Expenditures in 2001
Million $ $ per Employee in R&D
2001 2001 Ford Motor Co, USA 7,400 20,879 General Motors Corp., USA 6200 16,986 Siemens AG, Germany 6,028 12,455 Ericsson, Sweden 4,516 53,002 Finland 4,422.6 84,073 Denmark 3,604.2 101,100 Latvia 81 8,719 Source : OECD, 2002 ; Eurostat 2003 ; calculations by the authors
• Government R&D policy papers refer to five priority areas – ICT, electronics,
material sciences, pharmaceutical/ biotechnology, and wood chemistry. But actual government spending bears no relationship to stated government priorities. Instead, limited government financial resources are spread over 14 areas. These 14 research fields were defined in the early 1990s and have not been revised since. Moreover, for the past ten years, government R&D spending has been allocated in the same proportions among these 14 priority areas. Scientists determine areas of research interest based on their scientific interests. This bears only an accidental relationship, at best, to the needs of the economy in general or individual enterprises in particular. This system is basically a social safety net for scientists. But what began as a coping mechanism to keep the old R&D system intact at a time of wrenching economic change has become an obstacle to progress.
• As is well known in Latvia, there is very little private spending for R&D. Indeed, Latvia ranks below all NMS’s in terms of the proportion of total R&D spending financed by the private sector. At the same time, Government R&D spending is not designed either to catalyze private R&D spending or to allocate public resources to research areas and topics that might be of use to the private sector.
budget of £219.2 million. For details see, Colin Alexander, “Technology Transfer: The University of Oxford Model,” Presentation to the NATO Advanced Training Course, Moscow, September 30, 2003.
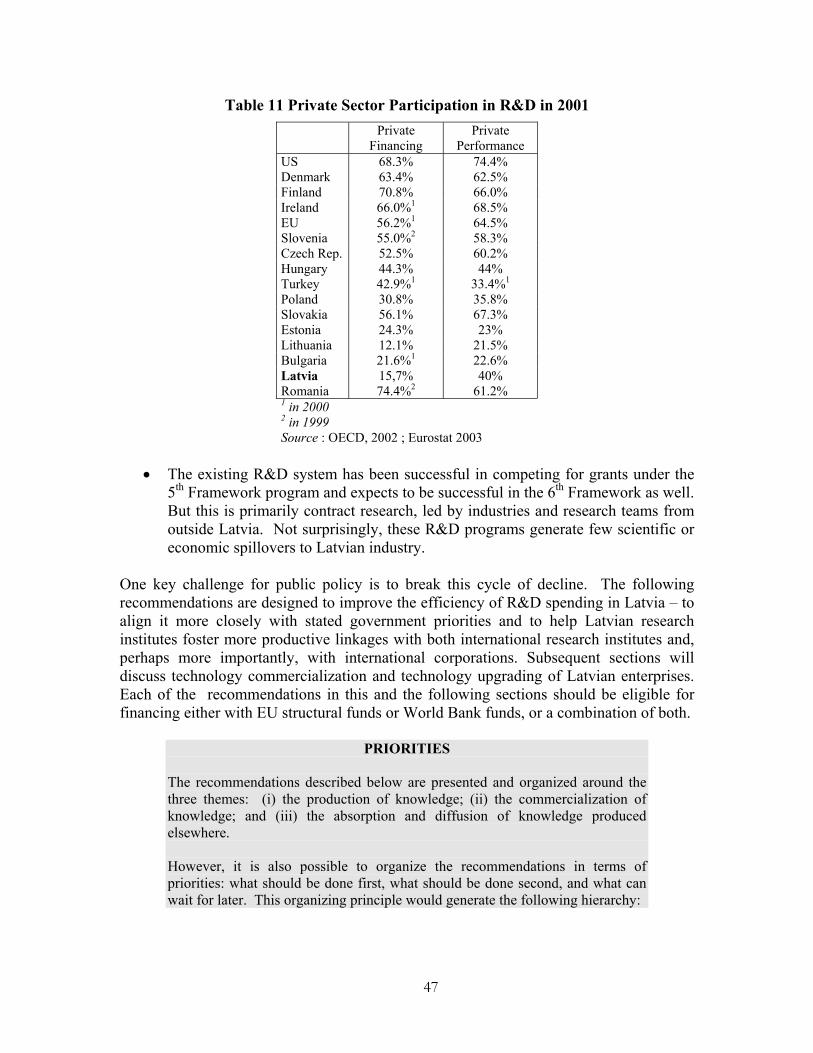
47
Table 11 Private Sector Participation in R&D in 2001 Private
Financing Private
Performance US 68.3% 74.4% Denmark 63.4% 62.5% Finland 70.8% 66.0% Ireland 66.0%1 68.5% EU 56.2%1 64.5% Slovenia 55.0%2 58.3% Czech Rep. 52.5% 60.2% Hungary 44.3% 44% Turkey 42.9%1 33.4%1 Poland 30.8% 35.8% Slovakia 56.1% 67.3% Estonia 24.3% 23% Lithuania 12.1% 21.5% Bulgaria 21.6%1 22.6% Latvia 15,7% 40% Romania 74.4%2 61.2% 1 in 2000 2 in 1999 Source : OECD, 2002 ; Eurostat 2003
• The existing R&D system has been successful in competing for grants under the
5th Framework program and expects to be successful in the 6th Framework as well. But this is primarily contract research, led by industries and research teams from outside Latvia. Not surprisingly, these R&D programs generate few scientific or economic spillovers to Latvian industry.
One key challenge for public policy is to break this cycle of decline. The following recommendations are designed to improve the efficiency of R&D spending in Latvia – to align it more closely with stated government priorities and to help Latvian research institutes foster more productive linkages with both international research institutes and, perhaps more importantly, with international corporations. Subsequent sections will discuss technology commercialization and technology upgrading of Latvian enterprises. Each of the recommendations in this and the following sections should be eligible for financing either with EU structural funds or World Bank funds, or a combination of both.
PRIORITIES
The recommendations described below are presented and organized around the three themes: (i) the production of knowledge; (ii) the commercialization of knowledge; and (iii) the absorption and diffusion of knowledge produced elsewhere. However, it is also possible to organize the recommendations in terms of priorities: what should be done first, what should be done second, and what can wait for later. This organizing principle would generate the following hierarchy:
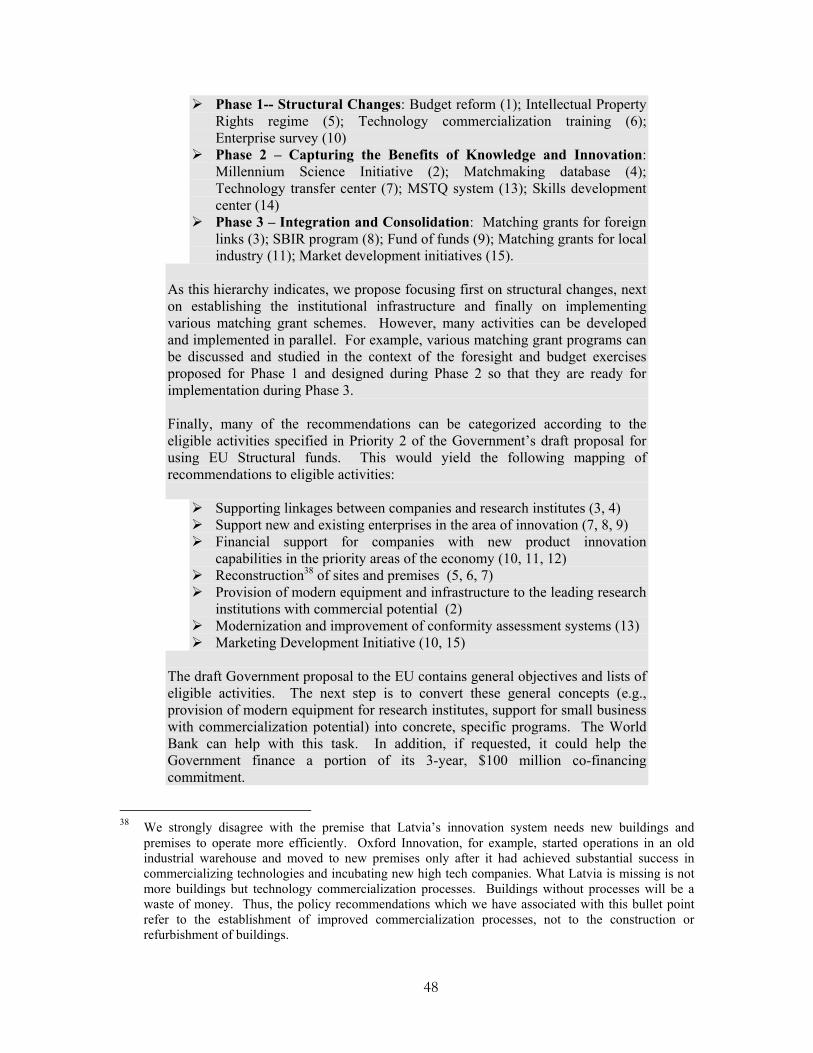
48
Phase 1-- Structural Changes: Budget reform (1); Intellectual Property Rights regime (5); Technology commercialization training (6); Enterprise survey (10) Phase 2 – Capturing the Benefits of Knowledge and Innovation:
Millennium Science Initiative (2); Matchmaking database (4); Technology transfer center (7); MSTQ system (13); Skills development center (14) Phase 3 – Integration and Consolidation: Matching grants for foreign
links (3); SBIR program (8); Fund of funds (9); Matching grants for local industry (11); Market development initiatives (15).
As this hierarchy indicates, we propose focusing first on structural changes, next on establishing the institutional infrastructure and finally on implementing various matching grant schemes. However, many activities can be developed and implemented in parallel. For example, various matching grant programs can be discussed and studied in the context of the foresight and budget exercises proposed for Phase 1 and designed during Phase 2 so that they are ready for implementation during Phase 3. Finally, many of the recommendations can be categorized according to the eligible activities specified in Priority 2 of the Government’s draft proposal for using EU Structural funds. This would yield the following mapping of recommendations to eligible activities:
Supporting linkages between companies and research institutes (3, 4) Support new and existing enterprises in the area of innovation (7, 8, 9) Financial support for companies with new product innovation
capabilities in the priority areas of the economy (10, 11, 12) Reconstruction38 of sites and premises (5, 6, 7) Provision of modern equipment and infrastructure to the leading research
institutions with commercial potential (2) Modernization and improvement of conformity assessment systems (13) Marketing Development Initiative (10, 15)
The draft Government proposal to the EU contains general objectives and lists of eligible activities. The next step is to convert these general concepts (e.g., provision of modern equipment for research institutes, support for small business with commercialization potential) into concrete, specific programs. The World Bank can help with this task. In addition, if requested, it could help the Government finance a portion of its 3-year, $100 million co-financing commitment.
38 We strongly disagree with the premise that Latvia’s innovation system needs new buildings and
premises to operate more efficiently. Oxford Innovation, for example, started operations in an old industrial warehouse and moved to new premises only after it had achieved substantial success in commercializing technologies and incubating new high tech companies. What Latvia is missing is not more buildings but technology commercialization processes. Buildings without processes will be a waste of money. Thus, the policy recommendations which we have associated with this bullet point refer to the establishment of improved commercialization processes, not to the construction or refurbishment of buildings.
49
RECOMMENDATION 1. Conduct a comprehensive review of Government R&D spending. The objectives of this review would be to (i) align Government spending with the priorities established in Government-approved concept notes and policy papers; (ii) allocate government budget resources within these priorities on the basis of competitive grant programs; (iii) utilize scarce government resources to attract foreign and local private sector R&D resources; (iv) concentrate spending on a few key centers of excellence;39 and (v) where appropriate, align Government spending with other public and private R&D resources (from the EU, NATO, and elsewhere) available in Latvia. As discussed in the previous section, Government R&D spending is currently scattered over a wide range of research areas without clear priorities and objectives. Thus, as part of a comprehensive budget review, representatives from the Government, Parliament, scientific research community, universities, and the business community should discuss and agree a mission statement that identifies limited, mutually consistent, and specific goals and priorities for Government R&D spending. For example, is the goal to preserve existing scientific research institutions irrespective of the quality of their research? To support basic research and prestige science? To develop a limited number of “centers of excellence” that will focus on critical research priorities? To support the emergence of new high tech/science intensive SMEs? To help the private sector commercialize innovations funded with budget resources? To help existing old economy enterprises restructure, modernize their plant and equipment and, in light of Latvia’s approaching membership in the EU, become more globally competitive? Something else? Once new goals and priorities have been agreed, it is likely that existing R&D expenditure patterns will have little or no correlation with these new goals and priorities. Therefore, as part of the spending review, the Government and Parliament should also examine current R&D spending priorities on a line item by line item basis to see what goal or objective, if any, each item serves. Items that do not promote the new priority goals and objectives should be phased out rapidly. New items should be funded only if they serve one of the agreed priority objectives. Finally, in addition to reviewing the goals and objectives of Government spending, the spending review should also consider the issue of revising spending modalities. For example, only a small fraction of total Government R&D spending is allocated on a competitive basis, with clear transparent rules of the game, peer review of applications, and a clear, definable link between goals, priorities and spending. To address this issue, the spending review should establish a clear timetable for increasing the portion of the overall R&D budget that is allocated on a competitive basis. This, in turn, will require the development of clear, transparent peer review procedures, utilizing both national and international experts.
39 Proposals to concentrate spending in selected centers of excellence will be discussed in greater detail
in Recommendation 3, below.
50
Many of the following recommendations will discuss competitive grant mechanisms that have been utilized in a variety of countries to fulfill a wide range of diverse goals and objectives.40 These programs should be evaluated on two criteria. The first is whether the objectives of these foreign programs are in line with the objectives that Latvia set for itself in its budget review deliberations. The second is whether the spending mechanism which these countries adopted are consistent with the mechanisms that Latvia wishes to implement. RECOMMENDATION 2. Develop a Millennium Science Initiative (MSI) project to channel incremental Government R&D resources into a few Latvian centers of excellence. The goal should be to provide substantial incremental funding for R&D, provided that these incremental resources are to high priority areas selected on the basis of scientific merit and for research projects within these centers selected on a competitive basis by a combined panel of Latvian and international experts. An MSI project can be designed in a variety of ways to meet the specific needs and conditions of Latvia. The following is a brief description of recent World Bank MSI projects designed to show the flexibility of the MSI structure. To get the process started, a group of eminent international and Latvian scientists would meet in Latvia to discuss priorities. Typically, these include areas where the country has a (current or prospective) comparative advantage and areas that can contribute to the country’s long term economic development. Resources support long term research in agreed areas. The objective is to give scientists sufficient funding for a sufficiently long period (five years for example) so that they can embark on a long term research project. Funds are also available for the purchase of equipment and to support graduate and post graduate students. This, in turn, helps to attract bright students to these fields. 40 The Government of Russia has developed two highly regarded competitive grant programs that may also be worth reviewing. These are the Fund for Assistance to Small Innovative Enterprises (details are available at www.fasie.ru ) and the Russian Foundation for Basic Research (details available at www.rfbr.r ). For example, the Russian Foundation for Basic Research sets basic research priorities corresponding to the government’s priority research agenda, has an open tender for proposals to define and implement specific research projects designed to further the priority research agenda, and funds only those projects that have been approved by a rigorous peer review panel of national and international experts. Institutes within the Russian Academy of Sciences are eligible to compete for funds, alongside other private and public research institutions, universities, and private enterprises. The key point is that funding is allocated on the basis of competitive merit, rather than to selected institutions on an entitlement basis (e.g., where funds are allocated to every research institution that meets certain eligibility criteria such as membership in the Russian Academy of Sciences, irrespective of the quality, priority, and utility of their research). In addition to these Russian programs, the Government of Mexico established the Fondos Sectoriales program whereby participating ministries define a set of priorities which need to be researched and then request proposals to conduct this research. The fondos that are currently operating are environment, agriculture and rural, marine, social development, housing, forestry, health, education, energy, communications, government and airports. In addition, research for pure science is now supported by a fund explicitly dedicated to that task. Details of the Fondos Sectoriales program, in Spanish only, are available at http://www.conacyt.mx/fondos/f_sectoriales.html .
51
MSI projects typically provide two types of grants:
• Promising groups (“nuclei”), often composed of younger investigators, are awarded 3-5 year grants at an annual level of $250,000 - 500,000
• International level groups (“institutes”) receive 5-7 year funding at an annual level of $1-2 million
It should be emphasized that these levels are broad guidelines. The structure and investment levels for each MSI project are determined on the basis of that particular country’s circumstances. To date, four Latin American countries – Chile, Mexico, Venezuela, and Brazil -- have initiated MSI projects.
• Chile: The project was funded with a $5 million World Bank loan and $10 million from the Government. The project will funded 3 institutes (at $1 million per year for five years) and 10 nuclei (at $300,000 per year for three years). The Government agreed to finance the project costs for the remaining years with its own resources.
• Venezuela: The project was supported by a $15 million World Bank loan, of which $1.5 million went to the Ministry of Science for various institutional strengthening activities and $13.5 million was devoted to competitive grants. The project will support three institutes (for five years each at $1 million/year) and 8-12 Nuclei (for three years at $300,000 per year). The Venezuelan Government designated priority areas for research support. Therefore, the competition will not be open to all research areas and disciplines.
• Mexico: Four Institutes were selected to receive a total of $50 million of support over five years.
• Brazil: $50 million was set aside from an existing S&T loan to fund MSI activities that would support 25 high priority projects.
If GOL is interested, the Bank could provide the Government with more detailed written information about the MSI program and the four MSI projects discussed briefly above. In addition, the Bank could organize a meeting between Latvian officials and Bank officials who manage the MSI program. The objectives of the meeting would be to (i) answer the Government’s detailed questions about the MSI program; and (ii) initiate a discussion of such detailed design issues as eligibility criteria, review procedures, project administration, etc. RECOMMENDATION 3. Develop matching grant programs to help Latvian research institutes and private enterprises develop contract research arrangements and technology commercialization partnerships with foreign companies. If modified for use in Latvia, these grant programs can be modeled after similar programs that have worked successfully in other countries. Under the terms of these programs, the foreign participant would generally be expected to fund all of its own expenses. Grant proceeds would be used to defray the costs of the Latvian institution’s participation in the joint
52
work program. In designing these programs, special care will be needed to develop clear, transparent eligibility criteria and systems to ensure accountability for the use of funds. In addition, an expert panel, composed of impartial Latvian and foreign experts, should be established to review and approve grant applications. The existing programs that will be cited below have already devised publicly available guidelines, eligibility criteria, application procedures, review procedures, audit procedures, standardized legal documents, and IPR protection procedures. These can be reviewed an modified for use in Latvia. As the FIAS report notes, Latvian firms with foreign customers or some sort of foreign partnership are more likely to innovate and invest than firms without these links. Having a demanding customer or strategic partner is an important asset – it can be a source of finance, a window to the world of cutting edge technology, a source of product certification, a link to global markets and global market intelligence, and a potential source of investment. Consequently, financing a portion of the initial cost of establishing these links may be an important public policy objective that can help to achieve Latvia’s goals of technology commercialization, technology acquisition, and export diversification. Unfortunately, many of Latvia’s research institutes, universities and even some high tech enterprises have been operating largely in a “commercial vacuum.” They need help in establishing partnerships and obtaining contracts for outsourced corporate R&D and new product development. International experience suggests that as trust is built up, successful delivery of outsourced R&D not only produces immediate income but can also lead to stronger relationships such as joint-ventures, spin-off companies, the establishment of local R&D centers, engineering centers or production facilities. Consequently, as a first step Latvian officials should view contract research with foreign private firms as part of a long process that could eventually lead to deeper and more rewarding partnerships. Unfortunately, Latvia is not yet “on the map” as a desirable location for many companies looking for sources of contract research. Nor do they think of Latvia as a potential source of commercially viable technologies. Latvia needs to improve its image in this respect. These matching grant programs, therefore, should be seen as an investment in marketing Latvian technological capabilities to the world and helping foreign firms answer the question, “why should I conduct research in Latvia.” These grant programs might also
53
help to attract Latvian scientists living abroad to return and begin doing business in Latvia.41 Several grant programs are worth investigating in more detail. They include:
• The Civilian Research and Defense Foundation’s (CRDF) First Steps to Market Program. 42 This grant program funds R&D projects that promote the initial development of working relationships between a foreign partner and eligible FSU research institutes. The maximum duration of the grant is one year; the maximum grant size is $60,000.
• The CRDF Next Steps to Market Program. This grant program funds advanced R&D projects with a maximum duration of two years. These grants require a cost share from the foreign company to ensure that the company is committed to the project and to establishing a long-term partnership with the FSU researchers involved. For projects up to $150,000, the foreign company’s cash contribution must be at least 20 percent of the total FSU budget. For projects exceeding $150,000, the U.S. Company’s cash contribution must be at least 20 percent of the first $150,000 of the total FSU budget plus 50 percent of the amount over $150,000.
• The CRDF Travel Grants Program (TGP) provides short-term travel support to individual scientists, engineers, and managers for travel to the United States to meet with U.S. for-profit companies with the intent of developing collaborative projects and new business opportunities. The grant pays for airfare, lodging expenses, per diem, and medical insurance. Travel must be to visit U.S. for-profit companies or U.S. commercially-oriented scientific meetings, in which U.S. for-profit companies are identified for discussion. The maximum award is $3,600. This amount includes airfare.
• The US Department of Energy’s Initiative for Proliferation Prevention Program (IPP).43 This program promotes joint R&D projects as well as commercial
41 The implicit assumption behind this recommendation is that local research institutes are ready for
contract research and collaboration with foreign researchers. The results of the Vth Framework Programme give some reason for optimism in this regard. But this hypothesis requires a more definitive test. This can only be achieved by establishing grant programs to encourage collaboration and contract research and to then seeing what happens. If collaboration and contract research relationships are not established, it will be clear that Latvian research institutes are not interesting partners for foreign firms and institutes. But if that is the case, few if any grants will have been issued and the program will not cost the government any money. Seen from this vantage point, establishing grant programs is a relatively inexpensive way to test the market’s interest in Latvian R&D capacity.
42 Additional materials about the First Steps to Market Program and Next Steps to Market Program
including detailed eligibility requirements and application forms are available at the Industry Programs portion of the CRDF web site – www.crdf.org . CRDF programs are explicitly designed to help researchers in Russia, Ukraine, Kazakhstan, Armenia, Azerbaijan, Georgia, Kyrgyzstan, Moldova, Tajikistan and Turkmenistan establish partnerships with US companies. Unfortunately, CRDF programs do not operate in Latvia.
43 Information about the IPP program, including copies of all relevant program documents, can be found
at http://www.usic.net/usic/test1.nsf/Links/The+Program .
54
technology development projects involving industry partners from the U.S. The joint R&D program is designed to demonstrate the feasibility of an NIS technology, thereby establishing working contacts and evaluating the scientific and engineering capabilities of the NIS Institute. Commercial technology development projects are designed to market a product, process or service based on an NIS Institute technology.
• The Israel-US Binational Research and Development Foundation (BIRD) was established and is supported by both government.44 The Foundation provides both matchmaking services between U.S. and Israeli companies, as well as funding covering up to 50 percent of project development and product commercialization costs. Any pair of companies, one Israeli and one U.S.-based, may apply jointly so long as they can demonstrate the combined capabilities and infrastructure to define, develop, manufacture, sell and support an innovative product based on industrial R&D. The companies may be simply cooperating on an ad hoc basis, linked through a corporate joint venture, or commonly owned (in whole or in part). The actual method by which the support is provided is quite straightforward - BIRD cost-shares 50:50 with each Israeli-U.S. partner. Grants from the Foundation are repaid via royalties from sales of the new product or technology supported by the Foundation.
RECOMMENDATION 4. Facilitate matchmaking services with foreign laboratories and enterprises: Latvia should establish one centralized network where potential foreign partners can go to find R&D capabilities and industrial partners. In India, for example, the Council of Scientific & Industrial Research, (CSIR or Brain Bank) links 40 government research institutes and provides a comprehensive directory listing scientists by area of expertise.45 In addition to maintaining a centralized database, the database managers should make a proactive effort to bring these research capabilities to the attention of venture capital firms in the US, Europe and elsewhere. The purpose of this outreach effort would not be to encourage venture capital firms to invest in Latvia, although that may be a secondary benefit. Instead the objective would be to encourage their portfolio firms to consider Latvia as a potential source of low cost, high quality contract research expertise that can help solve critical technical problems.46 Latvia should strive to become a source for this contract research. Some of the matching grant programs mentioned in Recommendation 3 above can be used to initiate this process.
44 Information about the BIRD Foundation can be found at www.birdf.com . Similar binational programs
exist between Israel and the UK, South Korea, Canada and Singapore. Website addresses for each of these binational programs can be found on the website of the Office of the Chief Scientist at http://www.moit.gov.il/tamas_level2_English.asp?sid=1434 .
45 Additional information about CSIR can be found at www.csir.res.in . Another interesting model worth
considering is the United Nations sponsored Asia and Pacific Centre for Technology Transfer (http://www.apctt.org/).
46 Contract research arrangements can graduate over time to joint ventures. These joint ventures between
small, high tech start-ups and Latvian research partners may become interesting candidates for venture capital financing.
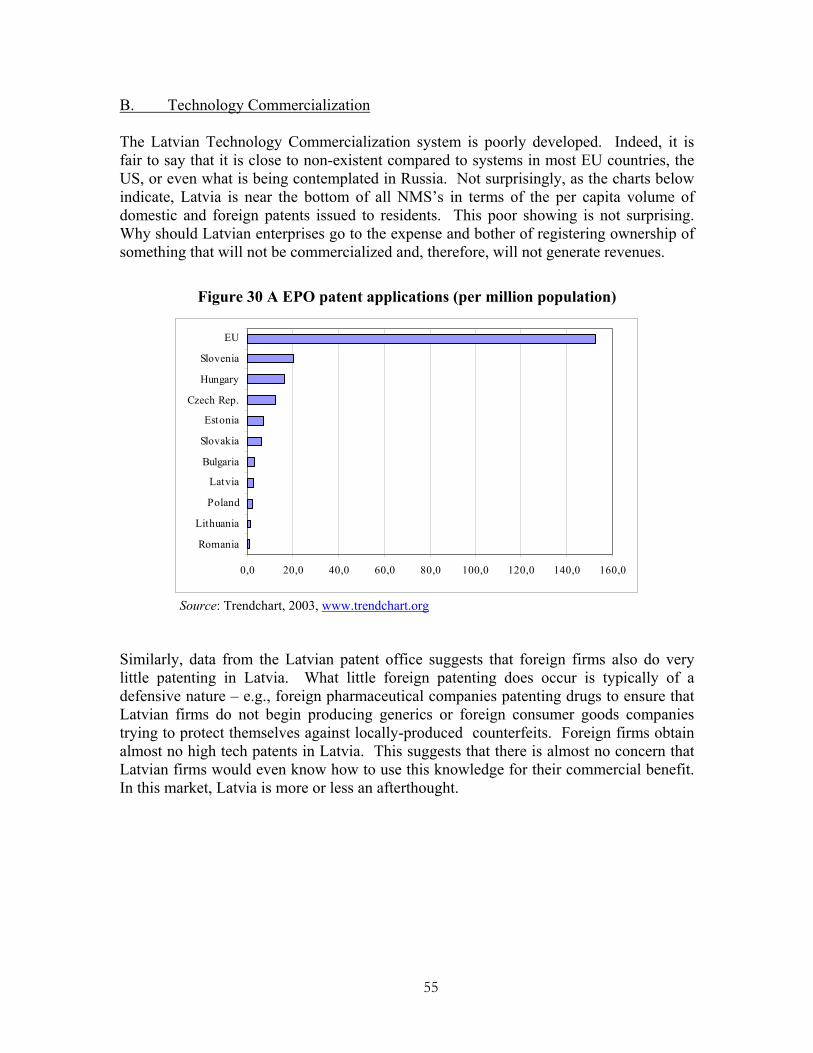
55
B. Technology Commercialization The Latvian Technology Commercialization system is poorly developed. Indeed, it is fair to say that it is close to non-existent compared to systems in most EU countries, the US, or even what is being contemplated in Russia. Not surprisingly, as the charts below indicate, Latvia is near the bottom of all NMS’s in terms of the per capita volume of domestic and foreign patents issued to residents. This poor showing is not surprising. Why should Latvian enterprises go to the expense and bother of registering ownership of something that will not be commercialized and, therefore, will not generate revenues.
Figure 30 A EPO patent applications (per million population)
0,0 20,0 40,0 60,0 80,0 100,0 120,0 140,0 160,0
Romania
Lithuania
Poland
Latvia
Bulgaria
Slovakia
Estonia
Czech Rep.
Hungary
Slovenia
EU
Source: Trendchart, 2003, www.trendchart.org
Similarly, data from the Latvian patent office suggests that foreign firms also do very little patenting in Latvia. What little foreign patenting does occur is typically of a defensive nature – e.g., foreign pharmaceutical companies patenting drugs to ensure that Latvian firms do not begin producing generics or foreign consumer goods companies trying to protect themselves against locally-produced counterfeits. Foreign firms obtain almost no high tech patents in Latvia. This suggests that there is almost no concern that Latvian firms would even know how to use this knowledge for their commercial benefit. In this market, Latvia is more or less an afterthought.
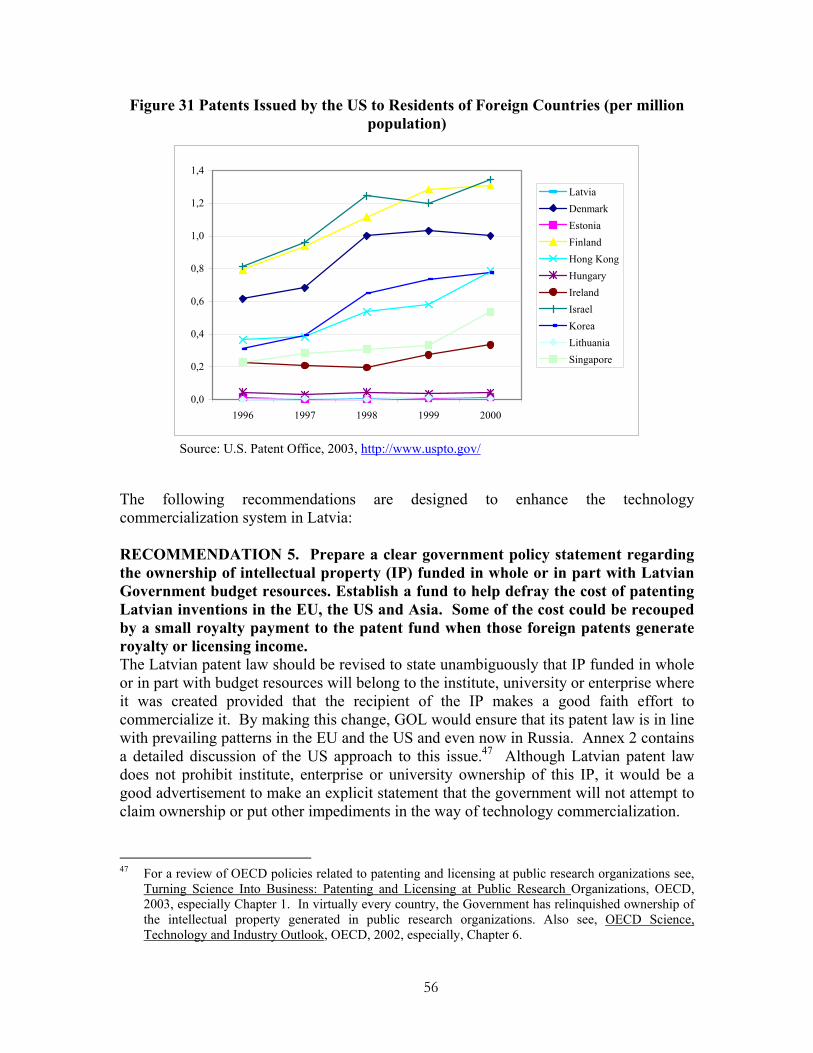
56
Figure 31 Patents Issued by the US to Residents of Foreign Countries (per million population)
0,0
0,2
0,4
0,6
0,8
1,0
1,2
1,4
1996 1997 1998 1999 2000
LatviaDenmarkEstoniaFinlandHong KongHungaryIrelandIsraelKoreaLithuaniaSingapore
Source: U.S. Patent Office, 2003, http://www.uspto.gov/
The following recommendations are designed to enhance the technology commercialization system in Latvia: RECOMMENDATION 5. Prepare a clear government policy statement regarding the ownership of intellectual property (IP) funded in whole or in part with Latvian Government budget resources. Establish a fund to help defray the cost of patenting Latvian inventions in the EU, the US and Asia. Some of the cost could be recouped by a small royalty payment to the patent fund when those foreign patents generate royalty or licensing income. The Latvian patent law should be revised to state unambiguously that IP funded in whole or in part with budget resources will belong to the institute, university or enterprise where it was created provided that the recipient of the IP makes a good faith effort to commercialize it. By making this change, GOL would ensure that its patent law is in line with prevailing patterns in the EU and the US and even now in Russia. Annex 2 contains a detailed discussion of the US approach to this issue.47 Although Latvian patent law does not prohibit institute, enterprise or university ownership of this IP, it would be a good advertisement to make an explicit statement that the government will not attempt to claim ownership or put other impediments in the way of technology commercialization.
47 For a review of OECD policies related to patenting and licensing at public research organizations see,
Turning Science Into Business: Patenting and Licensing at Public Research Organizations, OECD, 2003, especially Chapter 1. In virtually every country, the Government has relinquished ownership of the intellectual property generated in public research organizations. Also see, OECD Science, Technology and Industry Outlook, OECD, 2002, especially, Chapter 6.
57
Murky ownership status hampers technology commercialization, deters foreign investment and, in fact, could potentially leave Latvia’s IP resources open to unauthorized duplication in the West and elsewhere. Moreover, matching grant programs, SBIR, or other programs designed to bridge the innovation gap and catalyze private research funding cannot succeed as long as the ownership of the IP generated by these collaborative arrangements remains in doubt. Thus, clarifying IP ownership is not only essential to improve the quality of government R&D spending. It is also essential to facilitate more productive linkages between SMEs and larger domestic and foreign enterprises, attract venture capital, commercialize Latvia’s existing stock and new flow of innovations, and generally facilitate Latvia’s transition to a more productive position in the global knowledge economy. The OECD experience suggests that transferring ownership of government-funded IP to the research institute or university where the innovation was created is the most effective way to eliminate these ambiguities and uncertainties and generate successful government-industry R&D collaboration and IP commercialization programs. Four critical factors determine the success of these OECD collaboration and commercialization programs. The first is the replacement of uncertainty with clarity in terms of actual ownership. The second is the establishment of clear commercialization rules of the game – e.g., who is responsible for commercialization? How are the financial returns of technology commercialization divided between the inventor, the organization bearing the financial risk of commercialization, the owner of the IP, and the Government, if it is not the owner? The third is the establishment of effective organizational arrangements to manage and implement the commercialization process, starting with the filing of domestic and international patent applications and ending with the collection and distribution of royalties generated by successfully commercialized innovations. And the fourth and final is the development of clear mechanisms to promote the growth of new, science intensive SMEs and to ensure that innovations are used to improve the global competitiveness of domestic enterprises in general. For example, the US Government operates a large number of government funded defense and civilian research programs, maintains a large number of government owned laboratories and federal research facilities, and is generally recognized to have one of the most successful IP commercialization programs in terms of clarifying ownership, converting inventions into products and industrial processes, and developing new, dynamic SMEs. These programs rest on two critical pillars. The first is the recognition that the Government was not and could never be an effective owner of IP. Therefore, the US Government transferred ownership of government funded IP to the university or institute where it was created. The second pillar was the development of rules and regulations specifying the university or research institute’s rights and responsibilities for commercializing the government-funded IP and the establishment of institutions dedicated to technology commercialization at institutes and universities. RECOMMENDATION 6. Organize a technology commercialization training program to raise consciousness and increase know-how. A detailed understanding of technology commercialization processes, procedures, and practices seems to be in short
58
supply in Latvian enterprises, universities, and research institutes. However, over the past few years, numerous technology commercialization training programs have been organized in various transition countries. Annex 3 contains the course outline for one such program organized by the US Department of Energy for scientists in the Nizhny Novgorod region of Russia. These courses typically cover such issues as (i) protection of intellectual property rights; (ii) issues to consider in looking for strategic partners or venture capital investments; (iii) what strategic partners and venture investors want to see when they evaluate potential deals; (iv) case studies illustrating important lessons of experience – e.g., the so-called do’s and dont’s of technology commercialization; and (v) recent trends in global technology markets. Latvian officials should invite training organizations and EU or US government agencies to organize similar training programs in Latvia. In addition to the course discussed above, Latvia might also benefit from the recent NATO training course on Technology Management and Intellectual Property Rights.48 That course, which was designed for Russian participants, discussed the French, German, Japanese, US and UK technology commercialization models. It also discussed a variety of royalty sharing and intellectual property right issues that must be addressed in the context of establishing technology commercialization systems. Furthermore, if Latvian officials would be interested and if funding could be arranged, a series of seminars and guest lectures could be organized in Latvia to discuss such topics as (i) the experience of establishing the Austin Technology Incubator (or successful incubators in other countries such as Oxford Innovation in the UK or Sophie Antipolis in France); (ii) the role and functions of the US-based Association of University Technology Managers (AUTM) and the way in which university-based technology transfer offices commercialize innovations created in US universities; (iii) a first-hand account of the challenges facing Russian scientists who wanted to commercialize their innovations and present them at technology trade flows in the US, Europe, and Asia; and (iv) a description of the work required to set up a technology commercialization system at the Russian Academy of Science Institute of Physical Chemistry in Chernogolovka. RECOMMENDATION 7. Establish at least one Technology Transfer Center (TTC) in Latvia. Experience from countries as diverse as US, Israel, and Finland indicates that new financial instruments are worthless unless they are complemented by a supportive commercialization infrastructure, one that can generate the deal flow demanded by investors and which would be energized and motivated to succeed by a proper set of incentives.49 To be successful and effective, this commercialization infrastructure must provide a wide range of complementary commercialization services. In addition, the critical elements 48 The training course program along with the text of various presentations is available at
www.ipr.inage.ru/nato . 49 This recommendation is predicated on the assumption that Latvian research institutes have a pipeline
of commercially viable inventions and innovations that that could be commercialized if the proper incentives and commercialization systems were in place. It is important to emphasize that this is an unverified hypothesis. Indeed, the purpose of establishing a TTC is test the validity of this hypothesis.
59
should work as a unified whole, not as isolated, independent institutions. Unfortunately, Latvia has not yet developed an efficient, effective commercialization system. If we think of the technology commercialization process as a large pipeline with basic research as a critical input at one end of the pipeline and new products, businesses, joint ventures and collaborative partnerships at the other end of the pipeline, then several critical segments are missing from the Latvian pipeline and others are operating poorly and inefficiently. A TTC should provide the following services:
(i) conduct technology audits to identify what locally available technologies, scientific developments and innovations developed in local universities and research institutes have the greatest prospect for commercial success (See Annex 4 for a brief description of technology audits and a technology audit questionnaire that was utilized recently to identify potentially commercially viable technologies developed by the Institute of Physical Chemistry in Chernogolovka, near Moscow.);
(ii) operate a technology transfer office that would perform the following range of functions on behalf of the local scientists, institutes and educational institutions: apply for domestic and foreign patents, pay the necessary patent application and annual patent maintenance fees, license the patented IP, enforce ownership rights against alleged infringement, collect royalties from license holders, and distribute royalties according to a pre-determined formula between the TCA/TTO (to cover administrative expenses), the institute our university where the IP was invented, and the inventor(s) (See Annex 5 for a more detailed discussion of TTOs and Annex 6 for the rules and regulations governing the Texas A&M TTO);
(iii) establish incubators that would operate like those in Israel. The purpose of these incubators would be to nurture new, high tech companies during the first year or two of their existence so that they can attract venture capital support and succeed on their own. (See Annex 7 for a brief discussion of incubators);
(iv) develop a commercialization strategy – licensing, joint venture, strategic partnership, etc. -- for each of the firms in the incubator and help to connect these local high tech entrepreneurs and scientists with potential customers, strategic partners, joint venture partners and venture capitalists; and
(v) market the identified technologies at international fairs, help make presentations to venture capitalists, help to establish linkages between local research institutes and private companies/international research institutes operating in similar fields, etc.
To support this initiative, the Government could finance a portion of the TTC’s initial start up and operating costs. The TTC would operate on the basis of the following principles:
60
• The TTC would strive to provide the establish the full support chain for the establishment of new, technology based firms (NTBF’s) and the commercialization of technology. In other words, and following up on the initial pipeline analogy, a pipeline is useless if even small pieces are missing. Everything must be in place if anything is to function. This is as true for pipelines as for support programs for TTC’s.
• The TTC should be a privately managed public-private partnership.50 The private managers should have extensive international experience in technology commercialization and incubation. Key stakeholders in each TTA would be the Latvian Government, participating universities or research institutes, foreign or domestic enterprises that may have a demand for locally produced technology, and private financial organizations.
• Ideally, the TTCs should be self supporting after 3-5 years. As in Israel and other western incubator/technology commercialization models, the incubator or TTC would receive success fees and minority equity stakes in deals and enterprises brokered or supported by the TTC. However, public funding in the range of $7 million to $10 million would be required for the initial years of operation. This public support would be provided on a declining basis and would finance the following activities: (i) a portion of the initial start up costs and first few years of operating costs – primarily expert personnel and TA; (ii) a portion of the cost of conducting expert technology audits at the selected institutes and universities. The purpose of these audits would be to ascertain what technologies and innovations, if any, have potential commercial application; (iii) a portion of the cost of applying for and maintaining foreign patents. Not every innovation identified by the audit will be eligible for patent protection or worth the cost of patent protection. Therefore, the Government should establish some sort of transparent, competitive, expert evaluation system for selecting which innovations would be eligible to receive foreign patent protection grants: (iv) training local personnel in the legal, financial and technical aspects of establishing and operating a TTO. Training could include such topics as case studies on how TTOs operate in different countries, the mechanics of conducting a technology audit, how to market innovations and search for licensees, different strategies for managing IP, and different strategies for linking the TTO to the institute’s overarching research and innovation mission.
• The TTC would engage in the following activities: (i) during each year of operation, conduct a technology audit to identify the most promising commercial opportunities available in the target research and educational institutions; (ii)
50 Some countries and universities have outsourced these activities to specialized private firms established
exclusively for this purpose. For examples of two such firms see the web site of the British Technology Group at www.btg.com and the website of the Zernike Group at www.zernikegroup.com . BTG was a U.K. governmental body (under a different name) which managed the commercialization of the British government’s stock of IP generated from universities and research institutes and was eventually spun-off during the Thatcher privatization years. They subsequently had an IPO to pay back a large portion of the debt owed to the government. Today it is traded on the London Stock Exchange and is a global leader in commercializing technologies acquired from firms, universities and research institutes.
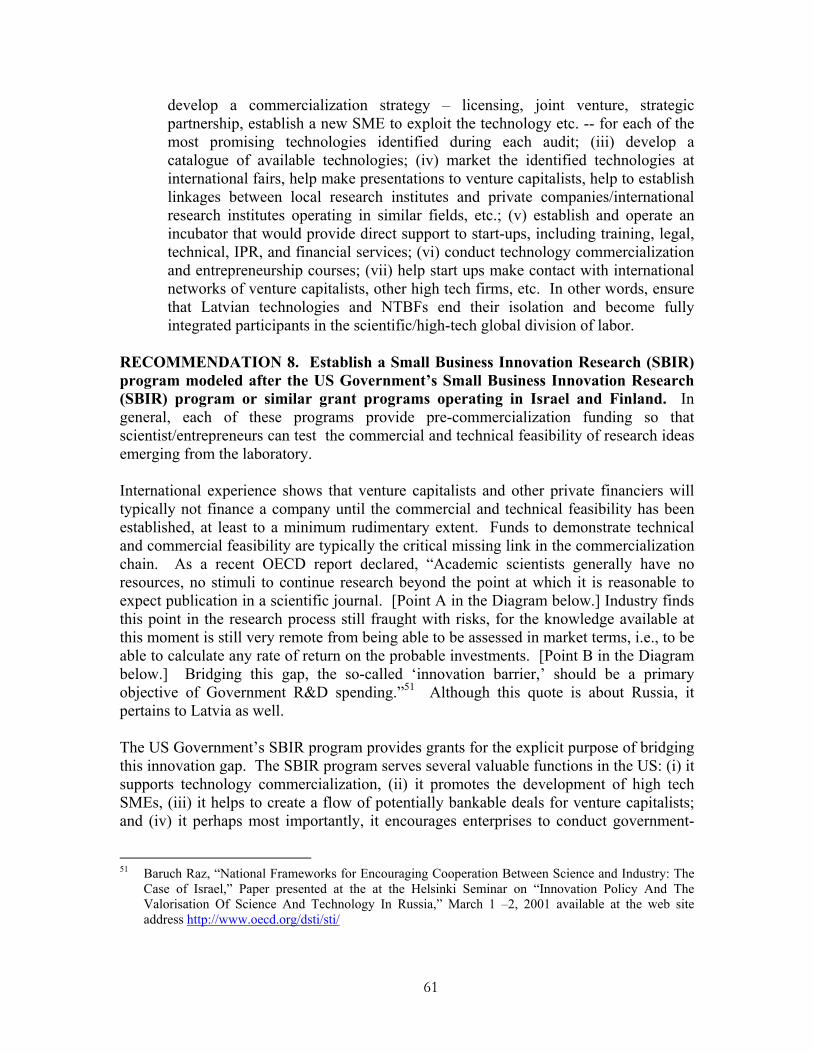
61
develop a commercialization strategy – licensing, joint venture, strategic partnership, establish a new SME to exploit the technology etc. -- for each of the most promising technologies identified during each audit; (iii) develop a catalogue of available technologies; (iv) market the identified technologies at international fairs, help make presentations to venture capitalists, help to establish linkages between local research institutes and private companies/international research institutes operating in similar fields, etc.; (v) establish and operate an incubator that would provide direct support to start-ups, including training, legal, technical, IPR, and financial services; (vi) conduct technology commercialization and entrepreneurship courses; (vii) help start ups make contact with international networks of venture capitalists, other high tech firms, etc. In other words, ensure that Latvian technologies and NTBFs end their isolation and become fully integrated participants in the scientific/high-tech global division of labor.
RECOMMENDATION 8. Establish a Small Business Innovation Research (SBIR) program modeled after the US Government’s Small Business Innovation Research (SBIR) program or similar grant programs operating in Israel and Finland. In general, each of these programs provide pre-commercialization funding so that scientist/entrepreneurs can test the commercial and technical feasibility of research ideas emerging from the laboratory. International experience shows that venture capitalists and other private financiers will typically not finance a company until the commercial and technical feasibility has been established, at least to a minimum rudimentary extent. Funds to demonstrate technical and commercial feasibility are typically the critical missing link in the commercialization chain. As a recent OECD report declared, “Academic scientists generally have no resources, no stimuli to continue research beyond the point at which it is reasonable to expect publication in a scientific journal. [Point A in the Diagram below.] Industry finds this point in the research process still fraught with risks, for the knowledge available at this moment is still very remote from being able to be assessed in market terms, i.e., to be able to calculate any rate of return on the probable investments. [Point B in the Diagram below.] Bridging this gap, the so-called ‘innovation barrier,’ should be a primary objective of Government R&D spending.”51 Although this quote is about Russia, it pertains to Latvia as well. The US Government’s SBIR program provides grants for the explicit purpose of bridging this innovation gap. The SBIR program serves several valuable functions in the US: (i) it supports technology commercialization, (ii) it promotes the development of high tech SMEs, (iii) it helps to create a flow of potentially bankable deals for venture capitalists; and (iv) it perhaps most importantly, it encourages enterprises to conduct government-
51 Baruch Raz, “National Frameworks for Encouraging Cooperation Between Science and Industry: The
Case of Israel,” Paper presented at the at the Helsinki Seminar on “Innovation Policy And The Valorisation Of Science And Technology In Russia,” March 1 –2, 2001 available at the web site address http://www.oecd.org/dsti/sti/
62
funded R&D. This has several important advantages. First, it encourages enterprises to start conducting more research. As the innovation survey shows, most Latvian enterprises are not particularly active in this regard. This program can help alter the status quo. Second, it encourages enterprises to find commercial outlets for the government-funded research which they conduct. This, in turn, will help to stimulate high tech start-ups and spin-offs. In the US, the government organizes special seminars to teach firms how to apply for SBIR grants. A similar training program would not only help Latvian enterprises apply for a Latvian SBIR program but it could also be tailored to help them apply for various EU programs as well. If the government is interested, the World Bank could ask the US National Science Foundation (NSF) to help design this component. (See Annex 8 for further details of the SBIR program.)
Figure 32 From Academy to Industry
Enth
ropy
of K
nowl
edge
Prof
it
Reaserch Profit Barrier RECOMMENDATION 9. Establish a fund of funds, similar to Yozma in Israel, Sitra in Finland, or SBIC in the US to help attract venture capital to Latvia.52 While 52 For details of Sitra’s activities, see http://www.sitra.fi/eng/index.asp?MM=1&DirID=62 . Yozma’s
venture capital activities are described in http://www.yozma.com/home/ . For a general overview of the venture capital industry see, Martin Kenney, Kyonghee Han, and Shoko Tanaka. “Venture Capital Industries in East Asia,” Report prepared for the World Bank, 2003. Also note that the Netherlands established a matching grant program for seed capital investments in the biotech sector. Details of this program are available at www.biopartner.nl . This Dutch program is administered for the Government by the Zernike Group whose website address is given in footnote 13 above. Many US states established similar matching grant programs. One interesting program is organized by the State of Maryland. Details of the Maryland Venture Capital Trust can be found at http://www.mdarchives.state.md.us/msa/mdmanual/25ind/html/76vent.html . In addition to the Yozma Fund, Israel recently established a Seed Fund whereby the government matches investments in a start-
63
acknowledging Latvia’s impressive technological achievements, potential investors still complain about a shortage of “bankable deals” and lament the fact that there is no organized, coherent commercialization system to boost the flow of deals coming to their attention. The previous recommendations are all designed, in effect, to increase the flow of bankable deals that could be financed by private venture capital funds. But experience in a wide range of countries including Israel, Finland the US, Turkey and Mexico, among others suggests that modest government support may be required to catalyze the emergence of a private venture capital industry. Therefore, as the last step in a broader technology commercialization program, the Government may also wish to establish a so-called Fund of Funds (FOF) that would provide a portion of the investment funds required by new venture capital funds operating in Latvia. An FOF could operate on a variety of financial principles. The precise operating procedures of a Latvian FOF should be decided following further analysis of the Latvian market conditions. Therefore, the following description and discussion of options should be viewed as illustrative, rather than as a concrete, specific recommendation. The ratio of FOF support to private support might be in the range of 1 : 2 – e.g., FOF would provide $1 of support for every $2 raised by private investors – or slightly greater, depending on market conditions and demands from investors. However, in all cases, the FOF would provide a minority of the total funding. One approach would be for the FOF to provide its financial support on the same commercial terms as the other private investors investing in a particular venture capital fund and would share all losses and profits with those private investors on a pro rata basis. In a second variant, the FOF provides its financing on more favorable terms. In this latter approach, the FOF would bear the first loss up to a set amount, or allow private investors to recoup a portion of their initial investment before the FOF receives any returns. This FOF program would have several advantages and safeguards against political interference in decision making as well as provisions to shield the Government against excessive financial exposure to individual companies. For example:
• No FOF resources would be disbursed to a private venture capital fund unless private investors finance their agreed share of the venture capital fund. Consequently, Government funds would be disbursed only alongside private funds.
• Any private venture capital fund that meets the published eligibility criteria would be eligible for FOF funding. This is designed to eliminate any potential claims of favoritism or discrimination.
up company made by a private investing entity. The Government’s investment in the start-up company is repaid by royalties on sales or alternatively, the investor can purchase the government shares in the start up company within five years at the initial price plus interest. Details of this fund for start up companies is available at www.moit.gov.il/heznek.htm .
64
• Private investors would always have a controlling share of each VC fund. • Decisions about investments in individual high tech companies will be made by
professional private sector managers working for the newly established private venture capital funds.
C. Absorption and Diffusion of Knowledge As noted in previous sections, Latvia produces much less than 1% of the world’s knowledge. This proportion will not increase significantly, even if Latvia develops the world’s most efficient knowledge production and technology commercialization systems. For the foreseeable future, therefore, Latvia will have no choice but to acquire most of its knowledge from outside Latvia. Latvian enterprises will simply be unable to compete without an efficient knowledge absorption and knowledge diffusion capability. Unfortunately, this capability currently does not exist in Latvia. Even on the basis of the crudest measure of technology absorption – knowledge licensed from abroad -- Latvia ranks near the bottom of the NMS’s. However, acquiring knowledge is not simply a question of going out and purchasing it from outside vendors. Firms need to have the capacity to search for different technologies, to evaluate different technological options, to modify off-the-shelf technologies for use by a particular enterprise and, last but by no means to least, to integrate new technologies into their production processes. These are not simple or easy tasks. They require a great deal of organizational, managerial, and technological sophistication. Simply put, enterprises need to acquire the skills which they need to acquire and use technology. Recent studies suggest that business enterprises constitute both the “demand side” and the “supply side” of industrial technology. In other words, the business sector produces most of the technology that is required by the business sector. The technology doesn’t come from fundamental or even applied research generated by R&D laboratories. Rather, it is generated by design and engineering activities spawned by interaction with customers, suppliers, and competitors. This helps to explain why clusters, competition, and linkages with other firms are so important to the technology development process. This also suggests that Latvia has a dual problem. On the one hand, most of the scientific research capacity is concentrated in public research institutes and universities rather than in enterprises. And on the other hand, Latvian industry is ill equipped and ill disposed to pursue technology development. Breaking this vicious circle requires a two-pronged attack, as experience from industrial countries and east Asia suggests. First, enterprises have to strengthen their technological learning and innovation capabilities. And second, R&D and educational institutions need to focus more of their efforts and attention to the needs of enterprises so that they can support enterprise innovation. The following policy recommendations are designed to help Latvia (i) assess and improve enterprise innovation capacity and (ii) improve linkage between R&D and educational institutes on the one hand and enterprises on the other.
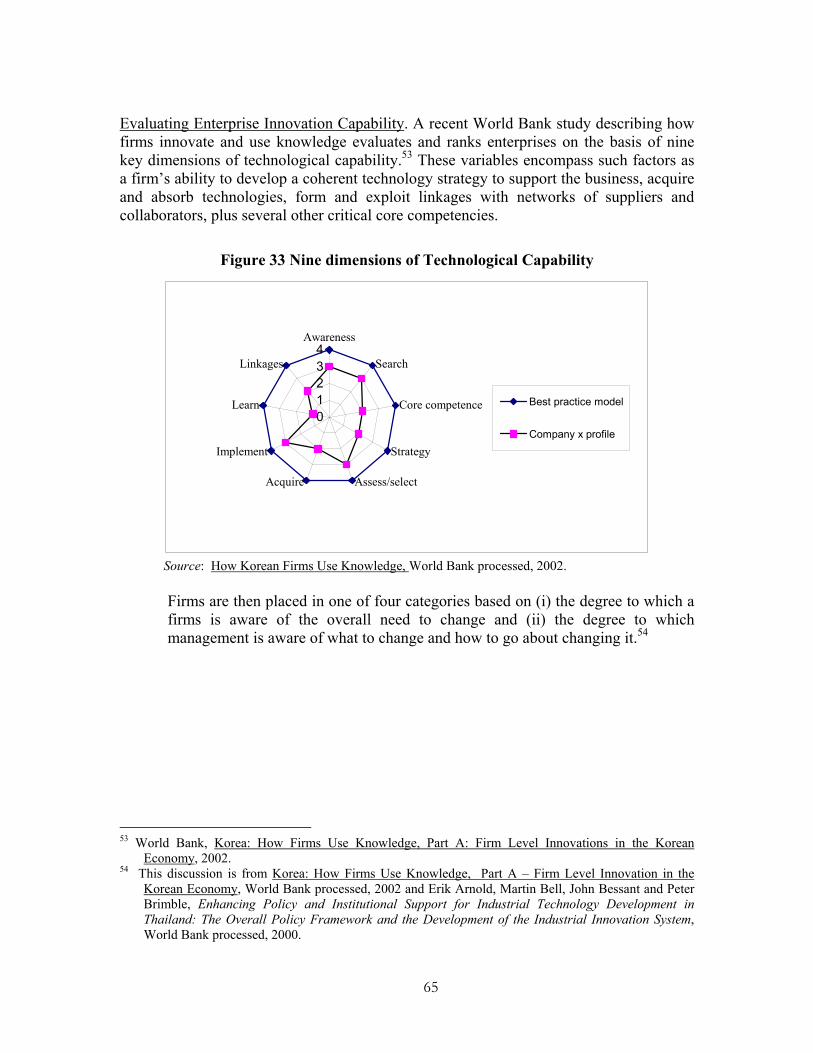
65
Evaluating Enterprise Innovation Capability. A recent World Bank study describing how firms innovate and use knowledge evaluates and ranks enterprises on the basis of nine key dimensions of technological capability.53 These variables encompass such factors as a firm’s ability to develop a coherent technology strategy to support the business, acquire and absorb technologies, form and exploit linkages with networks of suppliers and collaborators, plus several other critical core competencies.
Figure 33 Nine dimensions of Technological Capability
01234
Awareness
Search
Core competence
Strategy
Assess/selectAcquire
Implement
Learn
Linkages
Best practice model
Company x profile
Source: How Korean Firms Use Knowledge, World Bank processed, 2002.
Firms are then placed in one of four categories based on (i) the degree to which a firms is aware of the overall need to change and (ii) the degree to which management is aware of what to change and how to go about changing it.54
53 World Bank, Korea: How Firms Use Knowledge, Part A: Firm Level Innovations in the Korean
Economy, 2002. 54 This discussion is from Korea: How Firms Use Knowledge, Part A – Firm Level Innovation in the
Korean Economy, World Bank processed, 2002 and Erik Arnold, Martin Bell, John Bessant and Peter Brimble, Enhancing Policy and Institutional Support for Industrial Technology Development in Thailand: The Overall Policy Framework and the Development of the Industrial Innovation System, World Bank processed, 2000.
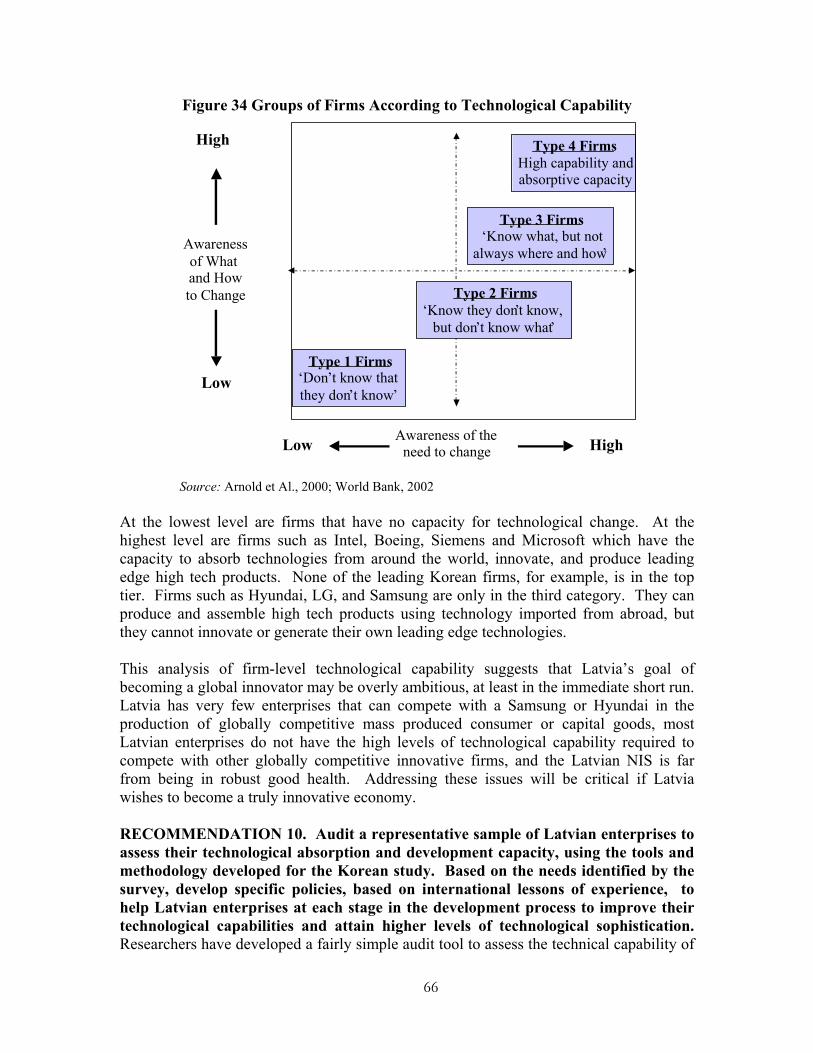
66
Figure 34 Groups of Firms According to Technological Capability High
Low
Awareness of the need to changeLow High
Type 1 Firms‘ Don’t know that they don’t know’
Type 2 Firms‘Know they don’t know,
but don’t know what’
Type 3 Firms ‘Know what, but not
always where and how ’
Type 4 Firms High capability and absorptive capacity
Awareness of What and How to Change
Source: Arnold et Al., 2000; World Bank, 2002
At the lowest level are firms that have no capacity for technological change. At the highest level are firms such as Intel, Boeing, Siemens and Microsoft which have the capacity to absorb technologies from around the world, innovate, and produce leading edge high tech products. None of the leading Korean firms, for example, is in the top tier. Firms such as Hyundai, LG, and Samsung are only in the third category. They can produce and assemble high tech products using technology imported from abroad, but they cannot innovate or generate their own leading edge technologies. This analysis of firm-level technological capability suggests that Latvia’s goal of becoming a global innovator may be overly ambitious, at least in the immediate short run. Latvia has very few enterprises that can compete with a Samsung or Hyundai in the production of globally competitive mass produced consumer or capital goods, most Latvian enterprises do not have the high levels of technological capability required to compete with other globally competitive innovative firms, and the Latvian NIS is far from being in robust good health. Addressing these issues will be critical if Latvia wishes to become a truly innovative economy. RECOMMENDATION 10. Audit a representative sample of Latvian enterprises to assess their technological absorption and development capacity, using the tools and methodology developed for the Korean study. Based on the needs identified by the survey, develop specific policies, based on international lessons of experience, to help Latvian enterprises at each stage in the development process to improve their technological capabilities and attain higher levels of technological sophistication. Researchers have developed a fairly simple audit tool to assess the technical capability of
67
enterprises. Latvian policy makers should utilize this audit tool to assess the strengths and weaknesses of a large representative sample of Latvian enterprises. Based on the weaknesses revealed by the audit and international lessons of experience, they should develop specific targeted strategies that would help enterprises improve in areas where they are deficient and achieve higher levels of sophistication. RECOMMENDATION 11. Develop matching grant programs to align government R&D spending more closely to the innovation and competitiveness needs of domestic industry. At present, Government R&D spending priorities bear little relationship to the innovation or competitiveness needs of Latvian enterprises. Nor are Government R&D spending programs designed to catalyze private innovation spending. To a certain extent, this is a classic chicken and egg dilemma. As the preceding discussion of the Latvian innovation survey indicated, Latvian enterprises are not particularly prone to innovate and, when they do, R&D is not the favored mode of innovation. Not surprisingly, therefore, Government R&D spending priorities have not responded to the low or non-existent demand from industry for more targeted R&D spending. At the same time, it is also important to recognize that more targeted Government R&D spending, by itself, will not be sufficient to stimulate greater enterprise spending on or interest in innovation. Targeted programs, in other words, are not a panacea or magic bullet. Nevertheless, if coupled with other complementary policies and programs, World Bank projects in India, Turkey, and Chile among others, suggest that carefully crafted matching grant programs can be one part of a comprehensive approach to stimulating greater private sector innovation. For example, a 1999 World Bank Industrial Technology project in Turkey55, provided matching grants to co-finance up to 50% of the cost of product and process R&D among private enterprises. The project places special emphasis on promoting linkages between the R&D institutions and Turkish industry. A project with a similar component is currently under development in Croatia. And finally, a forthcoming World Bank project in Chile56 would provide grants to research consortia from universities, government laboratories, and private industry undertaking collaborative research and development, and research training, in areas of importance to industry and the regions of Chile. The private industry and public sector agencies involved in the consortia and teams will be required to make substantial in-kind and cash commitments to support the cooperative activities. As part of a more comprehensive program to promote enterprise innovation in Latvia, the Government should consider developing similar programs. 55 For details, see the Project Appraisal Document for a project in Turkey entitled, “Industrial
Technology Project,” Report No: 18351-TU, May 1999. 56 For details, see the Project Appraisal Document for a project in Chile entitled, “Science For The
Knowledge Economy In Support Of The First Phase Of The Program To Improve The Innovation System,” Report No. 25324, April 2003.
68
RECOMMENDATION 12. Develop Teaching Company Scheme (TCS) program similar to the UK’s57 to encourage Latvian enterprises to give internships to graduate engineering students or research scientists. In addition, develop a program to help Latvian engineers and business executives working in Latvian enterprises (including those working in non-high tech enterprises) spend several months on sabbatical working in a foreign company or research lab. Experience suggests that this so-called “tacit knowledge” or know-how can be one of the most important factors promoting innovation in an enterprise. The TCS provides a government grant to encourage UK enterprises to hire graduate students, young research scientists, or young professors for up to two years to conduct a research or engineering project defined by the private enterprise. Latvia should develop a similar scheme. Via this program, Latvian enterprises would get the benefit of research expertise from young, talented Latvian scientists and engineers. Young Latvian scientists and engineers, in turn, would have an opportunity both to supplement classroom learning with on-the-job experience and to see what research issues are of interest to industry. This insight could then guide their future academic research, thus creating closer links between the research needs of enterprises and the research outputs of university and scientific institute laboratories. A forthcoming World Bank project in Chile will have a component similar to the UK Teaching Company scheme. This project component would “expand the stock of high-quality research personnel in Chilean industry by awarding on a competitive basis: (i) scholarships to doctoral students who undertake a substantial part of their thesis work in industry. A staff member of the company will be an Associate Supervisor of the student and the company will be required to contribute to a small supplement to the scholarship; and (ii) partial scholarships to post-doctoral or other early career researchers who will undertake research in industry. These latter scholarships will be temporary and decline in value of time, with the company taking an increasing share of the researchers salary.” RECOMMENDATION 13. Establish a Measurements, Standards, Testing and Quality (MSTQ) service. The industrial demand for refinements in measurement accuracy, and for rigorous product specifications embodied in public standards continues to grow in all OECD countries. Latvia’s needs are likely to increase substantially as it tries to move from the production and export of low-skill goods to the production and export of technology and skill intensive products that demand precision, quality and compatibility with international standards. These requirements will place heavy demands on the existing MSTQ infrastructure which would, therefore, need to be expanded, strengthened and harmonized with EU requirements. Bank projects have addressed these issues in several countries. Specifically, these projects have helped (i) upgrade existing measurement services by improving the efficiency with which the measurements are performed; and (ii) developed measurement
57 Information about the Teaching Company Scheme is available at http://www.tcsonline.org.uk/ .
Information about a newly revised version of the program known as the Knowledge Transfer Partnership is available at www.ktponline.org.ul
69
services in new areas such as chemical and medical metrology. In addition to providing these basic services, an MSTQ program in Latvia could also ensure that Latvian MSTQ standards conform with analogous EU standards and provide training, advice and outreach services to customers so that they understand the value and importance of MSTQ services. Indeed a well functioning MSTQ institution could also serve as a spur to incremental innovation in firms through the relationship between product testing, identification of technical problems, and process innovation. RECOMMENDATION 14. Establish at least one Skills Development Center. Latvian business executives complain frequently and vocally about acute shortages of skilled technical workers. In addition, they argue that engineering schools do not provide students with the useable skills demanded by today’s labor market. These shortages and education deficiencies clearly hamper the growth of locally-owned businesses. In addition, it is highly likely that they deter foreign investors from investing in Latvia or, if they are already in Latvia, from adding high skill, high wage activities to their ongoing Latvian operations. When faced with similar problems, such countries as Malaysia, Korea and Taiwan established training institutions or skill development centers, specifically targeted to the needs of business and foreign investors. A potentially useful model for Latvia to investigate is the Penang Skills Development Center (PSDC) in Malaysia. PSDC “operates as a non-profit organization…. Participating companies pool their resources together to help plan, design and conduct an extensive range of training programs directly relevant to immediate and forecasted needs. This enables the PSDC to offer the most cost-effective training for the industry and at the same time bridge the gap between skills taught in public institutions and skills required on the job.”58 Designing a skills development center should be an immediate priority for Latvia, given the long lags and lead times (generally at least 2 to 3 years) involved in turning out qualified, educated graduates (capability lags) and the further lags before those workers begin to have a noticeable impact on enterprise competitiveness (economic impact lags). Establishing a skills development center should be done in tandem with efforts to revise engineering and technical training programs. The goal should be to ensure that universities turn out graduates with the skills demanded by both Latvian enterprises and potential foreign investors. RECOMMENDATION 15. Develop technology upgrading programs, in conjunction with Recommendation 10 and Recommendation 14, to assist Latvian enterprises. International experience is replete with examples of successful technology upgrading programs. To cite just one representative example, the Malaysian Technology Acquisition Fund provides grants to help local companies defray a portion of the cost of licensing technology and acquiring patent rights, prototypes and industrial designs. In addition, the Expert Sourcing Program helps local firms engage technical experts and consultants to audit the manufacturing process and recommend high priority process and technology changes. An industrial linkage program and a global supplier program
58 A brief description of the PSDC is available at
http://www.logos-net.net/ilo/150_base/en/init/mal_5.htm . For website links to training programs available in different countries see http://www.logos-net.net/ilo/150_base/en/instr/ins_top.htm .
70
provides detailed technical training to help local enterprises become competitive manufacturers and suppliers of parts, components and related services to multinationals and large domestic companies. These programs could be especially useful now that EU membership is on the horizon.59
59 Details of the training provided under the industrial linkage and global supplier programs are available
at http://www.logos-net.net/ilo/150_base/en/init/mal_5.htm . In addition, for details of the various skill upgrading programs available in Malaysia see http://www.smidec.gov.my/detailpage.jsp?section=smidecprogrammes&level=1 . Information about the Technology Acquisition Fund is available at http://www.miti.gov.my/indpolicy-taf.html .
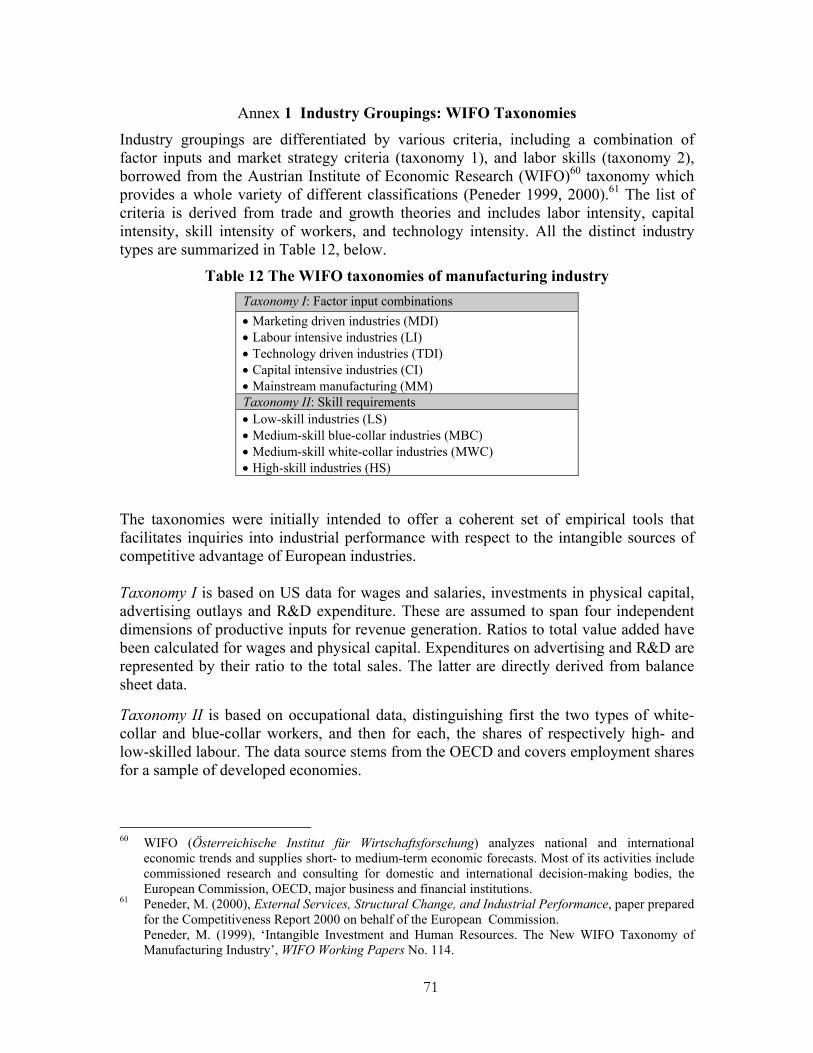
71
Annex 1 Industry Groupings: WIFO Taxonomies
Industry groupings are differentiated by various criteria, including a combination of factor inputs and market strategy criteria (taxonomy 1), and labor skills (taxonomy 2), borrowed from the Austrian Institute of Economic Research (WIFO)60 taxonomy which provides a whole variety of different classifications (Peneder 1999, 2000).61 The list of criteria is derived from trade and growth theories and includes labor intensity, capital intensity, skill intensity of workers, and technology intensity. All the distinct industry types are summarized in Table 12, below.
Table 12 The WIFO taxonomies of manufacturing industry Taxonomy I: Factor input combinations • Marketing driven industries (MDI) • Labour intensive industries (LI) • Technology driven industries (TDI) • Capital intensive industries (CI) • Mainstream manufacturing (MM) Taxonomy II: Skill requirements • Low-skill industries (LS) • Medium-skill blue-collar industries (MBC) • Medium-skill white-collar industries (MWC) • High-skill industries (HS)
The taxonomies were initially intended to offer a coherent set of empirical tools that facilitates inquiries into industrial performance with respect to the intangible sources of competitive advantage of European industries. Taxonomy I is based on US data for wages and salaries, investments in physical capital, advertising outlays and R&D expenditure. These are assumed to span four independent dimensions of productive inputs for revenue generation. Ratios to total value added have been calculated for wages and physical capital. Expenditures on advertising and R&D are represented by their ratio to the total sales. The latter are directly derived from balance sheet data. Taxonomy II is based on occupational data, distinguishing first the two types of white-collar and blue-collar workers, and then for each, the shares of respectively high- and low-skilled labour. The data source stems from the OECD and covers employment shares for a sample of developed economies.
60 WIFO (Österreichische Institut für Wirtschaftsforschung) analyzes national and international
economic trends and supplies short- to medium-term economic forecasts. Most of its activities include commissioned research and consulting for domestic and international decision-making bodies, the European Commission, OECD, major business and financial institutions.
61 Peneder, M. (2000), External Services, Structural Change, and Industrial Performance, paper prepared for the Competitiveness Report 2000 on behalf of the European Commission. Peneder, M. (1999), ‘Intangible Investment and Human Resources. The New WIFO Taxonomy of Manufacturing Industry’, WIFO Working Papers No. 114.
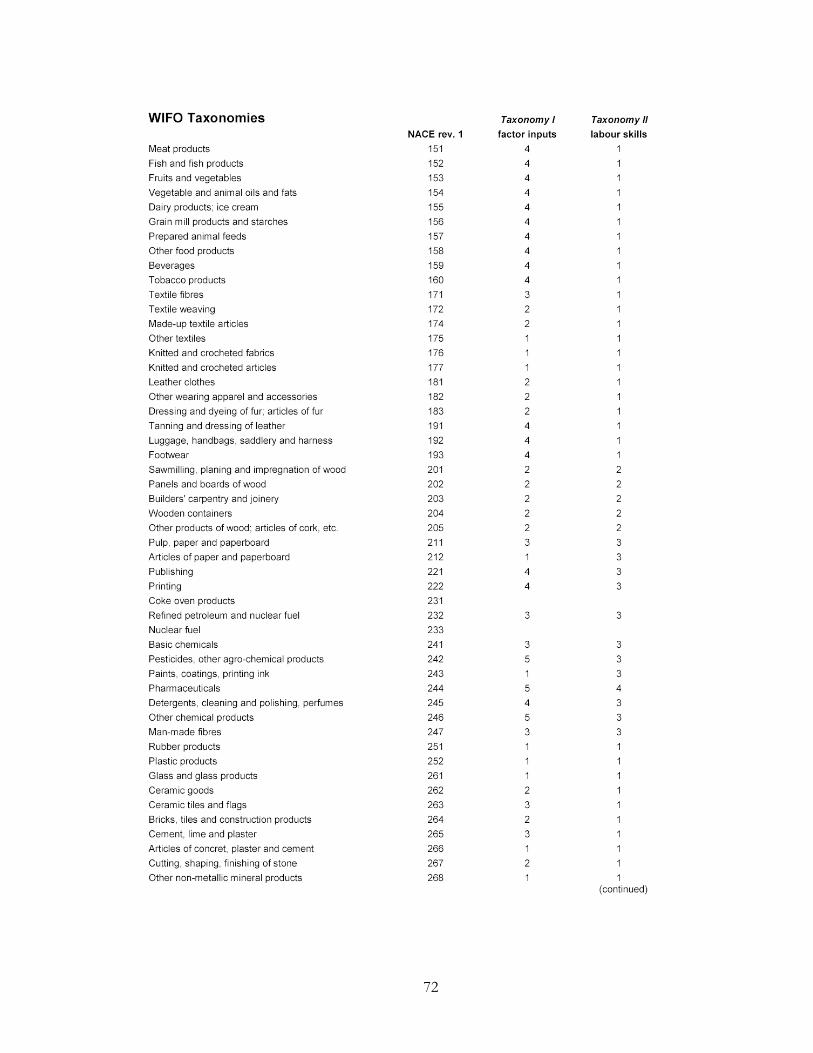
72
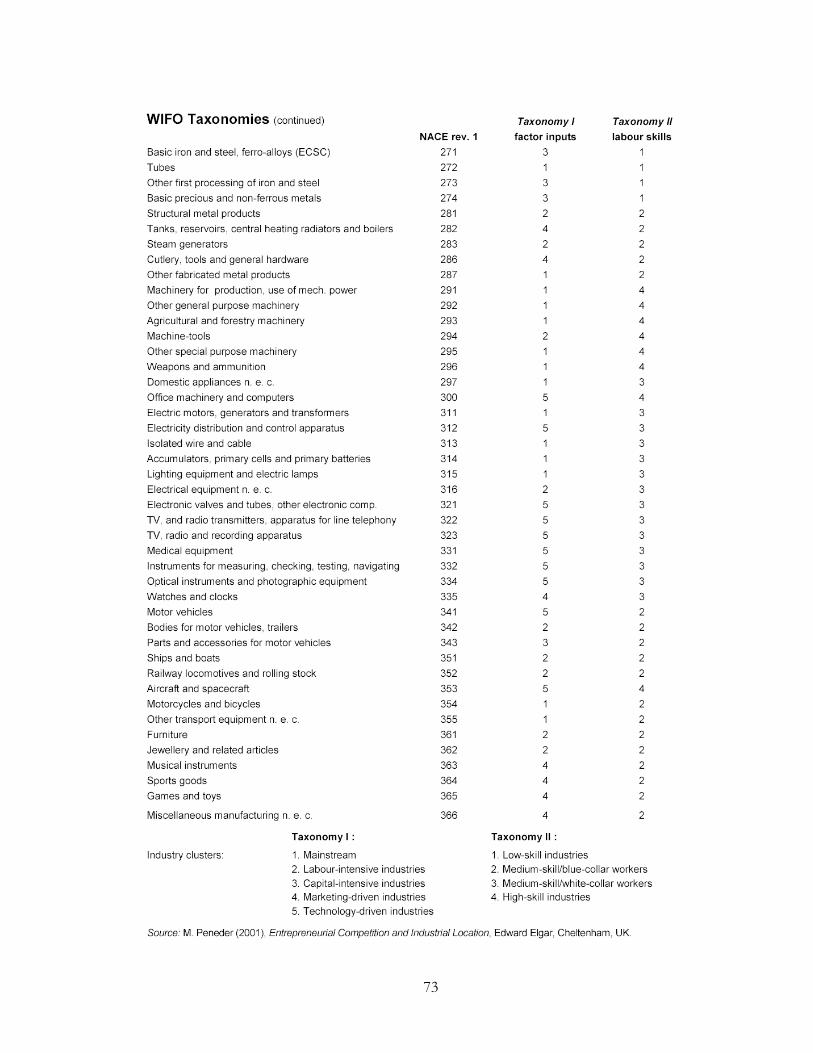
73
74
Annex 2 Commercializing IP: The US Experience Several countries have developed different models ranging from transfer of ownership of all government-funded IP to the private sector (US) to a system in which the state retains some ownership rights and actively promotes commercialization of government funded S&T (UK, France, Germany, Japan). Despite their differences, these systems all work reasonably well. Thus, the real question is not “who owns” government funded IP but rather how government-funded IP can be introduced into the economic turnover. This Annex will describe the US approach, in part because the US model is generally recognized as an example of international best practice and also because this is the approach which many in GOR say that they wish to emulate. The US approach to ownership and commercialization of government-funded IP is codified in two major pieces of legislation – the Bayh-Dole Act (P.L. 96-517) and the Stevenson-Wydler Act (P.L. 96-418), both approved in 1980. Both laws are designed to encourage the commercialization of R&D that was funded by, or developed by the government. Bayh-Dole pertains to the ownership of patents resulting from government-funded R&D that was performed in non-government facilities – e.g., universities, non-profit research laboratories, etc. Stevenson-Wydler pertains to the ownership of patents resulting from cooperative research efforts between government research laboratories and outside partners where there is no direct federal funding to the outside partner.62 Both laws were based on the premise that simply funding more basic research would not solve the US technology commercialization problem. On the contrary, technology commercialization is not a linear process in which more basic research inputs automatically generate complementary applied research, development, commercialization, and diffusion of the results into the economy. The problem with the US in the 1980s was that despite its overall strength in basic research, other countries were commercializing the results. A second related premise was that the US government had not been an effective owner of the IP which it had already created and funded. At the time both laws were passed, the USG owned approximately 28,000 patents. But fewer than 5% of these inventions were licensed for commercial use.63 The remainder lay idle.
62 For details see Wendy Schacht, “Patent Ownership and Federal Research and Development (R&D):
A Discussion of the Bayh-Dole Act and the Stevenson-Wydler Act, (Congressional Research Service: The Library of Congress, December 11, 2000). Note: CRS reports are not generally available to the public although they can occasionally be found on the internet or obtained via Congressional offices. CRS reports cited in this note were obtained directly from the CRS.
63 U.S. Government Accounting Office (GAO) Report to Congressional Committees entitled
“Technology Transfer: Administration of the Bayh-Dole Act by Research Universities, May 7, 1998.
75
The reasons for this low level of commercialization are complex. First, and perhaps foremost, not every invention is commercially viable. Markets simply do not exist for every interesting invention. Second, studies indicate that research accounts for approximately 25% of the cost of bringing a new product to market. USG agencies have neither the mandate nor the capability to finance the remaining 75% of the costs of commercializing inventions or determining which inventions have commercial potential. Simply stated, the government was not well suited for the venture capital business. Last but not least, prior to the passage of these laws, the Government refused to relinquish title to federally-funded inventions. Instead, it retained title and granted non-exclusive licenses to anyone who wanted to utilize the invention. Since companies could not obtain ownership of the patent or exclusive licenses to exploit government-funded inventions or inventions developed in government laboratories, they were unwilling to go through the expense and effort of developing new products based on these inventions. Bayh-Dole and Stevenson-Wydler were designed to clarify ownership of government funded IP, but more importantly, to ensure that government funded inventions were put into economic circulation. They explicitly encourage cooperation between research institutes, universities, laboratories conducting fundamental research, and domestic industry to ensure that the fruits of research are not locked in the laboratory but are actively used as an economic resource to promote growth and the competitiveness of US industry. This has proven to be especially useful for defense-oriented research.64 Rather than keeping the research bottled up in defense products, Bayh-Dole and Stevenson-Wydler protect US national security interests while simultaneously providing incentives for private industry to use these inventions for the widest possible range of civilian applications. A. Bayh-Dole Bayh-Dole is based on a simple premise: although budget funds were financing the development of inventions, taxpayers were not benefiting from the economic development (and financial return to the government in the form of increased tax revenues) that would result from the successful manufacture and sale of products produced as a result of these inventions. In passing Bayh-Dole, Congress decided that the public interest would best be served if title to budget-funded inventions were passed to those institutions -- universities, small businesses or non-profit research institutes – where the inventions were created. But there was a caveat. These institutions could retain title only if they diligently promoted commercialization by licensing the innovations for use by commercial enterprises. The institutions would earn licensing fees and royalties (generally ranging between 3% and 6%), thereby giving them a strong incentive to promote commercialization. The enterprises would receive an exclusive license to use the invention, thereby giving them an incentive to use corporate funds to
64 As one analyst observed recently, “While the major portion of total federal R&D spending has been
in the defense arena, government-financed work has led or contributed to new commercial products and processes including, but not limited to, antibiotics, plastics, jet aircraft, computers, electronics, and genetically engineered drugs.” Cited in Wendy Schacht, op. cit., p. 7.
76
commercialize the invention. The USG would not share in the license fees or royalties (especially since universities are non-taxable institutions and therefore would not pay taxes on the royalties earned and were under no other obligation to share royalties with the government). Nevertheless, the government would profit from the new jobs and increased taxes eventually generated by the increased economic activity spawned by government-funded inventions. As the Bayh-Dole Act declares:
It is the policy and objective of the Congress to use the patent system to promote the utilization of inventions arising from federally-supported research and development; … to promote collaboration between commercial concerns and nonprofit organizations, including universities; to ensure that inventions made by nonprofit organizations and small business firms are used in a manner to promote free competition and enterprise, to promote the commercialization of public availability of inventions made in the United States by US industry and labor; [and] to ensure that the Government obtains sufficient rights in federally- supported inventions to meet the needs of the Government and to protect the public against nonuse or unreasonable use of inventions.65
To achieve these objective, the Bayh-Dole Act along with subsequent amendments and implementing regulations66 provide for the following: • The provisions apply to all inventions developed in the course of a federal grant,
contract, or cooperative agreement. The provisions apply even if the federal government is not the sole source of funding.
• Each university, small business or nonprofit organization (hereinafter, university)
may retain title to inventions made as a result of government-funded R&D.67
77
• The university has an obligation to disclose each new invention to the funding agency
within two months of its discovery. • Within two years after disclosure, the university must decide if it wishes to retain title
to the invention. • If the university determines that it wishes to retain title to the invention, it must file
for a US patent within one year. Within ten months of the US filing, the university must indicate if it will file for foreign patents. If it chooses not to, the US government can file for foreign patents in its own name.
• If the university retains title, it must provide the government with a non-revocable
license to use the invention. • Any company holding a license to a patent that involves sales of product in the US
must substantially manufacture the product in the US unless it can be shown that this is not economically feasible.
• In marketing inventions to licensees, universities must give preference to small
business firms (less than 500 employees) provided that these firms have the resources and capability of commercializing the invention.
• If the invention was not commercialized within a reasonable period of time, the
federal government can compel the university to grant a license to a third party or the
65 Cited in Appendix B, “Excerpts from the Bayh-Dole Act,” in Technology Commercialization, op.
cit. 66 An excellent summary of the Bayh-Dole Act is available in “The Bayh-Dole Act: A Guide to the
Law and Implementing Regulations,” Council on Government Relations, September 1999, (web site: http://www.ucop.edu/ott/bayh/html Also see Mark W. Crowell, “Commercializing University Technology” in Technology Commercialization: Russian Challenges, American Lessons, op cit.; Wendy Schacht, “Patent Ownership and Federal Research and Development (R&D): A Discussion of the Bayh-Dole Act and the Stevenson-Wydler Act,” (Congressional Research Service: The Library of Congress, December 11, 2000) and Wendy Schacht, “R&D Partnerships and Intellectual Property: Implications for US Policy,” (Congressional Research Service: The Library of Congress, December 6, 2000) (web site http://www.cnie.org/nle/st-19.html . Final rules for implementing the Bayh-Dole Act were published on March 18, 1987 and codified at 37 CFR part 401.1-401.16. According to the Council on Government Relations brochure cited above, “these regulations…specify the rights and obligations of all parties involved and constitute the operating manual for technology transfer on a national basis.” This portion of the Code of Federal Regulations can be accessed at the web site http://www.access.gpo.gov/nara/cfr/waisidx_00/37cfr401_00.html
67 Bayh-Dole allows universities, small business, and nonprofit organizations to own inventions
developed with budget funding. However, a Presidential Memorandum issued by President Reagan on March 18, 1983 extended the benefit of Bayh-Dole to large for-profit organizations as well as small businesses. That Memorandum is still in effect and is codified in the Code of Federal Regulations cited above.
78
government can reclaim title and grant licenses itself. (These are the so-called “march-in” rights.)
• Universities must share royalty and license income from the invention with the
inventor. It must use the remaining income to cover the cost of maintaining a university technology transfer office and to support scientific research and education.68
Bayh-Dole had a major impact on the commercialization of government-financed inventions. For example, in 1980, approximately 25-30 universities were engaged in technology transfer. Between 1974 and 1984, 84 universities applied for 4105 patents and received 2944 patents. Licensing income reported by 112 universities in 1986 amounted to $30 million. By comparison, in 1999 alone, 190 universities, hospitals and nonprofit research organizations reported69: • Approximately $41 billion of economic activity, supporting 271,000 jobs was
attributed to the results of academic licensing; • Adjusted gross license income was $862 million; • 5545 US patent applications were filed and 3661 patents were issued;
• 3914 new licenses were issued and 18,617 licenses were outstanding. Almost 2/3 of
the new licenses were issued to small businesses;
• The business activity associated with the sale of licensed products is estimated to generate approximately $5 billion of federal, state and regional tax revenue.
B. Stevenson-Wydler Whereas Bayh-Dole concerns the ownership and commercialization of government-funded inventions created in universities, Stevenson-Wydler addresses the ownership of inventions created in the course of cooperative research ventures between private enterprises and government laboratories. The basic rationale for the legislation was an attempt to create closer linkages between federal laboratories conducting basic research 68 Excellent descriptions of university technology licensing procedures and the operation of university
technology management offices can be found in University Technology Transfer: Questions and Answers, Council on Governmental Relations, November 30, 1993 (available at the web site http://www.cogr.edu/qa.htm . Another excellent source of information is available at the web site of the Association of University Technology Managers http://www.autm.net
69 1999 data are from The Association of University Technology Managers, Inc., report entitled,
AUTM Licensing Survey, FY 1999: A Survey Summary of Technology Licensing (and Related) Performance for U.S. and Canadian Academic and Nonprofit Institutions and Patent Management Firms.
79
and private industry, on the grounds that this would generate significant benefits for both parties. The basic building block of Stevenson-Wydler is the cooperative research and development agreement (CRADA), which defines the terms and conditions of the cooperative venture between a federal laboratory and private enterprise. Pursuant to Stevenson-Wydler, the work performed by a federal laboratory under a CRADA must be consistent with the laboratory’s basic mission. Both parties to the CRADA may share personnel, services and property. However, the federal government may not provide any direct funding to the private partner. Although Wydler-Stevenson does not mandate any specific disposition of IP created in the course of the CRADA, it permits the federal laboratory to transfer ownership of the resulting IP to the private enterprise. As with Bayh-Dole, the federal government must be given a non-exclusive, irrevocable, paid up license to use the technology throughout the world.

80
Annex 3 Sample Technology Commercialization Course Outline70
5
Technology Commercialization Training CourseSchedule
Time Day One Day Two Day Three
8:30 am -- 10:00 am
Introduction & Course ObjectivesGlobalizationBusiness EnvironmentsBusiness & Research CulturesIdeas to Products
Pathways to Commercialization – Strategic Partnering & Alliances
Information Mining & Analysis Via the InternetTechnology Business StrategiesCorporate OrganizationsTechnology & Product StrategiesRoadmaps for CommercializationCapturing InnovationTechnology Flow into Marketplace
10:00 am – 10:30 am Break Break Break
10:30 am – 12:00 pm Pathways to Commercialization – Starting a New Company
Introduction to Intellectual PropertyUnited States Patent Law
Technology Commercialization ProcessCommercialization TeamTechnology Characteristics & AssessmentsProduct Commercialization Model Concept Phase
12:00 pm – 1:00 pm Lunch Lunch Lunch
1:00 pm – 3:00 pm Pathways to Commercialization – Starting a New Company
Russian Patent LawPatent Cooperation Treaty (PCT) – International Strategies
Product Commercialization Model Development Phase Commercial Phase
3:00 pm – 3:30 pm Break Break Break
3:30 pm – 5:00 pm Pathways to Commercialization – Strategic Partnering & Alliances
Business Perspectives of Intellectual Property Rights (IPR)
Review and Wrap-Up Discussion
5:00 pm – 5:30 pm Break Break Break5:30 pm – 6:30 pm Role Playing Role Playing No Activity
Training Schedule Modified
70 This three day technology commercialization course was prepared by Trykor International. For more
detailed information about the course, contact Timothy P. Murray, Trykor, Inc., Akademika Pilyugina 26/1, Suite 131, Moscow 117393 Russia; Tel: 7-095-935-0985; E:mail: [email protected]
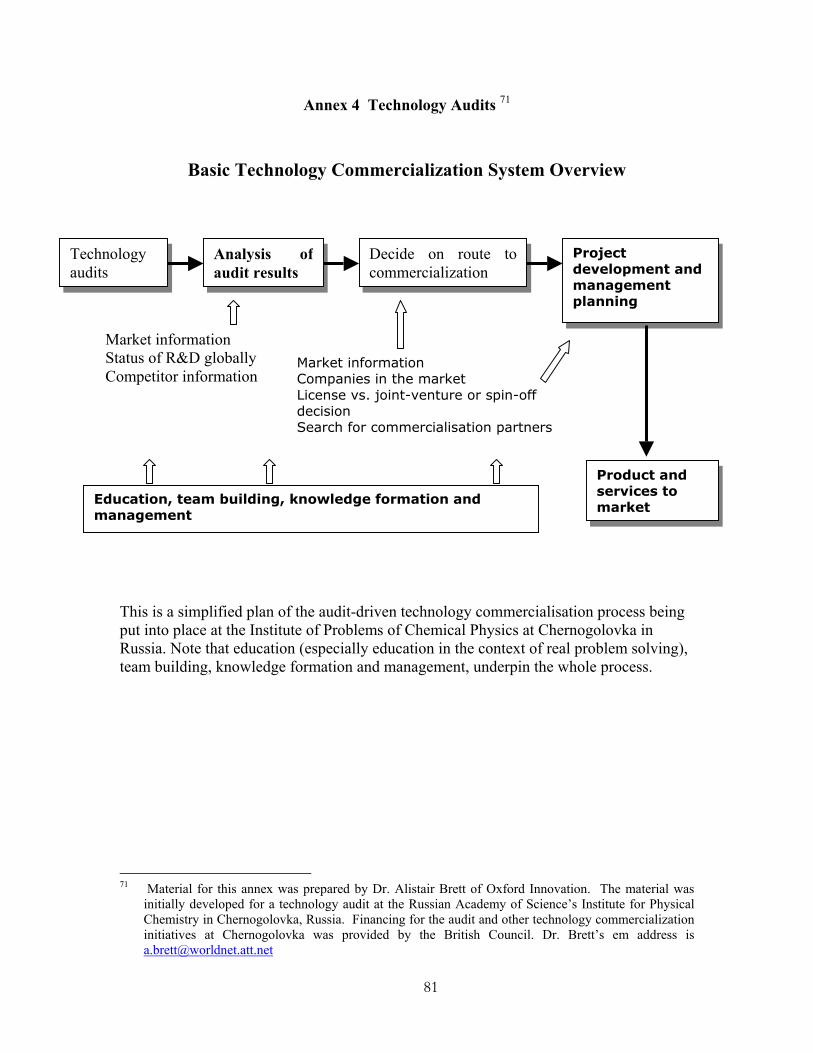
81
Annex 4 Technology Audits 71
Basic Technology Commercialization System Overview This is a simplified plan of the audit-driven technology commercialisation process being put into place at the Institute of Problems of Chemical Physics at Chernogolovka in Russia. Note that education (especially education in the context of real problem solving), team building, knowledge formation and management, underpin the whole process.
71 Material for this annex was prepared by Dr. Alistair Brett of Oxford Innovation. The material was
initially developed for a technology audit at the Russian Academy of Science’s Institute for Physical Chemistry in Chernogolovka, Russia. Financing for the audit and other technology commercialization initiatives at Chernogolovka was provided by the British Council. Dr. Brett’s em address is [email protected]
Technology audits
Decide on route tocommercialization
Product and services to market
Project development and management planning
Analysis ofaudit results
Market information Status of R&D globally Competitor information
Market information Companies in the market License vs. joint-venture or spin-off decision Search for commercialisation partners
Education, team building, knowledge formation and management

82
Long Audit Form Department Laboratory Group Respondent: Last name Name Patronymic name Tel.: e-mail
1. SUBDIVISION DATA
1.1. Basic fields of subdivision activity 1.2. Methods and tools being used in the subdivision that can be claimed for by
exterior users. 1.3. Software support, databases, etc., worked out in the subdivision that can be
claimed for by exterior users.
2. PROSPECTS OF PROJECTS UNDER ANALYSIS
(results commercialization) 2.1 Which of projects are especially perspective for commercialization? 2.2 Which of your future researches are especially perspective? 2.3 What sources of finance can be used by commercialization? 2.4 Is there a direct availability of financing your researches by industrial
enterprises?
3. RESPONDENT DATA 3.1 Basic fields of your scientific interests 3.2 Conferences, exhibitions you have taken part in (3 last years) 3.3 List of scientific works (3 last years) 3.4 Applications and patents where you are an author or an applicant for a
patent (proprietor). 3.5 List of works you have taken part in as a consultant (3 last years). Please,
name the customer. 3.6 Would you like to take an active part in industrial application of the project
achievements or their commercialization? (or do you prefer to entrust with this task somebody else in order to concentrate yourself on your researchers) 3.7 Would you like to be a co-founder of the company, created for a
commercialization of your works?

83
4. THE PROJECT THE RESPONDENT IS TAKING PART IN
4.1. COMMON DATA ON THE PROJECT 4.1.1. Title of the project 4.1.2. Project director (Name, position) 4.1.3. Sources of finance (Customer) 4.1.4. Internal project participants
Name Subdivision Position Field of specialization
4.1.5. External project participants
Organization Name Position Field of specialization
4.2. DESCRIPTION OF THE PROJECT 4.2.1Annotation (A brief description of the project. Please, indicate the persons interested in the projects’ results and results specifically) 4.2.2. Field of project specialization (e.g.: petrochemistry, catalysts, etc.) 4.2.3. Objectives of the project 4.2.4. Project stage
Description of stage Invoked project stage
Performed stages
Fundamental theoretical investigations
Fundamental prediscovery Applied researches Production of laboratory/experimental specimen
Production of development type/ pre-production model
Working documentation Organization of short-run production

84
Increase in scale of operations Miscellaneous
4.2.5. Degree of novelty of the work
Degree of novelty Notes There is no analogues
Improved consumer characteristics of the best world analogues
Improved consumer characteristics of the best domestic analogues
Import substitution Miscellaneous
4.2.6. Works, carrying out in the same field of specialization . (Title of the work, year, authors, institution, etc.) 4.2.6.1. Works-predecessors 3-4 basic works, underlay the project. (year, authors, institution, etc.) 4.2.6.2. Please, give explanations if there is no analogues - You were the first who set this problem, - You had technical means to realize the task ahead of the others. - Some other reasons 4.2.7. Importance of the project 4.2.7.1. The project is of the following level of importance: Regional Country International 4.2.7.2. Possible consequences after realization of the project (improvement of quality of life, decreasing of raw material and energy supply expenses, etc.)
4.2.7.3. What resources can be spared due to realization of the project on the regional, country and international levels (economy due to the rational utilization of resources, import substitution, etc.) 4.3. ENVIROMENT OF THE PROJECT 4.3.1. Competitors in this field of specialization

85
4.3.1.1.What organizations and researchers are working out on the same problem in Russia and abroad? 4.3.1.2.Whom of them do you keep in touch with? 4.3.1.3.What are their results like in comparison with yours? What items have you taken the lead over and where are you behindhand? 4.3.1.4.Are there any problems (on the project) you have been working out that have been already solved by your competitors? 4.3.1.5.Who is universally recognized leader in this field of specialization? 4.3.1.6.What is your evaluation of your own level in comparison with the world leader? 4.3.2. Do external organizations (including state organizations) support the
project? 4.3.3. Are there any external organizations that can be interested in realization of
the project? 4.4 RESULTS 4.4.1. What scientific results do you plan to achieve? 4.4.2. What practical results do you plan to achieve? 4.4.3. Possible trends of practical application.
What economical spheres the project results can be used in? What are the concrete fields (enterprises) where the project results can be applied? Will the project results require licencing (inspection certification)?
4.4.4 What form can your results be used in? Construction, device Technology Materials, matter, substance Live organisms Other 4.4.5. What can be proposed for a sale? Licence Engineering/Technical device Drug Software products Technology Other 4.4.6. Comparison characteristics
Technical and economic (consumers)characteristics Characteristic New development work Analogue 1 Analogue 2 1 2

86
3 … …
4.4.7. What works and researches are necessary for obtaining results that can have
practical application? Please, indicate, if it is possible, time, financing rate, organizations that are necessary to carry out the works.
Possible consequences after industrial application of research results.
(how does realization of the project results interact with existent technological processes; is essential modification of existent technological processes required?) 4.5. INTELLECTUAL PROPERTY 4.5.1. Forms of legal assistance of intellectual property the project has been started with Invention Trade model Production piece, industrial standard Trade mark Scientific publication Software Database Topology of integrated circuit KNOW-HOW 4.5.2. Objects of intellectual property that are to be legalized on completion of the project Invention Trade model Production piece, industrial standard Trade mark Scientific publication Software Database Topology of integrated circuit 4.5.3. Owner of intellectual property on the project. What are those rights based on? 4.5.4. Publications representing works on the project. 4.5.5. What exhibitions, conferences with materials on the project theme have you taken part in?
87
4.5.6. Are there any agreements on acquisition of the rights regarding the project results? 4.5.7. Is there financial and organizational support of exterior organizations? 4.6. Other projects the respondent have taken part in Content of the present issue corresponds to Issue 4. 4.7. Other projects carrying out in the subdivision Content of the present issue corresponds to Issue 4.
88
Annex 5 Technology Transfer Offices Transferring ownership of government funded IP to the university or research institute where it was created is a necessary, but not sufficient step toward the creation of an effective technology commercialization system. To bridge the so-called “exploitation gap,” – i.e., the gap between the number of inventions that are created and the number that are actually put to commercial use -- many countries found that it was also essential to establish specialized institutions with trained personnel dedicated to licensing this IP to those foreign and domestic enterprises who will invest the time and resources required to develop commercially viable products based on this IP. These specialized institutions -- Technology Transfer Offices (TTO)72 as they are known in the US and Industrial Liaison Offices (ILO) as they are known in the United Kingdom -- generally perform the following range of functions: apply for domestic and foreign patents, pay the necessary patent application and annual patent maintenance fees, license the patented IP, enforce ownership rights against alleged infringement, collect royalties from license holders, and distribute royalties according to a pre-determined formula between the TTO (to cover administrative expenses), the institute our university where the IP was invented, and the inventor(s).73 Although TTOs are not designed to be self-supporting profit centers, US experience suggests that they can eventually become self sustaining within approximately 10 years. In most successful Technology Transfer Office, gross royalties and licensing fees generated by the TTO generally amount to between 0.5% and 2% of the institute’s or university’s annual research budget.74
72 For a review of several US universities’ experience with TTOs, see Raymond Smilor and Jana
Matthews, “University Venturing: Tech Transfer And Commercialization In Higher Education,” unprocessed, 2002.
73 A well functioning TTO can be a tool to help attract investors to a region and establish partnerships
between local and foreign business on the one hand and the university on the other. In this respect, a TTO can be an important ingredient in a comprehensive regional development program.
74 As this data suggests, the real economic value of establishing TTOs and clarifying IP ownership has
little connection to the ensuing licensing fees. On average, these fees are rather meager. Rather, the economic value to the government and society is derived from the economic activity generated by the commercialization process itself. This includes the establishment of new high tech SMEs, the creation of well paying, skilled jobs and the additional tax revenues generated by this additional economic activity. To the extent that a concern about the distribution of royalties detracts from the creation of an effective IP commercialization system, the Latvian economy will lose not only royalties, but jobs, new businesses and taxes.
89
Annex 6 Technology Transfer Office Procedures75
LEGAL STATUS
At Texas A&M University, the CTT is a department within the university, similar to any other academic or administrative department or unit within the university. Thus, CTT employees are employed by the Government of the State of Texas (not the National Government) just the same as any faculty member in the university. All universities in the United States are locally administered; there are no Nationally-funded universities.
Many of the National research agencies and research institutes, such as the National Science Foundation or the National Institutes of Health, have CTTs to transfer the agency's innovations to commercial application. These CTTs are departments in the national agencies and hold no independent status. For instance, the "Office of Technology Transfer" or "OTT" for the National Institutes of Health, the largest National government research agency in the United States, is very well described on its website: http://ott.od.nih.gov/
However, there are MANY different structures for CTTs, such as:
* An office established within the university as a university department
* An external CTT, established as a "for profit" organization
* An external CTT, established as a "not for profit" organization
* A combination of both an internal office within the university, and an external organization, working together in a well-defined process
* Outsourcing technology transfer, by contracting with an external organization (a for-profit company, another university, or other organization) to manage all innovations
* Outsourcing technology transfer, by contracting with an external organization to manage selected projects
ACCOUNTING - RECEIPT AND DISTRIBUTION OF INCOME
At Texas A&M University, the CTT (a department within the university) receives income from the technology transfer agreements with companies. The CTT places the income in a "revolving fund account" where the income is first deposited, and then distributed or disbursed in accordance with the University's policy - 15% transferred to a
75 This annex was prepared by Terry A. Young, Assistant Vice Chancellor for Technology Transfer and
Executive Director, Technology Licensing Office, The Texas A&M University System, Mail Stop 3369, College Station, Texas 77843-3369. Telephone: 979-847-8682. EM address: [email protected] .
90
CTT account for CTT operations; 21.25% to an account in the University President's office; 21.25% to an account for the inventor's laboratory or department; and 42.5% to the inventor personally. At any point in time, on an accrual accounting basis, the balance in the revolving fund account managed by the university CTT should always be "zero."
As for funding of patents, CTTs in the United States expect the companies receiving the innovations for commercial application to pay for the patent application costs, as a "cost of doing business" or a "cost of goods sold," similar to labor costs or material costs. In the Top 25 Research Universities in the United States, there is much variance in the success of the institutions in receiving reimbursement of patent expenses, ranging from 16% of expenses funded by industry at the California Institute of Technology to 90% of expenses funded by industry at the University of Pennsylvania.
For patents funded "at risk" (without a company to reimburse the costs), there are a variety of sources for securing the funds. In a recent survey of the Top 25 Research Universities in the United States, 23 of the 25 institutions responded to the survey. One of the questions asked was: "What is the source of funding for patent applications prosecuted at risk (without a licensee to reimburse/fund expenses)?" Responses (23):
8 - Patent expenses funded from royalty income accumulated over time in the CTT.
14- Patent expenses funded from university accounts; university funds were (i) allocated to the TLO in an annual budget for TLO management; OR (ii) controlled by the Vice President for Research or other university official; OR (iii) provided by departments of faculties (colleges) for inventions arising from the applicable department or faculties (college); OR (iv) combinations of the above sources.
1 - Patent expenses funded by an external organization.
No National Governmental funds are available to CTTs in the United States to pay for patent applications.
START-UP COMPANIES
There are approximately 200 university CTTs in the United States. Accordingly, there are an equal number of ways that universities manage start-up companies. Every university has a different set of policies, procedures and attitude towards start-up companies. Some universities are very supportive of start-up companies and participate in their formation. Other universities may not participate in start-up companies in any manner. Additionally, other countries manage their start-ups differently. For instance in the United Kingdom, there is an organization called UNICO which represents "UNIversity COmpanies"....these are external companies formed for the sole purpose of creating start-up companies based upon a university's technology. Typically, a UNICO is owned - in whole or in part - by the associated university. For details, see:
http://www.unico.org.uk/
91
Other potential resources of interest are:
1. A law of the State of Texas which makes it possible for university faculty members to participate in start-up companies:
http://www.capitol.state.tx.us/statutes/ed/ed0005100.html#ed207.51.912
2. A law of the State of Texas - entitled "Centers for Technology Development and Transfer" - which provides the rules for universities in the State of Texas to participate in the establishment of start-up companies:
http://www.capitol.state.tx.us/statutes/ed/ed0015300.html#top
3. The Regulation of the The Texas A&M University System which gives the CTT the authority to manage the innovations resulting from university research:
http://sago.tamu.edu/policy/17-02-01.htm
4. The Protocol of the CTT which explains how the CTT manages intellectual property rights and innovations:
http://tlo.tamu.edu/documents/INFO/tloprotocol.pdf
92
Annex 7 Technology Incubators Most of the existing incubators in transition countries are little more than custodial care centers. They are primarily controlled work spaces designed initially to help fledgling firms survive in the midst of a hostile environment – one in which land is difficult to rent, utility connections are difficult to organize, and petty harassment (or worse) from bureaucratic inspectors is an unfortunate but common fact of life. Once a firm enters one of these incubators, it is under no pressure to leave. Many Russian high tech SMEs, for example, have remained in these incubators for ten or more years. These custodial incubators may have served a useful purpose during the early phase of the transition process. But today, their custodial function is best served by eliminating the administrative barriers hampering the emergence of new SMEs and the growth of existing SMEs. This sort of incubator, in other words, should be supplanted by the rule of law and clear, transparent and sensible business regulations.76 At the same time, Latvia should support the development of the type of commercially oriented incubators found for example in Israel, Europe and the US.77 These incubators can be defined as “A location in which entrepreneurs can receive pro-active, value-added support, and access to critical tools, information, education, contacts, resources and capital—that may otherwise be unaffordable, inaccessible or unknown. A technology incubator’s management team facilitates the interaction between each business and these resources, and coaches each business through a development process such that the resulting venture provides all participants with an acceptable rate of return on their investment.”78 More specifically, a well structured incubator provides (i) links to industry, universities and research institutes, (ii) business support services to enhance and develop business, (iii) daily hands-on managerial mentoring (general management, finance, accounting, marketing, production, R&D), (iv) technological advice and assistance with intellectual 76 Footnote to FIAS report … 77 For a description of the Israeli incubator system, see http://incubators.org.il . The EU has a very
progressive and comprehensive incubator development program for 2001-2005. The legal framework for this program and other documentation can be found at http://europa.eu.int/comm/enterprise/smie/overviewmenu.cfm . The legal foundation for this program can be found in COUNCIL DECISION of 20 December 2000 on a multi-annual programme for enterprise and entrepreneurship, and in particular for small and medium-sized enterprises (SMEs) (2001-2005) (2000/819/EC), Official Journal of the European Communities, 29.12.2000. For a discussion of European incubators, see European Commission, Enterprise Directorate General, Final Report, Benchmarking Business Incubators, February 2002, Prepared by the Centre for Strategy and Evaluation Services. For a recent analysis of best practices in US incubators, see A National Benchmarking Analysis of Technology Business Incubator Performance and Best Practices, US Department of Commerce, April, 2003, available at http://www.technology.gov/reports/TechPolicy/NBIA/2003Report.pdf .
78 Technology Innovation Centers: A Guide to Principles and Best Practices, Report prepared for the US
Department of Commerce by Claggett Wolfe Associates, December 1999, p. 1.
93
property protection, (v) financial resources for R&D and initial marketing expenses, (vi) access to potential private investors and strategic partners, and (vii) training and coaching so that entrepreneurs have a better understanding of how to deal with potential foreign investors and strategic partners. By the end of the incubation period, the enterprise should be able to raise additional funds from investors and continue operating the project independently.79 These incubators operate under a rigorous selection process. Not all firms that apply for entry are accepted. An entrant typically pays for the incubator’s services by giving the incubator operator a predetermined share of equity in the new venture. Finally, incubators operate under a rigorous “up or out” procedure. Firms typically remain in the incubator for no more than two years. At the end of that time period, they are either a commercial success, and therefore no longer eligible to remain in the incubator, or a commercial failure, in which case they are obliged to leave the incubator in order to make room for more promising candidates. As part of their long term relationship-building processes, these new-style Latvian technology incubators could use internships and marketing arrangements to establish links with incubators promoting similar technologies in the US, Europe and Asia. In addition, these incubators could be encouraged to establish linkages with leading venture capital funds in Asia, Europe or the US that specialize in the development of related technologies. These venture capital funds are typically supporting a portfolio of firms that need to solve complex technological problems before they can bring a technology to market. Latvian firms can offer to conduct contract research or other high tech services for those firms under the tutelage of US or European venture capitalists. Over time, these lower level commercial research relationships might result in the creation of strategic alliances or second generation joint ventures which could be funded by the venture capitalists. The objective, in other words, would be to ensure that Latvian high tech enterprises develop the relationships and linkages with demanding customers that the enterprise needs if it is to move to progressively higher levels on the global value chain.
79 Adopted from Timo Hokkannen, unpublished IFC manuscript, November 2001.
94
Annex 8 The US Government’s SBIR Program Government support for basic research in most countries stops before commercialization is feasible. As noted in a recent OECD report, “The Government’s role in market economies should remain simple, namely: aim to diminish the innovation risk for the concerned parties. Governments must use market forces to stimulate innovations. In doing so, they reduce the probability of technical and commercial failure in the innovation process and increase the rewards for all involved, typically academia and industry. Academics and businessmen have different interests in the process. Academic scientists generally have no resources, no stimuli to continue research beyond the point at which it is reasonable to expect publication in a scientific journal. Industry finds this point in the research process still fraught with risks, for the knowledge available at this moment is still very remote from being able to be assessed in market terms, i.e., to be able to calculate any rate of return on the probable investments. Bridging this gap, the so-called ‘innovation barrier,’ should be a primary objective of Government R&D spending.”80 There are a number of ways to accomplish this objective. For example, the Small Business Innovation Research (SBIR) program sponsored by the US Small Business Administration (SBA) is one interesting approach to bridging the innovation barrier. SBIR, which was established by the US Congress in 1977 and has been in operation continuously since then. 81 The impetus for the program was the growing realization that US industry was losing its global competitive advantage to such “newcomers” as Japan. Therefore, US science had to be enlisted in the struggle to regain industrial and technological supremacy. The design strategy was to provide a segment of federal R&D funding for advanced, applied research that would focus on small, high tech firms, innovation, and increasing the economic return from government-funded R&D. It is important to emphasize that SBIR funds ideas rather than companies. The objective is to determine the commercial feasibility of ideas and to convert research into commercial applications.
80 Baruch Raz, “National Frameworks for Encouraging Cooperation Between Science and Industry: The
Case of Israel,” Paper presented at the at the Helsinki Seminar on “Innovation Policy And The Valorisation Of Science And Technology In Russia,” March 1 –2, 2001 available at the web site address http://www.oecd.org/dsti/sti/
81 For details of the SBIR program and results of recent evaluations see R.T. Tibbetts, “The Importance of
Small High-Technology Firms to Economic Growth – and How to Nurture Them,” Proceedings of the Conference on Technology Transfer and Innovation, Commonwealth Institute, London, July 2000. Also see, David Audretsch, “The Dynamic Role of Small Firms, Evidence from the US,” World Bank Institute Working Paper, 2001. Applications and official SBIR program details are available on the US Small Business Administration’s web site at www.sba.gov The SBIR program was renewed by Congress in 1996 with no dissenting votes. Among the firms that received early stage financing from SBIR are Apple Computer, Chiron, Intel and Compaq. A description and summary of several evaluations of the SBIR program is available in Wendy Schacht, “Small Business Innovation Research Program,” Congressional Research Service Report for Congress, December 28, 2000.
95
The US program operates as follows:
• Ten participating agencies are required by law to allocate 2.5% of their research budget to the SBIR program. In 1977, SBIR allocated $1 million to 42 recipients. More recently, SBIR made 3500 grants totaling $1.4 billion.
• Grants are awarded at least annually on a peer-review, competitive basis. There are two, publicly funded phases. Phase I grants provide $100,000 for a six month initial investigation into the technical and commercial feasibility of an idea. Approximately 1/7 of all applicants receive Phase I support. Phase II grants provide $750,000 of support for an additional two years of commercial feasibility studies, production of a prototype, etc. Approximately 40% of phase I recipients qualify for Phase II support. By the end of Phase II, the concept should be able to attract private angel or venture capital. Seen from this perspective, the SBIR program generates deal flow for venture capitalists and candidates for incubators.
The success of the US program is predicated on several critical design features:
• IPR belongs to the SME that commercializes the idea; not to the Government. In fact, the Bayh-Dole Act was passed, in part, to facilitate the operation of SBIR.
• SBIR funds are provided in the form of grants. The recipient is not expected to repay the government irrespective of whether his project is a success or failure. The return to the Government comes in the form of the additional taxes generated by a globally competitive, rapidly growing high tech SME sector. [NOTE: Recent studies estimate that the extra tax revenues generated by the 30 most successful SBIR projects compensated the Government for the entire lifetime cost of the SBIR program.] Venture capitalists would be deterred from providing the necessary follow on financing if SBIR recipients were expected to repay the government with a share of profits or royalties from the sale of products. In other words, the Government should not operate as a senior partner with a senior claim on profits or revenues.
• SBIR recipients are not required to provide any matching funds. The objective of the program is to finance and explore the commercial feasibility of high risk/high return ideas. A matching fund requirement would destroy this concept support only to those ideas that have already demonstrated sufficient commercial feasibility to attract private matching funds. It would not help to uncover those high payoff ideas that need additional time and money to demonstrate commercial potential.
The SBIR program generates several major economic development benefits for the US economy. First, it provides high tech entrepreneurs with the start up capital they need to explore the commercial feasibility of high risk research ideas. Venture capitalists traditionally have little interest in providing this early stage financing. Second, it fosters the commercialization of government funded R&D. Third, it establishes productive, commercial linkages between high tech SMEs and Government-funded research priorities. And finally, “graduates” of the SBIR program are an excellent source of deal flow for venture capitalists.