Embed Size (px)
Citation preview

· . NASSAU COUNTY CRIMINAL JUSTICE COORDINATING COUNCIL
1 \ ".
I(f\ \\ \, _______ ------'""''c...:'---, _
CRIME AND JUSTICE IN .'
NASSAU COUNTY 1979 - 1988
HON. THOMAS S. GULOTTA, COUNTY EX.ECUTIVE
EILEEN J. MASCIA, DEPUTY DIRECTOR
If you have issues viewing or accessing this file contact us at NCJRS.gov.

U.S. Department of Justice Ni~t1onallnslitute of Justice
125208
This document has been reproduced exactly as received from the person or organization originating it. Points of view or opinions stated in this document are those of the authors and do not necessarily represent the official position or policies of the National Institute of Justice.
Permission to reproduce this copyrighted material has been granted by
Nassau County Criminal Justjce CoordinaJting~C~Q~l1~nuc~j~J~ ________ __
to the National Criminal Justice Reference Service (NCJRS).
Further reproduction outside of the NCJRS system requires permission of the copyright owner.
We wish to acknowledge the cooperation in the development of
this report of the Data Processing Bureau of the Nassau CQunty
Police Department, the assistance of William Dwyer and Jeffrey
Colton of the District Attorney's Office, and Bob Giblin of the
Bureau of Statistical Services, New York State Division of
Criminal Justice Services.
Research development relative to this report was undertaken
by Steven Martone, Fiscal Analyst, JoAnn Zahn, Research Analyst,
Robert Weisse, Research Analyst and Edward T. Zelles, Research
Coordinator who coordinated the development of this report. Each
are to be commended for performing their assignments with dedication,
scholarship and professionalism.
A special thanks to Jacqueline Mahoney for her typing of this
report.
Eileen J. Mascia Deputy Director

PART I
APPENDIX A
SECTION I
TABLE I
TABLE II
TABLE III
TABLE IV
SECTION II
TABLE V
TABLE VI
TABLE VII
SECTION III
TABLE VIII
SECTION IV
TABLE IX
TABLE OF CONTENTS
Part I Offenses Summary of Crime Analysis
INCIDENTS OF PART I MAJOR CRIMES
Major Crimes Categories 1979 to 1988
Graph, Total Crime, Burglary & Robbery 1979 to 1988
Crime rate per 100,000 Population
Comparison rate Nassau County/ New York State - Crime Rate Per 100,000 Population
Clearance Rate/Part I Offenses Ten Year Analysis (1979-1988) in the Clearance of Part I Offenses
IMPACT CRIMES
ROBBERY
Location of Robberies
Method of Robberies
Handgun use in Robberies
BURGLARY
Residential/Non-Residential Burglaries
INCIDENTS OF PART II CRIME
Part II Crimes 1979-1988
Graph Part II Crimes
INCIDENCE OF CRIME TYPE BY COMMUNITY
Incidence of Crime Type by Community of Occurrence 1988 & 1987
Total Criminal Incidents
PAGE
1 2-4
5-12
5
6
7
8
9
10-12
13-20
13
14
15-16
17-20
21-22
21
22
23-39
24-35
36

TABLE X-A
TABLE X-B
TABLE X-C
SECTION V
TABLE XI
TABLE XI-A
TABLE XI-B
TABLE XI-C
TABLE XII
APPENDIX B
PART II
TABLE I
TABLE II
TABLE III
TABLE IV
APPENDIX A
Number of Incidents 37 1988 Community Rankings
Incidents per 1,000 Residents 38
Impact Crimes per 1,000 Residents 39
ARRESTS 40-51
Total Arrest by Crime Type - 41-43 Part I, Part II Nassau County
Graph - Total Arrests Part I 44
Graph - Total Arrests Part II 45
Graph - Total Arrests Part I & 46 Part II
An Analysis of Arrestees 47
Age of Arrestees
Age of Persons Arrested by Crime
Juvenile Arrestees of Part I Offenses
Arrestee Characteristics - Sex, Race
COMMUNITY RANKING IMPACT CRIMES 1988-1987
YOUTH OFFENSES
ANALYSIS OF YOUTH ARRESTS
Part I Arrests
Age & Sex Characteristics cf Youthful Offenders
Arrest by Offenses 15 & Under
Arrest by Offenses 16-21
Age Distribution 1970-1980
48
49
50
51
52-59
60-66
60-61
62
63
64
65
66

PART III
TABLE I
TABLE II
PART IV
SECTION I
TABLE IA
TABLE IB
TABLE II
TABLE III
TABLE IV
TABLE V
TABLE VI
ANALYSIS OF INMATE POPULATION NASSAU COUNTY CORRECTIONAL CENTER 1984-1988 67-70
Admission Characteristics 68-69 -Sex -Race -Age -Education
Sentenced Characteristics -Age
70
FELONY CASE PROCESSING 71-90
PREFACE - Methodology of Part II Preparation 71
OVERVIEW OF FELONY CASE PROCESSING FLOW
Graph One Nassau County Felony
72
Processing Flow 73
Total Felony Cases Processed 74
Total Felony Cases Disposed 74
Types of Dispositions 75-76
Types of Dispositions All 77-78 Felonies - County Court
Types of Dispositions - Robbery, £u~glary and Narcotics -County Court 79-81
Types of Sentences - All Felonies County Court 82
Types of Sentences - Robbery, 83-85 Burglary and Narcotics -County Court
Graph Two Sentences on Conviction on Indictments & Superior Court Information - County Court - All Felonies 86
Graph Three Sentences on Conviction on Indictments & Superior Court Information - County Court - All Robberies 87

TABLE VII
SECTION II
'l'ABLE VIII
TJ.\BLE IX
TABLE X
TABI.E XI
TABLE XII
Graph Four Sentences on Conviction on Indictments & Superior Court Information - County Court - All Burglaries 88
Graph Five Sentences on Conviction on Indictments & Superior Court Information - County Court - All Narcotics Cases 89
Case Processing Time - County Court 90
DISTRICT COURT ACTIVITY 91-105
Types of Dispositions - Felonies District Court 92
Types of Dispositions - Robbery, Burglary and Narcotics -District Court 93-95
Types of Sentences - Felonies -District Court 96
Types of Sentences - Robbery --District Court 97
Types of Sentences - Burglary -District Court 98
Types of Sentences - Narcotics Cases - District Court 99
'Graph Six Sentences for Felonies Disposed of in District Court 100
Graph Seven Sentences for Robberies Disposed of in District Court 101
Graph Eight Sentences for Burglaries Disposed of in District Court 102
Graph Nine Sentences for Narcotics Cases Disposed of in District Court 103
Case Processing Time - District 104-105 Court

SECTION III ANALYSIS OF HIGH CHARGE AT ARREST VS. CHARGE AT CONVICTION 106
TABLE XIII County Court Felony Convictions 1984-1988 107-108

APPENDIX A
PART I OFFENSES
lao Murder and Non-Negligent Manslaughter
lb. Negligent Manslaughter
2. Rape:
3.
4.
5.
6.
7.
Forcible Rape Attempted Forcible Rape
Robbery:
Handgun Cither Firearm Knife or Cutting Instrument Other Dangerous Weapon Strong-Arm
Assault:
Handgun Other Firearm Knife or Cutting Instrument Strong-Arm
Burglary:
Forcible Entry Unlawful Entry-No Force Attempted Forcible Entry
Larceny-Theft (except motor vehicle theft)
Motor Vehicle Theft:
Automobiles Trucks and Buses Other Vehicles
1

AN ANALYSIS OF PART I CRIME 1988
A number of observations can be made as a result of the Crime Analysis compiled by the Criminal Justice Coordinating Council.
Part I (MAJOR) Crime decreased by 1.6% from 1987 to 1988
VIOLENT CRIMES increased by 5.2% from 1987 to 1988
The CLEARANCE RATE for MAJOR CRIMES increased from 16.6% in 1987 to 19.7% in 1988. The CLEARANCE RATE increased for Burglary, (10.6% - 1987 vs. 16.1% in 1988) Robbery (29.2% - 1987 vs. 31.3% in 1988) and Motor Vehicle (9.6% -1987 vs. 15~2% in 1988) over the prior year.
Overall PROPERTY CRIME decreased 2.1% from 1987 to 1988. There was a significant decrease (10.7%) in the number of Burglaries.
Of the 1,636 ROBBERIES in 1988, a handgun was used in 451 incidents and 94 of these incidents occurred in the street. This represents a 18.3% decrease when comparing the same factor to 1987.
AN ANALYSIS OF·THE TEN YEAR 1979-1988 TREND IN PART I CRIME
The total number of Part I (MAJOR) CRIMES for 1988 (43,777) as compared to 1979 (51,991) represents one of the lowest reported crimes in this ten year period.
We note that during this ten year period 1979-1988 there was an overall decrease of 15.8% in total crime. However, there was an increase of 49.8% in VIOLENT CRIMES, specifically the crimes of ROBBERY increased (26%), ASSAULT (82.3%) and RAPE (88.3%)
Our analysis also indicates that there was an increase of 85% when comparing VIOLENT CRIME to PROPERTY CRIME Ratio from 1979 (.0467) to 1988 (.0863)
For the period of 1979-1988 PROPERTY CRIME decreased by 18.9%. There were also significant decrease in BURGLARY (35.2%) and LARCENY (23.8%) during this ten year period.
2

AN ANALYSIS OF THE TEN YEAR 1979-1988 TREND CRIME RATE PER 100,000 POPULATION
A review of TABLE II, indicates that the total number of VIOLENT CRIMES per 100,000 has increased 101.5 per 100,000 when comparing 161,4 per 100,000 in 1979 to 262.9 per 100,000 in 1988.
In contrast, PROPERTY CRIME has decreased 371.7 per 100,000 when comparing 3417.6 per 100,000 in 1979 to 3045.9 per 100,000 in 1988.
AN ANALYSIS OF ROBBERY 1979-1988
A review of TABLE V indicates an increase of 26% in the incidence of ROBBERY when comparing 1979 to 1988. This increase can be attributed to the increase in the frequency of convenience stores (216%) and residential (98%) robberies.
AN ANALYSIS OF BURGLARY 1979-1988
An examination of TABLE I indicates a decrease of 35.2% from 1979-1988. This is the eighth consecutive year that the incidence of BURGLARY has declined from a high of 15,687 in 1980 to 8,094 in 1988.
AN ANALYSIS OF RESIDENTIAL'BURGLARY 1981-1988*
An examination of the eight year trend of BURGLARY in Nassau County indicates that Residential Burglaries continue to be the prime target.
When comparing 1981 (70%) to 1988 (60%) the percentage of. Residential to total burglaries indicates a decline of Residential burglaries to total burglaries.
* Prior years data not available
AN ANALYSIS OF PART II CRIME 1988
Part II Crimes showed no significant increase from 1987 to 1988
The following crimes showed significant increases from 1987 to 1988:
3

AN
1987 1988 Drug Offenses (32.6% 2,282 3,026 Arson (38.2%) 89 123 D.W.I. (12.4%) 4,808 5,407
We note a decrease in the following Part II Crimes when comparing 1987 to 1988:
1987 1988 Criminal Mischief (5.9%) 16,026 15,070 Burglar's Tools (58,.S%) 617 254
ANALYSIS OF THE TEN YEAR 1979-1988 TREND IN PART II CRIME
An examination of TABLE VIII indicates that Part II incidents are down 2.7% from 1979 to 1988. However, there were significant increases in the following crimes:
Drug Offenses Sex Offenses Stolen Property Fraud D.W.I. Simple Assault
(105.7%) ( 70.3%) ( 78.1%) (264.8%) (102.4%) ( 87.9%)
The following crimes decreased during the period of 1979 to 1988:
Arson Criminal Mischief
(46.8%) (23.2%)
The data which is the subejct of our analysis was provided by the New York State Division of Criminal Justice Services, the F.B.I.'s Uniform Crime R~porting System and the Nassau County Police Department.
4
SECTION I
INCIDENTS OF PART I
MAJOR CRIMES

As demonst~ated in TABLE I; the ~epo~ted total of 43,777 incidents in 1988 of PART I c~imes ~emains one of the lowest total of
~epo~ted ceimes Clueing the ten yea~ peeied 1979-1988.
TABLE I
*NASSAU COUNTY
MAJOR CRIME CATEGORIES 1979-1988
%Change CRnlE 1979 1980 1981 1982 1983 ·1984 1985 1986 1987 1988 1987-88
**MURDER 38 34 47 34 55 55 39 49 45 39 (13.3)
RAPE 77 74 83 94 113 126 138 137 142 145 2.1
ROBBERY 1,298 1,549 2,021 1,869 1,768 1,617 1,573 1,675 1,669 1,636 ( 2.0)
ASSAULT 910 1,014 933 1,013 900 1,217 1,152 1,357 1,451 1,659 14.3
VIOLENT CRIMES 2,323 2,671 3,084 3,010 2,836 3,015 2,902 3,218 3,307 3,479 5.2
BURGLARY 12,498 15,687 15,481 12,136 11,079 9,623 9,456 9,093 9,068 8,094 (10.7)
LARCENY 31,269 30,298 29,784 27,768 25,313 26,106 27,141 24,777 25,286 23,839 ( 5.7)
AUTO THEFT 5,901 5,565 6,275 6,329 6,399 6,882 7,OC5 6,688 6,808 8,365 22.9
PROPERTY CRIME 49,668 51,550 51,550 46,233 42,791 42,611 43,602 40,558 41,162 40,298 ( 2.1)
VIOLENT/PROPERTY CRIME RATIO .0467 .0518 .0598 .0651 .0662 .0707 .0665 .0793 .0803 .0863
TafAL 51,991 54,221 54,624 49,243 45,627 45,626 46,504 43,776 44,469 43,777 ( 1.6) CRmE
*lncludes all data repo~ted by the Nassau County Police, Independent and City Police Depa~tments. **Includes Negligent and Non-Negligent Homicide.
5
%Change %Change 1988 5 Yr. 10 Yr. NCPD 1984-88 1979-88 ONLY
(29.1) 2.6 25
15.1 88.3 86
1.2 26.0 1,042
36.3 82.3 S82
15.4 49.8 2,035
(15.9) (35.2) 5,895
( 8.7) (23.8) 18,088
21.5 41.8 6,865
( 5.4) (18.9) 30,848
.0659
( 4.1) (15.8) 32,883
----~

'ro.rAL CRIME ***********
1979
1980
1981
1982
1983
1984
1985
1986
1987
1988
BURGLARY ********
1979
1980
1981
1982
1983
1984
1985
1986
1987
198B
ROBBERY *******
1979
1980
1981
1982
1983
1984
1985
1986
1987
1988
10,000 20,000 J I
3,000 6,000 I I
\
500 1,000 I -1
30,000 I
9,000 1
40,000 50,000 I 1
I 51;991 154,
J49,243
45,627
45,626
J 46,504
143,776
144,469
J 43, 777
12,000 15,000 J I
J 12,498 J 15
] 15,4
J12,136
I
,687
81
J 11,079
J 9,623
J 9,456 9,093
J 9,068
18/094
1,500 . 2,000 2,500 I I J
11, 298 J 1,549
J2,021
\1,869
J 1,768
1,617
J 1,573 1,675
1,669
J 1,636 c::

TABLE II
CRIME RATE PER 100,000 POPULATION *
Table II shows an illustration of the possibility of an average citizen being a victim of a crime in Nassau County.
CRIME 1979 1980 1981 1982 1983 1984 1985 1986 1987
VIOLENT 161.4 202.1 234.4 230.6 217.4 231.2 222.6 245.8 251.2
PROPERTY 3417.6 3900.8 3918.3 3451.6 3283.2 3267.3 3343.1 3097.4 3127.1
ROBBERY 90.5 117.2 153.6 143.2 135.6 124. 120. 127.9 126.8
BURGLARY 859.5 1187. 1176.6 929.9 850. 737.9 725. 694.4 688.9
PART I 3691.6 4108.4 4132.8 3726.0 3501.5 3498.2 3566. 3343.2 3378.3
PART II 2784.1 2921.1 2828.7 2768.8 2658.2 2696.7 2801.9 2882.8 2887.6
ALL OFF. 6362.1 7025.7 6982.6 6542.2 6159.7 6195.7 6368.3 6226. 6266.
**NASSAU POPULATION 1979 1,453,309 1984 1,304,236 1980 1,321,582 1985 1,304,236 1981 1,315,685 1986 1,309,441 1982 1,305,491 1987 1,316,308 1983 1,303,389 1988 1,322,988
*Includes all data reported by the Nassau County Police Department, Independent Village and City Fo1ice Departments. The CRIME RATE per 100,000 population as reflected in Table II is based upon Lilco estimated population figures which are slightly lower than the State estimate in Table III. See Table III for CRIME RATE PER 100,000 which is.based upon state estimated population figures.
** LILCO Estimate
7
1988
262.9
3045.9
123.7
611.8
3308.9
2975.5
6284.5

TABLE III
CRIME RATE PER 100,000* 1979-1988
%Change 1979 1980 1981 1982 1983 1984 1985 1986 1987 1988 1979-1988
NEW YORK CI.TY 8587.5 10094.7 10278.8 9744.2 8822.4 8397.1 8392.9 8866.7 9033.5 9799.2 14.1
MONROE 6818.7 6987.7 6592.1 6325.8 5974.0 5353.0 5373.7 5370.3 5573.8 5722.8 (16.1)
SUFFOLK 5414.1 6196.7 :;576.4 4909.8 4238.6 3813.6 3810.3 3871.8 4051.5 4249.4 (21.5)
ONONDAGA, SYRACUSE 5654.1 5567.6 5682.4 5097.1 4548.6 4448.5 4648.8 4638.0 5006.9 4736.8 (16.2)
ERIE/BUFFALO 4699.2 5346.8 5724.4 5037.3 4613.8 4422.2 4532.9 4591.7 4766.6 4774.0 1.6
WESTCHESTER/YONKERS 4561.3 5021.7 5026.0 4526.7 4022.0 3804.1 3841.0 4016.6 4110.2 4422.9 ( 3.0)
NASSAU 3691.6 4108.4 4132.8 3726.0 3425.7 3426.0 3465.2 3263.7 3350.9 3311.8 (10.3)
TaI'AL N.Y.S. 6097.0 6878.1 6903.6 6432.2 5836.2 5559.8 5566.7 5741.6 5931.5 6287.3 3.1
A review of this table shows that Nassau County has the lowest crime rate per 100,000 during the period of 1988 in comparison to other major populated areas in New York State.
A. further review of TABLE III reveals that Nassau County has the lowest crime rate per 100,000 when comparing Nassau County to other major counties and towns during the period of 1979-1988.
*SOURCE: Annual Report, New York State Division of Criminal Justice Services
8

CLEARANCE RATE PART I OFFENSES
An offense is cleared by arrest, or solved for crime reporting purposes, when at least one person is arrested,
charged with commission of the offense and remanded to the courts for trial. As shown below Table IV examines the
incidence and clearance rates for Part I Crimes in Nassau County for 1988.
TABLE IV CLEARANCE RATES FOR PART I OFFENSES
CRIME
1988 NASSAU COUNTY P.O. ONLY 1988
NO. OF NO. OF CLEARANCE NO. OF NO. OF INCIDENTS CLEARANCES RATE 1988% INCIDENTS CLEARANCES
MURDER 39 26 66.7 25 20 RAPE 145 69 47.6 86 47 ROBBERY 1,636 512 31.3 1,042 382 ASSAULT 1,659 1,016 61.2 882 667 BURGLARY 8,094 1,303 16.1 5,895 1,052 LARCENY 23,839 4,420 18.5 18,088 3,684 MCJI'OR VEHICLE 8,365 1,268 15.2 6,865 1,099
TOTAL 43,777 8,614 19.7% 32,883 6,951
9
CLEARANCE RATE 1988%
80.0 54.7 36.7 75.6 17.8 20.4 16.0
21.1%

AN ANALYSIS OF THE TEN YEAR TREND 1979-1988 IN THE CLEARANCE OF PART I CRIMES
An examination of the ten year trend in the clearance of Part I crimes indicates that the clearance rate has
increased from 13.6% in 1979 to 19.7% in 1988 while during the same period crime has dropped by 15.8%.
In the area of impact crime (Burglary & Robbery) the clearance rate over the ten year period has remained
relatively constant for the clearance of those two crimes.
CRIME
1979 1980 NO. OF NO. OF CLEARANCE NO. OF NO. OF CLEARAN9E INCIDENTS CLEARANCES RATE% INCIDENTS CLEARANCES RATE%
MURDER 38 33 86.8 34 30 88.2 RAPE 77 36 46.7 74 35 47.3 ROBBERY 1,298 369 28.4 1,549 429 27.7 ASSAULT 910 605 66.5 1,014 674 66.5 BURGLARY 12,498 1,940 15.5 15,687 2,705 17.2 LARCENY 31,269 3,714 11.9 30,298 3,765 12.4 MOTOR VEHICLE 5,901 383 6.5 5,565 353 6.3
TOTAL 51,991 7,080 13.6% 54,221 7,991 14.7%
10

CRIME .
1981 . 1982 NO. OF NO. OF CLEARANCE NO. OF NO. OF CLEARANCE INCIDENTS CLEARANCES RATE% INCIDENTS CLEARANCES RATE%
MURDER 47 41 87.2 34 29 85.3 RAPE 83 41 49.4 94 '32 34. ROBBERY 2,021 405 20. 1,869 471 25.2 ASSAULT 933 583 62.5 1,013 690 68.1 BURGLARY 15,481 2,025 13.1 12,136 1,558 12.8 LARCENY 29,784 3,575 12. 27,768 3,781 13.6 MOTOR VEHICLE 6,275 368 5.9 6,329 360 5.7
TCYl'AL 54,624 7,038 12.9% 49,243 6,921 14.1%
CRIME
1983 1984 NO. OF NO. OF CLEARANCE NO. OF NO. OF CLEARANCE INCIDENTS CLEARANCES RATE% INCIDENTS CLEARANCES RATE%
MURDER 55 50 90.9 55 34 61.8 RAPE 113 56 49.6 126 55 43.7 ROBBERY 1,768 545 30.8 1,617 403 24.9 ASSAULT 900 625 69.4 1,217 831 68.3 BURGLARY 11,079 2,412 21.8 9,623 1,081 11.2 LARCENY 25,313 3,950 15.6 26,106 3,521 13.5 MCY.rOR VEHICLE 6,399 551 8.6 6,882 645 9.4
TO'l'AL 45,627 8,189 17.9% 45,626 6,570 14.4%
11

1985 1986 · CRIME NO. OF NO. OF CLEARANCE NO. OF NO. OF CLEARANCE
INCIDENTS CLEARANCES RATE% INCIDENTS CLEARANCES RATE%
MURDER 39 29 74.4 49 35 71.4 RAPE 138 69 50. 137 53 38.7 ROBBERY 1,573 415 26.4 1,675 453 27. ASSAULT 1,152 754 65.5 1,357 809 59.6 BURGLARY 9/456 996 10.5 9,093 1,086 11.9 LARCENY 27,141 3,644 13.4 24,777 3,748 15.1 MOTOR VEHICLE 7,005 719 10.3 6,688 540 8.1
TOTAL 46,504 6,626 14.2% 43,776 6,724 15.4%
1987 1988 CRIME NO. OF NO. OF CLEARANCE NO. OF NO. OF CLEARANCE
INCIDENTS CLEARANCES RATE% INCIDENTS CLEARANCES RATE%
MURDER 45 37 82.2 39 26 66.7 RAPE 142 75 52.8 145 69 47.6 ROBBERY 1,669 488 29.2 1,636 512 31.3 ASSAULT 1,451 862 59.4 1,659 1,016 61.2 BURGLARY 9,068 958 10.6 8,094 1,303 16.1 LARCEN":l 25,286 4,320 17.1 23,839 4,420 18.5 MOl'OR VEHICLE 6,808 652 9.6 8,365 1,268 15.2
TOTAL 44,469 7,392 16.6% 43,777 8,614 19.7%
12

SECTION II
IMPACT CRIMES

SECTION II IMPACT CRIME*
As shown in TABLE I the reported incidence of ROBBERY shows no significant change from 1987 to 1988.'
TABLE V
LOCATION OF ROBBERIES NCPD %Change ONLY
LOCATION 1979 1980 1981 1982 1983 1984 198.5 1986 1987 1988 1987-1988 1988
HIGHWAY/STREET 627 705 970 1,052 924 647 680 742 686 656 ( 4.4) 291
GAS STATION 107 120 251 227 194 219 188 167 226 155 (31.4) 130
CONVENIENCE STORE 97 148 148 117 84 246 213 265 242 307 26.8 285
BANKS 39 29 27 34 33 32 35 16 40 58 45.0 53
OTHER COMMERCIAL 277 350 364 277 260 46 60 48 48 89 85.4 56
RESIDENCE 86 119 154 114 79 121 121 117 157 170 8.3 99
MISCELLANEOUS 65 78 107 48 194 306 276 320 270 201 25.6 128
TOTAL 1,298 1,549 2,021 1,869 1,768 1,617 1,573 1,675 1,669 1,636 ( 2.0) 1#042
* Impact crime (Robbery and Burglary) have been identified by Nassau County as crimes meriting priority consideration because of the disruption of the lives of individuals who have been victimized.
13

TABLE VI
METHOD OF ROBBERIES % NUMBER OF % NUMBER OF % NUMBER OF % NUMBER OF % NUMBER OF
TECHNIQUE 1979 ROBBERIES 1980 ROBBERIES 1981 ROBBERIES 1982 ROBBERIES 1983 ROBBERIES
HANDGUNS 37.4 485 38.5 596 42.4 857 38.0 710 35.7 631 arHER FIREARM 1.8 24 2.3 36 2.4 49 2.3 44 2.0 35 KNIFE 11.9 155 11.4 176 12.0 243 13.3 248 14.1 250 arHER WEAPON 3."3 43 3.0 46 3.0 61 2.6 48 2.6 46 STRONG ARM* 45.5 591 44.'9 695 40.1 811 43.8 819 45.6 806 ,
1,298 1,549 2,021 1,869 1,768
METHOD OF ROBBERIES % NUMBER OF % NUMBER OF % NUMBER OF % NUMBER OF
TECHNIQUE 1984 ROBBERIES 1985 ROBBERIES 1986 ROBBERIES 1987 ROBBERIES
HANDGUN 36.7 594 31.7 499 31.8 533 2605 442 arHER FIREARM 3.1 50 2.2 35 2.'1 36 2.1 35 KNIFE 13.2 213 13.2 208 12.7 213 17.8 297 arHER WEAPON 21.6 350 22.9 361 21.6 361 19.2 320 STRONG ARM* 25.4 410 29.9 470 31.8 532 34.5 575
1,617 1,573 1,675 1,669
METHOD OF ROBBERIES NCPD ONLY % NUMBER OF % NUMBER OF
TECHNIQUE 1988 ROBBERIES 1988 ROBBERIES
HANDGUN 27.6 451 33.8 352 arHER FIREARM 2.3 37 2.5 26 KNIFE 12.2 199 11.2 117 arHER WEAPON 23.8 389 33:1 345 STRONG ARM* 34.2 560 19.'4 202
1,636 1,042
*Strong arm is defined as those crimes committed without the display of a weapon.

TABLE VII*
HANDGUN USAGE IN ROBBERIES
1980 . 1981 1982
NUMBER OF % OF NUMBER OF' % OF NUMBER OF % OF ROBBERIES ROBBERIES ROBBERIES ROBBERIES ROBBERIES ROBBERIES INVOLVING (HANDGUN) TO INVOLVING (HANDGUN) '1'0 INVOLVING (HANDGUN) TO
LOCATION HANDGUN ALL ROBBERIES HANDGUN ALL ROBBERIES HANDGUN ALL ROBBERIES ,
STREET ROBBERIES 130 18.4 225 23.2 236 22.4 GAS STATIONS 81 . 67.5 176 70.1 147 64.8 CONVENIENCE STORES 104 70.3 96 64.9 76 65.0 BANKS 17 58.6 15 55.6 20 58.8 OTHER COMMERCIAL
BUILDINGS 192 54.9 243 66.8 170 61.4 RESIDENCE 48 40.3 73 47c4 49 43.0 MISCELLANEOUS 24 30.8 29 27.1 12 25·0
TOTALS 596 38.5% 857 42.4% 710 38%
1983 1984 1985
NUMBER OF % OF NUMBER OF % OF NUMBER OF' % OF ROBBERIES ROBBERIES ROBBERIES ROBBERIES ROBBERIES ROBBERIES INVOLVING (HANDGUN) TO INVOLVING (HANDGUN) TO INVOLVING (HANDGUN) TO
LOCATION HANDGUN ALL ROBBERIES HANDGUN ALL ROBBERIES HANDGUN ALL ROBBERIES
STREET ROBBERIES 211 22.8 151 23.3 136 20.0 GAS STATIONS 126 64.9 131 59.8 99 52.7 CONVENIENCE STORES 52 61.9 142 57.7 113 53.1 BANKS 16 48.5 22 68.8 9 25.7 OTHER COMMERCIAL
BUILDINGS 149 57.3 26 56.5 28 46.7 RESIDENCE 29 36.7 46 38.0 50 41.3 MISCELLANEOUS 48 24.7 76 24.8 64 23.2
TOTALS 631 35.7% 594 36.7% 499 31.7%
* REFER TO TABLE V, Pg. 13 15

TABLE VII*
HANDGUN USAGE IN ROBBERIES
1986 1987
l\1lJMBER OF % OF NUMBER OF % OF ROBBERIES ROBBERIES ROBBERIES ROBBERIES INVOLVING (HANDGUN) TO INVOLVING (HANDGUN) TO
LOCATION HANDGUN ALL ROBBERIES HANDGUN ALL ROBBERIES
STREET ROBBERIES 183 24e7 115 16 .. 8 GAS STATIONS 87 52.1 91 40.3 CONVENIENCE STORES 114 43.0 117 48.3 BANKS 6 37.5 30 75.0 OIHER COMMERCIAL
BUILDINGS 22 45.8 12 25.0 RESIDENCE 47 40.1 37 23.6 MISCELLANF.oUS 74 23e1 40 14.8
TOTALS 533 31.8% 442 26.5%
1988 NCPD 1988
NUMBER OF % OF NUMBER OF % OF R.OBBERIES ROBBERIES ROBBERIES ROBBERIES INVOLVING (HANDGUN) TO INVOLVING (HANDGUN) TO
LOCATION HANDGUN ALL ROBBERIES HANDGUN ALL ROBBERIES
STREET ROBBERIES 94 14.3 45 15.5 GAS STATIONS 70 45.2 60 46.2 CONVENIENCE STORES 142 46.3 135 47.4 BANKS 37 63.8 34 64.2 OTHER COMMERCIAL
BUILDINGS 21 23.6 16 28.6 RESIDENCE 44 25.9 32 32.3 MISCELLANEOUS 43 21.4 30 23.4
TOTALS 451 27.6% 352 33.8%
*REFER TO TABLE V, Pg. 13 16

BURGLARY
Residences continued to be the main target of burglary in
Nassau County comprising 60.4% of the total burglaries reported
in 1988. Out of the 4,892 residential burglaries, 92% of the
burglaries, where the time of occurrence could be determined, 59%
occurred during the hours of 6 A.M. - 6 P.M. and 33% occurred
during the hours of 6 P.M. - 6 A.M. 68% of non residential
burglaries occurred during the hours of 6 P.M. - 6 A.M.
1988
FORCIBLE NO TYPE ENTRY PERCENT FORCE PERCENT
RESIDENTIAL 3,553 72.6% 942 19.3% NON-RESIDENTIAL 2,540 79.3% 446 13.9%
ATTEMPT NUMBER OF TYPE ONLY PERCENT BURGLARIES -RESIDENTIAL 397 8.1% 4,892 NON-RESIDENTIAL 216 6.7% 3,202
17

BURGLARY
1987
FORCIBLE NO TYPE ENTRY PERCENT FORCE PERCENT
Residential 4,265 71.6% 1,159 19.5% Non-Residential 2,498 80.3% 402 12.9%
ATl'EMPT NUMBER OF TYPE ONLY PERCENT BURGLARIES
Residential 533 8.9% 5,957 Non-Residential 211 6.8% 3,111
1986
FORCIBLE NO TYPE ENTRY PERCENT FORCE PERCENT
Residential 4,358 71.5% 1,225 20.1% Non-Residential 2,300 76.8% 487 16.3%
ATl'EMPT NUMBER OF TYPE ONLY PERCENT BURGLARIES
Residential 516 8.5% 6,099 Non-Residential 207 6.9% 2,994
1985
FORCIBLE NO TYPE ENTRY PERCENT FORCE PERCENT
~- --
Residential 4,717 72.7% 1.,,211 18.7% Non-Residential 2,347 79.1% 427 14.4%
ATTEMPT NUMBER OF TYPE ONLY PERCENT BURGLARIES
Residential 560 8.6% 6,488 Non-Residential 194 6.5% 2,968
18

BURGLARY
1984
TYPE
Residential Non-Residential
TYPE
Residential Non-Residential
1983
TYPE
Residential Non-Residential
TYPE
Residential Non-Residential
1982
l'YPE
~esidentia1 ~on-Residentia1
C'YPE
~esidentia1 lon-Residential
FORCIBLE ENTRY
4,868 2,531
ATTEMPT ONLY
541 202
FORCIBLE ENTRY
6,273 3,236
ATTEMPT ONLY
836 196
FORCIBLE ENTRY
7,179 3,353
ATTEMPT ONLY
847 221
PERCENT
75.8% 79.2%
PERCENT
8.4% 6.3%
PERCENT
83.0% 91.8%
PERCENT
11.1% 5.6%
PERCENT
85·0% 90.9%
PERCENT
10·.0% 6··0%
19
NO FORCE
1,017 464
NUMBER OF BURGLARIES
6,426 3,197
NO FORCE
445 93
NUMBER OF BURGLARIES
7,554 3,525
NO FORCE
422 114
NUMBER OF BURGI.ARIES
8,448 3,688
PERCENT
15.8% 14.5%
PERCENT
6.0% 2.6%
PERCENT
5.0% 3.1%

BURGLARY
1981
FORCIBLE NO TYPE ENTRY PERCENT FORCE PERCENT
Residential 9,108 84.1% 549 5.1% Non--:-Residential 4,197 90.3% 133 2.9%
ATl'EMPT NUMBER OF TYPE ONLY PERCENT BURGLARIES
Residential 1,179 10.9% 10,836 Non-Residential 315 6.8% 4,645
20

SECTION III
INCIDENTS OF PART II CRIME
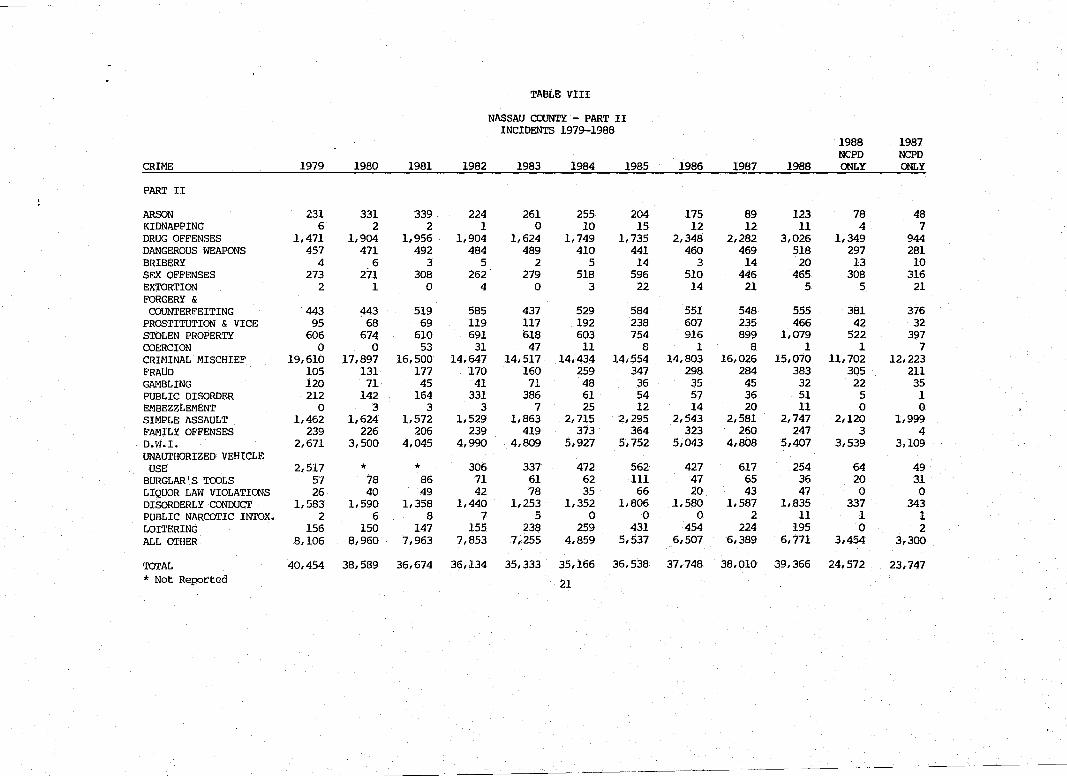
TABLE VIII
NASSAU COONTY - PART II INCIDENTS 1979-1988
1988 1987 NCPD NCPD
CRIME 1979 1980 1981 1982 1983 1984 1985 1986 1987 1988 OOLY ONLY
PART II
ARSON 231 331 339 224 261 255 204 175 89 123 78 48 KIDNAPPING 6 2 2 1 0 10 15 12 12 11 4 7 DRUG OFFENSES 1,471 1,904 1,956 1,904 1,624 1,749 1,735 2,348 2,282 3,026 1,349 944 DANGEROUS WEAPONS 457 471 492 484 489 410 441 460 469 518 297 281 BRIBERY 4 6 3 5 2 5 14 3 14 20 13 10 SEX OFFENSES 273 ill 308 262 . 279 518 596 510 445 465 308 316 EXTORTION 2 1 0 4 0 3 22 14 21 5 5 21 FORGERY &
COUNTERFEITING 443 443 519 585 437 529 584 551 548 555 381 376 PROSTITUTION & VICE 95 68 69 119 117 192 238 607 235 466 42 32 STOLEN PROPERTY 606 674 610 691 618 603 754 916 899 1,079 522 397 COERCION 0 0 53 31 47 11 8 1 8 1 1 7 CRIMINAL MISCHIEF 19,610 17,897 16,500 14,647 14,517 14,434 14,554 14,803 16,026 15,070 11,702 12,223 FRAUD 105 131 177 170 160 259 347 298 284 383 305 211 GAMBLING 120 71 45 41 71 48 36 35 45 32 22 35 PUBLIC DISORDER 212 142 164 331 386 61 54 57 36 51 5 1 EMBEZZLEMENT 0 3 3 3 7 25 12 14 20 11 0 0 SIMPLE ASSAULT 1,462 1,624 1,572 1,529 1,863 2,715 2,295 2,543 2,581 2,747 2,120 1,999 FAMILY OFFENSES 239 226 206 239 419 373 364 323 260 247 3 4 D.W.I. 2,671 3,500 4,045 4,990 4,809 5,927 5,752 5,043 4,808 5,407 3,539 3,109 UNAUTHORIZED VEHICLE
USE 2,517 * * 306 337 472 562 427 617 254 64 49 BURGLAR'S TOOLS 57 78 86 71 61 62 III 47 65 36 20 31 LIQUOR LAW VIOLATIONS 26 40 49 42 78 35 66 20 43 47 0 0 DISORDERLY CONDUCT 1,583 1,590 1,358 1,440 1,253 1,352 1,806 1,580 1,587 1,835 337 343 PUBLIC NARCOTIC INTOX. 2 6 8 7 5 0 0 0 2 11 1 1 LOITERING 156 150 147 155 238 259 431 454 224 195 0 2 ALL arHER 8,106 8,960 7,963 7,853 7,255 4,859 5,537 6,507 6,389 6,771 3,454 3,300
TOTAL 40,454 38,589 36,674 36,134 35,333 35,166 36,538 37,748 38,010 39,366 24,572 23,747 * Not Reported 21

PART II INCIDENTS 1979-1988
40,454
40,000 38,589 38,010 39,366
37,748 36,674
36,538 36,134 35,333 35,166
30,000
20,000
10,000
1979 1980 1981 1982 1983 1984 1985 1986 1987 1988
22

SECTION IV
INCIDENCE OF CRIME TYPE BY COMMUNITY
Table IX provides a record of criminal incidence by the community of
occurrence. In order to compile the number of criminal incidents per
community and then compare that analysis with the appropriate geographical!
demographical locale it is necessary to utilize three complete sets of
source documents. The communities are those as identified by the Nassau
Police Department's location codes and are delineated as combined
Incorporated Villages and Unincorporated statistical areas. The
population data was arrived at from a LILCO estimate from Jan. 1, 1988
which in turn is based upon the April 1, 1980 census. The number of
criminal incidence per community have been extrapolated from the Uniform
Crime Reports of both the Independent Police Depts. and the Nassau County
Police Dept.
Inconsistencies evident in the comparison of the above source
documents do not obscure the essential validity for their use. In some
cases communities or areas may exist for the N.C. Police Dept. crime
reporting procedures but do not have separate data for census purposes.
When this occurred several reports were analyzed and combined to obtain
a "best fit" and these communities were then marked with footnotes.
We note in this analysis that in approaching the community by
community analysis there are several factors that tend to detract from
absolute reliability of such comparison. Two of these factors are:
difference in definition or interpretation of what criminal incident
occurred as recorded by different Police Depts. and differences in community
boundaries as defined by the Nassau County Police Department and the .
U.S. Census Bureau.
23

TABLE IX 1988 REPORTED INCIDENCE BY SELECTED CRIME
BY COMMUNITIES OF OCCURRENCE
* ** UNAUTH. % COMMUNITY HOMICIDE RAPE ROBBERY ASSAULT BURGLARY LARCENY USE. OTHER TOTAL POP. CLEAR.
ALBERTSON 1 1 -0- 4 22 57 -0- 150 235 5,384 15.08 ATLANTIC BEACH 1 -0- 3 7 22 32 -0- 139 204 4,234 28.07 BALDWIN 2 4 38 48 136 253 8 1,015 1,504 31,380 25.26 BALDWIN HARBOR -0- -0- -0- 1 2 2 1 11 17 -0- 11.76 BAY PARK -0- -0- -0- -0- 3 7 -0- 24 34 2,305 26.47 BAYVILLE -0- -0- -0- 8 47 26 2 162 245 8,077 17.28 BELLEROSE -0- -0- 7 4 21 11 -0- 71 114 1,225 19.46 BELLEROSE TERRACE-O- -0- 5 5 9 23 1 86 129 1,928 20.93 BELLMORE -0- -0- 18 29 83 146 2 616 894 17,641 24.74 BETHPAGE 4 7 10 32 127 114 11 843 1,148 16,595 33.06 CARLE PLACE 1 -0- 19 14 74 202 3 395 708 5,243 27.41 CEDARHURST -0- 1 18 12 76 180 1 350 638 5,880 20.91 CENTRE ISLAND -0- -0- -0- -0- 1 4 -O- Il 16 406 25.00 COVE NECK -0- -0- -0- -0- 1 5 -0- 1 7 339 14.28 E. GARDEN CITY -0- 1 11 8 24 112 -0- 290 446 4,783 28.95 EAST HEMPSTEAD -0- -0- 1 -0- 5 5 -0- 29 40 -0- 45.00 EAST HILLS -0- -0- 7 2 48 53 1 135 246 6,850 21.39 E. MASSAPEQUA -0- -0- 2 16 35 70 -0- 227 350 13,334 33.13 EAST MEAOOW 1 2 33 103 209 310 4 1,519 2,181 40,214 38.11 EAST NORWICH -0- -0- 1 2 13 14 1 53 84 2,712 34.52 EAST ROCKAWAY 1 -0- 1 9 31 53 1 261 357 10i530 30.87 EAST WILLISTON -0- -0- -0- 2 6 4 -0- 34 46 2,614 30.43 ELMONT 1 6 54 96 234 453 13 1,406 2,263 27,290 34.80 FARMINGDALE -0- 3 16 30 68 87 5 527 736 8,063 33.65 FLORAL PARK -0- -0- 13 3 65 168 6 230 485 16,311 23.91 FLORAL PARK CTR. -0- -0- 2 -0- 3 17 1 25 48 -0- 20.83 FLOWER HILL -0- -0- 3 1 30 35 -0- 83 152 4,582 21.71 FRANKLIN SQUARE 1 1 12 28 87 218 8 691 1,046 28,995 26.47 FREEPORT 5 9 175 117 365 753 -0- 1,104 2,528 38,668 37.18
* UNAUTHORIZED USE OF MOTOR VEHICLE ** CLEARANCE RATE PERCENTAGE
24
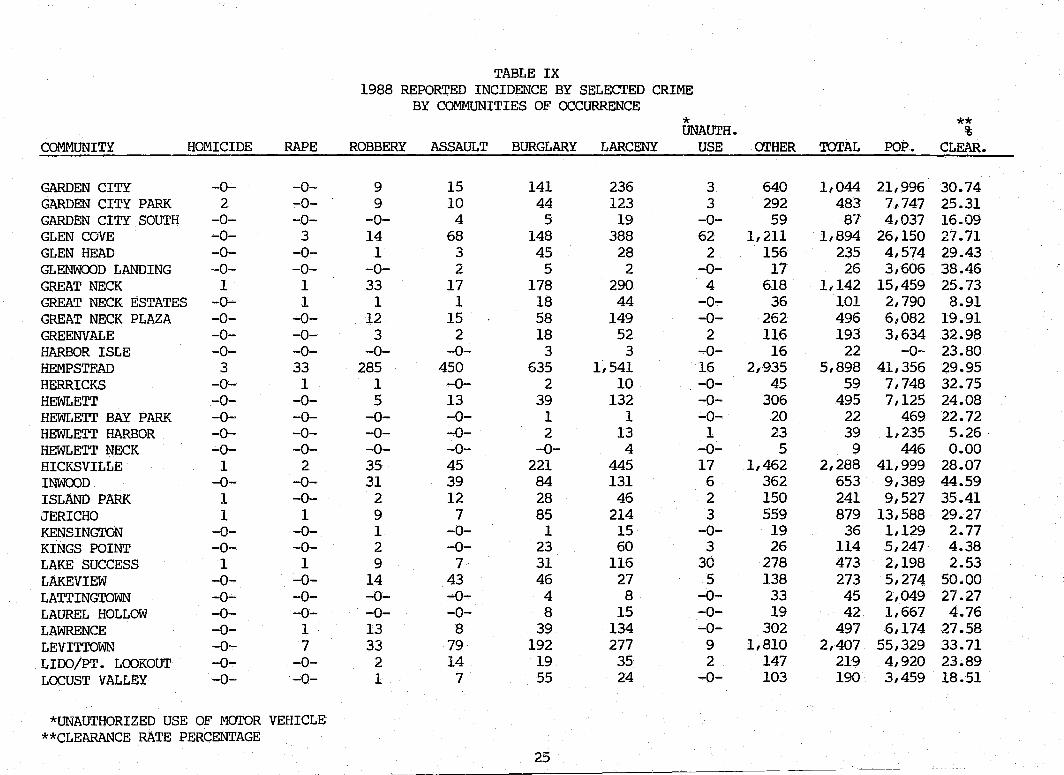
TABLE IX 1988 REPORTED INCIDENCE BY SELECTED CRIME
BY COMMUNITIES OF OCCURRENCE * ** UNAUTH. %
COMMUNITY HONICIDE RAPE ROBBERY ASSAULT BURGLARY LARCENY USE OTHER TOTAL POP. CLEAR.
GARDEN CITY -0- -0- 9 15 141 236 3 640 1,044 21,996 30.74 GARDEN CITY PARK 2 -0- 9 10 44 123 3 292 483 7,747 25.31 GARDEN CITY SOUTH -0- -0- -0- 4 5 19 -0- 59 87 4,037 16.09 GLEN COVE -0- 3 14 68 148 388 62 1,211 1,894 26,150 27.71 GLEN HEAD -0- -0- 1 3 45 28 2 156 235 4,574 29.43 GLENWOOD LANDING -0- -0- -0- 2 5 2 -0- 17 26 3,606 38.46 GREAT NECK 1 1 33 17 178 290 4 618 1,142 15,459 25.73 GREAT NECK ESTATES -0- 1 1 1 18 44 -0- 36 101 2,790 8.91 GREAT NECK PLAZA -0- -0- 12 15 58 149 -0- 262 496 6,082 19.91 GREENVALE -0- -0- 3 2 18 52 2 116 193 3,634 32.98 HARBOR ISLE -0- -0- -0- -0- 3 3 -0- 16 22 -0- 23.80 HENPSTF.AD 3 33 285 450 635 1,541 16 2,935 5,898 41,356 29.95 HERRICKS -0- 1 1 -0- 2 10 -0- 45 59 7,748 32.75 HEWLETT -0- -O- S 13 39 132 -0- 306 495 7,125 24.08 HEWLETT BAY PARK -0- -0- -0- -0- 1 1 -0- 20 22 469 22.72 HEWLETT HARBOR -0- -0- -0- -0- 2 13 1 23 39 1,235 5.26 . HEWLETT NECK -0- -0- -0- -0- -0- 4 -O- S 9 446 0.00 HICKSVILLE 1 2 35 45 221 445 17 1,462 2,288 41,999 28.07 INWOOD -0- -0- 31 39 84 131 6 362 653 9,389 44.59 ISLAND PARK 1 -0- 2 12 28 46 2 150 241 9,527 35.41 JERICHO 1 1 9 7 85 214 3 559 879 13,588 29.27 KENSINGTON -0- -0- 1 -0- 1 15 -0- 19 36 1,129 2.77 KINGS POINT -0- -0- 2 -0- 23 60 3 26 114 5,247 4.38 LAKE SUCCESS 1 1 9 7 31 116 30 278 473 2,198 2.53 LAKEVIEW -0- -0- 14 43 46 27 5 138 273 5,274 50.00 LATTINGTOWN -0- -0- -0- -0- 4 8 -0- 33 45 2,049 27.27 LAUREL HOLLOW -0- -0- -0- -0- 8 15 -0- 19 42 1,667 4.76 LAWRENCE -0- 1 13 8 39 134 -0- 302 497 6,174 27.58 LEVITTOWN -0- 7 33 79 192 277 9 1,810 2,407 55,329 33.71 LIDO/PT. LOOKOUT -0- -0- 2 14 19 35 2 147 219 4,920 23.89 LOCUST VALLEY -0- -0- 1 7 55 24 -0- 103 190 3,459 18.51
*UNAUTHORIZED USE OF MOTOR VEHICLE **CLEARANCE RATE PERCENTAGE
25

TABLE IX 1988 REPORTED INCIDENCE BY SELECTED CRIME
BY COMMUNITIES OF OCCURRENCE
* ** UNAUTH. % COMMUNITY HOMICIDE RAPE ROBBERY ASSAULT BURGLARY LARCENY USE. OTHER TOTAL POP. CLEAR.
LONG BEACH -0- 3 23 24 263 635 38 1,886 2,872 36,087 40.80 LY"NBRooK -0- -O- Il 20 102 280 2 420 835 19,623 16.76 MALVERNE -0- -0- 2 3 32 133 -0- 130 300 8,848 16.66 MALVERNE PARK -0- -0- -0- -0- 2 3 -0- 16 21 -0- 19.04 MANHASSET 1 1 18 18 73 215 2 500 828 8,509 24.87 MANHASSET HILLS -0- -0- -0- 1 3 -0- -0- 33 37 -0- 10.81 I1ANORHAVEN -0- -0- -o- Il 9 29 -o- lIO 159 5,802 30.32 MASSAPEQUA -0- 1 11 38 159 220 12 1,092 1,533 23,650 26.17 MASSAPEQUA PARK -0- 1 3 11 65 84 2 403 569 19,313 23.84 MERRICK -0- 1 16 26 106 184 2 726 1,061 23,838 20.90 MILL NECK -0- -0- -0- 1 3 3 -0- 16 23 1,019 8.69 MINEOLA -0- 2 18 24 157 204 8 757 1,170 20,342 25.88 MUNSEY PARK -0- -0- 1 -0- 12 7 -0- 34 54 2,723 3.70 NEW CASSEL -0- 4 24 86 73 65 5 645 902 10,685 71.49 NEW HYDE ~ARK -0- 1 20 22 122 256 3 845 1,269 9,510 24.60 NORTH BALDWIN -0- -0- -0- 1 2 -0- -O- S 8 -0- 37.50 NORTH BELLMORE -0- -0- 9 24 85 109 1 496 724 20,074 24.23 NORTH HILLS -0- -0- 2 3 7 37 -0- 158 207 3,063 59.70 NORTH LAWRENCE -0- 1 18 8 36 105 -0- 303 471 -0- 42.52 N. LONG BEACH -0- -0- 3 21 17 37 1 267 346 -0- 51.61 NORTH LYNBROOK -0- -0- -0- -0- 1 6 -0- 13 20 -0- 25.00 N. MASSAPEQUA 1 -0- 4 17 76 114 -0- 520 732 20,981 18.10 NORTH MERRICK -0- -0- 14 18 61 86 2 313 494 12,520 27.25 N. NEW HYDE PARK -0- -0- 10 6 41 177 1 294 529 14,526 16.76 NORTH SEAFORD -0- -0- -0- -0- 8 8 -0- 30 46 -0- 17.39 N. VALLEY STREAM 2 -0- 2 11 44 128 2 178 367 14,297 16.98 N. WANTAGH -0- -0- -0- 1 8 13 -0- 42 64 13,079 17.18 N. WOODMERE -0- -0- 7 5 12 108 -0- 125 257 -0- 18.75 OCEANSIDE 1 2 11 39 138 246 8 1,011 1,456 33,625 33.40
* UNAUTHORIZED USE OF MOTOR VEHICLE ** CLEARANCE RATE PERCENTAGE
26

TABLE IX 1988 REPORTED INCIDENCE BY SELECTED CRIME
BY COMMUNITIES OF OCCURRENCE
* ** UNAUTH. % COMMUNITY HOMICIDE RAPE ROBBERY ASSAULT BURGLARY LARCENY USE arHER TOTAL POP. CLEAR.
OLD BETHPAGE -0- -0- 1 2 32 OLD BRooKVILLE/
18 -0- 97 150 6,354 19.59
BROOKVILLE/UPPER BROOKVILLE -0- 2 1 7 67 169 2 307 555 7,109 10.81 OLD WESTBURY 1 -0- 3 4 36 48 1 128 221 3,607 24.88 OYSTER BAY -0- -0- 1 12 33 47 -0- 182 275 7,484 28.88 OYSTER BAY COVE -0- 1 -0- -0- 17 2 1 9 30 2,319 23.33 PLAINEDGE -0- -0- -0- 2 4 3 -0- 35 44 9,423 39.53 PLAINVIEW -0- 1 15 22 175 194 3 756 1,166 27,813 23.23 PLANDOME -0- -0- -0- 1 6 5 -0- 12 24 1,462 16.66 PLANDOME HEIGHTS -0- -0- -0- -0- 10 4 -0- 4 18 955 5.55 PLANDOME MANOR -0- -0- -0- -0- 2 3 -0- 13 18 935 27.77 PORT WASHINGTONI 1 -0- 7 14 53 393 2 1,097 1,567 19,693 43.39 ROCKVILLE CENTRE 1 -0- 18 16 161 490 1 641 1,328 24,999 16.71 ROOSEVELT 6 12 55 166 222 163 11 1/226 1,861 14,751 60.46 ROSLYN -0- -0- -0- 3 36 57 -0- 130 226 2,271 17.48 ROSLYN ESTATES -0- -0- 2 1 9 3 -0- 42 57 1,236 16.36 ROSLYN HARBOR -0- -0- -0- 1 5 14 -0- 21 41 1,150 36.58 ROSLYN HEIGHTS 1 -0- 10 9 74 132 3 300 529 6,280 27.53 RUSSELL GARDENS 1 -0- -0- -0- 6 5 -0- 9 21 1,348 19.04 SADDLE ROCK -0- 1 -0- -0- 4 3 -0- 16 24 954 4.54 SANDS POINT -0- -0- -0- -O- Il 19 -0- 17 47 2,735 8.51 SEA CLIFF -0- -0- -0- 4 41 22 -0- 121 188 5,423 20.21 SEAFORD -0- 1 8 27 80 126 1 604 847 15,959 28.05 SEARINGTOWN -0- -0- 2 3 25 27 -0- 68 125 5,206 12.80 S. FARMINGDALE -0- 1 4 24 39 50 -0- 263 381 15,743 21.75 S. FLORAL PARK -0- -0- -0- 2 3 1 3 15 24 1,649 12.50 S. HEMPSTEAD -0- -0- 2 2 10 24 -0- 70 108 3,208 8.41 S. VALLEY STREAM -0- -0- -0- 1 6 43 -0- 25 75 5,188 10066
* UNAUTHORIZED USE OF MOTOR VEHICLE ** CLEARANCE RATE PERCENTAGE 1. Includes Baxter Estates, Port Washington North, NorthEast and
North West.
27

COMMUNITY HOMICIDE RAPE
S. WESTBURy2 -0- -0-STEWART MANOR -0- -0-SYOSSET -0- -0-THOMASTON -0- -0-UNIONDALE 2 13 VALLEY STREAM 1 4 WANTAGH -0- 1 W. FARMINGDALE -0- -0-WEST HEMPSTEAD -0- 2 WESTBURY 1 6 WILLISTON PARK -0- -0-WOODBURY -0- 1 WOODMERE -0- 2 WooDSBURGH -0- -0-
* UNAUTHORIZED USE OF MOTOR VEHICLE **CLEARANCE RATE PERCENTAGE
TABLE IX 1988 REPORTED INCIDENCE BY SELECTED CRIME
BY COMMUNITIES OF OCCURRENCE
** * UNAUTH. % ROBBERY ASSAULT BURGLARY LARCENY USE. arHER TOl'AL POP. CLEAR.
-0- -0- -0- -0- -0- -0- -0- 9,438 -0-1 1 6 3 -0- 27 38 2,483 36.84
10 14 134 184 6 700 1,048 10,366 22.22 2 2 25 15 -0- 44 88 2,634 23.80
.47 74 155 221 8 753 1,273 19,518 34.45 42 40 205 569 23 1,230 2,114 34,674 27.22 16 26 127 174 6 901 1,'251 20,397 25.00 -0- -0- -0- -0- -0- S 5 -0- 20.00 20 47 90 198 -0- 739 1,096 18,054 29.29 32 56 254 380 12 1,035 1,776 13,877 27.24
2 9 21 65 -0- 320 417 7,821 28.98 2 12 38 106 2 272 433 7,941 23.31 5 8 36 178 2 300 531 16,043 21.94 1 1 4 7 -0- 19 32 834 18.75
2. For reporting purposes NCPD includes any incidents of crime in the Community of westbury.
28
--~

TABLE IX 1988 REPORTED INCIDENCE BY SELECTED CRIME
COMMUNITY HOMICIDE RAPE ROBBERY
BEL[\lONT RACE TRACK -0- -0-
EISENHOWER PARK -0- -0-GREEN ACRES
SHOPPING CENTER 2 1 MID ISLAND
SHOPPING CENTER -0- -O-MITCHEL FIELD -0- -0-NASSAU COLISEUM 1 -0-ROOSEVELT FIELD 1 1 ROOSEVELT RACEWAY -0- -0-SEARS SHOP CTR. -0- -0-SUNRISE CINEHA -0- -0-SUNRISE MALL, MASS. -0- 1
* UNAUTHORIZED USE OF MOTOR VEHICLE ** CLEARANCE RATE PERCENTAGE
2 -0-
. 36
S -0-22 17
1 4 7 9
BY OTHER AREAS OF OCCURRENCE
* UNAUTH. ASSAULT BURGLARY LARCENY USE.
6 5 8 1 1 3 6 1
8 13 426 1
2 2 95 -0--0- -O- S -0-19 -0- 24 -0-13 27 387 1
3 5 18 -0-2 2 21 -0-6 -0- 66 -0-
15 18 225 -0-
29
** % OTHER TOl'AL POP. CLEAR.
41 63 -0- 58.73 19 30 -0- 36.66
1,007 1,494 -0- 59.98
143 247 -0- 36.73 12 17 -0- 58.82 73 139 -0- 41.60
720 1,167 -0- 37.32 9 36 -0- 22.85
93 122 -0- 50.00 69 148 -0- 29.25
609 877 -0- 53.66

TABLE IX 1987 REPORTED INCIDENCE BY SELECTED CRIME
BY COMMUNITIES OF OCCURRENCE
* ** UNAUTH. % COMMUNITY HOMICIDE RAPE ROBBERY ASSAULT BURGLARY L~.RCENY USE. orHER TorAL POP. CLEAR.
ALBERTSON -0- -0- 3 1 52 37 9 162 264 5,.339 12.97 ATLANTIC BEACH -0- 1 -0- 8 44 29 5 157 244 4,·190 24.58 BALDWIN -0- 3 28 39 197 167 65 977 1,476 31,337 20.38 BALDWIN HARBOR -0- -0- -0- -0- 4 1 3 12 20 30.00 BAY PARK -0- -0- -0- 2 4 1 3 36 46 2,.299 28.26 BAYVILLE -0- -0- 1 12 44 18 9 171 255 8;000 21.91 BELLEROSE -0- -0- '5 2 16 8 2 58 91 1,.224 20.22 BELLEROSE TERRACE -0- -0- 2 3 7 12 9 57 90 1i.930 17.04 BELLMORE -0- 1 10 21 79 99 33 637 880 17,565 22.13 BETHPAGE -O- S 11 37 142 84 28 873 1,1.80 16,567 30.85 CARLE PLACE -0- 2 11 15 47 176 41 395 688 5,;224 31.63 CEDARHURST -0- -0- 12 11 62 105 23 319 532 5,.896 17.58 CENTRE ISLAND -0- -0- -0- -0- -0- 4 -0- 2 6 400 50.00 COVE NECK -0- -0- -0- -0- -0- 9 -0- -0- 9 335 11.11 EAST GARDEN CITY -0- 1 4 16 38 92 40 339 530 4,243 24.47 EAST HEMPSTEAD -0- 1 -0- -0- 4 7 -0- 40 52 36.53 EAST HILLS 1 -0- 4 6 72 48 6 176 313 6,-857 18.77 EAST MASSAPEQUA 1 3 6 11 40 46 20 203 331 13,340 29.87 EAST MEAOOW 1 3 30 96 212 238 97 1,596 2 , 273 39, 834 37.17 EAST NORWICH -0- -0- 1 2 17 11 4 75 110 2,700 30.00 EAST ROCKAWAY -0- -0- 7 17 33 40 10 233 341 10,529 24.17 EAST WILLISTON -0- -0- -0- -0- 7 6 1 36 50 2,.614 12024 ELMONT 1 3 74 89 230 249 109 1,363 2.,118 27,201 32.98 FARMINGDALE -0- 2 10 34 90 62 31 546 775 7,998 32.28 FLORAL PARK -0- -0- 10 12 54 213 52 184 525 16,322 19.42 FLORAL PARK CENTHE -0- -0- -0- 1 3 8 6 42 60 16.94 FLOWER HILL -0- 1 3 -0- 47 30 5 85 171 4,578 17.64 FRfu~IN SQUAHE -0- 1 19 27 107 135 42 651 982 28,646 27.20 FREEPORT 3 13 156 75 462 1,,222 269 725 2,·925 38,641 27.72
* UNAUTHORIZED USE OF MOTOR VEHICLE **CLEARANCE RATE PERCENTAGE 30
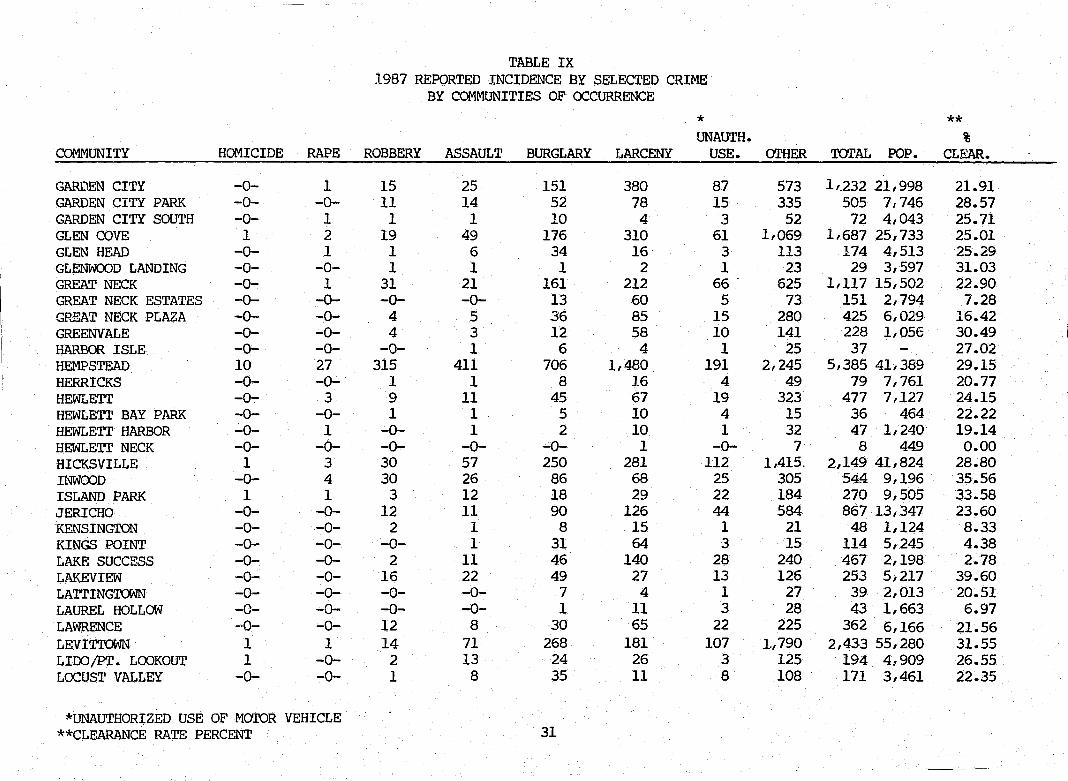
TABLE IX 1987 REPORTED INCIDENCE BY SELECTED CRIME
BY COMM~lITIES OF OCCURRENCE
* ** UNAUTH. %
COMMUNITY HOMICIDE RAPE ROBBERY ASSAULT BURGLARY LARCENY USE. OTHER TarAL POP. CLEAR.
GARDEN CITY -0- 1 15 25 151 380 87 573 1,.232 21 J 998 21.91 GARDEN CITY PARK -0- -0- 11 14 52 78 15 335 505 7,746 28.57 GARDEN CITY SOUTH -0- 1 1 1 10 4 3 52 72 4,043 25.71 GLEN COVE 1 2 19 49 176 310 61 1,069 1,687 25,733 25.01 GLEN HEAD -0- 1 1 6 34 16 3 113 174 4,513 25.29 GLENWCX)D LANDING -0- -0- 1 1 1 2 1 23 29 3,597 31.03 GREAT NECK -0- 1 31 21 161 212 66 . 625 1,117 15,502 22.90 GREAT NECK ESTATES -0- -0- -0- -0- 13 60 5 73 151 2,794 7.28 GP£AT NECK PLAZA -0- -0- 4 5 36 85 15 280 425 6,029 16.42 GREENVALE -0- -0- 4 3 12 58 10 141 228 1,056 30.49 HARBOR ISLE -0- -0- -0- 1 6 4 1 25 37 27.02 HEMPSTEAD 10 27 315 411 706 1,480 191 2,245 5,385 41,389 29.15 HERRICKS -0- . -0- 1 1 8 16 4 49 79 7,761 20.77 HEWLETT -0- 3 9 11 45 67 19 323 477 7,127 24.15 HEWLETT BAY PARK -0- -0- 1 1 5 10 4 15 36 464 22.22 HEWLETT HARBOR -0- 1 -0- 1 2 10 1 32 47 1,240 19.14 HEWLETT NECK -0- -0- -0- -0- -0- 1 -0- 7 8 449 0.00 HICKSVILLE 1 3 30 57 250 281 112 1,415. 2,149 41,824 28.80 INWOOD -0- 4 30 26 86 68 25 305 544 9,196 35.56 ISLAND PARK 1 1 3 12 18 29 22 184 270 9,505 33.58 JERICHO -0- -0- 12 11 90 126 44 584 867 13,347 23.60 KE..f\JSINGTON -0- -0- 2 1 8 15 1 21 48 1,124 8.33 KINGS POINT -0- -0- -0- 1 31 64 3 15 114 5,245 4.38 LAKE SUCCESS -0- -0- 2 11 46 140 28 240 467 2,198 2.78 LAKEVIEW -0- -0- 16 22 49 27 13 126 253 5,217 39.60 LATTINGTa'lN -0- -0- -0- -0- 7 4 1 27 39 2,013 20.51 LAUREL HOLLOW -0- -0- -0- -0- 1 11 3 28 43 1,663 6.97 LAWRENCE -0- -0- 12 8 30 65 22 225 362 6,166 21.56 LEVITTOWN 1 1 14 71 268 181 107 1,790 2,43-3 55,280 31.55 LIDO /PT. LOOKOlJT 1 -0- 2 13 24 26 3 125 194 4,909 26.55 LOCUST VALLEY -0- -0- 1 8 35 11 8 108 171 3,461 22.35
*UNAUTHORIZED USE OF MOTOR VEHICLE **CLEARANCE RATE PERCENT 31

TABLE IX 1987 REPORTED INCIDENCE BY SELECTED CRIME
BY COMMUNITIES OF OCCURRENCE
* ** UNAUTH. %
COMMUNITY HOMICIDE RAPE ROBBERY ASSAULT BURGLARY LARCENCY USE. OTHER TOTAL POP. CLEAR.
LONG BEACH 1 5 45 28 343 764 144 1;791 3:,121 34,995 26.08 LYNBROOK -0- 2 11 24 127 285 69 416 934 19,615 18.30 MALVERNE 1 -0- 3 3 48 102 15 86 258 10,161 21.31 MALVERNE PARK -0- -0- 2 -0- 1 3 1 14 21 28.57 MANHASSET -0- -0- 14 13 59 193 33 533 845 8,518 24.15 MANORHAVEN -0- 1 -0- 6 6 30 3 87 133 5,792 19.23 MASSAPEQUA 1 -0- 21 51 183 170 69 1,160 1,655 23,659 26.12 MASSAPEQUA PARK -0- 1 3 10 66 62 14 419 575 19,304 23.37 MERRICK -0- 1 27 29 138 156 43 908 1,302 23,781 20.66 MILL NECK -0- -0- -0- 2 4 10 1 21 38 1,026 5.26 MINEOLA -O- S 14 43 123 163 46 781 1,175 20,345 26.39 MUNSEY PARK -0- -0- -0- -0- 20 17 3 41 81 2,731 13.75 NEW CASSEL 3 6 25 70 99 39 25 427 694 10,469 62.02 NEW HYDE PARK -0- -0- 25 23 82 210 70 859 1 /269 9,484 21.75 NORTH BALDWIN -0- -0- 1 -0- 1 2 -0- 4 8 12.50 NORTH BELLMORE 1 -0- 8 26 98 57 25 509 724 20,017 21.58 NORTH HILLS -0- -0- 1 1 18 25 6 153 204 2,859 40.10 NORTH LAWRENCE -0- -0- 7 15 25 62 28 254 391 40.72 N. LONG BEACH 1 1 4 16 24 42 10 239 337 42.98 NORTH LYNBROOK -0- -0- -0- 4 3 5 -0- 30 42 45.23 N. MASSAPEQUA -0- 1 2 16 155 81 36 512 803 20,955 20.91 NORTH MERRICK -0- -0- 3 13 81 40 17 348 502 12,487 17.80 N. NEW HYDE PARK -0- -0- 18 4 55 163 45 349 634 14,548 14.87 NORTH SEAFORD -0- -0- 1 2 13 7 3 45 71 23.94 N. VALLEY STREAM -0- 1 12 5 55 77 36 186 372 14,452 16.26 N. WANTAGH -0- -0- -0- -0- 7 9 5 67 88 13,077 12.79 N. WOODMERE -0- -0- 3 5 25 51 23 144 251 19.84 OCEANSIDE 1 2 18 44 168 195 62 1,121 1,.611 33,470 31.37
*UNAUTHORIZED USE OF MOTOR VEHICLE **CLEARANCE RATE PERCENTAGE
32

TABLE IX 1987 REPORTED INCIDENCE BY SELECTED CRIME
BY COMMUNITIES OF OCCURRENCE * ** UNAUTH. %
COMMUNITY HOMICIDE RAPE ROBBERY ASSAULT BURGLARY LARCENY USE. OTHER TOTAL POP. CLEAR.
OLD BETHPAGE -0- 1 1 6 44 26 3 131 212 6,336 17.14 OLD BROOKVILLE/ BROOKVILLE/UPPER BROOKVILLE 2 -0-. 3 14 32 142 20 146 359 6,812 26.18 OLD WESTBURY -0- -0- 2 5 22 85- 1 64 179 3,585 24.02 OYSTER BAY -0- 3 4 11 48 30 8 213 317 7,467 27.47 OYSTER BAY COVE -0- -0- -0- -O- S 8 -0- 2 15 2,292 33.33 PLAINEDGE -0- -0- -0- 2 9 -0- -0- 24 35 9,396 37.14 PLAINVIEW -0- 1 9 13 227 161 64 961 1,436 271572 17.99 PLANDOME -0- -0- -0- -0- 8 6 1 13 28 1,469 11.11 PLANDOME HEIGHTS -0- -0- -0- -0- 1 1 1 9 12 956 25.00 PLANDOME MANOR -0- -0- -0- -0:" 3 1 -0- 13 17 924 37.50 PORT WASHINGl'ON 1 -0- -0- 6 9 67 435 44 1,240 1,801 18,879 43.30 ROCKVILLE CENTRE 2 1 33 12 142 556 103 538 1,387 24,997 22.85 ROOSEVELT 4 7 68 133 220 82 76 912 1,50.2 14,578 50.94 ROSLYN -0- -0- -0- 4 38 42 12 150 246 2,253 22.63 ROSLYN ESTATES -0- -0- -0- -0- 6 10 4 34 54 1,235 9.61 ROSLYN HARBOR -0- -0- -0- 2 3 4 1 18 28 1,148 32.14 ROSLYN HEIGHTS -0- -0- 12 8 78 89 19 306 512 6,288 22.68 RUSSELL GARDENS -0- -0- -0- -0- 7 5 -o- Il 23 1,343 4.76
SADDLE ROCK -0- -0- -0- 1 10 4 1 20 36 954 41.66
SANDS POINT 1 -0- -0- 1 4 23 1 13 43 2,730 25.58
SEA CLIFF 1 -0- 3 4 33 11 1 99 152 5,385 21.08
SEAFORD -0- 3 7 12 93 98 26 618 857 15,898 28.23
SEARINGTOWN -0- 1 4 -0- 33 16 6 90 150 5,167 14.66
S. FARMINGDALE -0- -O- S 10 77 23 5 242 362 15,706 19.72
S. FLORAL PARK -0- 1 -O- S 5 2 3 19 35 1,647 31.42
S. HEMPSTEAD -0- -0- 4 4 29 13 2 89 141 3,207 11.42
S. VALLEY STREAM -0- -0- 1 -0- 14 23 9 31 78 5,200 10.25
* UNAUTHORIZED USE OF MOTOR VEHICLE 1- Includes Baxter Estates, Port washington North/North East and North west ** CLEARANCE RATE PERCENTAGE
33

COMMUNITY HOMICIDE RAPE
So WESTBURY 2 -0- -0-STEWART MANOR -0- -0- " SYOSSET -0- -0-THOMASTON -0- -0-UNIONDALE 1 4 VALLEY STREAM 1 1 WANTAGH -0- 1 W.FARMINGDALE -0- -0-WEST HEMPSTEAD -O- S WESTBURY -0- 6 WILLISTON PARK -0- 1 WOODBURY -0- -0-WOODMERE -0- -0-w::x:)DSBURGH -0- -0-
* UNAUTHORIZED USE OF MOTOR VEHICLE ** CLEARANCE RATE PE~CENTAGE
TABLE IX 1987 REPORTED INCIDENCE BY SELECTED CRIME
BY COMMUNITIES OF OCCURRENCE * UNAUTH.
ROBBBERY ASSAULT BURGLARY LARCENY USE. orHER TarAL POP.
-0- -0- -0- -0- -0- -0- -0- 9,435 -0- 1 14 2 -0- 42 59 2,477
6 20 176 143 44 669 1,058 10,403 1 1 7 18 5 46 78 2,642
67 54 169 "120 58 770 1,243 19,448 54 50 241 364 174 1,345 2,230 34,670 15 32 142 130 42 848 1,210 20,354
-0- -0- 1 -0- -0- 3 4 31 34 134 143 55 673 1,075 17,994 25 45 237 264 101 1,039 1,717 13,775 6 7 32 26 11 219 302 7,817 3 8 30 116 24 332 513 7,718 7 4 45 86 21 311 474 16,017
-0- -0- 4 5 1 15 25 849
2- For Reporting purposes NCPD includes any incidents of crime in the Community of Westbury.
34
** %
CLEAR.
-0-15.25 19.12 18.18 32.71 23.83 21.22 25.00 27.24 25.64 29.76 19.10 14.64 20.20

CCtv1MUNITY . HCX1ICIDE RAPE
BELMONT RACE TRACK -0- -a-EISENHOOER PARK -a- -a-GREEN ACRES SHOPPING 1 -a-
CENTER MID ISLAND SHOPPING
CENTER -0- -0-MITCHEL FIELD -0- -0-NASSAU COLISEUM -0- -0-ROOSEVELT FIELD -0- -a-ROOSEVELT RACEWAY -0- -a-SEARS SHOP CTR. -0- -a-SUNRISE CINEMA -0- -a-SUNRISE MALL, MASS. 1 -0-
*UNAUTHORIZED USE OF MOI'OR VEHICLE **CLEARANCE RATE PERCENT
TABLE IX 1987 REPORTED INCIDENCE BY SELECTED CRIME
BY OI'HER AREAS OF OCCURRENCE * UNAUTH.
ROBBERY ASSAULT BURGLARY . LARCENCY USE.
3 8 2 6 7 2 1 -0- 3 -a-
18 12 7 293 182
1 6 5 58 29 -0- -0- 3 3 -0-1 10 4 14 2
20 16 28 399 137 -0- 1 2 27 3 1 -0- 2 16 1 2 6 -a- 53 41 8 25 9 205 81
35
** %
OI'HER TarAL POP. CLEAR.
64 90 -a- 77.52 14 20 -a- 27.77
778 1,291 -0- 46.09
185 284 -a- 27.11 13 19 -a- 10.52 48 79 -a- 33.33
733 1,333 -a- 33.73 12 45 -a- 11.11 46 66 -0- 38.46
116 218 -a- 46.04 599 928 -0- 47.01

TOTAL CRIMINAL INCIDENTS
While there are some areas that have offense levels that are much
higher than the County norm, generally, crime in Nassau County remains a
dispersed phenomenon. Indicative of this is the fact that the communities
with the highest concentrations of population consistently have the
highest number of reported (see TABLE XA) crimes. The increase in the
number of criminal incidents in Nassau County for 1988 is also reflected
in increases in the reported incidents in the majority of the ten communities
with the greatest number of crimes.
36

TABLE X-A
NUMBER OF INCIDENTS*
1988 COMMUNITY RANKINGS
COMMUNITY 1988 1987 1986 1985 1984
L HEMPSTEADl 5,898 5,385 5,704 5,'156 5,136
2. LONG BEACHl 2,872 3,121 3,169 3,073 3,204
3. FREEPORTl 2,528 2/925 2,631 2,693 2,527
4. LEVITroWN 2,407 2,434 2,120 2,177 2,177
5. HICKSVILLE 2,288 2,149 2,004 1,965 2,106
6. ELMONT 2,263 2,118 2,140 2,152 2,002
7. EAST MEADOW 2,181 2,273 2,305 2,278 2,122
8. VALLEY STREAM 2,114 2,230 2,019 2,188 1,899
9. GLEN COVEl 1,894 1,687 1,933 1,963 1,814
10. ROOSEVELT 1,861 1,502 1,415 1,510 1,329
Of the top ten communities showing the highest number of incidents for 1988 eight of the ten appeared on this list for 1987.
*COMMUNITIES WITH LESS THAN 5,000 RESIDENTS NOT REPRESENTED
1 SERVED BY INDEPENDENT POLICE DEPARTMENT
37

TABLE X-B
INCIDENTS PER 1,000 RESIDENTS*
1988 COMMUNITY RANKINGS
COOMUNITY 1988 1987 1986 1985 1984
1. HEMPSTEAD 142.6 130.1 138.6 124.4 122.9
2. CARLE PLACE 135.0 131.7 129.9 145.1 121.9
3. NEW HYDE PARK 133.4 133.8 123.7 110.0 102.3
4. WESTBURY 128.0 124.6 138.2 132.0 123.4
5. ROOSEVELT 126.2 103.1 98.0 105.5 92.5
6. CEDARHURST 108.5 90.2 106.7 102.5 111.4
7. SYOSSET 101.1 101.8 113.5 118.9 118.7
8. MANHASSET 97.3 99.2 123.1 124.9 130.0
9. FARMINGDALE 91.3 96.9 76.3 85.1 82.6
10. NEW CASSEL 91.3 66.6 76.6 59.2 63.2
Of the top ten communities showing the highest number of crime incidents per 1,000 residents nine of the ten appeared on this list for 1987.
* COMMUNITIES WITH LESS THAN Sf 000 RESIDENTS NOT REPRESENTED 1 SERVED BY INDEPENDENT POLICE DEPARTMENT
38

TABLE X-C
ROBBERIES AND BURGLARIES PER 1,000 RESIDENTS*
1988 COMMUNITY RANKINGS
COMMUNITY 1988 1987 1986 1985 1984
1. HEMPSTEAD1 22.2 24.7 24.2 25.9 21.3
2. WESTBURY 20.6 19.0 21.1 19.9 20.4
3. ROOSEVELT 18.8 19.8 21. 7 28.9 29.2
4. CARLE PLACE 17.7 12.6 10.5 15.0 10.7
5. CEDARHURST 16.0 12.6 12.5 9.3 12.0
6. NEW HYDE PARK 14.9 11.3 13.5 11.9 11.3
7. FREEPORT1 14.0 16.0 16.6 19.8 20.5
8. SYOSSET 13.9 17.5 19.7 17.2 16.0
9. GREAT NECK 13.6 12.4 10.6 9.9 14.3
10. ROSLYN HEIGHTS 13.4 14.3 17.3 12.3 14.3
Of the ten communities with the greatest numbers of robberies and burglaries per 1,000 residents eight of the ten appeared on the list for 1987.
* COMMUNITIES WITH LESS THAN 5,000 RESIDENTS NOT REPRESENTED 1 SERVED BY INDEPENDENT POLICE DEPARTMENT
39

SECTION - V
ARRESTS
The total number of persons arrested in Nassau County, 23,883 in 1988
represents a increase of 8.4% from the 1987 total. Part I Crimes accounted
for 27.8% of the total arrests for 1988. Of the 6 / 644 Part I arrests, 64.3%
were for larceny, 12.4% were for assault and 12.3% for burglary.
40

TABLE - XI TOTAL ARREST BY CRIME TYPE 1979-1988
PART I NCPD
CRIME 1979 1980 1981 1982 1983 1984 1985 1986 1987 1988 1988
*HOMICIDE 40 49 58 53 48 49 39 51 56 43 27
RAPE 38 41 48 32 41 42 40 39 57 40 21
ROBBERY 500 538 541 601 606 411 497 454 499 447 274
AGGRAVATED ASSAULT 517 555 545 646 593 688 690 756 793 823 447
BURGLARY 2,087 2,116 1,768 1,400 1,238 938 886 809 797 820 544
LARCENY 4,019 4,107 3 r 865 4,089 3,563 3,577 3,695 3,741 4,268 4,275 3,409
AUTO THEFT 289 253 245 201 171 162 174 252 204 196 144
SUB-TOTAL 7,490 7,659 7,070 7,022 6,260 5,867 6,021 6,102 6,674 6,644 4,866
* Includes Murder, Negligent and Non-Negligent Manslaughter
41

TABLE - XI TOTAL ARREST BY CRIME TYPE 1979-1988
PART II
CRIME 1979 1980 1981 1982 1983 1984
ARSON 64 65 64 58 64 51 KIDNAPPING 8 ° ° 8 1 3 DRUG OFFENSES 1,489 1,854 1,906 1,811 1,581 1,784 DANGEROUS WEAPONS 374 405 421 435 460 365 BRIBERY 2 5 3 9 3 6 SEX OFFENSES 170 244 183 143 157 172 EXTORTION 0 ° 3 ° 1 3 FORGERY &
COUNTERFEITING 222 222 228 308 242 240 PROSTITUTION 99 70 73 123 125 213 STOLEN PROPERTY 645 654 632 640 585 563 COERCION 2 1 1 6 1 1 CRIMINAL MISCHIEF 1,037 927 888 831 720 925 FRAUD 171 161 173 153 164 168 GAMBLING 164 99 65 63 49 45 PUBLIC DISORDER 211 32 37 9 10 22 EMBEZZLEMENT ° ° 1 ° ° 6 SIMPLE ASSAULT 868 973 800 879 876 1,297 FAMILY OFFENSES 89 63 60 88 142 ~/5
D.W.I 2,636 3,495 4,082 5,150 4,919 5,869 UNAUTHORIZED
VEHICLE USE 108 77 163 144 93 108 BURGLAR'S TOOLS 6 7 39 19 13 72 LIQUOR LAW VIOLATIONS 26 41 32 36 74 31 DISORDERLY CONDUCT 873 709 596 660 658 777 PUBLIC NARCOTIC INTOX. 1 7 1 ° 1 1 LOITERING 17 26 89 116 263 327 ALL OTHER 3,352 4,138 3,541 3,380 3,473 2,147
TOTAL 12,634 14,275 14,081 15,069 14,675 15,271
42

TABLE XI TOTAL ARREST BY CRIME TYPE 1979-1988
PART II
NCPD ONLY
CRIME 1985 1986 1987 1988 1988
ARSON 39 18 34 32 25 KIDNAPPING 12 9 13 5 3 DRUG OFFENSES 1,772 2,150 2,315 3,059 1,440 DANGEROUS WEAPONS 384 422 443 496 317 BRIBERY 12 5 11 22 16 SEX OFFENSES 220 182 155 153 107 EXTORTION 4 9 19 4 3 FORGERY &
COUNTERFEITING 286 288 290 296 219 PROSTITUTION 230 646 668 499 51 STOT .. EN PROPERTY 590 617 758 1,033 706 :OERCION 4 2 5 4 1 JRIMlNAL MISCHIEF 1,097 899 923 834 503 mAUD 205 173 201 281 228 :;AMBLING 40 49 66 89 61 ?UBLIC DISORDER 88 45 90 60 13 ::MBEZZLEMENT 6 4 2 3 1 :>IMPLE ASSAULT 1,422 1,375 1,172 1,325 970 ~AMILY OFFENSES 90 99 84 81 2 ).W.I. 5,671 4,988 4,788 5,262 3,392 lliAUTHORIZED YEH. USE 122 99 125 98 25 ~URGLAR I STOOLS 96 43 72 35 25 ,IQUOR LAW VIOLATIONS 71 24 54 37 -0->ISORDERLY CONDUCT 688 650 632 699 138 )UBLIC NARCOTIC INTOX. 0 9 14 6 1 .OITERING 435 337 63 45 -0-ILL OTHER 2,373 2,462 2,355 2,781 1,263
TOTAL 15,957 15,604 15,352 17,239 9,510
oN ANALYSIS OF PART II ARRESTS 1979-1988
As previously mentioned in this report the number of Part II incidents decreased .7% from 1979-1988. In contrast the number of Part II arrests increased 36.4% in the orresponding period.
This significant increase can be attributed to increases of arrests for the ollowing crimes:
Simple Assault DWI Drug Offenses
52.6% 99.6%
105.4%
43

CRIME TOTAL ARRESTS PART I 1979-1988
8,000
7,659
7,000
6,000 5,867
5,000
1979 1980 1981 1982 1983 1984 1985 1986 1987 1988
44

CRIME TOTAL ARRESTS PART II 1979-1988
18,000 17,239
15,000
12,634 12,000
9,000
6,000
3,000
1979 1980 1981 1982 1983 1984 1985 1986 1987 1988
45

CRIME iUl'AL ARRESTS PART I & PART II 1979-1988
23,
22,
21,000
20,124 20,~
19,~
18'~L-__________________________________________________ ~ ____________ _
1979 1980 1981 1982 1983 1984 1985 1986 1987 1988
46

ANALYSIS OF ARRESTEES
AN ANALYSIS OF THE AGE OF ARRESTEES 1979-1988
A review of TABLE XI-A indicates that the number of arrests
have increased by 18.7% from 1979 to 1988. We also note that
the age group with the greatest increase in arrests between
1979 to 1988 is the 30-39 age group, 2,633 in 1979, 5,197 in
1988, a 97% increase.
In addition, the 25-29 age group showed an increase of 97.9%
in arrests when comparing 1979 (2,435) to 1988 (4,820).
AN ANALYSIS OF JUVENILE ARRESTEES* FOR PART I OFFENSES 1979-1988
A review of the ten year trend (1979-1988) indicates that
the percentage of Juveniles arrested for Part I crimes has
decreased from 17.2% in 1979 to 8.3% in 1988.
AN ANALYSIS OF THE SEX, RACE AND ETHNIC CHARACTERISTICS OF ARRESTEES 1979-1988
A review of the characteristics of arrestees indicates
that male arrests increased by 16.2% and female arrests increased
32.6% when comparing 1979 to 1988. The percentage of white
arrestees has remained constant while black arrestees have incr,eased
46.9% from 1979 to 1988.
*Less than 16 years of age
47

AGE OF ARRESTEES
The data that follows provides demographic information concerning the age of arrestees.
TABLE-XI-A
% Change AGE GROUP 1979 1980 1981 1982 1983 1984 1985 1986 1987 1988 1987-1988 - ..
12 & under 298 274 246 192 177 169 164 164 176 174 (1.1) 13 - 15 1,848 1,761 1,547 1,358 1,126 1,106 1,231 1,136 1,019 965 (5.3) 16 - 19 6,309 6,165 5,443 5,173 4,806 4,285 4,297 4,247 4 / 239 4,232 ( .2) 20 - 24 4,337 5,118 5,134 5,410 5,246 5,284 5,394 5,343 5,250 5,527 5.3 25 - 29 2,435 2,949 2,949 3,374 3,267 3,678 3,890 3,987 3,822 4,820 26.1 30 - 39 2,633 3,107 3,200 3;688 3,583 3,830 4,114 4,193 4,743 5,197 9.6 40 - 49 1,247 1,421 1,493 1,611 1,548 1,647 1,734 1,610 1,794 1,945 8.4 50 - 59 742 798 810 882 782 770 798 681 666 690 3.6 60 & over 275 341 329 403 400 369 356 345 352 333 (5.4) Tal'AL 20,124 21,934 21,151 22,091 20,935 21,138 21,978 21,706 22,061 23,883 8.3
48

.;.P
TABLE XI-B
AGE OF PERSONS ARRESTED BY CRIME 1988
it OF PERSONS it OF PERSONS % % UNDER 25 25 & OVER TOl'AL UNDER 25 OVER 25
BURGLARY 512 308 820 62.4 37.6
ROBBERY 275 172 447 61.5 38.5
LARCENY 2,124 2,151 4,275 49.7 50.3
ASSAULT 387 436 82"3 47.0 53.0
An analysis of TABEL XI-B indicates that 51.8% of those arrested for the above Part I crimes are under the age
of 25. Those under the age of 25 account for 62.4% of all arrests for Burglary and 61.5% of all arrests for Robbe~t.
TABLE XI-B-l
AGE OF PERSONS ARRESTED BY CRIME 1982-1988*
TOTAL % TOl'AL % TOTAL % TOTAL % TOl'AL % TOI'AL % TOTAL % ARRESTS UNDER ARRESTS UNDER ARRESTS UNDER ARRESTS UNDER ARRESTS UNDER ARRESTS UNDER ARRESTS UNDER
1982 25 1983 25 1984 25 1985 25 1986 25 1987 25 1988 25 --BURGLARY 1,400 80.7 1,238 77.4 938 75.5 886 75.1 809 70.5 797 68.1 820 62.4
ROBBERY 601 78.2 606 77.3 411 74.9 497 73.8 454 66.7 499 67.3 447 61.5
LARCENY 4,089 58.3 3,563 57.7 3,577 57.7 3,695 57.1 3,741 56.9 4,268 51. 7 4,275 49.7
ASSAULT 646 55.9 593 59.8 688 53.5 690 56.8 756 55 793 52.1 823 47.0
*Prior years not available 49
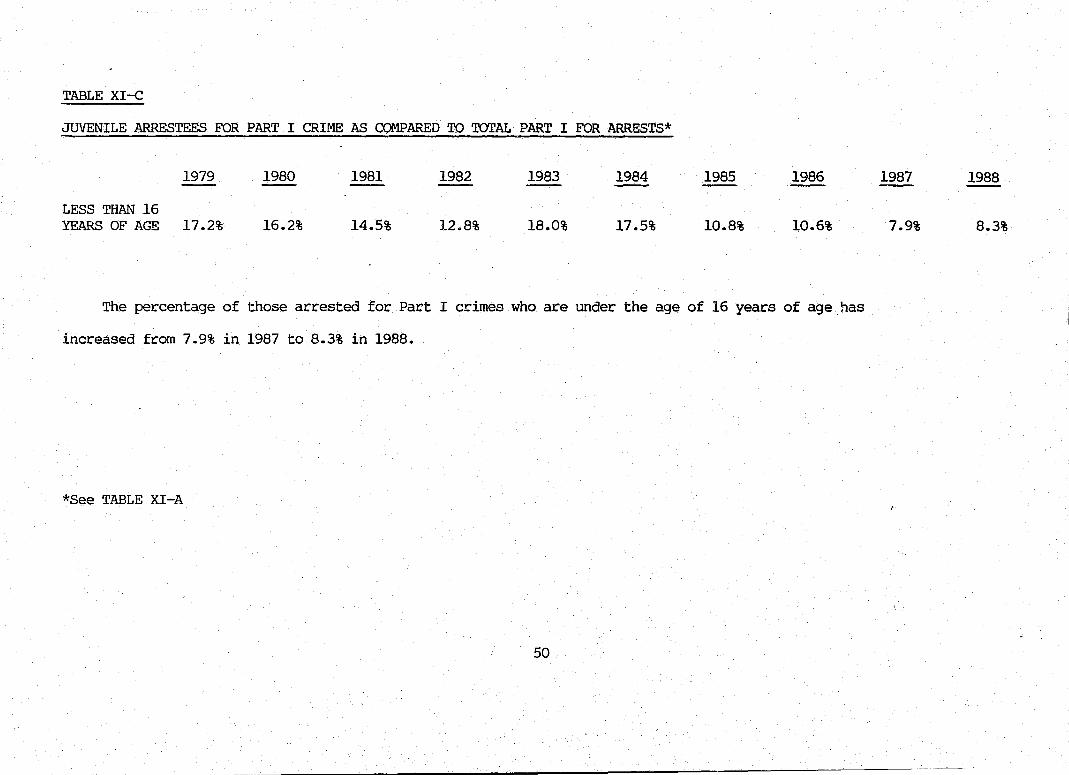
TABLE XI-C
JUVENILE ARRESTEES FOR PART I CRIME AS COMPARED TO TOTAL PART I FOR ARRESTS*
1979 1980 1981 1982 1983 1984 1985 1986 1987 1988
LESS THAN 16 YEARS OF AGE 17.2% 16.2% 14.5% 12G8% 18.0% 17.5% 10.8% 10.6% 7.9% 8.3%
The percentage of those arrested for Part I crimes who are under the age of 16 years of age has
increased from 7.9% in 1987 to 8.3% in 1988.
*See TABLE XI-A
50

ARRESTEE CHARACTERISTICS
Analysis of acres tee charactecistics indicates that male arrests showed an increase of 9.2% from 1987 to 1988
while female acrests incceased 3.8% from 1987 to 1988. During the period of 1987 to 1988 white arrestees increased
9.2% and black arrestees increased 6.6%
TABLE-XII
CHARACTERISTICS
SEX 1979 1980 1981 1982 1983 1984 1985 1986 1987 ' 1988
MALE 17,102 18,826 18,054 18,613 17,766 17,916 18,417 18,205 18,202 19,877
FEMALE 3,022 3,108 3,097 3,478 3,169 3,222 3,561 3,501 3,859 4,006
RACE 1979 1980 1981 1982 1983 1984 1985 1986* 1987* 1988*
WHITE 14,232 15,061 14,303 14,976 13,465 13,166 13,631 13,234 12,742 13,911
BLACK 5,868 6,810 6,807 7,053 7,384 6,277 6,750 7,436 8,085 8,619
INDIAN 9 1 4 9 31 9 15 35 11 31
ASIAK' 15 62 37 53 55 49 64 86 89 153
HISPANIC 1,280 1,518 ** ** **
arHER 357
% OF 1979 1980 1981 1982 1983 1984 1985 1986 1987 1988
WHITE 70.7 68.7 67.6 67.8 64.3 62.3 62.0 63.6 60.9 61.2
BLACK 29.2 31.0 32.2 31.9 35.3 29.7 30.7 35.8 38.6 37.9
*Race total for 1986-1988 does not equal total arrest figures due to the fact that OWl Traffic Citations do not include race category.
**Hispanic, as a classification is no longer a category for reporting purposes.
51

Following is a table showing the rank order of Nassau County communities in terms
of the number of crimes per 1,000 residents per community and the number of Impact Crimes
(ROBBERY & BURGLARY) committed per 1,000 residents per community*.
APPENDIX B 1988
# OF CRIMES PER IMPACT CRIMES COMMUNITY CRIMES RANK 1,000 RANK PER 1,000 RANK
ALBERTSON 235 68** 43.6 60 4.1 56** ATLANTIC BEACH 204 73 48.2 54 5.9 43 BALDWIN 1,504 14 47.9 55 5.5 46** BALDWIN HARBOR 17 115 -0- -0- -0- -0-BAY PARK 34 104 14.8 109 1.3 76 BAYVILLE 245 66 30.3 84 5.8 44** BELLEROSE 114 82** 93.0 12 22.8 1 BELLEROSE TERRACE 129 80 66.9 26 7.3 34** BELLMORE 894 30 50.7 53 5.7 45 BETHPAGE 1,148 22 69.2 24 8.3 30 CARLE PLACE 708 38 135.0 3 17.7 6 CEDARHURST 638 40 108.5 7 16.0 8 CENTRE ISLAND 16 116 39.4 66 -0- -0-COVE NECK 7 119 20.6 99 2.9 66** E. GARDEN CITY 446 53 93.2 11 7.3 34** EAST HEMPSTEAD 40 100 -0- -0- -0- -0-EAST HILLS 246 65 35.9 72 8.0 31 E. MASSAPEQUA 350 59 26.2 88 2.8 67** EAST MEADOW 2,181 7 54.2 38 6.0 42** E. NORWICH 84 87 31.0 83 5.2 47** EAST ROCKA~vAY 357 58 33.9 76** 3.0 65** EAST WILLISTON 46 95** 17.6 104 2.3. 70 ELMONT 2,263 6 82.9 16 10.6 20 FARMINGDALE 736 35 91.3 13 10.4 22 FLORAL PARK 485 49 29.7 86 4.8 50** FLORAL PARK CENTER 48 93 -0- -0- -0- -0-FLOWER HILL 152 78 33.2 79 7.2 35** FRANKLIN SQUARE 1,046 27 36.1 71** 3.4 62 FREEPORT 2,528 3 65.4 7 14.0 II GARDEN CITY 1,044 28 47.5 56 6.8 39** GARDEN CITY PARK 483 50 62.3 31 6.8 39** GARDEN CITY SOUTH 87 86 21.6 98 1.2 77** GLEN COVE 1,894 9 72.4 22 6.2 40** GLEN HEAD 235 68** 51.4 52 10.0 24 GLENWOOD LANDING 26 108 7.2 114 1.4 75 GREAT NECK 1,142 23 73.9 21 13.6 13 GREAT NECK ESTATES 101 84 36.2 70 6.8 39** GREAT NECK PLAZA 496 46 81.6 17 11.5 16 GREENVALE 193 74 53.1 40** 5.8 44** HARBOR ISLE 22 111** -0- -0- -0- -0-HEMPSTEAD 5,898 1 142.6 2 22.2 2
* Communities are ranked in numerical order regardless of population ** Indicates a tie with another Community.
52

APPENDIX B 1988
# OF CRIMES PER IMPACT CRIMES COMMUNITY CRIMES RANK 1,000 RANK PER 1,000 RANK
HERRICKS 59 90 7.6 113 .4 80** HEwLETl' 495 47 69.5 23** 6.2 40** HEWLETT BAY PARK 22 111** 46.9 57 2.1 71** HEWLETT HARBOR 39 101 31.6 82 1.6 74** &'"1iLETT NECK 9 117 20.2 100 -0- -0-HICKSVILLE 2,288 5 54.5 37** 6.1 41** INVOJD 653 39 69.5 23** 12.2 15 ISLAND PARK 241 67 25.3 90 3.1 64 JERICHO 879 31 64.7 30 6.9 38 KENSINGTON 36 104 31.9 81 1.8 73** KINGS POINT i14 82** 21.7 97 4.8 50** LAKE SUCCESS 473 51 215.2 1 18.2 5 LAKEVIEW 273 63 51.8 41 11.4 17 LATTINGTOWN 45 96 22.0 96 2.0 72 LAUREL HOLLOW 42 98 25.2 91** 4.8 50** LAWRENCE 497 45 80.5 18 8.4 29 LEVITTOWN 2,047 4 43.5 61 4.1 56** LIDO/POINT LOOKOUT 219 71 44.5 59** 4.3 54** LOCUST VALLEY 190 75 54.9 36 16.2 7 LONG BEACH 2,872 2 79.6 19** 7.9 32 LYNBROOK 835 33 42.6 63 5.8 44** MALVERNE 300 61 33.9 76** 3.8 59 MAL VERNE PARK 21 112** -0- -0- -0- -0-MANHASSET 828 34 97.3 10 10.'1 19 MAl.'lJHASSET HILLS 37 103 -0- -0- -0- -0-l>1ANORHA VEN 159 -77 27.4 87 1.6 74** MASSAPEQUA 1,533 13 64.8 29 7.2 35** MASSAPEQUA PARK 569 41 29.5 85 3.5 61** MERRICK 1,061 25 44.5 59** 5.1 48 MILL NECK 23 110 22.6 95 2.9 66** MINEOLA 1,170 20 57.5 35 8.6 28 MUNSEY PARK 54 92 19.8 101 4.8 50** NEW CASSEL 902 29 84.4 14 9.1 26 NEW HYDE PARK 1,269 -18 133.4 4 14.9 10 NORTH BALDWIN 8 118 -0- -0- -0- -0-N. BELLMORE 724 37 36.1 71*.* 4.7 51 NORTH HILLS 207 22 67.6 25 2.9 66** N. LAWRENCE 471 52 -0- -0- -0- -0-N. LONG BEACH 346 60 -0- -0- -0- -0-N. LYNBROCK 20 113 -0- -0- -0- -o-N. MASSAPEQUA 732 36 34.9 74 3.9 58 N. MERRICK 494 48 39.6 65 6.0 42** N. NEW HYDE PARK 529 44** 36.4 69 3.5 61 N. SEAFORD 46 95** -0- -0- -0- -o-N. VALLEY STREAM 367 57 25.7 89 3.2 63 N. WANTAGH 64 89 4.9 115 .6 79 N. WOODMERE 257 64 -0- -0- -0- -0-OCEANSIDE 1,456 15 43.3 62 4.4 53 OLD BETHPAGE . 150 79 23.6 94 5.2 47** OLD BROOKVILLE/
BROOKVILLE/UPPER BROOKVILLE 555 42 78.1 20 9.6 25
53

APPENDIX B 1988
# OF CRIMES PER IMPACI' CRIMES COMMUNITY CRIMES RANK 1,000 RANK PER 1,000 RANK
OLD WESTBURY 221 70 61.3 32** 10.8 18 OYSTER BAY 275 62 36.7 68 4.5 52** DYSTER BAY COVE 30 107 12.9 112 7.3 34** PLAlNEDGE 44 97 4.7 116 .4 80** PLAINVIEW 1,166 21 41.9 64 6.8 39** PLANDOME 24 109** 16.4 106 4.1 56** PLANDOME HEIGHTS 18 114** 18.8 103 10.5 21 PLANDOME MANOR 18 114** 19.3 102 2.1 71** ?ORT WASHINGTON 1,567 12 79.6 19** 3.0 65** K>CKVILLE CENTRE 1,328 16 53.1 40** 7.2 35** ~OOSEVELT 1,861 10 126.2 6 18.8 4 ~OSLYN 226 69 99.5 9 15.9 9 ~OSLYN ESTATES 57 91 46.1 58 8.9 27 ~OSLYN HARBOR 41 99 35.7 73 4.3 54** tOSLYN HEIGHTS 529 44** 84.2 15 13.4 14 mSSELL GARDENS 21 112** 15.6 107 4.5 52** jADDLE ROCK 24 109** 25.2 91** 4.2 55 JANDS POINT 47 94 17.2 105 4.0 57 lEA CLIFF 188 76 34.7 75 7.6 33 :EAFORD 847 32 53.1 40** 5.5 46** :EARINGTOWN 125 81 24.0 93 5.2 47** ',. FARMINGDALE 381 56 24.2 92 2.7 68 :. FLORAL PARK 24 109** 14.6 110 1.8 73** OUTH HEMPSTEAD 108 83 33.7 77 3.7 60 • VALLEY STREAM 75 88 14.5 III 1.2 78 TEWAR'l' MANOR 38 102 15.3 108 2.8 67** YOSSET 1,048 26 101.1 8 13.9 12 HOMASTON 88 85 33.4 78 10.3 23** NIONDALE 1,273 17 65.2 28 10.3 23** IU.LEY STREAM 2,114 8 61.0 33 7.1 36 ~AGH 1,251 19 61.3 32** 7.0 37 • FARMINGDALE 5 120 -0- -0- -0- -0-E:ST HEMPSTEAD 1,096 24 60.7 34 6.1 41** E:STBURY 1,776 11 128.0 5 20.6 3 rLLISTON PARK 417 55 53.3 39 2.9 66** X>DBURY Ll~3 54 54.5 37** 5.0 49 X>DMERE 531 43 33.1 80 2.6 69 X>DSBURGH 32 106 38.4 67 6.0 42**
54
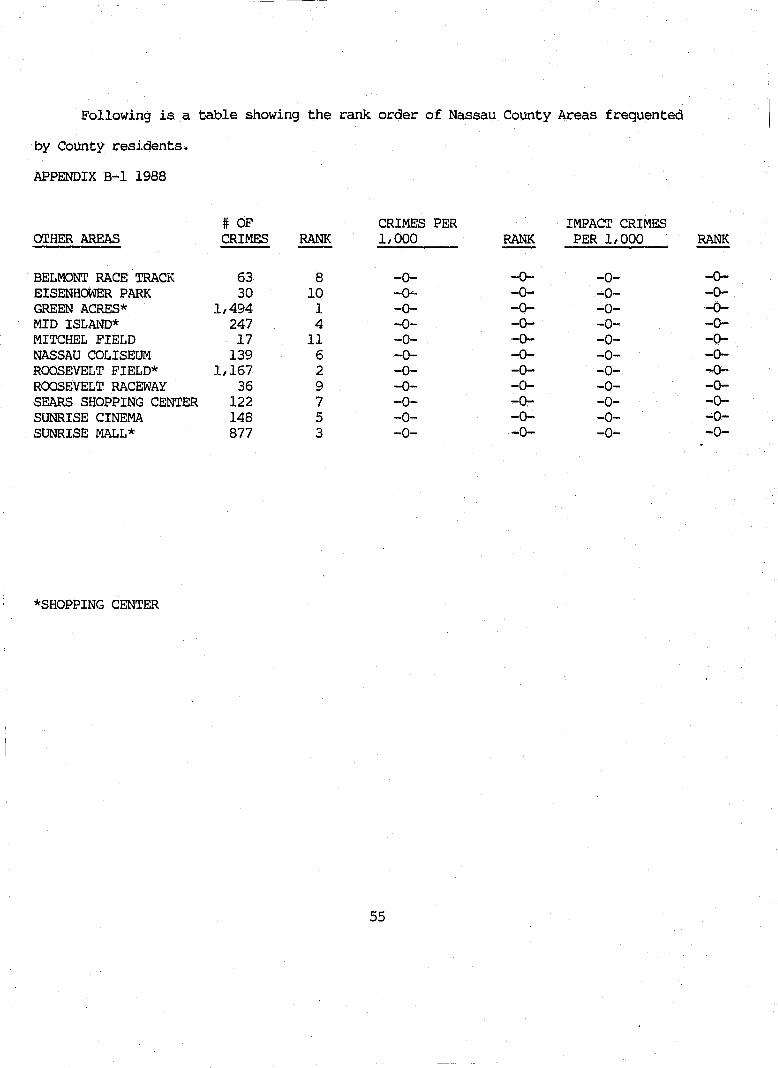
Following is a table showing the rank order of Nassau County Areas frequented
by County residents.
APPENDIX B-1 1988
# OF CRIMES PER IMPAcr CRIMES CY.rHER AREAS CRIMES RANK 1,000 RANK PER 1,000 RANK
BELMONT RACE TRACK 63 8 -0- -0- -0- -0-EISENHOWER PARK 30 10 -0-- -0- -0- -0-GREEN ACRES* 1,494 1 -0- -0- -0- -0-MID ISLAND* 247 4 -0- -0- -0- -0-MITCHEL FIELD 17 11 -0- -0- -0- -0-NASSAU COLISEUM 139 6 -0- -0- -0- -0-ROOSEVELT FIELD* 1,167 2 -0- -0- -0- -0--ROOSEVELT RACEWAY 36 9 -0- -0- -0- -0-SEARS SHOPPING CENTER 122 7 -0- -0- -0- -0-SUNRISE CINEMA 148 5 -0- -0- -0- -0-SUNRISE MALL* 877 3 -0- -0- -0- -0-
*SHOPPING CENTER
55

Following is a table showing the rank oeder of Nassau County communities in
terms of the numbf~r of crimes pee 1,000 residents per community and the number of
Impact Crimes (ROBBERY & BURGLARY) committed per 1,000 residents per community*.
APPENDIX B 1987
# OF CRIMES PER IMPACT CRIMES COMMUNITY CRIMES RANK 1,000. RANK PER 1,000 RANK
ALBERTSON 264 64 49.4 49** 10.3 23** ATLANTIC BEACH 244 70 58.2 37 10.5 21** BALDWIN 1,476 15 47.1 53 7.2 35** BALDWIN HARBOR 20 113 BAY PARK 46 100 20 94 1.7 68 BAYVILLE 255 66 31.9 75 5.6 46** BELLEROSE 91 85 74.3 20 17.2 6 BELLEROSE TERRACE 90 86 46.6 54 4.7 53** BELLMORE 880 30 50.1 47 5.1 50** BETHPAGE 1,180 23 71.2 23 9.2 25** CARLE PLACE 688 38 131.7 4 11.1 19** CEDARHURST 532 42 90.2 14 12.6 12** CENTRE ISLAND 6 119 15 101** COVE NECK 9 117 26.9 84 E. GARDEN CITY 530 43 124.9 6 9.9 24 EAST HEMPSTEAD 52 96 EAST HILLS 313 61 45.6 55 11.1 19** E. MASSAPEQUA 331 59 24.8 88 3.4 61 EAST MEAOOW 2,273 5 57.1 39 6.1 43 E. NORWICH 110 84 40.7 61 6.7 40** EAST ROCKAWAY 341 57 32.4 73 3.8 58 EAST WILLISTON :50 97 19.1 96** 2.7 65** ELMONT 2,118 8 77.9 17 11.2 18 FARMINGDALE 775 35 96.9 12 12.5 13** FLORAL PARK 525 44 32.2 74 3.9 57** FLORAL PARK CENTER 60 93 FLOWER HILL 171 77** 37~.4 68 10.9 20 FRANKLIN SQUAAE 982 28 34.3 71 4.4 55 FREEPORT 2,925 3 75.7 19 16.0 8 GARDEN CITY 1,232 21 56 40 7.5 33** GARDEN CITY PARK 505 47 65.2 29 8.1 29 GARDEN CITY SOUTH 72 91 17.8 98** 2.7 65** GLEN COVE 1,687 11 65.6 28 7.6 32** GLEN HE.lill 174 76 38.6 64** 7.8 30 GLENWOOD LANDING 29 108 8.1 104 .6 73** GREAT NECK 1,117 25 72.1 21 12.4 14 GREAT NECK ESTATES 151 79 54 43** 4.6 54** GREAT NECK PLAZA 425 52 70.5 24 6.6 41** GREENVALE 228 71 216. 1 15.2 9 HARBOR ISLE 37 105 HEMPSTEAD 5,385 1 130.1 5 24.7 1
*Communities are ranked in numerical order "regardless of population. **Indicates a tie with another Community.
56

APPENDIX·B 1987 # OF CRIMES PER IMPACT CRIMES
COMMUNITY CRIMES RANK 1,000 RANK PER 1,000 RANK
HERRICKS 79 89 10.2 103 1.2 71 HEWLETT 477 49 66.9 26 7.6 32** HEWLETT BAY PARK 36 106** 77.6 18 12.6 11 HEWLETT HARBOR 47 99 37.9 66 1.6 69 HEWLETT NECK 8 118** 17.8 98** HICKSVILLE 2,149 7 51.4 46 6.7 40** INWOOD 545 4 59.3 35 12.6 12*~'" ISLAND PARK 270 63 28.4 82 2.2 67** JERICHO 867 31 65. 30 7.6 32** KENSINGTON 48 98 42.7 59 8.9 26 KINGS POINT 114 83 21. 7 92 5.9 44 LAKE SUCCESS 467 51 212.5 2 21.8 2 LAKEVIEW 253 67 48.5 50 12.5 13** LA'ITINGl'a'JN 39 103 19.4 95 3.5 60 LAUREL HOLLOW 43 101** 25.9 85 .6 73** LAWRENCE 362 55** 58.7 36 6.8 39 LEVI'ITOWN 2,434 4 44.0 56** 5.1 50** LIIXJ/POINT LOOKOUT 193 74 39.3 63 5.3 48** LOCUST VALLEY 171 77* 49.4 49** 10.4 22 LONG BEACH 3,121 2 89.2 15 11.1 19** LYNBROOK 934 29 47.6 52 7.0 37** MALVERNE 258 65 25.4 87 5.0 51** MAL VERNE PARK 21 112 MANHASSET 845 33 99.2 11 8.6 27** MANORHAVEN 133 82 23.0 91** 1.0 72** MASSAPEQUA 1,665 12 70.0 25 8.6 27** MASSAPEQUA PARK 575 40 29.8 76 3.6 59 MERRICK 1,303 18 54.8 42 6.9 38 MILL NECK 38 104 37.0 69 3.9 57** MINEOLA 1,176 24 57.8 38 6.7 40** MUNSEY PARK 81 88 29.7 77 7.3 34 NEW CASSEL 697 37 66.6 27** 11.8 16 NEW HYDE PARK 1,269 19 133.8 3 11.3 17 NORTH BALDWIN 8 118* N. BELLMORE 724 36 36.2 70 5.3 48** NORTH HILLS 204 73 71.4 22 6.6 41** N. LAWRENCE 391 53 N. LONG BEACH 337 58 N. LYNBROOK 42 102 N. MASSAPEQUA 803 34 38.3 65 7.5 33** N. MERRICK 502 48 40.2 62 6.7 40** N. NEW HYDE PARK 634 39 43.6 58 5.0 51** N. SEAFORD 71 92 N. VALLEY STREAM 372 54 25.7 86 4.6 54** N. WANTAGH 88 87 6.7 105 .5 74 N. WOODMERE 252 68 OCEANSIDE 1,611 13 48.1 51 5.6 46"'* OLD BETHPAGE 212 72 33.5 72 7.1 36 OLD BROOKVILLE/
BROOKVILLE/UPPER 359 56 52.7 44 5.2 49** BROOKVILLE
57
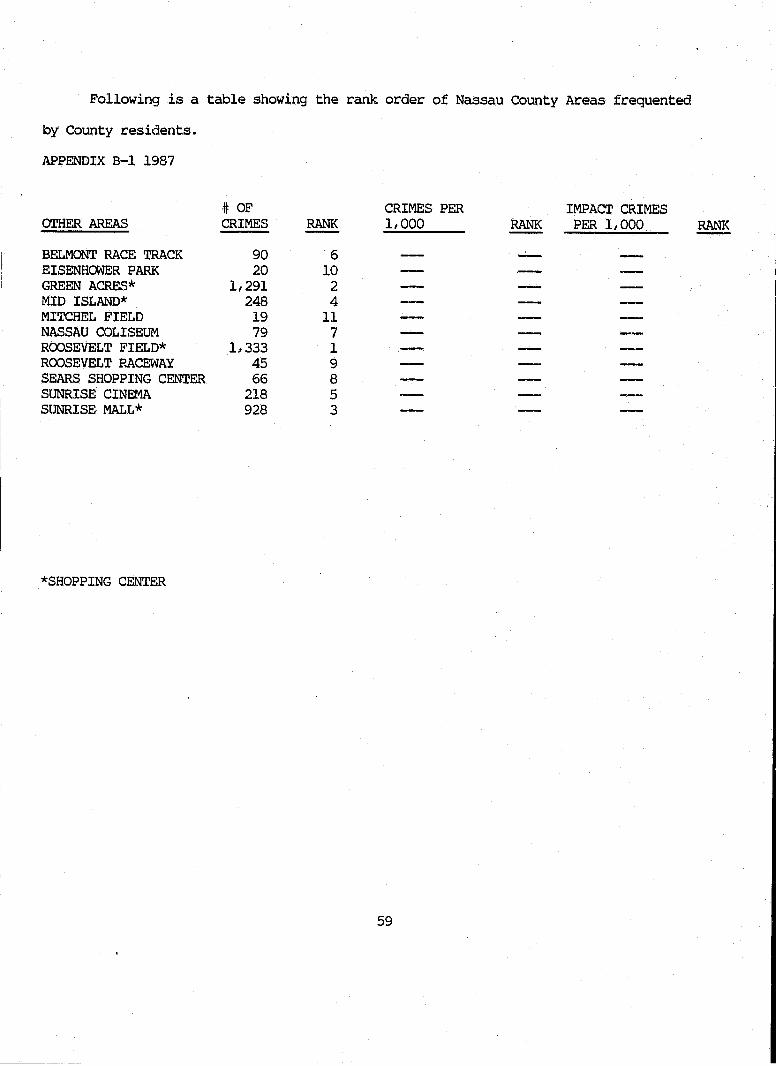
Following is a table showing the rank order of Nassau County Areas frequented
by County residents.
APPENDIX B-1 1987
orHER AREAS
BELMONT RACE TRACK EISENHCMER PARK GREEN ACRES* MID ISLAND* MITCHEL FIELD NASSAU COLISEUM ROOSEVELT FIELD* ROOSEVELT RACEWAY SEARS SHOPPING CENTER SUNRISE CINEMA SUNRISE MALL*
*SHOPPING CENTER
# OF CRIMES
90 20
1,291 248 19 79
1,333 45 66
218 928
RANK
6 10
2 4
11 7 1 9 8 5 3
CRIMES PER 1,000
59
IMPACT CRIMES RANK PER 1,000 RANK

APPENDIX B 1987
# OF CRIMES PER IMPACT CRIMES COMMUNITY CRIMES RANK 1,000 RANK PER 1,000 RANK
OLD WESTBURY 179 75 49.9 48 6.7 40** OYSTER BAY 317 60 42.5 60 7.0 37** OYSTER BAY COVE 15 115 \6.5 106 2.2 67** PLAINEDGE 35 107
\
.3.7 107 1.0 72* PLAINVIEW 1,437 16 52..1 45 8.6 27** PLANJX)ME 28 109** 19.1 96** 5.4 47 PLANDOME HEIGHTS 12 116 12,,6 102 1.0 72** PLANOOME MANOR 17 114 18.4 97 3.2 62** PORT WASHINGTON 1,801 9 95.4 13 3.9 57** ROCKVILLE CENTRE 1,387 17 55.5 41 7.0 37** ROOSEVELT 1,.503 14 103.1 9 19.8 3 ROSLYN 246 69 109.2 8 16.9 7 ROSLYN ESTATES 54 95 43.7 57 4.9 52** ROSLYN HARBOR 28 109** 24.4 89 2.6 66 ROSLYN HEIGHTS 512 46 81.4 16 14.3 10 RUSSELL GARDENS 23 III 17.1 99 5.2 49** SADDLE ROCK 36 106** 37.7 67 10.5 21** SANDS POINT 43 101** 15.8 100 1.5 70 SEA CLIFF 152 78 28.2 83 6.7 40** SEAFORD 858 32 54.0 43** 6.3 . 42 SEARING.I'QWN 150 80 29.0 81 7.2 35** S. FARMINGDALE 362 55** 23.0 91** 5.2 49** S. FLORAL £lARK 35 107** 21.3 93 3.0 63** SOUTH HEMPSTEAD 141 81 44.0 56** 10.3 23** S. VALLEY STREAM 78 90** 15.0 101** 2.9 64 STEvvART MANOR 59 94 23.8 90 5.7 45 SYOSSET 1,059 17 101.8 10 17.5 5 THOMASTON 78 90** 29.5 79 3.0 63** UNIONDALE 1,245 20 64.0 32 12.1 15 VALLEY STREAM 2,230 6 64.3 31 8.5 28 WANTAGH 1,210 22 59.4 34 7.7 31 W. FARMINGDALE 4 120 WEST HEMPSTEAD 1,076 36 59.8 33 9.2 25** WESTBURY 1,717 10 124.6 7 19.0 4 WILLISTON PARK 302 62 38.6 64** 4.9 52** WOODBURY 514 45 66.6 27** 4.3 56 WOODMERE 474 50 29.6 78 3.2 62** WOODSBURGH 25 110 29.4 80 4.7 53**
,,'
58

NASSAU COUNTY
RIMINAL JUSTICE COORDINATING COUNCIL
AN ANALYSIS OF
YOUTH CRIME
IN
NASSAU COUNTY
1988

THE FOLLOWING OBSERVATIONS ARE BASED UPON AN ANALYSIS OF YOUTH ARRESTS DATA FOR
1983-1988 FOR THE COUNTY OF NASSAU
The total number of Part I arrests for youths deceased by 19% from
1983 to 1988 while all arrests for youths decreased by 9.9%. from 1983 to
1988.
When comparing arrests for the 15 and under age group for 1983-1988
we note a 12.6% decrease in the number of arrests. The 16-21 group also
showed a decrease of 9.5% when comparing 1983 to 1988.
It should be noted that the 21 and under age group represents 21.3% of
the total population.
In 1983 the 21 and under groups accounted for 52.8% of all Part I
arrests while in 1988 the same group accounted for 40.2% of all Part I arrests.
60

AN ANALYSIS OF YOUTH CRIME 1987-1988
TABLE I ARRESTS PART. I CRIMES 21 AND UNDER
A review of this table indicates no appreciable change in the overall
arrests for youth from 1987 to 1988.
TABLE II ARRESTS FOR ALL CRIMES BY YOUTHS
A review of this table shows a decrease of 2.3% from 1987-1988 in the
number of youths arrested. As in our prior analysis the percentage of male to
female arrestees 21 and under remained relatively constant.
TABLE III ARRESTS FOR YOUTHS 15 AND UNDER
TABLE IV ARRESTS FOR YOUTHS 16 TO 21 YEARS
A review of Table III shows a decrease of 4.7% from 1987-1988 in the
number of youths arrested. Table IV shows a 1% increase from 1987-1988
in the number of youths arrested.
A higher percentage of 15 and under youths were arrested for Burglary
(9.4%) than 16-21 youths (4.5%). Youths in the 16-21 group were arrested
more frequently for Narcotics (15.9%) than youths 15 and under (4.3%)
61

-PART I CRIMES (21 & Under)
MURDER* RAPE ROBBERY ASSAULT BURGLARY LARCENY AUTO THEFT
Total 21 & Under
TOTAL PART I ARRESTS FOR NASSAU CTY.
PERCENT OF PART I CRIME ARRESTS OF 21 & UNDER
1983
15 19
409 250 847
1..649 116
3,305
6,260
52.8%
1984 1985
16 19 12 14
258 312 266 276 608 551
1r659 1,702 106 108
2,.925 2,982
5,867 6,021
49.9% 49.5%
TABLE I ARRESTS
NCPD ONLY
1986 1987 1988 i988
23 18 14 8 6 20 15 10
235 245 201 127 297 298 278 166 457 445 398 294
1,689 1,696 1r646 1,366 154 119 122 90
2,861 2,841 2,674 2,061
6,102 6,674 6,644 4,866
46.9% 42.6% 40.2% 42.4%
TOTAL VIOLENT CRIME ARRESTS FOR NASSAU COUNTY 1,284 (1983), 1,188 (1984), 1,266 (1985) 1,300 (1986) 1,405, (1987) 1,353 (1988)
TOTAL PROPERTY CRIME ARRESTS FOR NASSAU COUNTY 4,970 (1983), 4,677 (1984), 4,755 (1985), 4,802 (1986) 5,269, (1987) 5,291 (1988)
TOTAL POPULATION OF NASSAU OOUNTY** 1,322,988
Population 10 to 21*** 282,039
PERCENT OF POPULATION 21 & UNDER 21.3% 1983
Ratio of Property Crime Arrests to Violent .2584 Crime Arrests for Nassau County
Ratio of Property Crime Arrests to Violent .2653 Crime Arrests for Nassau County Ages 10-21
1984
.2540 •
.2326
1985
.2662
.2630
1986
.2707
.2439
1987
.2667
.2571
* Includes Negligent and Non-Negligent Manslaughter ** Population Statistics - Long Island Regional Planning Ed. - Population Survey 1988 *** Total Population 1-21 431,908.- - Population Survey 1986
c· 62
1988
.2557
.2331

TABLE II Table II displays the age and sex characteristics of all youthful offenders arrested from 1983-1988
AGE 1983 1984 1985 1986 1987 1988
Under 10 18 27 25 22 24 25 10-12 159 142 139 142 152 149 13 243 222 209 217 183 159 14 364 358 456 310 365 341 15 (15.5%) 519 (16.2%) 526 (17.4%) 566 (16.8%) 609 (15.8%) 471 (15.1%) 465 16 852 852 917 900 830 784 17 1,230 1,010 1,024 1,048 1,118 1,113 18 1,433 1,200 1,253 1,189 1,190 1,179 19 1,291 1,223 1,103 1,110 1,101 1,156 20 1,230 1,146- 1,232 1,075 1,020 1,058 21 (84.5%) 1,056 (83G8%) 1,158 (82.6%) 1,089 (83.2%) 1,113 (84.2%) 1,104 (84.9%) 1,131
Total 21 & Under 8,395 7,864 8,013 7,735 7,558 7,560
TarAL NASSAU COUNTY ARRESTS (ALL AGES) 20,935 21,138 21,978 21,706 22,061 23,883
PERCENT OF ARRESTS 21 & UNDER 40.1% 37.2% 36.5% 35.6% 34.3% 31. 7%
SEX - 21 UNDER
MALES (85.8%) 7,201 (84.8%) 6,669 (84.1%) 6,735 (84.4%) 6,528 (83.6%) 6,318 (84.9%) 6,415
FEMALES (14.2%) 1,194 (15.2%) 1,195 (16.0%) 1,278 (15.6%) 1,207 (16.0%) 1,207 (15.1%) 1,145
63

THE NEXT TABLE DISPLAYS YOUTHFUL ARRESTS BY OFFENSES FOR THE 15 YEARS OF AGE AND UNDER FOR 1983-1988
15 YRS OF AGE & Under Category
ASSAULT1
ROBBERY BURGLARY LARCENY NARCOTICS TRAFFIC2 DISORDERLY CONDUCT3 CRIMINAL MISCHIEF ALL OTHER
TOTAL
15 YRS. OF AGE & Under CATEGORY
ASSAULT1
ROBBERY BURGLARY LARCENY NARCOTICS TRAFFIC2 DISORDERLY CONDUCT3 CRIMINAL ~ISCHIEF ALL OTHE..~
TOTAL
1988 NUMBER--PERCENT
33 2.9% 29 2.5%
107 9.4% 254 22.3% 49 4.3% 16 1.4% 42 3.7%
121 10.6% 488 42.8%
1,139
1985 NUr'1BER-PERCENT
41 2.9% 56 4.0%
154 11.0% 367 26.3%
27 1.9% 15 1.1% 46 3.3%
259 18.6% 430 30.8%
1,395
1. Aggravated Assault
TABLE III
1987 NUMBER PERCENT
44 3.7% 42 3.5%
114 9.5 295 24.7% 52 4.4% 21 1.8% 26 2.2%
149 12.5% 452 37.8%
1,195
1984 NUMBER-PERCENT
41 3.2% 41 3.2%
196 15.4% 318 24.9% 31 2.4% 21 1.6% 32 2.5%
199 15.6% 396 31.1%
1,275
2. D.W.I. & Unauthorized use of a motor vehicle
1986 NUMBER-PERCENT
38 2.9% 43 3.3%
151 11.6% 373 28.7% 31 2.4% 18 1.4% 27 2.1%
147 11.3% 472 36.3%
1,300
1983 NUMBER-PERCENT
41 3.1% 80 6.1%
257 19.7% 326 25.0% 34 2.6% 12 .9% 21 .9%
125 9.6% 416 31.9%
1,303
3. The Disorderly Conduct Offense for those under 15 years of age is generally not reported as an arrestab1e crime by the Nassau County Police De~rtment. This analysis has included this statistic in that such offenses were not reported as arrests by Independent Police Departments.
4. All other crimes. 64

THE NEXT TABLE DISPLAYS YOUTHFUL ARRESTS BY OFFENSES FOR THE 16-21 YEARS OF AGE FOR 1983-1988
16 Yrs. to 21 Yrs. category
ASSAULT1
ROBBERY BURGLARY LARCE~
NARCOTICS TRAFFIC2 DISORDERLY CONDUCT3 CRIMINAL MISCHIEF ALL OI'HER4
TOTAL
16 Yrs. to 21 Yrs. Of Age Category
ASSAULT1
ROBBERY BURGLARY LARCENY NARCOTICS TRAFFIC2 DISORDERLY CONDUCT3 CRIMINAL MISCHIEF ALL OTHER4
TOTAL
1. Aggravated Assault
1988 NUMBER
245 172 291
1,392 1,019
635 223 289
2,155
6,421
PERCENT
3.8% 2.7% 4.5%
21.7% 15.9%
9.9% 3.5% 4.5%
33.6%
1985 NUMBER--PERCENT
235 256 379
1,338 633 846 234 414
2,283 --6,618
3.6% 3.9% 5.7%
20.2% 9.6%
12.8% 3.5% 6.3%
34.5%
2. D.W.I. & Unauthorized use of a motor vehicle
TABLE IV
1987 NUMBER PERCENT
254 203 331
1,401 834 644 248 343
2,105
6,363
4.0% 3.2% 5.2%
22.0% 13.1% 10.1%
3.9% 5.4%
33.1%
1984 NUMBER
225 221 422
1,341 700 972 267 363
2,078
6,589
PERCENT
3.4% 3.4% 6.4%
20.3% 10.6% 14.8% 4.1% 5.5%
31.5%
1986 NUMBER PERCENT
259 192 306
1,316 819 690 211 373
2,269
6,435
1983
4.0% 2.9% 4.8%
20.5% 12.7% 10.7%
3.3% 5.8%
35.3%
NUMBER PERCENT
205 337 585
1,315 638 876 261 287
2,588
7,092
2.9% 4.8% 8.2%
18.5% 8.9%
12.4% 3.7% 4.0%
36.5%
3. The Disorderly Conduct Offense for those under 15 yrs. of age is generally not reported as an arrestab1e crime by the Nassau COWlty Police Department. This Analysis has included this statistic in that such offenses were reported as arrests by Independent Police Departments.
4. All Other crimes.
65

APPENDIX A
AGE DISTRIBUTION 1970 AND 1980 NASSAU COUNTY
1970 1980 AGE COHORT NO. OF PERCENT NO. OF PERCENT ABSOLUTE PERCENT
{Years} PERSONS OF TarAL PERSONS OF TarAL CHANGE CHANGE
0-4 98,105 6.9% 68,878 5.2% - 29,227 - 29.8%
5-9 137,474 9.6% 80,991 6.1% - 56,483 - 41.1%
10-14 163,042 11.4% 108,854 8.2% - 54/ 188 - 33.2%
15-19 146,708 10.3% 127,698 9.7% - 19,010 - 13.0%
20-24 89,154 6.2% 108,519 8.2% 19,365 21.7%
25-29 67,649 4.7% 90/751 6.9% 23,102 34.1%
30-34 68 / 241 4.8% 90,924 6.9% 22,683 33.2%
35-44 195,463 13.7% 154,017 11.7% - 41,446 - 21.2%
45-54 217,520 15.3% 179,600 13.5% - 37,920 - 17.4%
55-59 76,648 5.4% 97,311 7.4% 20,663 27.0%
60-64 55,894 3.9% 73,643 5.6% 17,749 31.7%
65-74 70,082 4.9% ... 85,701 6.5% 15,619 22.3%
75- & OVer 42,100 2.9% 54,695 4.1% 12,595 29.9%
1,428,080* 100.0% 1,321,582 100.0% - 106,498 - 7.5%
*Total County population figure for 1970 was revised subsequent to the releasing of the age data. Therefore, the age cohorts do not sum up to the revised County total of 1,428,838 persons.
Source: Nassau County Planning Commission "Nassau County-Age of Population 1970-1980" U.S. Census
66

NASSAU COUNTY
~RIMINAL JUSTICE COORDINATING COUNCIL
AN ANALYSIS OF
INMATE POPULATION
IN
NASSAU COUNTY CORRECTIONAL CENTER
1988

Our analysis of persons ADMITTED to the Nassau County
Correctional Center indicates that there was an overall increase
of 27.9% when comparing 1987 to 1988. When we compare the number
of persons ADMITTED for the period of 1984 to 1988 we note a
37.9% increase.
When comparing 1987 to 1988 there was a 24.1% increase in the
number of white persons and 27.7% increase in the number of black
persons ADMITTED to the Center. In comparing 1984 to 1988
admissions to the Nassau County Correctional Center there was an
6.5% increase in the number of white persons and 58.2% increase
in the number of black persons.
Our analysis of 1987 to 1988 indicates that there was an
overall increase of 34.2% in the number of persons SENTENCED to
the Correctional Center. Comparing 1984 to 1988 we note a 20.2%
increase in the number of persons SENTENCED to the Correctional
Center.
We note that during the period of 1984-1988 over 50% of the
persons ADMITTED to the Correctional Center had a High School
education or better.
67

ANALYSIS OF INMATE CHARACTERISTICS NASSAU COUNTY CORRECTIONAL CENTER*
TABLE I
ADMITTED TO NASSAU COUNTY CORRECTIONAL CENTER
CHARACTERISTICS
% OF % OF % OF % OF % OF SEX 1988 TOl'AL 1987 TOl'AL 1986 TOl'AL 1985 TOl'AL 1984 TOl'AL
MALE 9,348 86.6% 7,406 87.7% 7,257 87.9% 7,784 89.3% 7,040 89.9%
FEMALE 1,450 13.4% 1,038 12.3% 995 12.1% 937 10.7% 793 10.1%
TOl'AL 10,798 8,444 8,252 8,721 7,833
% OF % OF % OF % OF % OF RACE 1988 TOl'AL 1987 TOl'AL 1986 TOl'AL 1985 TOl'AL 1984 TOl'AL
WHITE 3,853 35.7% 3,106 36.8% 3,444 41.7% 4,085 46.8% 3,619 46.2%
BLACK 5,915 54.8% 4,631 54.8% 4,223 51.2% 4,092 46.9% 3,738 47.7%
HISPANIC 750 6.9% 699 8.3% 576 7.0% 331 3.8% 196 2.5%
OTHERS 280 2.6% 8 .1% 9 .1% 213 2.4% 280 3.6%
TOl'AL 10,798 8,444 . 8,252 8,721 7,833
% OF % OF % OF % OF % OF AGE 1988 TOl'AL 1987 TOl'AL 1986 TOl'AL 1985 TOTAL 1984 TOTAL
16-18 1,003 9.3% 939 11.1% 814 9.9% 963 11.0% 902 11.5%
19-20 1,090 10.1% 878 10.4% 895 10.8% 994 11.4% 856 10.9%
21-29 4,888 45.3% 3,826 45.3% 3,802 46.1% 3,847 44.1% 3,417 43.6%
30-39 2,696 25.0% 2,004 23.7% 1,907 23.1% 1,931 22.1% 1,738 22.2%
40-54 930 8.6% 652 7.7% 7Q3 8.5% 804 9.2% 770 9.8%
55-64 169 1.6% 108 1.3% 97 1.2% 152 1. 7% 124 1.6%
65 Over 22 .2% 37 .4% 34 .4% 30 .3% 26 .3%
TOTAL 10,798 8,444 8,252 8,721 7,833
68

ANALYSIS OF INMATE CHARACTERISTICS NASSAU COUNTY CORRECTIONAL CENTER *
TABLE I ( CONTINUED)
ADMITTED TO NASSAU COUNTY CORRECTIONAL CENTER
CHARACTERISTICS
% OF % OF % OF % OF % OF EDUCATION 1988 TOTAL 1987 TOTAL 1986 TOTAL 1985 TOTAL 1984 TOTAL
UNDER 4th 123 1.1% 93 1.1% 75 .9% 100 1.1% 73 .9%
4-7th 521 4.8% 379 4.5% 405 4.9% 495 5.7% 417 5.3%
8-12th 4,366 40.4% 3,672 43.5% 3,436 41.6% 3,579 41.0% 3,270 41.7%
H.S. GRAD 4,186 38.8% 3,032 35.9% 3,080 37.3% 3,158 36.2% 2,823 36.0%
ATTENDED COLLEGE 1,285 11.9% 1,005 11.9% 987 12.0's 1,076 12.3% 1,004 12.8%
COLLEGE GRADUATE 317 2.9% 263 3.1% 269 3.3% 313 3.6% 246 3.1%
TOTAL 10,798 8,444 8,252 8,721 7,833
*Sheriff's Report 1984-1988 1 16-17
2 18-20
69

ANALYSIS OF INMATE CHARACTERISTICS NASSAU COUNTY CORRECTIONAL CENTER*
TABLE II
SENTENCED TO NASSAU COUNTY CORRECTIONAL CENTER
CHARACTERISTICS
% OF % OF % OF % OF % OF AGE 1988 TOTAL 1987 TOTAL 1986 TOTAL 1985 TOTAL 1984 TOTAL
16-18 200 6.7% 148 6.7% 166 7.7% 114 4.5% 246 9.9%
19-20 306 10.3% 536 24.2% 346 16.0% 373 14.7% 305 12.3%
21-29 1,409 47.4% 762 34.4% 925 42.7% 1,202 47.3% 1,087 43.9%
30-39 758 25.5% 554 25.0% 508 23.4% 540 21.3% 558 22.5%
40-54 258 8.7% 186 8.4% 183 8.4% 258 10.1% 229 9.3%
55-64 31 1.0% 21 .9% 32 1.5% 46 1.8% 44 1.8%
65/over 12 .4% 9 .4% 7 .3% 8 .3% 6 .2%
'l'CfrAL 2,974 2,216 2,167 2,541 2,475
*Sheriff's Report 1984-1988 1 16-17
2 18-20
70

NASSAU COUNTY
CRIMINAL JUSTICE COORDINATING COUNCIL
AN ANALYSIS OF
FELONY CASE PROCESSING
IN
NASSAU COUNTY
1984 - 1988 .

PREFACE
METHODOLOGY OF REPORT PREPARATION
The Criminal Justice Coordinating Council has prepared
an analysis of Felony Case proceesing comprising the years
1984 thru 1988. In preparing this study, CJCC has utilized
the District Attorney's Management Information System known
as D.A.I.S.. This computer system is programmed to follow
the progress of criminal cases from their entry into the system
and during their flow within the judicial system. This infor
mation system, CJCC believes, provides an accurate and detailed
account of criminal case data in Nassau County.
What has emerged as a result of this coordinated effort
is an ability to observe and analyze the processing of cases
in Nassau qounty.
71

SECTION I
OVERVIEW OF FELONY CASE PROCESSING FLOW
Upon an arrest, the arrestee is brought to District Court
Arraignment Part, where there is a reading of an accusatory
instrument, together with a setting of bail. The defendant
is then given the opportunity to retain a lawyer. If the
defendant cannot afford one, a lawyer will be appointed by the
Court.
The case then proceeds to the District Attorney's Screening
Unit to determine the scope of prosecution. The case is placed
on the Felony Screening calendar for conference. If a misdemeanor
plea is agreed upon, the case is then disposed of in District
Court. The defendant may request as a matter of right a felony
examination (which is waived in the majority of cases). In
the event defendant exercises the right to a felony examination,
a hearing is held before a District Court Judge to determine
if there is a reasonable cause to believe that a felony was
committed by the defendant and whether the case should be held
for the actio? of the Grand Jury. In any case, the defendant
may request a pre-indictment conference in County C~urt where
the matter may be disposed of through a plea of guilty to a
Superior Court Information. If no plea is agreed upon the
case will then be presented to the Grand Jury. If the Grand
Jury hands up an indictment, the defendant will be arraigned
in County Court and the case will then proceed to trial,
unless the defendant pleads guilty to the highest count of
the indictment. 72

{ll ~ DISTRIcr COURI'
NASSAU COUNTY
FELONY CASE PROCESSING FLOW
GRAPH ONE
ARRAIGNMENT 1--' .. - ....... --- ......... _-.....
RELEASE / DETENTION
, J, (2) ~ : c SCREENrnG )}-..u;J-.--------..,~·fI i ~ -....:::~ ..... ~,.uRs.i-VIOIATfONS .. t (~ 1:
DISTRIcr COURI' PROCESSrnG
I r FEIDNY J ~FC , EXAMINATION l -= DISM
(4)
, , ~ , ~r r-________ ~DI~
J, ,1# ,'" J, J, J, (6) ~~SSION FeE~-_t PRE- INDIC'IMENT '-_--=N~O::...;:;.;PLEA=.:._ _ __. __ _:_!,,~ .GRAf\in ,J1JRY. J "'DISM
CONFERENCE DISM~~-"'" 1--______ _
(5) SCI
SCI - SUPERIOR COURT INFORMATION (7)
FC - FAMILY COURT
COUNTY COURI' ARRAIGNMENT
50;----DIROCT SUBMISSION ~ BY SCI
DISM - DISMISSAL ACQ - ACQUITTA.L
---- - MAJOR FELONY CASES GAT - GUILTY AFTER TRIAL
I' (8) ,~
PRE- TRIAL ~ DISM PRCCEEDINGS ..a.. Fe ..... --.,'"
t PLEA ) PLEA
FC4tE---1
GAT ~ Fe
_.l\l:.~...l=~:-r--~~ _ FC
( St;N' 't<.J.\ll LNl..:i (10)
73
--_._--_ ..

COUNTY COURT CASE PROCESSING
Table IA
Total Felony Cases Processed
Total Total Total Total Cases Cases Cases Cases
Cases Processed 1984-1985 1984-1986 1984-1987 1984-1988 (District Court) 1984 1985 %Chanse 1986 %Chanse 1987 %Chanse 1988 %Chanse
5075 5417 6.7% 5465 7.7% 5375 5.9% 6230 22.8%
Table IB
Total Felon~ Cases DisEosed
Total Total Total Total Cases Cases Cases Cases 1984-1985 1984-1986 1984-1987 1984-1988
1984 1985 %Chanse 1986 %Change 1987 %Chanse 1988 %Change
Dispositions 2475 2517 1.7% 2823 14.0% 2634 6.4% 2882 16.4% (District Court)
Dispositions 2467 2409 -2.4% 2788 13.0% 5753 11.6% 3359 36.2% (County Court)
TOTAL 4942 4926 - .3% 5611 13.5% 5387 9.0% 6241 26.3%
74

---------------
Table II compares the percentages of occurrence of various forms of felony dis-
positions in the Nassau County Court System with the Statewide averages. As in-
dicated, Nassau County has a significantly higher conviction rate and correspond-
ing1y low acquittal rate than the Statewide average. It should be noted that with
the exception of category C, below, DCJS data is utilized in this table in the
interest comparability.
Table II
1984
A. Dismissed B. Acquitted C. Convicted D. Guilty Pleas E. Guilty After
Trial F. Dismissed in Sat
isfaction, Plea to Indictment/ SCI
Total Dispositions= A+B+C+F
1985
A. Dismissed' B. Acquitted C. Convicted D. Guilty Pleas E. Guilty After Trial F. Dismissed in Sat
isfaction, Plea to Indictment/SCI
Total Dispositions= A+B+C+F
Explanatory Note:
TYPES OF DISPOSITIONS: NASSAU COUNTY vs. NEW YORK STATE 1984-1985-1986-1987-1988
1984 1984 NASSAU COUNTY NEW YORK STATE*
277 5.8% 2,787 6.3% 69 1.4% 1,229 2.8%
4,266 90.0% 38,268 87.0% 4,098 86.2% 35,147 79.9%
168 3.5% 3,121 7.0%
139 2.9% 1,674 3.8%
4,751 43,958
*DCJS case Processing Data
1985 1985 NASSAU COUNTY NEW YORK STATE*
264 5.5% 2,421 5.4% 45 1.0% 1,209 2.7%
4,372 91.2% 39,753 88.5% 4,199 87.6% 36,580 81.4%
173 3.6% 3,173 7.1%
114 2.4% 1,530 3.4%
4,795 44,913
*DCJS Case Processing Data
For Nassau County Data, C=D+E For New York State Data, C~D+E
75

Table II Cont'd)
1986
A. B. C. D. E. F.
Dismissed Acquitted Convicted Guilty Pleas Guilty After Trial Dismissed in Satisfaction, Plea to Indictment/SCI
Total Dispositions= A+B+C+F
1987 & 1988
A. Dismissed B. Acquitted C. Convicted D. Guilty PIcas E. Guilty After Trial F. Dismissed in Satis-
faction, Plea to Indictment/SCI
Total Dispositions= A+B+C+F
TYPE OF DISPOSITIONS: NASSAU COUNTY vs. NEW YORK STATE
1984-1985-1986-1987-1988
1986 NASSAU COUNTY
363 70
4,869 4,692
177
6.7% 1.3%
90.0% 86.7%
3.3%
Ill· 2.1%
5,413
1987 NASSAU COUNTY
320 6.2% 55 1.1%
4,679 90.1% 4,527 87.1%
152 2.9%
142 2.7%
5,196
*DCJS Case Processing Data
1986 NEW YORK STATE*
2,719 1,171
42,842 39,702 3,140
1,671
48,403
5.6% 2.4%
88.5% 82.0%
6.5%
3.5%
1987 1988 1988 NEW YORK STATE* NASSAU COUNTY NEW YORK STATE*
3,110 5.5% 312 1,243 2.2% 35
49,908 88.8% 5,465 46,744 83.2% 5,334
3,164 5.6% 131
1/955 3.5% 240
56,216 6,052
*DCJS Case Processing Data
76
5,2% 3,454 5.9% N/A 1,217 2.1%
90.3% 52,063 89.3% 88.1% 49,215 84.4%
2.2% 2,848 1.5%
4.0% 1,570 2.7%
58,304
For Nassau County Data, C=D+E For New York State Data, C=D+E
------------------------------------~~-----------------------------------------------

A. Dispositions
Table III outlines the content of all Felony Dispositions in County Court. Where percentage changes are statistically insignificant (less than 1%) they are listed as not applicable. (N/A)
TYPES OF DISPOSITIONS ALL FELONIES - COUNTY COURT
TABLE III
Total Total Total Cases cases Cases 1984-85·
1984 %1984 1985 .%1985 %Change --A. Convictions by Plea 1,967 80% 1,978 82% N/A B. Convictions After Trial 145 6% 157 7% 8.3% C. Acquittal 51 2% 33 1% -35.3% D. D.I.S.* 132 5% 54 2% -59.1% E. Dismissals 59 2% 65 3% 10.2% F. Transfer to Other Courts 6 N/A 3 N/A -50 % G. No True Bill 99 4% 119 5% 20.2%
TOTAL 2,459 2,409 ,.
Total Total Total Cases Total Cases Cases 1984-86 Cases 1984-87
1986 %1986 %Chan2e 1987 %1987.. %Chanse
A. Convictions by Plea 2,273 82% 15.6% 2,237 8i% 13.7% B. Convictions After Trial 153 5% 5.5% 142 5% - 2.1% C. Acquittal 51 2% N/A 40 1% -21.6% D. D.I.S.* 38 1% -71.2% 79 3% -40.2% E. Dismissals 84 3% 42.4% 76 3% 28.8% F. Transfer to Other Courts 3 N/A -50 % 4 N/A -33.3% G. No True Bill 186 7% 87.9% 175 6% 76.8%
TOTAL 2,788 2,753
*Case dismissed in satisfaction of other pleas.
Note: The base rate of conviction can be determined by considering total of A and B as a percentage of totals AI B, C, E. By this we determine the base rate of convictions was 95.0% for 1984, 95.6% for 1985, 94.7% for 1986, 95.4% for 1987 & 96.5% for 1988.
77

Table III (Cont'd)
TYPES OF DISPOSITIONS ALL FELONIES - COUNTY COURT
Total Total Total Cases Cases Cases 1984-88
**1984 %1984 1988 %1988 %Change
A. Convictions 1,967 80% 2,781 83% 41.4% by Plea
B. Convictions 145 6% 121 4% -16.6% After Trial
C. Acquittal 51 2% 24 1% -52.9% D. D.I.S.* 132 5% 175 5% 32.6% E. Dismissals 59 2% 80 2% 35.6% F. Transfer to 6 N/A 2 N/A -66.7%
Other Courts G. No True Bill 99 4% 176 5% 77.8%
TOTAL 2,459 3,359
'"' **We report 1984 statistics for purposes of comparison with 1988.
*Case dismissed in satisfaction of other pleas.
Note: The base rate of conviction can be determined by considering total of A and B as a percentage of totals A,B,C/E. By this we determined the base rate of convictions was 95% for 1984, 95.6% for 1985, 94.7% for 1986, 95.4% for 1987 & 96.5% for 1988.
78

TABLE IV TYPES OF DISPOSITIONS
ROBBERY - COUNTY COURT
Total Total Total Cases Cases Cases 1984-1985
ROBBERY 1984 %1984 1985 %1985 %Change
A. Convictions by Plea .359 78% 234 77% - 34.8% B. Convictions After Trial 35 8% 34 11% 2.9% C. Acquittal 18 4% 3 N/A - 83.3% D. D.I.S. 27 6% 5 2% - 81.5% E. Dismissals 7 2% 9 3% 28.6% F. Transfer to Other Courts I N/A 2 N/A 100 % G. No True Bill 14 3% 16 5% 14.3%
TOTAL 461 303
Total Total Total Total Cases Total Cases Total Cases Cases 1984-1986 Cases 1984-1987 Cases 1984-1988
ROBBERY 1986 %1986 %Chan~ 1987 1987 %Change 1988 1988 %Change
A. Convictions by Plea 294 71% - 18.1% 268 75% - 25.3% 271 71% - 24.5% B. Convictions After
Trial 45 11% 28.6% 20 6% - 42.9% 19 5% - 45.7% C. Acquittal 20 5% 11.1% 11 3% - 38.9% 4 1% - 77.8% D. D.I-S. 6 1% - 77.8% 18 5% - 33.4% 44 11% 63 % E. Dismissals 17 4% 142.9% 10 3% 42.9% 7 2% N/A F. Transfer to Other
Courts 1 N/A N/A 1 N/A N/A 2 N/A 100 % G. No True Bill 34 8% 142.9% 28 8% 100 % 36 9% 157.1%
TOTAL 417 356 383
79

TABLE IV (Cont'd)
TYPES OF DISPOSITIONS BURGLARY - COUNTY COURT
Total Total Total Cases Cases Cases 1984-1985
BURGLARY 1984 %1984 1985 %1985 %Change
A. Convictions by plea 461 80% 446 89% 3.3% B. Convictions After Trial 36 6% 21 4% - 41.7% C. Acquittal 9 2% 2 N/A - 77.8% D. D.I.S. 37 6% 11 2% - 70.3% E. Dismissals 14 2% 7 1% - 50 % F. Transfer to Other Courts 2 N/A 0 N/A -100 % G. No True Bill 16 3% 15 3% 6.3%.
TOTAL 575 502
Total Total Total Total Cases Total Cases Total Cases Cases 1984-86 Cases 1984-87 Cases 1984-88
BURGLARY 1986 %1986 %Change 1987 %1987 %Change 1988 %1988 %Change
A. Convictions by plea 443 87% 3.9% 364 83% - 21.0% 353 82% - 23.4% B. Convictions After Trial 18 4% - 50 % 20 5% - 44.4% 19 4% - 47.2% C. Acquittal 6 1% - 33.3% 8 2% - 11.1% 1 N/A - 88.9% D. D.I.S. 8 2% - 78.4% 17 4% - 54.1% 35 8% 5.4% E. Dismissals 12 2% - 14.3% 6 1% - 57.1% 9 2% - 35.7% F. Transfer to Other Courts 0 N/A -100 % 0 N/A -100 % 0 N/A -100 % G. No True Bill 22 4% 37.5% 21 5% 31.2% 13 3% - 18.8%
TOTAL 509 436 430
80

TABLE IV (Cont'd)
NARCOTICS
A. Convictions by Plea B. Convictions after Trial C. Acquittal D.' D.I.S. E. Dismissals F. Transfer to Other Courts G. No True Bill
TOTAL
NARCOTICS
A. Convictions by Plea B. Convictions After Trial C. . Acquittal D. D.loS. E. Dismissals F. Transfer to Other Courts G. No True Bill
TOTAL
TYPE OF DISPOSITIONS NARCOTIC CASES - COUNTY COURT
1986
322 20
3 7
14 0 8
374
1988
956 22
3 25 11
0 17
1,034
Total Cases %1986
86% 5%
N/A 2% 4%
N/A 2%
81
1987
568 25
3 11 14
0 10
631
Total Cases %1988
92% 2%
N/A 2% 1%
N/A 2%
Total Cases %1987
90% 4%
N/A 2% 2%
N/A 2%
Total Cases 1986-1988 %Change
196.9% 10 % N/A
257.1% - 21.4%
N/A 112.5%
Total Cases 1986-1987 %Chanse
76.4% 25 % N/A 57.1% N/A N/A 25 %

TYPES OF SENTENCES
TABLE V ALL FELONIES - COUNTY COURT
Total Total Total cases cases Cases 1984-1985
1984 %1984 1985 %1985 %Change
A Incarceration (State) 713 34% 632 29% - 11.4% B Incarceration (Local) 705 34% 852 40% 20.9% *c Probation 534 26% 538 25% N/A *D Conditional Discharge 10 N/A 7 N/A - 30 % *E Restitution Fine/Other 122 6% 108 5% - 11.5% F Unconditional Discharge 2 N/A 7 N/A 250 %
TOTAL 2,086 2,144
When there are multiple sentence conditions, each defendant is counted once based on his or her most stringent sentence category (See Table V & VI).
Total Total Total Total Cases Total Cases Total cases Cases 1984-86 cases 1984-87 Cases 1984-1988 1986 %1986 %Change 1987 %1987 %Change 1988 %1988 %Change
A Incarceration (State) 809 35% 13.5% 766 33% 7.4% 874 27% 22.6% B Incarceration (Local) 798 35% 13.2% 824 36% 16.9% 1,186 37% 68.2% *C Probation 550 24% 3 % 556 24% 4.1% 582 18% 9 % *D Conditional Discharge 15 N/A 50 % 22 N/A 120 % 390 12% 380 % *E Restitution Fine/Other 119 5% - 2.5%' 145 6% 18.9% 213 7% 74.6% F Unconditional Discharge 0 N/A -100 % 4 N/A 100 % 3' N/A 50 %
TOTAL 2,291 2,317 3,248
*Thees three are understated due to the statistical hierarchy referred to above.
82

TYPES OF SENTENCES ROBBERY - COUNTY COURT
TABLE VI
Ttoal Total Total Cases cases cases 1984-1985
ROBBERY 1984 %1984 1985 %1985 %Chanse
A Incarceration (State) 216 55% 154 57% - 28.7% B Incarceration (Local) 108 28% 63 23% - 41.7%
*C Probation 61 16% 49 18% - 19.7% *D Conditional Discharge O. N/A 1 N/A 100 % *E Restitution Fine/Other 5 1% 2 N/A - 60 % F Unconditional Discharge 0 N/A 0 N/A N/A
TOTAL 390 269
When there are mUltiple sentence conditions each defendant is counted once based on his or her most stringent sentence category (See Table V & VI).
Total Total Total Cases TotCtI cases Total Cases 1984-1986 Cases 1984-1987 cases
ROBBERY 1986 %1986 %Chanse 1987 %1987 %Chanse 1988 %1988
A Incarceration (State) 210 63% - 2.8% 176 62% - 18.5% 171 58% B Incarceration (Local) 79 24% - 26.9% 60 21% - 44.4% 83 28%
*C Probation 47 14% - 23 % 44 15% - 27.9% 32 11% *D Conditional Discharge 0 N/A N/A 1 N/A 100 % 1 N/A *E Restitution Fine/Other 0 N/A -100 % 4 1% - 20 % 6 2% F Unconditional Discharge 0 N/A N/A 0 N/A N/A 0 N/A
TOTAL 336 285 293
*These three are understated due to the statistical hierarchy referred to above.
83
Total Cases 1984-1988 %Chan.se
- 20.8% - 23.1% - 47.5% 100 %
20 % N/A

TABLE VI (Cont'd)
BURGLARY
A. Incarceration (State) B. Incarceration (Local)
*C. Probation *D. Conditional Discharge *E. Restitution Fine/Other
F. Unconditional Discharge
TOTAL
BURGLARY
A. Incarceration (State) B. Incarceration (Local)
*C. Probation *D. Conditional Discharge *E. Restitution Fine/Other F. Unconditional Discharge
TOTAL
1984
207 149 128
3 6 0
493
Total cases
1986 %1986
201 44% 126 28% 122 27%
3 N/A 5 1% 0 N/A
457
Tl~ES OF SENTENCES BURGLARY - COUNTY COURT
Total Total cases cases %1984 1985 %1985
42% 180 38% 30% 165 35% 26% 119 25% N/A 1 N/A
1% 8 2% N/A 0 N/A
473
Total Total cases Total Cases 1984-86 cases 1984-1987 %Chan~ 1987 %1987 %Chanse 1988
- 2.9% 176 47% - 15. % 156 -15.4% 101 27% - 32.2% 120 - 4.7% 89 24% - 30.5% 76
N/A 4 1% 33.3% 8 -16.7% 2 N/A - 66.7% 14
N/A 0 N/A N/A 0
372 374
*These three are understated due to the statistical hierarchy referred to on p.
84
Total cases 1984-1985 %Change
- 13 % 10.7%
7 % - 66.7%
33.3% N/A
Total Total Cases cases 1984-1988 %1988 %Chanse
42% - 24.6% 32% - 19.5% 20% - 40.6%
2% 166.7% 4% 133.3%
N/A N/A

TABLE VI (Cont'd)
NARCOTICS
A. Incaccecation (State) B. Incaccecation (Local)
*C. Pcobation *D. Conditional Dischacge *E. Restitution Fine/Othec F. Unconditional Dischacge
TOTAL
NARCOTICS
A. Incaccecation (State) B. Incaccecation (Local
*C. Pcobation *D. Conditional Dischacge *E. Restitution Fine/Othec
F. Unconditional Dischacge
TOTAL
TYPES OF SENTENCES NARCOTIC CASES - COUNTY COURT
Total Cases
1986 %1986 1987
149 44% 212 103 30% 235
86 25% 128 0 N/A 0 2 N/A 3 0 N/A 0
340 578
Total Cases
1988 %1988
335 34% 440 45% 181 18%
7 N/A 16 2%
0 N/A
979
Total Total Cases Cases 1986-1987 %1987 %Chanse
37% 42.3% 41% 128.2% 22% 48.8% N/A N/A N/A 50 % N/A N/A
Total Cases 1986-1988 %Chanse
124.8% 327.2% 110.5% 100 % 700 % N/A
*These thcee ace undecstated due to the statistical hiecacchy cefecced to on p.
85

GRAPH TWO - SENTENCES ON CONVICTION ON INDICTMENTS AND SUPERIOR COURT INFORMATION - COUNTY COURT
1984
D & F No Significant %
1986
D & F No Significant %
ALL FELONIES (See TABLE V PG. 82
1988
F No Si~~ificant %
KEY
A. Incarceration (State) B. Incarceration (Local) C. Probation D. Conditional Discharge E. Restitution/Fine/Other F. UnccnditionalDischarge
86
1985
D & F No Significant %
1987
D & F No Significant %

----------------------------------------------~S~U~P~E~R~I~O~R~ .. ~C~O~U~.~;;;o~I~~;;~O~~~~~~~·T~vi~~~~N~~~N~~U~~~~~NTS AND
1984
D & F No Significant %
1986
D, E, F No Significant %
ALL ROBBERIES (SEE TABLE VI PG. 83
1988
D & F No Significant %
KEY
A. Incarceration (State) B. Incarceration (Local) C. Probation D. Conditional Discharge E. Restitution/Fine/Other F. UnccnditionalDischarge
87
1985
D, E & F No Significant %
1987
D & F No Significant %

GRAPH FOUR - 'SENTENCES ON CONVICTION ON INDICTMENTS AND SUPERIOR COURT INFORMATION - COUNTY COURT
1984
D, F No Significant %
1986
D, F, No Significant %
. ALL BURGLARIES
(SEE TABLE VI, PG.84
1988
)
1985
D, F, No Significant %
1987
E, F, No Significant %
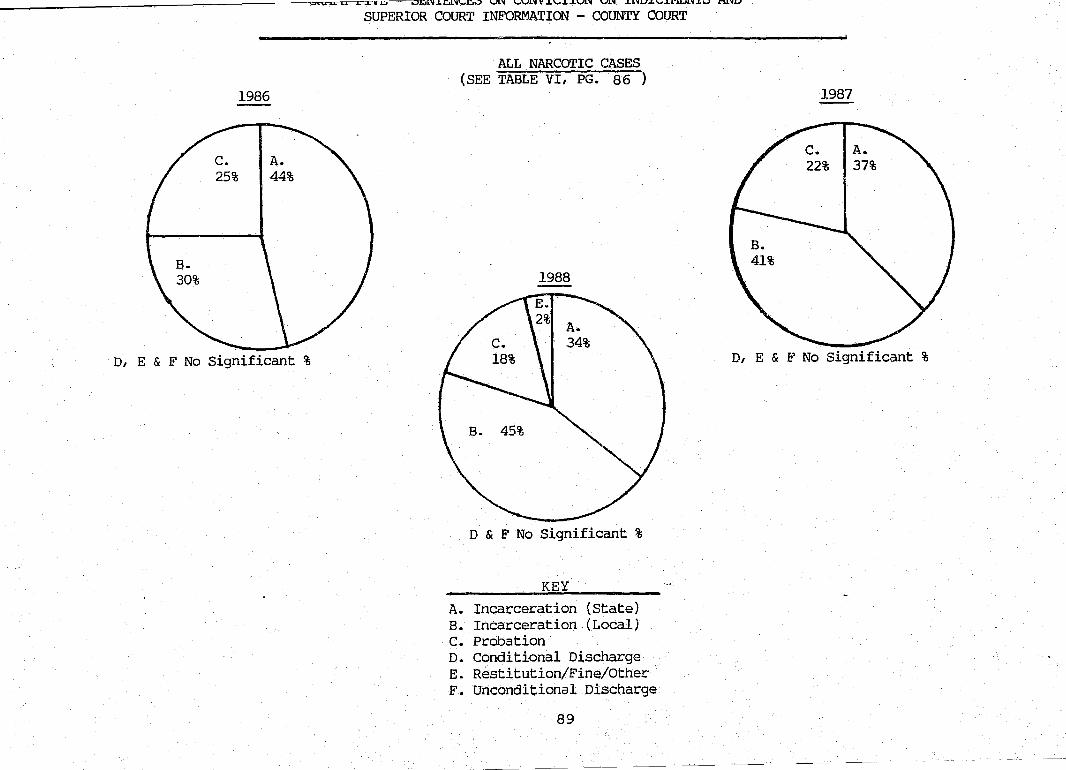
~ ____________________________________ ~~='VV=~U~L~.~.~W'--~~~~-UL~~~V~~£~UN UN INDICTMENTS AND SUPERIOR COURT INFORMATION - COUNTY COURT
C. 25%
1986
A. 44%
D, E & F No Significant %
ALL NARCOTIC CASES (SEE TABLE VI, PG. 86 )
1988
D & F No Significant %
KEY
A. Incarceration {State) B. Incarceration (Local) C. Probation D. Conditional Discharge E. Restitution/Fine/Other F. Unconditional Discharge
89
1987
C. I A. 22% 37%
D, E & F No Significant %

---- - --- ----_.---------
TABLE VII
CASE PROCESSING TIME - COUNTY COURT
Table VII describes the mean time it takes to process a felony case in County Court. Time periods when the case is classified as inactive (such as during the pendancy of a warrant) are not included.
A. Mean Days Arrest to Disposition (Inc. Plea & Trial)
1984 1985 1984-1985 %ChanS}e
All Felonies 233 219 - 6% Robbery 227 211 - 7% Burglary 272 191 - 30%
1984-1986 1984-1987 1984-1988 1986 %Chan~e 1987 %Chan~e 1988 %Chan~e
All Felonies 212 9% 220 6% 222 5% Robbery 220 3% 218 4% 205 - 10% Burglary 201 - 26% 212 - 22% 189 - 31% Narcotics 222 218 257
B. Mean Days Arrest to Plea/Verdict (Excluding Time to Sentence)
1984 1985 1984-1985 %Chan~e
All Felonies 168 162 - 4% Robbery 159 152 - 4% Burglary 210 128 - 39%
1984-1986 1984-1987 1984-1988 1986 %Change 1987 %Change 1988 %Change
All Felonies 163 - 3% 167 N/A 162 - 4% Robbery 176 11% 172 8% 161 1% Burglary 153 - 27% ,154 -27% 139 - 34% Narcotics 177 166 176
C. Mean D~S to Plea (Excluding Trial Time & Time to Sentence)
1984 1985 1984-1985 %Change
All Felonies 159 151 - 5% Robbery 146 151 3% Burglary 204 121 - 41%
1984-1986 1984-1987 1984-1988 1986 %Chan~e 1987 %Chan~e 1988 %Change
All Felonies 155 - 3% 155 - 3% 153 - 4% Robbery 155 S% 160 10% 149 2% Burglary . 149 - 27% 148 - 27% 130 - 36% Narcotics 172 160 173
90

SECTION II
DISTRICT COURT ACTIVITY PERTAINING TO DISPOSITION OF FELONIES
In the development of a Criminal Justice Management Information
System, of which this report may be considered a part, the key ele
ments are: 1) the number of reported criminal incidents, 2) the
number of arrests resulting from those incidents, 3) the number of
cases prosecuted as a result of arrests and 4) the number and type
of convictions and sentences resulting from the cases that are prose
cuted. A shortcoming of the previous case processing reports was
that the number of dispositions appeared to be far lower than the
number of felony cases filed. This was due to the fact that the
cases which were filed as felonies and disposed of as misdemeanors
in District Court were not included. Thus, in the interest of pre
senting a more definitive picture of the actual workings of the
prosecutorial and court components of the system, we are including a
escription of the felony cases that were disposed of in District
ourt as non-felonies.
91
. I

TABLE VIII
1984
A. Convictions By Plea 2,131 B. Convictions After Trial 23 C~ Acquittal 18 D. D.1.S. 76 E. Dismissals 218 F. Transfer to Other Courts 9
TOTAL 2,475
Total Cases
1986 %1986 A. Convictions By Plea 2,419 86% B. Convictions After Trial 24 N/A C. Acquittal 19 N/A D. D.1.S. 73 3% E. Dismissals 279 10% F. Transfer to Other Courts 9 N/A
Total 2,823
TYPES OF DISPOSITIONS FELONIES - DISTRICr COURT
Total Total Cases Cases %1984 1985 %1985
86% 2,221 88% N/A 16 N/A N/A 12 N/A
3% 60 2% 9% 199 8%
N/A 9 N/A -2,517
Total cases Total 1984-1986 Cases %Chanse 1987 %1987
13.5% 2,290 87% 4 .. 3% 10 N/A 5.6% 15 N/A 3.9% 63 2%
28 % 244 9% N/A 12 N/A
2,634
.92
Total Cases 1984-1985 %Change
4 % -30.4% -33.3% -21 % - 8.7%
N/A
Ttoal Total Cases Total Cases 1984-1987 Cases 1984-1988 %Chan~ 1988 %1988 %Chan..se
7.4% 2,553 89% 19~8% - 57 % 10 N/A - 56.5% - 16.7% 11 N/A - 38.9% ~ 17.1% 65 2% - 14.5%
11.9% 232 8% 6.4% N/A 11 N/A 22.2%
2,882

TYPES OF DISPOSITIONS ROBBERY, BURGLARY, NARCOTICS - DISTRICT COURT
TABLE IX
Total Total Total Cases Cases Cases 1984-1985
ROBBERi 1984 %1984 1985 %1985 %Chan~e
A. Convictions By Plea 75 63% 76 67% 1.3% B. Convictions After Trial 2 2% 0 N/A -100 % C. Acquittal 1 N/A 0 N/A -100 % D. D.1.S. 15 13% 17 15% 13.3% E. Dismissals 23 19% 18 16% - 22.7% F. Transfer to Other Courts 4 3% 2 2% - 50 %
TOTAL 120 113
Total Total Total Total Cases Total Cases Total Cases Cases 1984-1986 Cases 1984-1987 Cases 1984-1988
ROBBERY 1986 %1986 %Chan~ 1987 %1987 %Change 1988 %1988 %Change
A. Convictions By Plea 83 66% 10.7% 105 79% 40 % 115 74% 53.3% B. Convictions After 0 N/A - 100 % 0 N/A -100 % 0 N/A -100 %
+,rial C. Acquittal 2 2% 100 % 0 N/A -100 % 0 N/A -100 % D. D.1.S. 9 7% 40 % 5 4% - 66.7% 5 3% - 66.7% E. Dismissals 27 22% 17.4% 20 15% - 13 % 31 20% 34.8% F. Transfer to
OtherCourts 4 3% N/A 3 2% - 25 % 4 3% N/A
TOTAL 125 133 155
93

TYPES OF DISPOSITIONS ROBBERY, BURGLARY, NARCOTICS - DISTRICT COURT
TABLE IX (Cont'd)
Total Total Total Cases Cases Cases 1984-1985
BURGLARY 1984 %1984 1985 %1985 %Change
A. Convictions By Plea 281 80% 285 88% 1.4% B. Convictions After Trial 1 N/A 2 N/A 100 % C. Acquittal ·1 N/A 0 N/A -100 % D. D.!. S. 17 5% 13 4% - 23.5% E. Dismissals 49 14% 24 7% - 51 % F. Transfer to Other Courts 1 N/A 0 N/A -100 %
TOTAL 350 324
Total Total Total Total Cases Total Cases Total Cases Cases 1984-1986 Cases 1984-1987 Cases 1984-1988
BURGLARY 1986 %1986 %Change 1987 %1987 %Change 1988 %1988 %Change
A. Convictions By Plea 257 86% - 29.6% 299 86% 6.4% 299 87% 6.4%
B. Convictions After Trial 4 1% 300 % 1 N/A N/A 0 N/A -100 %
C. Acquittal 0 N/A 100 % 1 N/A N/A 0 N/A -100 % D. D.1.S. 12 4% - 29.4% 16 5% - 5.9% 12 4% 1.7% E. Dismissals 27 9% - 44.9% 31 9% - 36.7% 29 8% - 40.8% F. Transfer to
Other Courts 0 N/A -100 % 1 N/A N/A 2 N/A 100 %
TOTAL 300 349 342
94

TYPES OF DISPOSITIONS ROBBERY, BURGLARY, NARCOTICS - DISTRICT COURT
TABLE IX (Cont'd)
Total Total Total Cases Cases Cases 1986-1987 NARCOTICS 1986 %1986 1987 %1987 %ChanSle
A. Convictions By Plea 126 83% 128 66% 1.2% B. Convictions After Trial 0 N/A 3 2% 100 % C. Acquittal 0 N/A 1 N/A 100 % D. D.1.S. 1 ·N/A 12 6% 1, 100 % E. Dismissals 26 17% 50 26% 92.3% F. Transfer to Other Courts 0 N/A 0 N/A N/A
TOTAL 152 194
Total 'fotal Cases Cases 1986-:-1988 NARCOTICS 1988 %1988 %ChanSle
A. Convictions By Plea 189 87% 50 % B. Convictions After Trial 2 N/A 100 % C. Acquittal 0 N/A N/A D. D.1.S. 11 5% 1,000 % E. Dismissals 16 7% 38.5% F. Transfer to Other Courts 0 N/A N/A
TOTAL, 218
95

TYPES OF SENTENCES
FELONIES - DISTRICT COURT
TABLE X
Total Total Total Cases Cases Cases 1984-1985
1984 %1984 1985 %1985 %Change
A. Incarceration (Local) 572 27% 615 28% 7.5% B. Probation 741 35% 728 33% - 1.8% C. Conditional Discharge 208 10% 230 11% 10.6% D. Restitution Fine/Other 556 27% 602 28% 8.3% E. Unconditional Discharge 12 N/A 8 N/A -33.3%
TOl'AL 2,089 2,183
Total Total Total Total Cases Ttoal Cases Total Cases Cases 1984-1986 Cases 1984-1987 Cases 1984-1988
1986 %1986 %Change 1987 %1987 %Change 1988 %1988 %Change
A. Incarceration (Local) 689 32% 20.5% 666 34% 16.4% 774 31% 35.3% B. Probatiort 772 35% 4.2% 706 36% 4.7% 703 28% 5.1% C. Conditional Discharge 245 11% 17.8% 132 7% - 36.5% 190 8% 8.7% D. Restitution Fine/Other 446 20% - 19.8% 448 23% - 19.4% 810 33% 45.7% E. Unconditional Discharge 27 1% 125 % 16 N/A 33.3% 12 N/A N/A
TOl'AL 2,179 1,968 2,489
96

TABLE XI
A. Incarceration (Local) B. Probation C. Conditional Discharge D. Restitution Fine/Other E. Unconditional Discharge
TOTAL
Total cases
ROBBERY 1986 %1986
A. Incarceration 32 43% (Local)
B. Probation 25 34% C. ConditiQ!1al
/,-
Discharge 11 15% D. Restitution
Fine/Other 6 8% E. Unconditional
Discharge 0 N/A
TOTAL 74
TYPES OF SENTENCES ROBBERY - DISTRICT COURT
Total Total cases Cases
1984 %1984 1985 %1985
18 25% 30 40% 22 31% 17 23% 5 7% 12 16%
26 37% 16 21% 0 N/A 0 N/A
71 75
Total Total cases Total cases 1984-1986 cases 1984-1987 %Chan~ 1987 %1987 %Chanse
77.8% 43 48% 138.9%
13.6% 33 37% 50 %
120 % 3 3% - 40 %
- 76.9% 10 11% - 61.5%
N/A 1 1% 100 %
90
97
Total cases 1984-1985 %Chanse
66.7% - 22.7%
140 % - 38.5%
N/A
Total Total Cases Cases 1984-1988
1988 %1988 %Chanse
50 45% 177.8%
23 21% 4.5%
10 9% 100 %
1 N/A - 96.2%
28 25% 100 %
112

.I;'
TYPES OF SENTENCES
BURGLARY - DISTRICT COURT
TABLE XI Cont'd)
Total Total Total Cases Cases cases 1984-1985
BURGLARY 1984 %1984 1985 %1985 %Chanse
A. Incarceration (Local) 77 29% 88 31% 14.3% B. Pr:-obation 110 41% 92 33% - 16.4% C. Conditional Discharge 26 10% 30 11% 15.4% D. Restitution Fine/Other 51 19% 70 25% 37.3% E. Unconditional Discharge 5 2% 2 N/A - 60 %
TOTAL 269 282
Total Total Total Total Cases Total Cases Total Cases cases 1984-1986 Cases 1984-1987 Cases 1984-1988
BURGLARY 1986 %1986 %Change 1987 %1987 %Change 1988 %1988 %Change
A. Incarceration (Local) 74 31% - 3.9% 105 39% 36.4% 99 36% 28.6% B. Probation 97 40% - 1108% 92 34% -16.4% 74 27% - 32.7% C. Conditional Discharge 28 12% 7.7% 22 8% - 15.4% 24 9% - 8.3% D. Restitution Fine/Other 36 15% - 29.4% 48 18% - 5.9% 78 28% 52.9% E. Unconditional Discharge 5 2% N/A 3 1% - 40 % 1 N/A - 80 %
TOTAL 240 270 276
98

TABLE XI (Cont'd)
NARCOTICS 1986
A. Incarceration (Local) 38 B. Probation 49 C. Conditional Discharge 11 D. Restitution Fine/Other 15 E. Unconditional Discharge 0
Tal'AL 113
NARCOTICS 1988
A. Incarceration (Local) 85 B. Probation 52 C. Conditional Discharge 5 D. Restitution Fine/Other 47 E. Unconditional Discharge 2
Tal'AL 191
TYPES OF SENTENCES NARCOTIC CASES - DISTRICT COURT
Total Total Cases cases %1986 1987 %1987
34% 47 41% 43% 49 43% 10% 4 3% 13% 14 12% N/A 1 N/A
115
Total Total Cases Case 1986-1988 %1988 %Chan~e
45% 123.7% 27% 6.1%
3% - 54.5% 25% 213.3%
1% 100 %
99
Total Cases 1986-1987 %Change
23.7% N/A
- 63.6% - .6.7% 100 %

1984
E, No Significant %
1986
.:I •. 0' .::> l .• - '::>:!.. 0" CESFOR FELONIES DISPOSED OF IN DISTRIcr COURT
(SEE TABLE X, PG. 96)
1988
33% A. 31%
E, No Significant %
KEY
A. Incarceration (Local) B. Probation C. Conditional Discharge D. Restitution/Fine/Other E. Unconditional Discharge
100
1985
E, No Significant %
1987
E, No Significant %

D. 37%
1984
E, No Significant %
1986
A. 25%
GRAPH SEVEN - SENTENCES FOR ROBBERIES DISPOSED OF IN DISTRICT COURT
(SEE TABLE XI, PG. 97 )
1988
E. 25% I A.
45%
D, No Significant %
KEY
A. Incarceration (Local) B. Probation C. Conditional Discharge D. Restitution/Fine/Other E. Unconditional Discharge
101 E, No Significant %
1985
E, No Significant %
1987

,...---------------------------------~-~~=.~.~.~~~ .......... __:W: .... :::L::\J~4:":=U~.LCI.;:) U.L';:)I='V.::lJ!.U VIr iN
DISTRICl' COURT
(SEE TABLE XI, PG.98
1984 1985
1986
1988
D. A. 28% '36%
E, No Significant %
KEY
A. Incarceration (Local) B. Probation c. Conditional Discharge D. Restitution/Fine/Other Eo Unconditional Discharge
102
A. 25% I 31%
E, No Significant %
1987

1986
E, No significant %
~RAPH NINE - SENTENCES FOR NARCOTIC CASES DISPOSED OF IN DISTRICT COURT
(SEE TABLE XI, PG. 99 )
1988
KEY
A. Incarceration (Local) B. Probation C. Conditional Discharge D. Restitution/Fine/Other E. Unconditional Discharge
103
1987
E, No Significant %

TABLE XII
CASE PROCESSING TIME - DISTRICT COURT
Table XII, below, describes the mean time it takes to process a felony case in District Court. Time periods when the case is classified as inactive (such as during the pendency of a warrant) are not included.
A. Mean Days Arrest to Disposition 1984-1985
1984 1985 %Chanse
All Felonies 182 198 9%
Robbery 338 208 - 38%
Burglary 212 221 4%
1984-1986 1984-1987 1984-1988 1986 %Chan~ 1987 %Chan~ 1988 %Change
All Felonies 168 8% 154 - 15% 149 18%
Robbery 156 - 54% 172 - 49% ],;50 56%
Burglary 160 - 25% 142 - 33% 139 34%
Narcotics 240 193 156
B. Mean Days Arrest to Plea/Verdict (Excludins Time to Sentence)
1984-1985 1984 1985 %Chanse
All Felonies 106 114 8%
Robbery 323 141 - 56%
Burglary 101 113 12%
104

TABLE XII (Contid)
CASE PROCESSING TIME - DISTRICT COURT
B. Mean Days Arrest to Plea/Verdict (Excluding Time to Sentence) Cont'd)
1984-1986 1984-1987 1984-1988 1986 %Chan~ 1987 %Change 1988 %Chanse
All Felonies 116 9% 107 N/A 104 2%
Robbery 105 67% 107 - 67% 115 - 64%
Burglary 112 11% 98 3% 91 - 10%
Narcotics· 207 152 125
C. Mean Days Arrest to Plea (Excluding Trial Time & Time to Sentence)
1984-1985 1984 1985 %Ch~e
All Felonies 107 112 5%
Robbery 321 140 - 56%
Burglary 101 112 11%
1984-1986 1984-1987 1984-1988 1986 %Chan~ 1987 %Cfii'mge 1988 %Change
All Felonies 115 7% 107 N/A 105 - 2%
Robbery 114 - 64% 110 - 66% 118 - 63%
Burglary 108 7% 96 5% 92 - 9%
Narcotics 215 159 125
105

SECTION III
ANALYSIS OF HIGH CHARGE AT ARREST VS CHARGE AT CONVICTION
Some of the factors that impact on the analysis of pleas of
guilty are: 1) the possible oVer-charging of a defendant~ 2) the
reactivation of cases from long-outstanding indictment warrants
when a defendant is finally apprehended; 3) the legal problems in
proving certain cases~ and 4) the reduction of charges in exchange
for a defendant's guilty plea, consistent with normal District
Attorney's office policies.
Table XIII shows a comparison between the initial highest
charge at arrest and the charge at point of conviction whether
by guilty verdict after trial or by plea of guilty.
Charge reductions shown in the guilty verdict after trial
columns, in Table XIII on page and , are not the result
of plea negotiations, but rather are a result of the trial
process.
106

COUNTY COURT FELONY CONVICTIONS 1984-1988
TABLE XIII
GUILTY VERDICT AFTER TRIAL
HIGH CHARGE High Felony Other Lesser Non AT·ARREST Charge Felony Felony TOTALS
1984
All Felonies 96 66% 32 22% 17 12% 145
Robbery 22 63% 10 29% 3 9% 35
Burglary 29 81% 3 8% 4 11% 36
1985
All Felonies 116 74% 31 20% 10 6% 157
Robbery 29 85% 5 15% 0 N/A 34
Burglary 19 90% 1 5% 1 5% 21
1986
All Felonies 113 74% 29 19% 11 7% 153
Robbery 32 71% 10 22% 3 7% 45
Burglary 13 72% 4 22% 1 6% 18
Narcotics 18 90% 1 5% 1 5% 20
1987
All Felonies 93 65~ 28 20% 21 15% 142
Robbery 14 70% 4 20% 2 10% 20
Burglary 16 80% 1 5% 3 15% 20
Narcotics 12 48% 8 32% 5 20% 25
1988
All Felonies 76 63% 21 17% 24 20% 121
Robbery 13 68% 3 16% 3 16% 19
Burglary 12 63% 1 5% 6 32% 19
Narcotics 15 68% 3 14% 4 18% 22
107

COUNTY COURT FELONY CONVICTION$ 1984-1988
TABLE XIII (Cont'd)
PLEA OF GUILTY
HIGH CHARGE High Felony Other Lesser Non AT ARREST Charge Felony Felony TOl'ALS
1984
All Felonies 630 32% 939 48% 398 20% 1,967
Robbery 116 32% 227 63% 16 4% 359
Burglary 177 38% 221 48% 63 14% 461
1985
All Felonies 622 32% 921 47% 420 21% 1,963
Robbery 68 29% 160 69% 5 2% 233
Burglary 155 35% 232 52% 56 13% 443
J.986
All Felonies 756 33% 1,010 45% 491 22% 2,257
Robbery 91 31% 188 64% 15 5% 294
Burglary 158 35% 234 53% 49 11% 441
Narcotics 32 10% 273 85% 16 5% 321
1987
All Felonies 580 26% 1,168 53% 472 21% 2,220
Robbery 61 23% 185 69% 21 8% 267
Burglary 103 28% 218 60% 41 11% 362
Narcotics 42 7% 494 87% 29 5% 565
1988
All Felonies 607 22% 1,563 57% 594 21% 2,764
Robbery 59 22% 185 68% 27 10% 271
Burglary 96 28% 189 54% 64 18% 349
Narcotics 65 7% 849 89% 38 4% 952
108