Embed Size (px)
Citation preview
JASEM ISSN 1119-8362 All rights reserved
J A S E M .OURNAL OF PPLIED CIENCE AND NVIRONMENTAL ANAGEMENT
J. Appl. Sci. Environ. Manage. Sept, 2015
Vol. 19 (3) 539 - 546 Full-text Available Online at
www.ajol.info and www.bioline.org.br/ja
Cross plotting of Rock Properties for Fluid and Lithology Discrimination using Well
Data in a Niger Delta Oil Field
*1BELLO, RASAQ;
1IGWENAGU, C. LINDA;
2ONIFADE, YS
1Department of Physics, University of Port Harcourt, Port Harcourt, Nigeria
2Department of Physics, Federal University of Petroleum Resources, Effurun, Nigeria
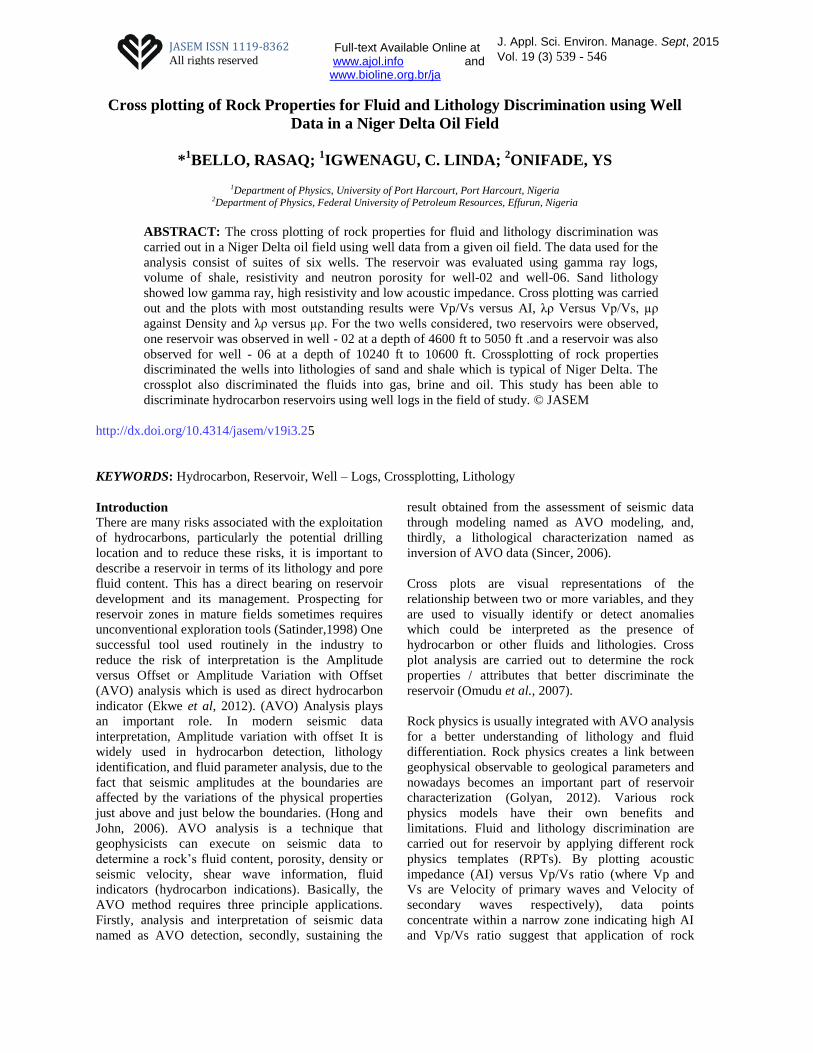
ABSTRACT: The cross plotting of rock properties for fluid and lithology discrimination was
carried out in a Niger Delta oil field using well data from a given oil field. The data used for the
analysis consist of suites of six wells. The reservoir was evaluated using gamma ray logs,
volume of shale, resistivity and neutron porosity for well-02 and well-06. Sand lithology
showed low gamma ray, high resistivity and low acoustic impedance. Cross plotting was carried
out and the plots with most outstanding results were Vp/Vs versus AI, λρ Versus Vp/Vs, µρ
against Density and λρ versus µρ. For the two wells considered, two reservoirs were observed,
one reservoir was observed in well - 02 at a depth of 4600 ft to 5050 ft .and a reservoir was also
observed for well - 06 at a depth of 10240 ft to 10600 ft. Crossplotting of rock properties
discriminated the wells into lithologies of sand and shale which is typical of Niger Delta. The
crossplot also discriminated the fluids into gas, brine and oil. This study has been able to
discriminate hydrocarbon reservoirs using well logs in the field of study. © JASEM
http://dx.doi.org/10.4314/jasem/v19i3.25
KEYWORDS: Hydrocarbon, Reservoir, Well – Logs, Crossplotting, Lithology
Introduction
There are many risks associated with the exploitation
of hydrocarbons, particularly the potential drilling
location and to reduce these risks, it is important to
describe a reservoir in terms of its lithology and pore
fluid content. This has a direct bearing on reservoir
development and its management. Prospecting for
reservoir zones in mature fields sometimes requires
unconventional exploration tools (Satinder,1998) One
successful tool used routinely in the industry to
reduce the risk of interpretation is the Amplitude
versus Offset or Amplitude Variation with Offset
(AVO) analysis which is used as direct hydrocarbon
indicator (Ekwe et al, 2012). (AVO) Analysis plays
an important role. In modern seismic data
interpretation, Amplitude variation with offset It is
widely used in hydrocarbon detection, lithology
identification, and fluid parameter analysis, due to the
fact that seismic amplitudes at the boundaries are
affected by the variations of the physical properties
just above and just below the boundaries. (Hong and
John, 2006). AVO analysis is a technique that
geophysicists can execute on seismic data to
determine a rock’s fluid content, porosity, density or
seismic velocity, shear wave information, fluid
indicators (hydrocarbon indications). Basically, the
AVO method requires three principle applications.
Firstly, analysis and interpretation of seismic data
named as AVO detection, secondly, sustaining the
result obtained from the assessment of seismic data
through modeling named as AVO modeling, and,
thirdly, a lithological characterization named as
inversion of AVO data (Sincer, 2006).
Cross plots are visual representations of the
relationship between two or more variables, and they
are used to visually identify or detect anomalies
which could be interpreted as the presence of
hydrocarbon or other fluids and lithologies. Cross
plot analysis are carried out to determine the rock
properties / attributes that better discriminate the
reservoir (Omudu et al., 2007).
Rock physics is usually integrated with AVO analysis
for a better understanding of lithology and fluid
differentiation. Rock physics creates a link between
geophysical observable to geological parameters and
nowadays becomes an important part of reservoir
characterization (Golyan, 2012). Various rock
physics models have their own benefits and
limitations. Fluid and lithology discrimination are
carried out for reservoir by applying different rock
physics templates (RPTs). By plotting acoustic
impedance (AI) versus Vp/Vs ratio (where Vp and
Vs are Velocity of primary waves and Velocity of
secondary waves respectively), data points
concentrate within a narrow zone indicating high AI
and Vp/Vs ratio suggest that application of rock
Cross plotting of Rock Properties for Fluid and Lithology Discrimination 540
*1BELLO, RASAQ;
1IGWENAGU, C. LINDA;
2ONIFADE, YS.
physics template in the study area needs significant
modification compared to generalized RPTs. As
typically used in the oil and gas industry, the term
rock physics is usually applied to the measurement,
modeling, and interpretation of elastic wave
propagation in sedimentary rocks (Golyan, 2012).
MATERIALS AND METHOD This section presents a procedure used to evaluate
petrophysical properties from wireline log data and
surface seismic data. Our approach to discriminate
between fluids and lithologies from well log and
seismic data include four major steps: well-log
editing and modelling, well log cross-plotting,
seismic modeling and attribute generation from
seismic data using model-based inversion.
Data Collection
The data used in this thesis include well log data,
check-shot surveys, directional surveys and
biostratigraphy information from a Niger Delta field
provided by Chevron Nigeria Ltd. The data consists
of suites of six wells (01, 02, 03, 04, 05 and 06) and
its seismic sections. The analysis was done using
Hampson Russell Software (HRS). The well log data
was evaluated and rock attribute cross-sections were
created.
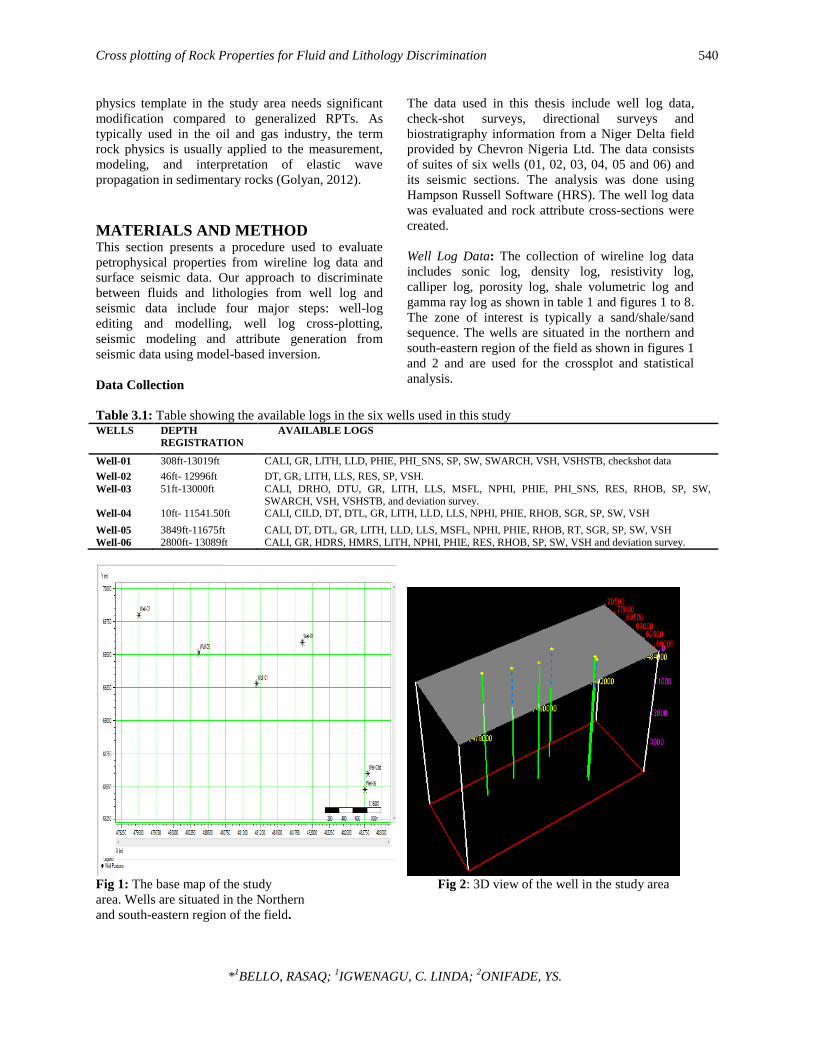
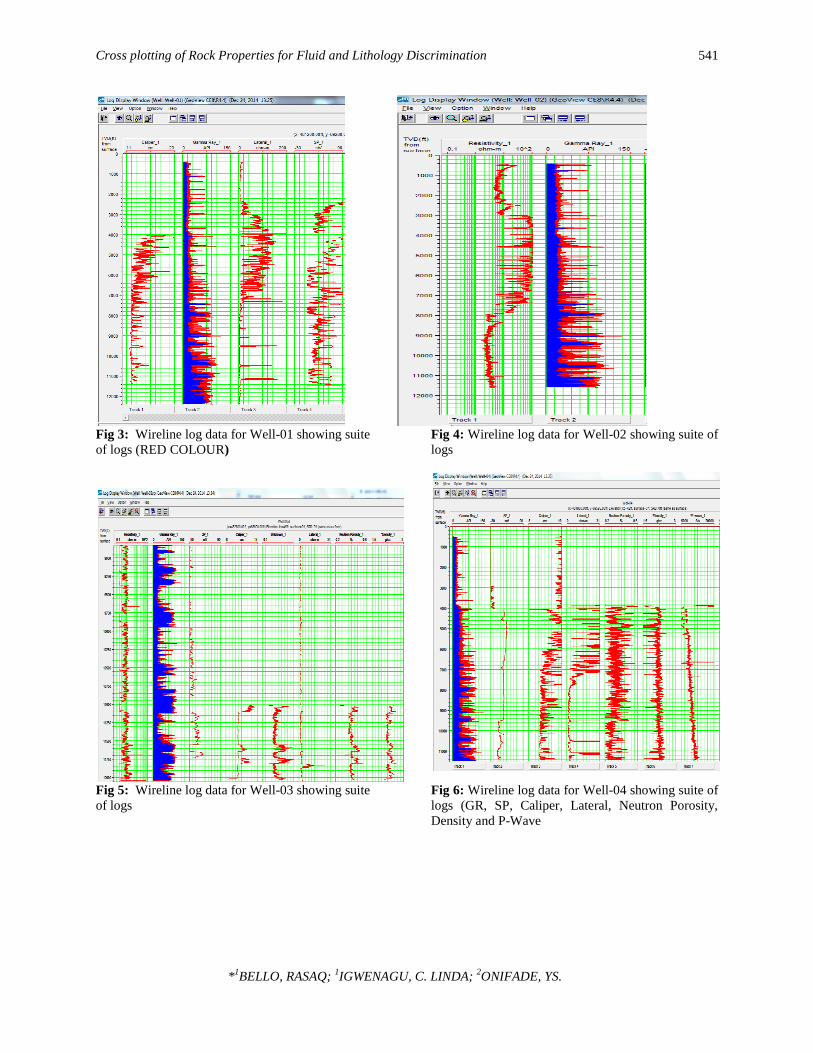
Well Log Data: The collection of wireline log data
includes sonic log, density log, resistivity log,
calliper log, porosity log, shale volumetric log and
gamma ray log as shown in table 1 and figures 1 to 8.
The zone of interest is typically a sand/shale/sand
sequence. The wells are situated in the northern and
south-eastern region of the field as shown in figures 1
and 2 and are used for the crossplot and statistical
analysis.
Table 3.1: Table showing the available logs in the six wells used in this study WELLS DEPTH
REGISTRATION
AVAILABLE LOGS
Well-01 308ft-13019ft CALI, GR, LITH, LLD, PHIE, PHI_SNS, SP, SW, SWARCH, VSH, VSHSTB, checkshot data
Well-02 46ft- 12996ft DT, GR, LITH, LLS, RES, SP, VSH.
Well-03 51ft-13000ft CALI, DRHO, DTU, GR, LITH, LLS, MSFL, NPHI, PHIE, PHI_SNS, RES, RHOB, SP, SW,
SWARCH, VSH, VSHSTB, and deviation survey.
Well-04 10ft- 11541.50ft CALI, CILD, DT, DTL, GR, LITH, LLD, LLS, NPHI, PHIE, RHOB, SGR, SP, SW, VSH
Well-05 3849ft-11675ft CALI, DT, DTL, GR, LITH, LLD, LLS, MSFL, NPHI, PHIE, RHOB, RT, SGR, SP, SW, VSH
Well-06 2800ft- 13089ft CALI, GR, HDRS, HMRS, LITH, NPHI, PHIE, RES, RHOB, SP, SW, VSH and deviation survey.
Fig 1: The base map of the study Fig 2: 3D view of the well in the study area
area. Wells are situated in the Northern
and south-eastern region of the field.
Cross plotting of Rock Properties for Fluid and Lithology Discrimination 541
*1BELLO, RASAQ;
1IGWENAGU, C. LINDA;
2ONIFADE, YS.
Fig 3: Wireline log data for Well-01 showing suite
of logs (RED COLOUR)
Fig 4: Wireline log data for Well-02 showing suite of
logs
Fig 5: Wireline log data for Well-03 showing suite
of logs
Fig 6: Wireline log data for Well-04 showing suite of
logs (GR, SP, Caliper, Lateral, Neutron Porosity,
Density and P-Wave
Cross plotting of Rock Properties for Fluid and Lithology Discrimination 542
*1BELLO, RASAQ;
1IGWENAGU, C. LINDA;
2ONIFADE, YS.
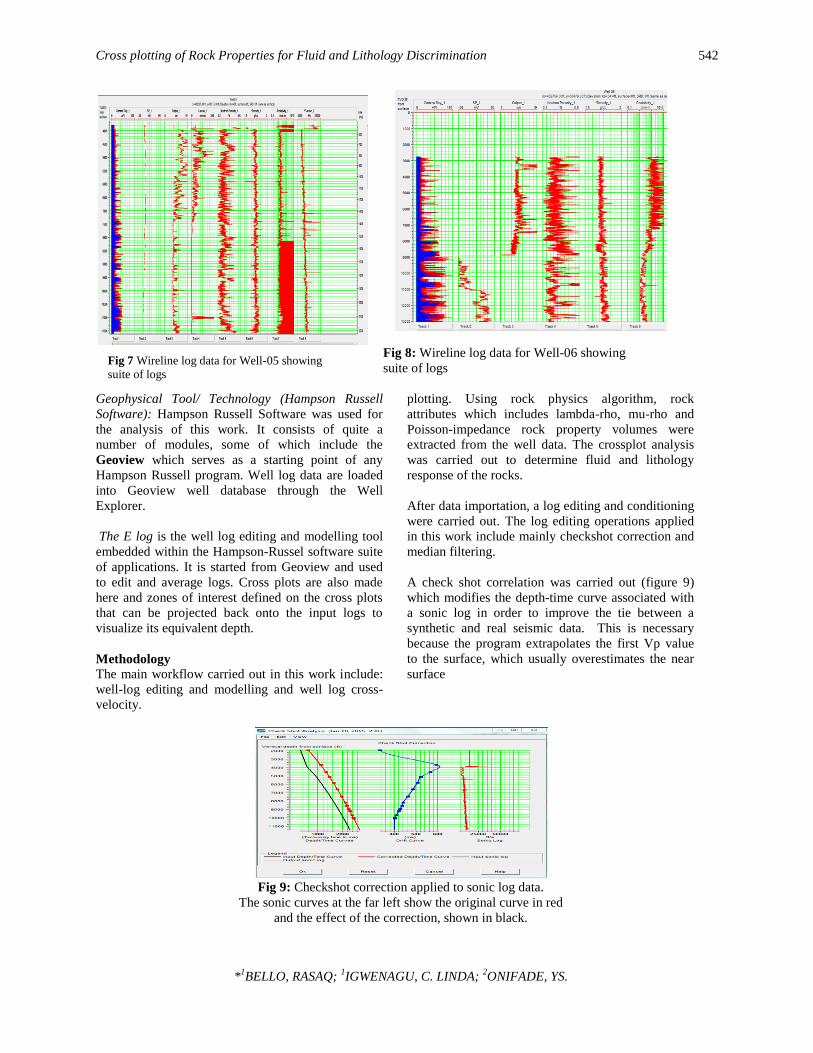
Fig 8: Wireline log data for Well-06 showing
suite of logs
Geophysical Tool/ Technology (Hampson Russell
Software): Hampson Russell Software was used for
the analysis of this work. It consists of quite a
number of modules, some of which include the
Geoview which serves as a starting point of any
Hampson Russell program. Well log data are loaded
into Geoview well database through the Well
Explorer.
The E log is the well log editing and modelling tool
embedded within the Hampson-Russel software suite
of applications. It is started from Geoview and used
to edit and average logs. Cross plots are also made
here and zones of interest defined on the cross plots
that can be projected back onto the input logs to
visualize its equivalent depth.
Methodology
The main workflow carried out in this work include:
well-log editing and modelling and well log cross-
plotting. Using rock physics algorithm, rock
attributes which includes lambda-rho, mu-rho and
Poisson-impedance rock property volumes were
extracted from the well data. The crossplot analysis
was carried out to determine fluid and lithology
response of the rocks.
After data importation, a log editing and conditioning
were carried out. The log editing operations applied
in this work include mainly checkshot correction and
median filtering.
A check shot correlation was carried out (figure 9)
which modifies the depth-time curve associated with
a sonic log in order to improve the tie between a
synthetic and real seismic data. This is necessary
because the program extrapolates the first Vp value
to the surface, which usually overestimates the near
surface
velocity.
Fig 9: Checkshot correction applied to sonic log data.
The sonic curves at the far left show the original curve in red
and the effect of the correction, shown in black.
Fig 7 Wireline log data for Well-05 showing
suite of logs
Cross plotting of Rock Properties for Fluid and Lithology Discrimination 543
*1BELLO, RASAQ;
1IGWENAGU, C. LINDA;
2ONIFADE, YS.
Well Log Attribute - Crossplot Analysis: Cross plots
are visual representations of the relationship between
two or more variables, and they are used to visually
identify or detect anomalies which could be
interpreted as the presence of hydrocarbon or other
fluids and lithologies. Cross plot analysis are carried
out to determine the rock properties / attributes that
better discriminate the reservoir (Omudu etal, 2007).
The goal of this rock physics analysis is to determine
the feasibility of discriminating between reservoir
facies and imaging architecture using seismic
attributes. Several crossplots shall be done, but the
ones with the most significant discriminating power
between litho-fluid facies shall be used for analysis.
A typical crossplots that shall be done in this work is
the crossplot of Vp/Vs Ratio against Acoustic
Impedance (Zp). This crossplot shows fluid as well as
lithology discrimination along the acoustic impedance
axis. It describes the conditions in terms of lithology
and fluid content than VP/VS ratio. P-impedance and
VP/VS ratio relationship discriminate both fluid and
lithology. The VP/VS ratio is a fluid indicator because
compressional waves are sensitive to fluid changes,
whereas shear waves are not except in the special case
of very viscous oil. P-impedance shows a better
discrimination which can better describe the reservoir
conditions in terms of lithology and fluid content than
the VP/VS ratio.
Acoustic impedance (or product of velocity and
density) and Poisson’s ratio (or ratio VP/VS) contrast
can show the position of gas-sand, water-sand and
shale in a VP/VS versus impedance crossplot.
Well - Log Rock attribute Estimation: In this stage,
rock attributes were estimated from the input log data
using rock-physics algorithms created in HAMPSON
RUSSELL eLOG tool. These attributes include shear
wave velocity from Castagna’s equation, Vp/Vs ratio
and acoustic impedance. Acoustic impedance is the
product of p-wave velocity and density. Castagna et al.
(1985) have given empirical relations from estimating
Vs from Vp in multimineral, brine-saturated rocks
based on empirical, polynomial Vp-Vs relations in
pure monomineralic lithology (Castagna et al., 1993).
The polynomial regression coefficient given by
Castagna et al., (1993) for pure
monomineraliclithologies is given as
(1)
where is the empirical regression coefficients, Vp
and Vs are the P- and S-wave velocities.
Simple combination of the Vp, Vs and density rock
properties were used in the generation of the attributes.
Goodway et al., (1997) proposed the lambda-mu-rho
technique which has its origin in the hard rock
exploration areas of Canada. The lambda-rho is given
as
(2)
where are the compressional velocity,
shear velocity and density and c = 2. Russell et al.,
(2003) observed that with availability of well log data,
‘c’ could be determined locally. The constant, c,
influences the fluid component computation which
varies for different geologic environment. The value of
c for both offshore and onshore falls within the range
obtained by Dillon et al., (2003). The Murho
technique is simply the square of the S-wave
impedance and represents rigidity (solid component)
μ = (3)
RESULTS AND DISCUSSION This section shows results from cross plots. The cross
plots analyses are useful in differentiating between
fluid and lithologies in the reservoir (Omudu et al.,
2007). Cross plotting is widely used in AVO analysis,
because it facilitates the simultaneous and meaningful
evaluation of two attributes. Cross plotting appropriate
pairs of attributes so that common lithologies and fluid
types generally cluster together allows for
straightforward interpretation.
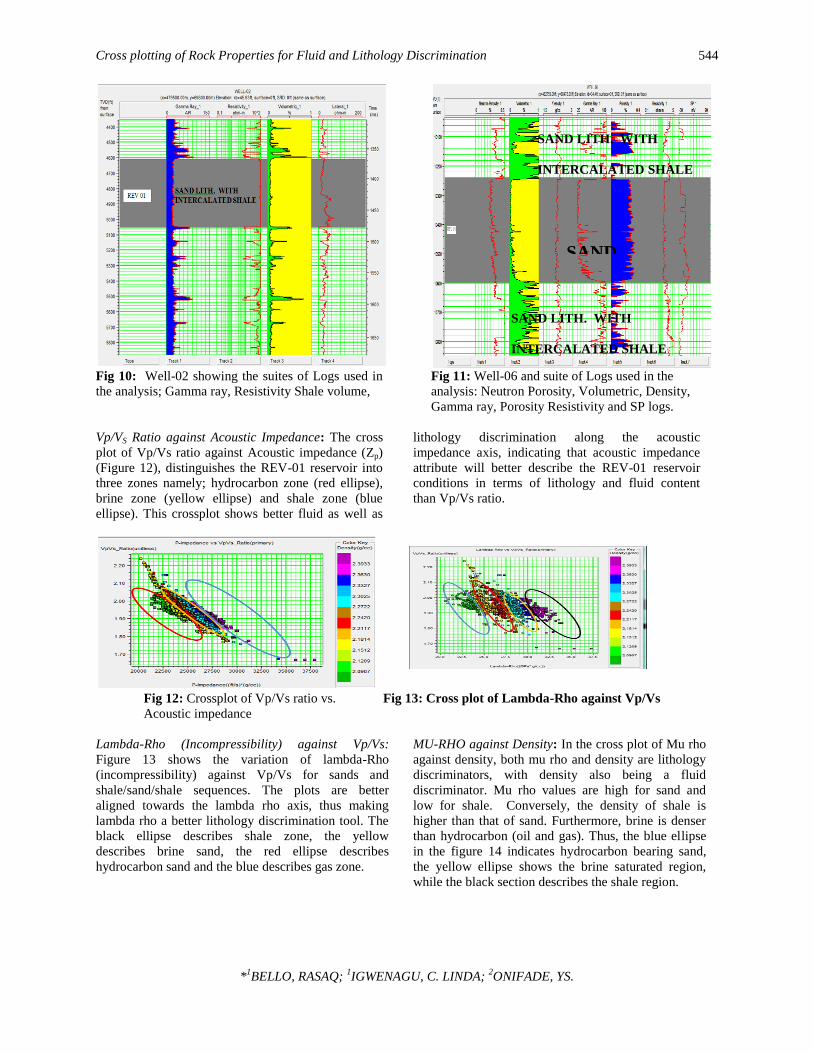
Reservoir Evaluation Using Logs: The well curves
used for the analysis are shown in Figure 10 and
Figure 11. The logs include caliper, gamma ray, shale
volume and resistivity for well-02 and well-06. These
wells were chosen among the six wells because they
contain some useful suite of logs. The wells exhibit a
dominantly shale/sand/shale sequence typical of the
Niger Delta formation. The wells were analysed in
terms of fluid type and lithology. Shale lithologies
were delineated by the high gamma ray value. Shale
lithologies cause the deflection of resistivity to the far
left due to its high conductive nature. Regions
showing low gamma ray, high resistivity, and low
acoustic impedance are mapped as sand lithologies.
Sand lithologies showing very low acoustic impedance
and high resistivity are regions of high hydrocarbon
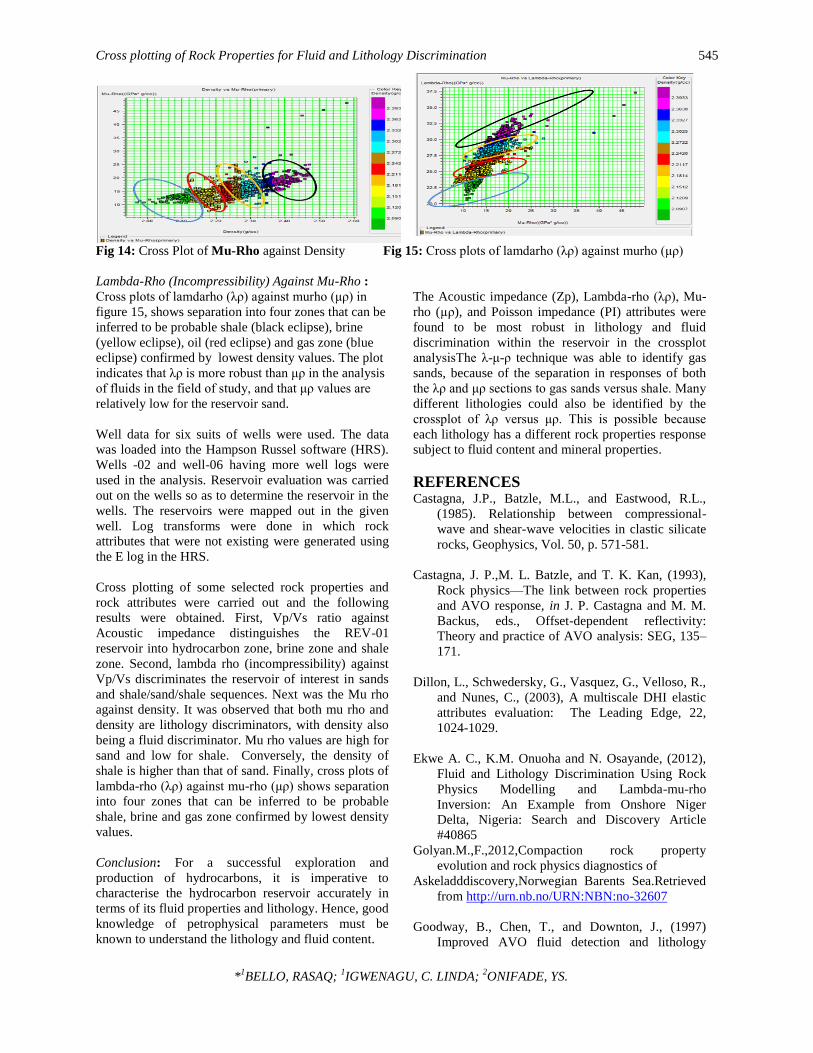
saturation. In well-06, the REV-01 reservoir is
characterised
by high porosities.
Cross plotting of Rock Properties for Fluid and Lithology Discrimination 544
*1BELLO, RASAQ;
1IGWENAGU, C. LINDA;
2ONIFADE, YS.
Fig 10: Well-02 showing the suites of Logs used in
the analysis; Gamma ray, Resistivity Shale volume,
Fig 11: Well-06 and suite of Logs used in the
analysis: Neutron Porosity, Volumetric, Density,
Gamma ray, Porosity Resistivity and SP logs.
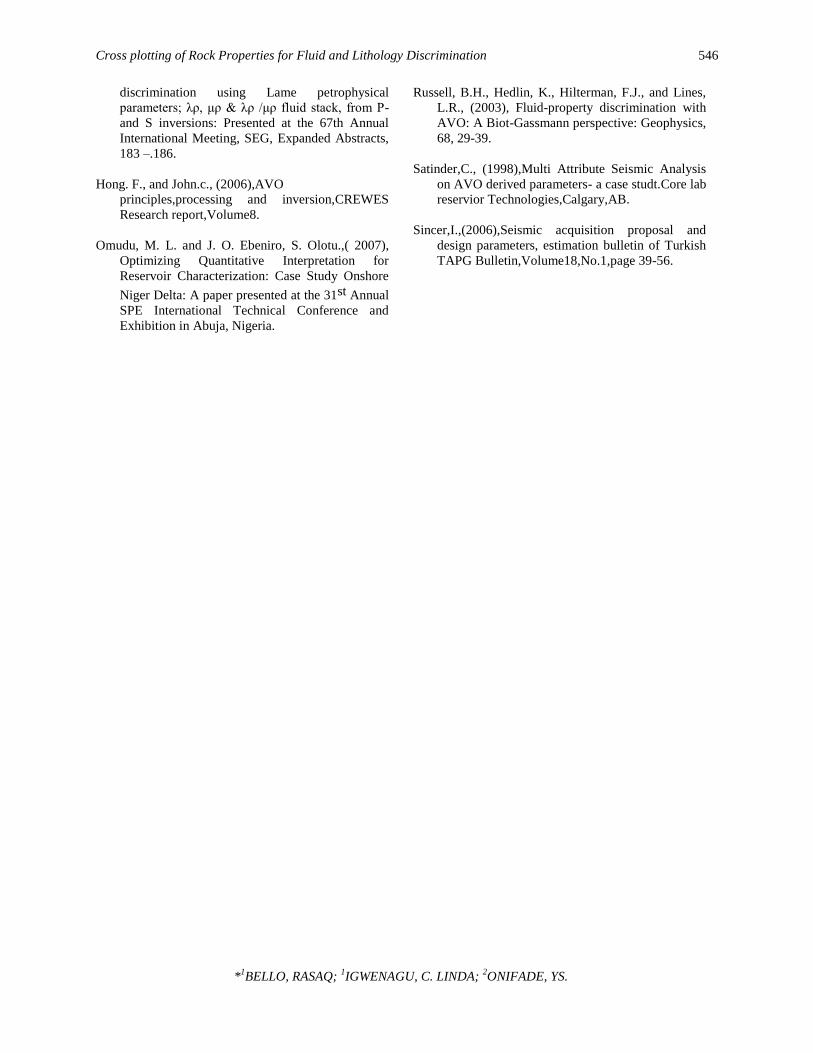
Vp/VS Ratio against Acoustic Impedance: The cross
plot of Vp/Vs ratio against Acoustic impedance (Zp)
(Figure 12), distinguishes the REV-01 reservoir into
three zones namely; hydrocarbon zone (red ellipse),
brine zone (yellow ellipse) and shale zone (blue
ellipse). This crossplot shows better fluid as well as
lithology discrimination along the acoustic
impedance axis, indicating that acoustic impedance
attribute will better describe the REV-01 reservoir
conditions in terms of lithology and fluid content
than Vp/Vs ratio.
Fig 12: Crossplot of Vp/Vs ratio vs. Fig 13: Cross plot of Lambda-Rho against Vp/Vs
Acoustic impedance
Lambda-Rho (Incompressibility) against Vp/Vs:
Figure 13 shows the variation of lambda-Rho
(incompressibility) against Vp/Vs for sands and
shale/sand/shale sequences. The plots are better
aligned towards the lambda rho axis, thus making
lambda rho a better lithology discrimination tool. The
black ellipse describes shale zone, the yellow
describes brine sand, the red ellipse describes
hydrocarbon sand and the blue describes gas zone.
MU-RHO against Density: In the cross plot of Mu rho
against density, both mu rho and density are lithology
discriminators, with density also being a fluid
discriminator. Mu rho values are high for sand and
low for shale. Conversely, the density of shale is
higher than that of sand. Furthermore, brine is denser
than hydrocarbon (oil and gas). Thus, the blue ellipse
in the figure 14 indicates hydrocarbon bearing sand,
the yellow ellipse shows the brine saturated region,
while the black section describes the shale region.
SAND LITH. WITH
INTERCALATED SHALE
SAND
LITH.
SAND LITH. WITH
INTERCALATED SHALE
Cross plotting of Rock Properties for Fluid and Lithology Discrimination 545
*1BELLO, RASAQ;
1IGWENAGU, C. LINDA;
2ONIFADE, YS.
Fig 14: Cross Plot of Mu-Rho against Density Fig 15: Cross plots of lamdarho (λρ) against murho (μρ)
Lambda-Rho (Incompressibility) Against Mu-Rho :
Cross plots of lamdarho (λρ) against murho (μρ) in
figure 15, shows separation into four zones that can be
inferred to be probable shale (black eclipse), brine
(yellow eclipse), oil (red eclipse) and gas zone (blue
eclipse) confirmed by lowest density values. The plot
indicates that λρ is more robust than μρ in the analysis
of fluids in the field of study, and that μρ values are
relatively low for the reservoir sand.
Well data for six suits of wells were used. The data
was loaded into the Hampson Russel software (HRS).
Wells -02 and well-06 having more well logs were
used in the analysis. Reservoir evaluation was carried
out on the wells so as to determine the reservoir in the
wells. The reservoirs were mapped out in the given
well. Log transforms were done in which rock
attributes that were not existing were generated using
the E log in the HRS.
Cross plotting of some selected rock properties and
rock attributes were carried out and the following
results were obtained. First, Vp/Vs ratio against
Acoustic impedance distinguishes the REV-01
reservoir into hydrocarbon zone, brine zone and shale
zone. Second, lambda rho (incompressibility) against
Vp/Vs discriminates the reservoir of interest in sands
and shale/sand/shale sequences. Next was the Mu rho
against density. It was observed that both mu rho and
density are lithology discriminators, with density also
being a fluid discriminator. Mu rho values are high for
sand and low for shale. Conversely, the density of
shale is higher than that of sand. Finally, cross plots of
lambda-rho (λρ) against mu-rho (μρ) shows separation
into four zones that can be inferred to be probable
shale, brine and gas zone confirmed by lowest density
values.
Conclusion: For a successful exploration and
production of hydrocarbons, it is imperative to
characterise the hydrocarbon reservoir accurately in
terms of its fluid properties and lithology. Hence, good
knowledge of petrophysical parameters must be
known to understand the lithology and fluid content.
The Acoustic impedance (Zp), Lambda-rho (λρ), Mu-
rho (µρ), and Poisson impedance (PI) attributes were
found to be most robust in lithology and fluid
discrimination within the reservoir in the crossplot
analysisThe λ-μ-ρ technique was able to identify gas
sands, because of the separation in responses of both
the λρ and μρ sections to gas sands versus shale. Many
different lithologies could also be identified by the
crossplot of λρ versus μρ. This is possible because
each lithology has a different rock properties response
subject to fluid content and mineral properties.
REFERENCES Castagna, J.P., Batzle, M.L., and Eastwood, R.L.,
(1985). Relationship between compressional-
wave and shear-wave velocities in clastic silicate
rocks, Geophysics, Vol. 50, p. 571-581.
Castagna, J. P.,M. L. Batzle, and T. K. Kan, (1993),
Rock physics—The link between rock properties
and AVO response, in J. P. Castagna and M. M.
Backus, eds., Offset-dependent reflectivity:
Theory and practice of AVO analysis: SEG, 135–
171.
Dillon, L., Schwedersky, G., Vasquez, G., Velloso, R.,
and Nunes, C., (2003), A multiscale DHI elastic
attributes evaluation: The Leading Edge, 22,
1024-1029.
Ekwe A. C., K.M. Onuoha and N. Osayande, (2012),
Fluid and Lithology Discrimination Using Rock
Physics Modelling and Lambda-mu-rho
Inversion: An Example from Onshore Niger
Delta, Nigeria: Search and Discovery Article
#40865
Golyan.M.,F.,2012,Compaction rock property
evolution and rock physics diagnostics of
Askeladddiscovery,Norwegian Barents Sea.Retrieved
from http://urn.nb.no/URN:NBN:no-32607
Goodway, B., Chen, T., and Downton, J., (1997)
Improved AVO fluid detection and lithology
Cross plotting of Rock Properties for Fluid and Lithology Discrimination 546
*1BELLO, RASAQ;
1IGWENAGU, C. LINDA;
2ONIFADE, YS.
discrimination using Lame petrophysical
parameters; λρ, μρ & λρ /μρ fluid stack, from P-
and S inversions: Presented at the 67th Annual
International Meeting, SEG, Expanded Abstracts,
183 –.186.
Hong. F., and John.c., (2006),AVO
principles,processing and inversion,CREWES
Research report,Volume8.
Omudu, M. L. and J. O. Ebeniro, S. Olotu.,( 2007),
Optimizing Quantitative Interpretation for
Reservoir Characterization: Case Study Onshore
Niger Delta: A paper presented at the 31st Annual
SPE International Technical Conference and
Exhibition in Abuja, Nigeria.
Russell, B.H., Hedlin, K., Hilterman, F.J., and Lines,
L.R., (2003), Fluid-property discrimination with
AVO: A Biot-Gassmann perspective: Geophysics,
68, 29-39.
Satinder,C., (1998),Multi Attribute Seismic Analysis
on AVO derived parameters- a case studt.Core lab
reservior Technologies,Calgary,AB.
Sincer,I.,(2006),Seismic acquisition proposal and
design parameters, estimation bulletin of Turkish
TAPG Bulletin,Volume18,No.1,page 39-56.


![Petro-elastic and lithology-fluid inversion from seismic ... · Avseth, P.; Mukerji, T. and Mavko, G. [2005] Quantitative Seismic Interpretation - Applying Rock Physics Tools to Reduce](https://img.pdfslide.net/doc/110x75/5b865c407f8b9a2e3f8cb301/petro-elastic-and-lithology-fluid-inversion-from-seismic-avseth-p-mukerji.jpg)