Embed Size (px)
Citation preview

CRTP PERFORMANCE OVER IEEE 802.11
FOR VOIP APPLICATIONS
by
Kevin Ko
B.A.Sc. (Honors), Simon Fraser University, 2001
A PROJECT SUBMITTED IN PARTIAL FULFILLMENT OF
THE REQUIREMENTS FOR THE DEGREE OF
MASTER OF ENGINEERING
In the School
of
Engineering Science
© Kevin Ko 2004
SIMON FRASER UNIVERSITY
April 2004
All rights reserved. This work may not be reproduced in whole or in part,
by photocopy or other means, without permission of the author.

APPROVAL
Name: Kevin Ko
Degree: Master of Engineering
Title of Project: cRTP Performance Over IEEE 802.11
For VoIP Applications
Examining Committee:
Chair: Dr. Mehrdad Saif
Professor and Director of the School of Engineering Science
Dr. R. H. Stephen Hardy Senior Supervisor Professor
Dr. Tejinder Randhawa Supervisor Assistant Professor
Date Approved:
ii

PARTIAL COPYRIGHT LICENCE
I hereby grant to Simon Fraser University the right to lend my thesis, project or extended
essay (the title of which is shown below) to users of the Simon Fraser University Library,
and to make partial or single copies only for such users or in response to a request from
the library of any other university, or other educational institution, on its own behalf or for
one of its users. I further agree that permission for multiple copying of this work for
scholarly purposes may be granted by me or the Dean of Graduate Studies. It is
understood that copying or publication of this work for financial gain shall not be allowed
without my written permission.
Title of Project:
cRTP Performance Over IEEE 802.11
For VoIP Applications
Author:
(Signature)
Kevin Ko (Name)
(Date Signed)
iii

ABSTRACT
The deployment of IEEE 802.11 WLAN networks and Voice-over-IP (VoIP) systems in
offices and homes has surged in recent years, and will likely continue its growth. Due to
its wireless nature, 802.11 networks still trail its wired equivalents in bandwidth and
transmission rates. On the other hand, Voice-over-IP and other real-time applications
are very capable of consuming bandwidth and overwhelming networks that are unable to
handle their rapid-succession traffic streams. The wireless network bandwidth
limitations therefore set the stage as a bottleneck, and can greatly impact the perceived
quality of VoIP connections.
In this report, the effectiveness of RTP header compression (cRTP) and silence
suppression (SS) applied to typical Voice-over-IP traffic over 802.11 wireless networks is
investigated through integrated simulations. Both IEEE 802.11 distributed coordination
function (DCF) and point coordination function (PCF) networks are examined, with
results showing that PCF distributed systems are more suitable toward real-time traffic
such as VoIP. The reduction in packet count and packet sizes result in better perceived
connection quality through shorter end-to-end delays and reduced packet loss.
Correspondingly, the witnessed improvements also allow more users to be
accommodated in a particular network before reaching the same quality-affecting
threshold.
iv

DEDICATION
This work is dedicated to my family
for their unconditional love and support
in all aspects of my life.
v

ACKNOWLEDGEMENTS
The author would like to express his gratitude and appreciation to Dr. Stephen Hardy
and Dr. Tejinder Randhawa for their support, understanding, and knowledge. Their
supervisory roles throughout the execution of this project are thankfully acknowledged.
The author would also like to thank Mr. Zhenhua (Max) Xiao for his valuable advice and
assistance during the course of this work.
vi

TABLE OF CONTENTS
APPROVAL.......................................................................................................... ii
ABSTRACT......................................................................................................... iv
DEDICATION ....................................................................................................... v
ACKNOWLEDGEMENTS ................................................................................... vi
TABLE OF CONTENTS..................................................................................... vii
LIST OF FIGURES.............................................................................................. ix
LIST OF TABLES ............................................................................................... xi
ABBREVIATIONS AND ACRONYMS ............................................................... xii
1 INTRODUCTION............................................................................................ 1
1.1 Problem Definition ..............................................................................................1
1.2 Project Overview.................................................................................................2
2 SPECIFICATION BACKGROUND ................................................................ 4
2.1 RFC2508 cRTP ..................................................................................................4
2.2 Silence Suppression ...........................................................................................9
2.3 IEEE 802.11........................................................................................................9
2.3.1 General Architecture..................................................................................10
2.3.2 Physical Layer ...........................................................................................11
2.3.3 MAC Sublayer ...........................................................................................12
2.3.4 Distributed Coordination Function .............................................................13
2.3.5 Point Coordination Function ......................................................................15
3 SIMULATION MODEL................................................................................. 17
3.1 System Model Overview ...................................................................................17
vii

3.2 Model Components...........................................................................................18
3.2.1 Data Traffic ................................................................................................18
3.2.2 cRTP Process Model .................................................................................19
3.2.3 WLAN Process Model ...............................................................................19
3.3 Simulation Scenarios ........................................................................................20
3.3.1 Selected Parameters .................................................................................21
3.3.2 Assumptions ..............................................................................................22
4 SIMULATION RESULTS ............................................................................. 23
5 CONCLUSION............................................................................................. 36
5.1 Future Considerations ......................................................................................36
6 APPENDIX................................................................................................... 38
REFERENCES................................................................................................... 40
viii

LIST OF FIGURES
Figure 1: Block Diagram for cRTP Header Compressor ...................................................7
Figure 2: Block Diagram for cRTP Header Decompressor ...............................................8
Figure 2-3: IBSS / Ad Hoc Network.................................................................................10
Figure 2-4: ESS Infrastructure Network ..........................................................................11
Figure 2-5: Example of DCF Operation...........................................................................14
Figure 2-6: Example for the PCF Operation....................................................................16
Figure 3-1: Simulation Project Model ..............................................................................17
Figure 3-2: Mobile Station Node Model...........................................................................18
Figure 4-1: Cumulative Packets Sent (packets) versus Time (minutes) .........................24
Figure 4-2: Packet Transmission Sequence During Packet Loss ...................................25
Figure 4-3: Simulated Packet Drops ...............................................................................26
Figure 4-4: cRTP Size / Original Size versus Packet Loss Rate.....................................26
Figure 4-5: Simulated cRTP Voice Traffic over DCF vs. Time........................................27
Figure 4-6: Cumulative Simulated cRTP Voice Traffic over DCF vs. Time.....................28
Figure 4-7: Simulated cRTP Voice Traffic over PCF vs. Time ........................................28
Figure 4-8: Cumulative Simulated cRTP Voice Traffic over PCF vs. Time .....................29
Figure 4-9: Access Point Channel Reservation in DCF DS ............................................30
Figure 4-10: Media Access Delay in DCF DS .................................................................30
Figure 4-11: Access Point Channel Reservation in PCF DS...........................................31
Figure 4-12: Media Access Delay in DCF DS .................................................................31
Figure 4-13: Packet Loss versus Number of Mobile Stations .........................................32
Figure 4-14: Average Media Access Delay versus Number of Mobile Stations ..............34
Figure 4-15: Average End-to-End Delay versus Number of Mobile Stations ..................34
ix

Figure 4-16: Average Bandwidth Load versus Number of Mobile Stations.....................35
Figure 6-1: Average Media Access Delay versus Number of Mobile Stations (Full).......38
Figure 6-2: Average End-to-End Delay versus Number of Mobile Stations (Full) ...........39
x

LIST OF TABLES
Table 1: Voice Models.......................................................................................................9
Table 2: Simulation Goals ...............................................................................................20
Table 3: Simulation Parameters......................................................................................21
xi

ABBREVIATIONS AND ACRONYMS
ACK Acknowledgement
AP Access Point
BSA Basic Service Area
BSS Basic Service Set
CBR Constant Bit Rate
CID Context ID
CFP Contention Free Period
CP Contention Period
CSRC Contributing Source
cRTP Compressed RTP
CSMA/CA Carrier Sense Multiple Access / Collision Avoidance
CTS Clear-to-Send
CW Contention Window
DCF Distributed Coordination Function
DIFS DCF Interframe Space
DS Distribution System
DSSS Direct Sequencing Spread Spectrum
ESS Extended Service Set
IBSS Independent Basic Service Set
IEEE Institute of Electrical and Electronics Engineers
IFS Interframe Space
IP Internet Protocol
xii
ITU-T International Telecommunication Union Telecommunication Standardization Sector
LAN Local Access Network
MAC Medium Access Control
MS Mobile Station
MSDU MAC Service Data Unit
NAV Network Allocation Vector
PC Point Coordinator
PCF Point Coordination Function
PCM Pulse Code Modulation
PIFS PCF Interframe Space
PLC Packet Loss Concealment
POTS Plain Old Telephone Service
RFC Request For Comments
RTP Real-time Transport Protocol
RTS Request-To-Send
SIFS Short Interframe Space
SS Silence Suppression
SSRC Synchronization Source
TBTT Target Beacon Transition Time
UDP User Datagram Protocol
VAD Voice Activity Detection
VBR Variable Bit Rate
VoIP Voice-over-IP
WLAN Wireless LAN
xiii

1 INTRODUCTION
The hype for voice-over-IP (VoIP) started over five years ago, but the technology
encountered some tough times and its popularity has increased at a much slower rate
than first expected. Recent trends have shown a rebound in this area, with more money
being spent on developing and purchasing VoIP equipment [7]. Small businesses and
home users also now have the resources available to manage VoIP capabilities through
a host of software applications, many of which come in open source form for Linux
machines. The cost savings and expanded feature set introduced by VoIP make it an
attractive solution to replace the TDM-based plain old telephone service (POTS)
alternative which has been the incumbent technology over the past century of
telecommunications.
While penetration into the wireless space is relatively low, some trends indicate a
promising future for Wireless Local Area Networks (WLAN) [10]. The convenience of
mobility in both home and office settings is the advantage WLAN has over its wired
predecessor. Much reluctance to deploy WLANs comes from security issues associated
with a wireless medium, however improvements in security management will likely win
over concerned users and increase the rate at which WLAN networks are deployed and
expanded. The Wireless LAN specification is described in more detail in Section 2.3.
1.1 Problem Definition
With both VoIP and WLAN finding their ways into more businesses and homes, it is
hardly inconceivable that these two technologies will eventually merge and coincide on
the same networks. It is therefore important to consider the bandwidth usage VoIP
traffic may exert on a wireless network. VoIP, as with many types of real-time traffic, is
1

capable of occupying a large amount of bandwidth depending on the compression
algorithm used. Different compression algorithms, such as ITU-T defined G.711,
G.723.1, G.726, and G.728, offer a range of compressibility, and hence bandwidth
savings, at the cost of voice quality. VoIP payloads are encapsulated by RTP/UDP/IP
protocol headers, which remain relatively fixed in size at approximately 40 bytes in total
per packet. With higher compression or more frequent sample rates, the size of the
header can be overwhelmingly large – in some cases more than the size of the VoIP
payload itself. When the RTP/UDP/IP headers comprise of a large percent of the total
packet size, it presents poor bandwidth usage. The effects of poor bandwidth usage can
be even more devastating over a WLAN where channel contention and collisions are
more prominent.
From the point of view of VoIP users, the main factor of perceived quality, excluding
voice quality inherent in voice compression algorithms, is end-to-end delay. Many other
factors affect voice quality, such as packet loss, delay jitter, and echo; however
additional algorithms can be added to the VoIP service stack to handle loss, jitter, and
echo, at the expense of the end-to-end timing.
1.2 Project Overview
This project investigates the effects in performance of two bandwidth-reduction options
for Voice-over-IP: RTP/UDP/IP header compression (cRTP) and Silence Suppression
(SS). cRTP and SS are described in Sections 2.1 and 2.2 respectively. The main focus
of this project is on cRTP over 802.11 through the use of simulations in the Optimum
Network Performance (OPNET) simulation software, as there has been less research in
this area.
2

The following statistics are considered for cRTP and SS for VoIP over 802.11:
a) bandwidth usage with and without cRTP/SS,
b) channel access delays,
c) end-to-end packet transmission delays, and
d) packet loss
The details of the simulation system are examined in Section 3, and the simulation
results are revealed in Section 4.
3

2 SPECIFICATION BACKGROUND
Two specifications that compose a large part of this project work are RFC2508 and IEEE
802.11. This section provides some background knowledge to the reader. Silence
suppression is also briefly described in Section 2.2.
2.1 RFC2508 cRTP
Compressed Real-Time Transport Protocol is defined in RFC2508 as an algorithm used
to reduce the size of 40-byte RTP/UDP/IP headers in real-time application traffic.
Devices supporting cRTP recognize that most RTP, UDP, and IP header fields either
remain constant or have a constant first-order difference.
Header fields that generally remain the same are:
IP fields: - version
- IP header length
- type of service
- flags
- time-to-live
- protocol type
- source address
- destination address
UDP fields: - source port
- destination port
RTP fields: - version
- extension
4
- contributing source (CSRC) count
- payload type
- synchronization source (SSRC)
Header fields that generally increment by a fixed number are:
IP fields: - IP identification
RTP fields: - timestamp
- sequence number
Both sender and receiver of the RTP stream must support cRTP in order for it to be
applied properly to the RTP packets. Each endpoint maintains a session context for
each RTP stream, or context, it is a member of. The session context at the sender
(compressor) contains an image of the last RTP/UDP/IP header sent, while the session
context at the receiver (decompressor) contains an image of the last RTP/UDP/IP
header received. Both compressor and decompressor context states also include the
delta values for the fixed-increment fields, calculated from the previous field values and
the newest field values. The compressor compresses outgoing RTP/UDP/IP headers
where possible, sending one of the four packet types described below. Using the
information stored at the decompressor and the fields transmitted in an incoming
compressed packet, each packet can be uncompressed to its original form, then
forwarded to the higher RTP application layer. Session contexts are referenced by a
unique session context ID (CID) assigned to the RTP stream, based on its IP source and
destination addresses, UDP source and destination ports, and RTP SSRC field.
5

Four packet formats are introduced in RFC2508: COMPRESSED_RTP,
COMPRESSED_UDP, FULL_HEADER, and CONTEXT_STATE.
The COMPRESSED_RTP format is used when each of the RTP, UDP, and IP headers
can be compressed with only IP identification, RTP timestamp, RTP sequence number,
RTP marker bit, and RTP CSRCs changing. At best, the header of the
COMPRESSED_RTP packet can be reduced to 2-bytes, depending on the behaviour of
the RTP application.
A COMPRESSED_UDP packet is sent when an RTP field other than those mentioned
for the COMPRESSED_RTP format changes. This compresses the UDP/IP headers
down to between 2 - 6 bytes.
The FULL_HEADER format communicates an uncompressed IP header and is used
when header compression cannot be done or to refresh the session contexts' header
images - particularly after a lost packet.
When a packet is dropped during transmission, the decompressor transmits a
CONTEXT_STATE packet to the sender to indicate that a packet has been lost. This
indicates to the sender that a FULL_HEADER must be sent in order to restore order to
the header-compressed RTP stream. Between the time the receiver sends the
CONTEXT_STATE packet and receives a new FULL_HEADER packet, the session
context is invalidated and all packets for that context are discarded.
Figure 1 and Figure 2 illustrate the cRTP header compressor and decompressor
functionality.
6

Start(Received Uncompressed Packet)
Context found?
Search memoryfor same
session context
Dynamically createand initialize
session contextstate on
compressor
N(first packet)
Y Compare packet tocontext state in
compressor
Last packet?Set context"last packet"
flag
Y
N
Create packet,adding header
fields as required.Update deltas,increment link
sequence
Create packet,adding header
fields as required.Update deltas,increment link
sequence
Update deltas,increment link
sequence
N(UDP/IP only)
N(none)
Y
CanRTP/UDP/IP header be
compressed?
Transmit Packet
End
"last packet"flag set?
RemoveContext fromCompressor
Context Table
N
Y
“SendFULL_HEADER”
flag set?
Y
N
Figure 1: Block Diagram for cRTP Header Compressor
7

Start(Received Packet)
CID found?
Search memoryfor CID
Dynamically createand initialize
session contextstate on
decompressor
N(first packet)
Y
Last packet?Set context"last packet"
flag
Y
N
Update deltas.Create
uncompressedpacket, filling
header fields asrequired
Is headercompressed?
Update deltas.Create
uncompressedpacket, filling
header fields asrequired
Update contextstate values
Y(UDP/IP only)
N(none)
Transmit Packet
End
Y(RTP/UDP/IP)
"last packet"flag set?
RemoveContext from
DecompressorContext Table
N
Y
Ensure nopacket loss
CONTEXT_STATEpacket?
Search memoryfor CID
Set “SendFULL_HEADER”
flag forcompressor
Y
N
Packet lostdetected or
session contextinvalid?
Packet lostdetected or
session contextinvalid?
Y Y
SendCONTEXT_STATE
packet
N
N
Invalidate sessioncontext and
discard packet
Is sessioncontext invalid?
Validate context
Y
Figure 2: Block Diagram for cRTP Header Decompressor
Detailed information on cRTP packet formats and procedures can be found in [12].
8
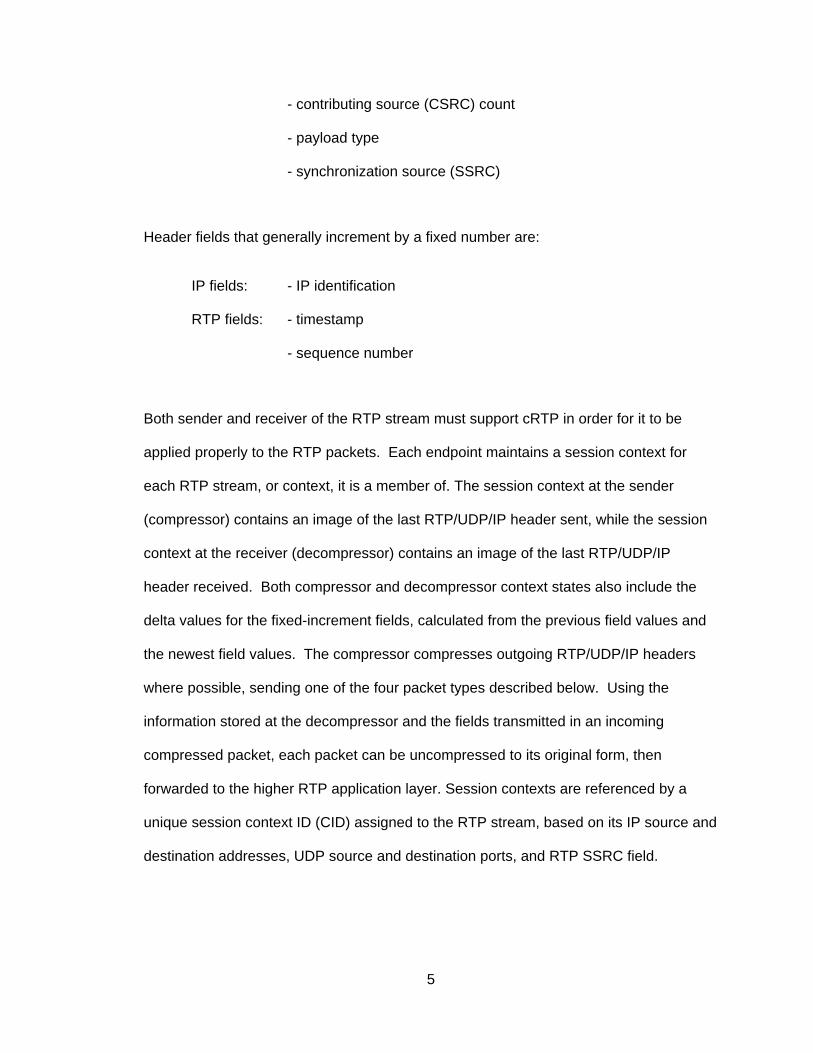
2.2 Silence Suppression
Studies on typical speech patterns show that during a normal conversation, each
speaker is active only 40 percent of the time [8][2]. The remaining 60 percent of the time
is spent listening to the person at the other end of the conversation and during pauses.
Silence suppression algorithms take this phenomenon into account, and does not send
voice packets during silent periods. Silence is determined through voice activity
detection (VAD), where power levels under a certain threshold are considered silence.
Two voice models, Brady’s model [8] and May and Zebo model [2], are commonly used
in modelling speech burstiness. These models have exponentially distributed ON and
OFF state times with mean values shown in the table below.
Model Mean ON Period (seconds)
Mean OFF Period (seconds)
Brady’s Model 1.00 1.35
May and Zebo Model 0.352 0.650
Table 1: Voice Models
For the purposes of this project’s simulations, only Brady’s Model is considered.
2.3 IEEE 802.11
IEEE 802.11 standard, ratified in 1997, defines a wireless local area network
architecture that can be viewed as a wired Ethernet network (IEEE 802.2) to layers
9

above it / application layers. The original specification supports 1Mbps and 2 Mbps
transfer rates.
2.3.1 General Architecture
In an IEEE 802.11 network architecture, a group of mobile stations (MSes) or devices
controlled under a distribution system (DS) is called a Basic Service Set (BSS). A BSS,
which occupies a Basic Service Area (BSA), can be either an Independent Basic Service
Set (IBSS) ad hoc network, in which any station can establish a direct communication
path with any other station (Figure 2-3), or an infrastructure network, where
communications between stations is done through a centralized Access Point (AP).
Figure 2-3: IBSS / Ad Hoc Network
In an infrastructure network, BSSes can have an extended range via inter-
communication of APs from different BSSes. This extended infrastructure is called an
Extended Service Set (ESS), and can also provide access to wired networks via portals.
10

Figure 2-4 illustrates an exemplary infrastructure network. The DS is analogous to a
backbone network responsible for the MAC level transport of MAC service data units
(MSDUs).
Figure 2-4: ESS Infrastructure Network
2.3.2 Physical Layer
Three physical layer implementations are specified for IEEE 802.11: Frequency Hopping
Spread Spectrum (FHSS), Direct Sequence Spread Spectrum (DSSS), and Infrared (IR).
The physical layer is responsible for transmitting packets over the wireless medium, and
if functioning properly, should not be of any concern to the overall system. For this
project, DSSS is considered and used for simulation.
11

2.3.3 MAC Sublayer
The MAC sublayer is responsible for channel allocation, protocol data unit addressing,
frame formatting, error checking, and fragmentation and reassembly. The transmission
medium has two types of operation: contention and non-contention. During contention
periods (CP), all stations contend for the channel for each packet transmitted. This
mode is used for 802.11 Distributed Coordination Function (DCF), as described in
Section 2.3.4. During contention free periods (CFPs), the medium usage is controlled
(or mediated) by the AP, thereby eliminating the need for stations to contend for channel
access. To include CFPs, the medium must alternate between CP and CFP modes,
with enough time during the CP to transmit at least one MSDU under DCF. Each CFP
followed by a CP is called a superframe. 802.11 Point Coordination Function (PCF,
described in Section 2.3.5) is used during the CFP.
IEEE 802.11 supports three different types of frames: management, control, and data.
The management frames are used for station association and disassociation with the
AP, timing and synchronization, and authentication and deauthentication. One
management frame is called a beacon frame, and is sent at the beginning of each
superframe to maintain the synchronization of local timers in the stations and deliver
protocol related parameters. The beacon frame also announces the time the next
beacon frame will arrive, called the target beacon transition time (TBTT). Control frames
are used for handshaking during the CP, for positive acknowledgments during the CP,
and to end the CFP. Data frames are used to transmit data during CPs and CFPs, and
can be combined with polling and acknowledgments during CFPs.
12

2.3.4 Distributed Coordination Function
Distributed Coordination Function is the fundamental 802.11 MAC protocol and uses
Carrier Sense Multiple Access with Collision Avoidance (CSMA/CA) on top of the
physical layer; in other words, it works off a contention-based “listen-before-talk” scheme
for transmission of MSDUs over the wireless medium to reduce the statistical probability
of collisions. Before transmitting a frame, each station must perform a backoff
procedure, sensing the channel for a minimum duration called the DCF Interframe
Space (DIFS) followed by a random backoff time. The additional random backoff time is
a multiple of a slot time. The channel must stay idle during the entire wait before the
frame transmission can be initiated. Each station maintains a contention window (CW)
that determines the remaining number of slot times a station must wait before
transmission. When a station transmits an MSDU, a duration field is set in the MAC
header indicating the time the channel will be busy with the current transaction. Based
on these fields, stations detecting MSDUs sent update their Network Allocation Vectors
(NAVs). The NAV indicates the amount of time remaining for the current transmission
session to complete, before the channel will be idle once again.
In the case of multiple DCF stations, the station with the shortest wait time transmits first.
The remaining stations do not select a new random backoff, but continue to count down
the remaining slots as soon as the channel is idle. This gives the waiting stations higher
priority when they resume transmission attempt. Collisions occur when two or more
stations simultaneously count down to zero. In this case, each transmitting station must
re-transmit with a new backoff time.
13

After each successful transmission, the receiving station acknowledges the frame
reception with an acknowledge frame (ACK) after a Short Interframe Space (SIFS), an
Interframe Space (IFS) shorter than the DIFS. The sender then does another random
backoff, called a “post-backoff”, even if there are no more MSDUs to be delivered. If the
transmission fails, i.e. no ACK is received from the destination station, the transmission
is retried with a doubled CW, reducing the probability of collisions with other stations.
The maximum MSDU size is 2304 bytes. Frames longer than 2304 bytes can be
fragmented into smaller frames and sent individually, following the same collision
avoidance scheme described. As an alternative option to avoid wasted bandwidth due
to collisions with longer frames, a Request-to-Send (RTS) frame, followed by a Clear-to-
Send (CTS) response, can be sent to reserve a channel prior to sending a long frame.
RTS and CTS frames also contain duration fields for other stations to update their NAVs.
Figure 2-5 shows the timing for a possible DCF scenario.
Data
NAV
ACK
rand
om b
ack
SIFS
DIF
S
rand
om b
ackof
f
off
DIF
S
MS01
MS02
Other MSes
Figure 2-5: Example of DCF Operation
14

2.3.5 Point Coordination Function
IEEE 802.11 defines Point Coordination Function as a central controlled access method
coordinated by a Point Coordinator (PC) within the Access Point (AP) in each BSS. PCF
is optionally supported for 802.11 stations, and is most appropriate for time-bounded
services such as voice or video applications. The PC polls stations during the CFP to
transmit without contending for the channel. The PCF has higher priority than the DCF,
because it may start transmission after a PCF Interframe Space (PIFS), which is shorter
than the DIFS, but longer than the SIFS.
The duration of the CFP interval is an integral multiple of the beacon frame period. This
interval length is determined by the AP to best manage the traffic. During the CFP, all
stations in the BSS update their NAVs to the length of CFP, and may only transmit when
polled by the PC or when sending an ACK frame following reception of data frame.
In a PCF sequence during CFP, the PC polls a station for pending data. If the polled
station has a frame to send, then it may do so; if the polled station has no data to send,
the PC will wait with no response for PIFS and will poll the next station or end the CFP.
In this contention-free scheme, the channel does not stay idle for longer than PIFS. The
PC continues polling until the CFP ends, at which time a CF-End control frame is sent to
signify the last frame of the CFP.
Figure 2-6 illustrates a PCF sequence during the contention free period.
15

Bea-con
Poll +Data
ACK+
Data
Poll +Data +ACK
ACK+
Data
Poll +Data +ACK
Poll +Data
ACK+
Data
CF-End
SIF
PIF
S S
SIF
S
SIF
S
SIFS
SIFS
SIFS
AP
MS01
MS02
MS03
NAVAll MSes
CFP CP
Figure 2-6: Example for the PCF Operation
PCF is not very scalable, in that a single point has control of media access and must poll
all stations, which can be ineffective in large network. However, it offers benefits of
dedicated bandwidth during the CFP.
16

3 SIMULATION MODEL
Simulations of cRTP over IEEE 802.11 were conducted using Optimum Network
Performance (OPNET). Much of the work required to complete this project involved
developing the cRTP process model to a point where it could provide a fairly accurate
representation of a software module performing the RFC2508 algorithm. This section
provides an overview of the simulation system and components.
3.1 System Model Overview
The OPNET project includes N mobile stations, where N can range from 2 to 22 (Figure
3-1 shown an example where N = 20), each with a node model consisting of the
elements shown in Figure 3-2. These nodal components are described in the following
section.
Figure 3-1: Simulation Project Model
17

Figure 3-2: Mobile Station Node Model
3.2 Model Components
As seen in Figure 3-2, each node contains a packet generator, an RTP/UDP/IP
encapsulation module, a cRTP compressor/decompressor, a packet sink, and WLAN
MAC components.
3.2.1 Data Traffic
RTP/UDP/IP traffic is generated through two components: a packet source and an
RTP/UDP/IP encapsulator. The packet source used is the “bursty_source” process
model, as provided in the OPNET application. The RTP/UDP/IP encapsulation is done
by a simple process model created for its purpose.
RTP payload sizes can be chosen as desired, and are kept constant in this project. The
payload content is not voice traffic, but is irrelevant to the simulations – it is only the
packet size that of importance. Packet transmission distribution properties are selected
between constant bit rate (CBR) and silence suppressed. During a CBR stream, fixed
18

packet-sized packets are generated and sent at a fixed sampling interval. For SS
streams, fixed-sized packets are sent at fixed sampling intervals when the source is in
an ON state; otherwise, no packets are sent during the OFF state. The ON and OFF
states’ distributions are characterized by Brady’s Model in Table 1.
The RTP/UDP/IP encapsulator receives the generated payload from the packet source
and adds the appropriate RTP, UDP, and IP headers with realistic values. This process
model also keeps track of incrementing header fields. The header fields are fairly well-
behaved, as it is expected that a typical real-time application would run in a reasonable
fashion. Degradation to the voice channel will be introduced externally by means of
intentionally dropped packets and WLAN congestion.
3.2.2 cRTP Process Model
After packets have been encapsulated with RTP, UDP, and IP headers, the cRTP
process model compressor performs compression possible before forwarding the packet
to the WLAN interface. This process model compressed based on the methods
described in RFC2508.
When receiving packets from the WLAN interface, the decompressor decompresses
compressed packets based on RFC2508 and sends the restored packet to the packet
sink.
3.2.3 WLAN Process Model
Two WLAN process models are included in the MS node model: wlan_mac_interface
and wlan_mac. These models are included in the OPNET package. Together, they
19

accept packets from higher level applications (an RTP application in this case), and
transmit them over a wireless medium as specified in the IEEE 802.11 standard.
Numerous options can be chosen through this model, including AP functionality,
distribution system, beacon interval, CFP interval, data rate, and physical layer.
3.3 Simulation Scenarios
Various situations are tested to demonstrate the effectiveness of cRTP and SS over
IEEE 802.11. The following table presents the simulation objectives to show the
advantages of cRTP and SS over IEEE 802.11 DCF and PCF. Section 3.3.1 tabulates
the parameters selected for the simulations.
Objectives Results to Acquire
1 Bandwidth savings from cRTP cRTP/RTP Packets Sent vs. Time
2 Effect of packet loss on cRTP
bandwidth savings
cRTP/RTP Ratio vs. Packet Loss Rate
3 Effect of packet sizes on cRTP
bandwidth savings
4 Effect of SS on bandwidth savings
cRTP Packets Sent (for 5ms, 10ms, and
20ms samples, with and without SS) vs.
Time
5 Effect of cRTP and/or SS over
WLAN for different number of
mobile stations
6 Comparison of DCF and PCF on
VoIP traffic
10ms packets, over PCF or DCF, with and
without cRTP, with and without SS:
A) Average Load vs. Number of Stations
B) End-to-End Delay vs. Number of Stations
C) Packet Loss vs. Number of Stations
Table 2: Simulation Goals
20

3.3.1 Selected Parameters
For the scenarios listed in Table 2, the following simulation values were applied:
Process Model Situation Parameter Value
Packet Size 58 bytes5ms sampling
Interrarrival Time 0.005 seconds
Packet Size 98 bytes10ms sampling
Interrarrival Time 0.01 seconds
Packet Size 178 bytes20ms sampling
Interrarrival Time 0.02 seconds
ON State Time 3600 secondsNo SS
OFF State Time 0 seconds
ON State Time 1 second
Packet Source
SS
OFF State Time 1.35 seconds
AP Functionality MS01 Only
Data Rate 2 Mbps
General
Physical Layer DSSS
Beacon Interval 0.1 seconds
WLAN
PCF Enabled
CFP Interval 0.099 seconds
Table 3: Simulation Parameters
As mentioned in Section 2.3.2, a direct sequencing physical layer is applied during the
simulation. For DSSS, the interframe space values are SIFS = 10µs, DIFS = 50µs, and
PIFS = 30µs.
21

3.3.2 Assumptions
The following stream and network assumptions were made during the simulation
process.
Stream Level Assumptions:
1. Each MS manages only two unidirectional voice streams.
2. Each MS sends to one, and only one, other MS (via the AP), i.e. no multicasting.
3. UDP checksum is handled at the higher layer. More information about this is
provided in RFC2508 [12].
4. IP and UDP lengths are handled at link layer level. More information about this is
provided in RFC2508 [12].
5. Calls do not end, i.e. calls start at time ts and continue to transmit packets until
the end of the simulation.
6. Propagation delay is near negligible due to proximity of MSes.
7. RTS/CTS mechanism is not used due to relatively small sizes of voice packets.
Network Level Assumptions:
8. Each pair of MSes start transferring packets at simulation times ts = 1s for MS01
and MS02, ts = 1.1s for MS03 and MS04, ts = 1.2s for MS05 and MS06, and so
on.
9. All MSes are in the same BSS, and each MS can access the AP (MS01).
10. 802.11 WLAN models work properly and follow the specification as in [4].
11. Distribution system for all MSes in the BSS is either DCF-only or PCF-only, not a
mix.
22

4 SIMULATION RESULTS
In running the simulations described in Section 3.3, the test results fortify the intuitive
expectations of employing an additional compression scheme. In this section, simulation
results are revealed and explained.
At a basic level, excluding MAC layer complexities (i.e. without 802.11), bandwidth
savings using cRTP over a non-header compressed stream is
Bandwidth savings = 40+sizepayload
38 (4.1)
Typical PCM VoIP packets have payload sizes 58 bytes for 5ms sampling, where up to
38 percent bandwidth can be saved using cRTP. Figure 4-1 shows the total number of
packets transmitted, for both RTP and cRTP cases, for a well-behaved 5ms sampled.
For increased sampling sizes, 98-byte 10ms samples for example, the difference
between the cRTP and RTP lines will be smaller. In other words, a smaller payload size
will benefit more from header compression as the header composes a larger percentage
of each packet.
23

Figure 4-1: Cumulative Packets Sent (packets) versus Time (minutes)
Bandwidth savings is further reduced by dropped packets. Each time an RTP packet is
lost, due to collisions or other reasons, the cRTP mechanism must refresh its session
context table. Figure 4-2 illustrates the sequence of packets for a well-behaved (where
full compression can be done) RTP stream in which a packet loss occurs. When packet
loss is discovered by the decompressor, the newest received packet is discarded, as it
cannot be reconstructed without the information from the lost packet, and a
CONTEXT_STATE packet of 5 bytes size is sent to the compressor. Upon receiving the
CONTEXT_STATE packet, the compressor sends a FULL_HEADER packet on its next
transmission. For a 5ms sampled stream, this would imply that each lost packet results
in sending at least 43 additional bytes (5 bytes for the CONTEXT_STATE, 38 bytes for
additional header fields). Depending on the behaviour of the RTP stream, additional
bytes may be necessary in the packet following the FULL_HEADER to update the first
24

order differences stored in the compressor and decompressor session contexts, which
are reset when the FULL_HEADER is transmitted.
Compressor Decompressor
FULL_HEADER packet (98 bytes)
compressed packet (60, 61, or 62 bytes)
CONTEXT_STATE packet (5 bytes)
compressed packet (60 bytes)
compressed packet (60 bytes)
compressed packet (60 bytes)
compressed packet (60 bytes)
detects droppedpacket(s), anddiscard this packet
set flag to sendFULL_HEADER
refresh sessioncontext table
Figure 4-2: Packet Transmission Sequence During Packet Loss
Figure 4-3 shows the activity between a compressor and decompressor when packets
are dropped at 3 percent packet loss. The top plot shows when dropped packets are
detected at the decompressor, after which a CONTEXT_STATE is sent. The bottom plot
shows the additional bytes sent following a dropped packet.
25

Figure 4-3: Simulated Packet Drops
One could deduce that as the packet loss rate increases, the bandwidth savings will be
reduced. Figure 4-4 shows that this deduction is true, plotting the ratio of total cRTP
traffic to the total original traffic for rising packet loss. A smaller ratio suggests a larger
savings in bandwidth.
cRTP load / Original Load vs. Packet Loss Rate (%)
0.6
0.61
0.62
0.63
0.64
0.65
0.66
0.67
0.68
0.69
0 5 10 15 20Packet Loss Rate (%)
cRTP
load
/ O
rigin
al lo
ad
Figure 4-4: cRTP Size / Original Size versus Packet Loss Rate
26

The objective behind implementing silence suppression is to reduce the bandwidth
required by each end of a conversation, potentially by 60 percent. Based on the voice
pattern distributions according to Brady’s Model, SS provides a much-reduced usage of
bandwidth, as shown in Figure 4-5 (DCF) and Figure 4-7 (PCF). These figures show the
reduction of traffic rates with larger sampling intervals. Figure 4-6 and Figure 4-8 plot
similar graphs, however providing a cumulative result over the 30 minute DCF and PCF
simulation periods respectively.
Figure 4-5: Simulated cRTP Voice Traffic over DCF vs. Time
27

Figure 4-6: Cumulative Simulated cRTP Voice Traffic over DCF vs. Time
Figure 4-7: Simulated cRTP Voice Traffic over PCF vs. Time
28

Figure 4-8: Cumulative Simulated cRTP Voice Traffic over PCF vs. Time
The following four graphs show the channel reservation times and the media access
delay times for DCF and PCF networks. Due to polling, the channel reservation time in
a PCF scenario is short, seen in particular between the simulation times of 5 minute and
20 minute; however there are longer media access delays, as packets must wait for the
next set of polling. Media access delay has a directly effect on end-to-end transmission
delay.
29

Figure 4-9: Access Point Channel Reservation in DCF DS
Figure 4-10: Media Access Delay in DCF DS
30

Figure 4-11: Access Point Channel Reservation in PCF DS
Figure 4-12: Media Access Delay in DCF DS
The following series of plots compare DCF versus PCF, RTP versus cRTP, and CBR
versus SS with respect to packet loss (Figure 4-13), media access delay (Figure 4-14),
31

end-to-end delay (Figure 4-15), and network load (Figure 4-16). These simulations were
done with 10ms PCM sampling – 98 bytes payload every 10ms.
In Figure 4-13, the plot is somewhat deceiving because the DCF simulations resulted in
a massive packet loss is observed at some time, after which no packets are collected
properly, invalidating the data. For the non-header compressed RTP stream, this
happens when the number of MSes exceeds 4 when SS is disabled, and 6 when SS is
enabled. In the cRTP stream, the explosion occurs at 8 MSes and 10 MSes for SS
disabled and enabled respectively.
0
10
20
30
40
50
60
70
80
0 5 10 15 20 25Number of Mobile Stations
Pack
et L
oss
(%)
cRTP DCF SS oncRTP DCF SS offcRTP PCF SS oncRTP PCF SS offRTP DCF SS onRTP DCF SS offRTP PCF SS onRTP PCF SS off
Figure 4-13: Packet Loss versus Number of Mobile Stations
Most VoIP applications are able to compensate for a certain amount of packet loss with
a packet loss concealment (PLC) algorithm. PLC usually comes at the cost of end-to-
end delay, but has the ability to improve voice quality at reasonable levels of packet loss,
32

say, less than 10 percent. Looking only at the PCF data in the Figure 4-13, at 10
percent packet loss, there is a slight increase in the number of allowable stations from
employing cRTP; however, there is a significantly large improvement when silence
suppression is enabled. This major improvement is attributed to the diminished number
of packet transmissions attempted at any one time for a fixed number of stations,
allowing more MSes to be added.
Figure 4-14 plots the media access delay for varying number of stations. The large
packet drop described above is even more evident here, as the media access delay
skyrockets to between 200 and 300 seconds. Figure 6-1 in the Appendix shows a
complete plot of the media access delay, including the extended DCF lines. At the
250ms end-to-end delay boundary, after which the delay becomes a disturbance to the
VoIP end users, again, there is a rise in number of MSes when SS is enabled. This
result directly translates to the average end-to-end delay (Figure 4-15). The DCF lines
for end-to-end delay are shown in full in Figure 6-2 of the Appendix.
33

0
1
2
3
4
5
6
7
8
9
10
0 5 10 15 20 25
Number of Mobile Stations
Ave
rage
Med
ia A
cces
s D
elay
(sec
onds
)
cRTP DCF SS on cRTP DCF SS off cRTP PCF SS on cRTP PCF SS offRTP DCF SS on RTP DCF SS off RTP PCF SS on RTP PCF SS off
Figure 4-14: Average Media Access Delay versus Number of Mobile Stations
0
2
4
6
8
10
12
14
16
18
20
0 5 10 15 20 25
Number of Mobile Stations
Ave
rage
End
-to-E
nd D
elay
(sec
onds
)
cRTP DCF SS on cRTP DCF SS off cRTP PCF SS on cRTP PCF SS offRTP DCF SS on RTP DCF SS off RTP PCF SS on RTP PCF SS off
Figure 4-15: Average End-to-End Delay versus Number of Mobile Stations
34

The final results, shown in Figure 4-16, expose the benefits of cRTP and SS towards
bandwidth. In this figure, the DS used in the system (DCF or PCF) has little effect on the
allowable load. For all cases, as the number of mobile stations increases, a load limit is
reached, and traffic is then compensated in delay and packet loss. Header compression
and SS provide more efficient bandwidth usage, thereby enabling more stations to be
included in the DSS before high packet loss and long delays are observed.
The worst case of network load is apparent when neither cRTP nor SS are employed.
For smaller number of MSes, cRTP provides more bandwidth relief over SS; however
SS becomes a more attractive alternative as the number of MSes increases past 12.
The best option is to integrate both cRTP and SS to achieve a slower rate of increasing
WLAN network load.
0
200000
400000
600000
800000
1000000
1200000
1400000
0 5 10 15 20 25
Number of Stations
Ave
rage
Loa
d (b
its/s
econ
d)
cRTP DCF SS oncRTP DCF SS offcRTP PCF SS oncRTP PCF SS offRTP DCF SS onRTP DCF SS offRTP PCF SS onRTP PCF SS off
Figure 4-16: Average Bandwidth Load versus Number of Mobile Stations
35

5 CONCLUSION
With an increased deployment of both wireless LAN and voice-over-IP solutions, it is
essential to find ways to optimize the use of network bandwidth. This is particularly true
with VoIP systems, which can potentially absorb resources and congest networks very
quickly. Compressed RTP and silence suppression are two independent
implementations that can dramatically enhance network efficiency for real-time
applications. The advantages of silence suppression have already been recognized,
which is why is it already defined in several ITU-T vocoder algorithms. cRTP, on the
other hand, has been slow to find its way into many real-world applications. It is possible
that its slow deployment is due to a fairly open RFC specification, which makes
interoperability between cRTP-supporting applications difficult. Nevertheless, the
benefits to its employment are clear. When coupled, the collective bandwidth savings of
these algorithms can realize major improvements in end-to-end delays and packet loss,
two important considerations for quality of VoIP connections. Finally, the simulation
results also show that 802.11 point coordination function is more suitable for voice-over-
IP traffic streams, as expected.
5.1 Future Considerations
While the objective of this project is to demonstrate the performance of cRTP and SS
over an IEEE 802.11 wireless LAN, there is a fair amount of additional research that can
be done in this respect. This project lays down the basic groundwork for future
investigation in the related area. To draw complete conclusions from simulations, other
system models should be explored. These additional models may include the following:
36

- BSS/ESS with both DCF and PCF: Real world systems are seldom
PCF-exclusive since it is rare that all traffic transmitted on a network is
real-time. Future testing should involve the more probable scenario that
includes a mix of the distribution systems. Furthermore, VoIP calls are
more likely connected over a distance, in which case an ESS would be
used instead of a single BSS.
- Faster transmission rates: IEEE 802.11b specifies an increase in
transmission rates to 5.5 Mbps and 11 Mbps, because the 1 Mbps and
2 Mbps rates defined in the original 802.11 were too slow for most home
and office use.
- Additional vocoder tests: A wide variety of vocoders, both CBR and
variable bit rate (VBR), are commonly used. These vocoders can
compress the PCM payload to much smaller sizes, which will result in
more bandwidth savings.
- Call simulations: Conversations simulated within this project start at the
beginning of the simulation, but do not end. In a real system, mobile
stations used for VoIP (which may include wireless SIP phones in the
future) cycle through call connections and disconnections, as well as
voice traffic patterns during connected calls.
37

6 APPENDIX
Figure 6-1 shows the fully-collected average media access delay statistics. A zoomed-in
version is seen as Figure 4-14 on page 34.
0
10
20
30
40
50
60
70
80
0 5 10 15 20 25Number of Mobile Stations
Ave
rage
Med
ia A
cces
s D
elay
(sec
onds
)
cRTP DCF SS on
cRTP DCF SS off
cRTP PCF SS on
cRTP PCF SS off
RTP DCF SS on
RTP DCF SS off
RTP PCF SS on
RTP PCF SS off
Figure 6-1: Average Media Access Delay versus Number of Mobile Stations (Full)
38

Figure 6-2 shows the fully-collected average end-to-end delay statistics. A zoomed-in
version is seen as Figure 4-15 on page 34.
0
25
50
75
100
125
150
175
200
225
250
0 5 10 15 20 25Number of Mobile Stations
Ave
rage
End
-to-E
nd D
elay
(sec
onds
)
cRTP DCF SS on
cRTP DCF SS off
cRTP PCF SS on
cRTP PCF SS off
RTP DCF SS on
RTP DCF SS off
RTP PCF SS on
RTP PCF SS off
Figure 6-2: Average End-to-End Delay versus Number of Mobile Stations (Full)
39

REFERENCES
[1] Brian . P. Crow, Indra Widjaja, Jeong Geun Kim, and Prescott Sakai, “Investigation
of the IEEE 802.11 Medium Access Control (MAC) Sublayer Functions”,
Proceedings of IEEE INFOCOM, April 1997.
[2] C.E. May and T.J. Zebo, "A summary of speech statistics measured during the
TASI-E Rego Park-Ojus field trial", submitted for publication.
[3] Dongyan Chen, Sachin Garg, Martin Kappes, and Kishor S. Trivedi, “Supporting
VBR VoIP Traffic in IEEE 802.11 WLAN in PCF Mode”, Proceedings of
OPNETWork 2002, Washington D.C., USA, August 2002.
[4] IEEE 802.11 Working Group, “ANSI/IEEE Std. 802.11, 1999 Edition: Part 11:
Wireless LAN Medium Access Control (MAC) and Physical Layer (PHY)
Specifications”, 1999.
[5] Martin Heusse, Paul Starzetz, Fanck Rousseau, Gilles Berger-Sabbatel, and
Andrzej Duda, “Scheduling Time-sensitive Traffic on 802.11 Wireless LANs”, Quality
of Future Internet Services (QofIS) 2003, Stockholm, Sweden, pp. 162-171.
[6] Matthew Gast, “When is 54 Not Equal to 54? A Look at 802.11a, b, and g
Throughput”, O’Reilly Wireless DevCenter, August 08, 2003.
http://www.oreillynet.com/pub/a/wireless/2003/08/08/wireless_throughput.html.
Accessed: April 2, 2004.
[7] Microsoft Developer Network, “VoIP Industry Trends”, Microsoft Windows
Embedded Developer Center.
http://msdn.microsoft.com/embedded/devplat/voip/voiptrends/default.aspx.
Accessed: April 2, 2004.
[8] Paul T. Brady, "A model for generating on-off speech patterns in two-way
conversation," Bell System Technical Journal, Vol. 48, September 1969, pp. 2245 -
2272.
[9] Pulse, Inc., “What is 802.11 & 802.11B?”, 2002.
http://www.pulsewan.com/data101/802_11_b_basics.htm. Accessed: April 2, 2004.
40

[10] Sage Research, Inc., “Wireless LAN Adoption Trends 2004”, January 2004.
http://www.researchandmarkets.com/reportinfo.asp?report_id=42791.
Accessed: April 2, 2004.
[11] Stefan Mangold, Sunghyun Choi, Peter May, Ole Klein, Guido Hiertz, Lothar Stibor,
“IEEE 802.11e Wireless LAN for Quality of Service”, Proceedings of European
Wireless 2002, Florence, Italy, 2002.
[12] Stephen Casner and Van Jacobson, “Request for Comments 2508: Compressing
IP/UDP/RTP Headers for Low-Speed Serial Links”, Internet Engineering Task
Force, February 1999.
[13] Texas Instruments, “Voice and Fax over Internet Protocol (V/FoIP)”,
http://www.iec.org/online/tutorials/vfoip/topic02.html. Accessed: April 2, 2004.
[14] Zhenhua Xiao, Tejinder S. Randhawa, R.H. Stephen Hardy, “Performance Analysis
of CRTP in IEEE 802.11 Network”, February 2002.
41