Embed Size (px)
Citation preview

Cruise Feasibility
Report with
Hvide Sande as a
special case
Prepared for:
Prepared by:
June 7, 2013

Table of Contents
1. Introduction and Overview ......................................................................................... 6
2. Summary of Analysis and Recommendations ............................................................. 7
3. Worldwide Cruise Industry ........................................................................................ 12
3.1. Cruise vessel trends and new-build program ........................................................... 12
3.2. Cruise industry success factors ................................................................................ 16
3.3. European consumer demand .................................................................................. 17
3.4. Cruise line business model ...................................................................................... 18
3.5. European growth factors ......................................................................................... 20
3.6. Destination challenges: Cruise line needs ................................................................ 21
3.7. Design Vessels ......................................................................................................... 21
4. Northern European Region........................................................................................ 24
4.1. Northern Europe itinerary types ............................................................................. 26
4.2. Position of Hvide Sande in relationship to the Northern Sea region ........................ 27
4.3. Baltic Sea Region ..................................................................................................... 32
4.4. Danish Ports ............................................................................................................ 34
4.5. Economic Impacts ................................................................................................... 36
5. The port of Hvide Sande ............................................................................................ 39
5.1. Attractions - Hvide Sande and surroundings ............................................................ 40
6. Interviews and SWOT Analysis ................................................................................. 43
6.1. Summary of interview responses ............................................................................ 43
6.2. SWOT Analysis ........................................................................................................ 45
6.3. Average cruise budget for a small destination ......................................................... 46
6.4. Overall analysis of the case of Hvide Sande as a cruise destination ........................ 48
7. Regional neighboring ports ....................................................................................... 54
8. Conclusion ................................................................................................................. 56
9. Recommendations .................................................................................................... 57
10. General guidelines for ports to engage on cruise business ..................................... 60

Cruise Feasibility Report for Hvide Sande – PG. 3
Table of figures
Figure 1: Conventional cruise worldwide and regional expansion, 1995 - 2012 .......................................... 13
Figure 2: Conventional cruise vessel deliveries and on order, 1990 - 2016 ................................................. 14
Figure 3: Conventional cruise vessel deliveries and on order, 2003 - 2016 ................................................. 15
Figure 4: Conventional cruise worldwide growth projections, 2013 - 2033 ................................................ 16
Figure 5: Major worldwide cruise corporations’ passenger capacity, 2012................................................ 19
Figure 6: Major European cruise operators’ passenger capacity, 2012 ..................................................... 20
Figure 7: Average passengers per ship by year of construction, 1999 - 2012.............................................. 22
Figure 8: Projected percentage of passengers per ship, 2012 - 2040 ......................................................... 22
Figure 9: Average length overall (LOA) of ships by year of construction, 1980 - 2012 ...............................23
Figure 10: Northern Europe regional growth ...........................................................................................25
Figure 11: Number of itineraries in the region that cross Hvide Sande ..................................................... 28
Figure 12: Number of ships that sail in the Northern sea region .............................................................. 28
Figure 13: Number of ships worldwide that fit in the pier of Hvide Sande ............................................... 29
Figure 14: Number of ships worldwide that fit in the port of Hvide Sande .............................................. 30
Figure 15: Number of ships sailing in the region that fit in the port of Hvide Sande................................. 30
Figure 16: Cruise itineraries crossing Hvide Sande with ships that fit in the port ......................................32
Figure 17: The Baltic Sea Region .............................................................................................................. 33
Figure 18: Economic benefits comparison table 2011 ............................................................................... 37
Figure 19: Port of Hvide Sande ................................................................................................................ 39
Figure 20: Possible tender pier ............................................................................................................... 40
Figure 21: Number of ships worldwide that could fit in an expanded pier of 8m draft and 200m length . 50
Figure 22: Number of ships worldwide that could fit in the expanded port of Hvide Sande ................... 50
Figure 23: Number of ships sailing in the region that could fit in the expanded pier of Hvide Sande ........ 51
Figure 24: Number of ships that fit in the expanded pier of Hvide Sande and cross Hvide Sande ............. 51

Cruise Feasibility Report for Hvide Sande – PG. 4
List of tables
Table 1: Worldwide cruises market penetration, 2012 est. ....................................................................... 18
Table 2: Destination challenges and cruise line needs .............................................................................. 21
Table 3: Northern Europe itinerary types, 2013 (not including West Europe and British Islands) ............. 26
Table 4: Hvide Sande fit in regional itinerary patterns ............................................................................. 27
Table 5: Ships that can fit in the pier and are operating in the region ...................................................... 31
Table 6: Categories of ports in the Baltic Sea Region .............................................................................. 33
Table 7: Breakdown of expenditure by cruise passenger and crew in Copenhagen ................................. 37
Table 8: SWOT exercise .......................................................................................................................... 45
Table 9: Estimated yearly cruise budget for a small destination ............................................................. 47

Cruise Feasibility Report for Hvide Sande – PG. 5
List of annexes
Annex 1: References and glossary
Annex 2: Cruise vessels in order worldwide
Annex 3: Emission Control Area and Marpol waste regulations
Annex 4: Cruise Baltic Statistics 2000-2013
Annex 5: List of worldwide cruise vessels that fit in the current harbor of Hvide Sande
Annex 6: Cruise Statistics Danish Ports 2005-2013
Annex 7: List of 122 cruise vessels worldwide with maximum length of 200 meters and 7 meters draft
Annex 8: List of 30 cruise vessels in the region with maximum length of 200 meters and 7 meters draft
Annex 9: Two examples of regional cooperation which have changed the perception of cruise lines
Cruise Feasibility Report for Hvide Sande – PG. 6
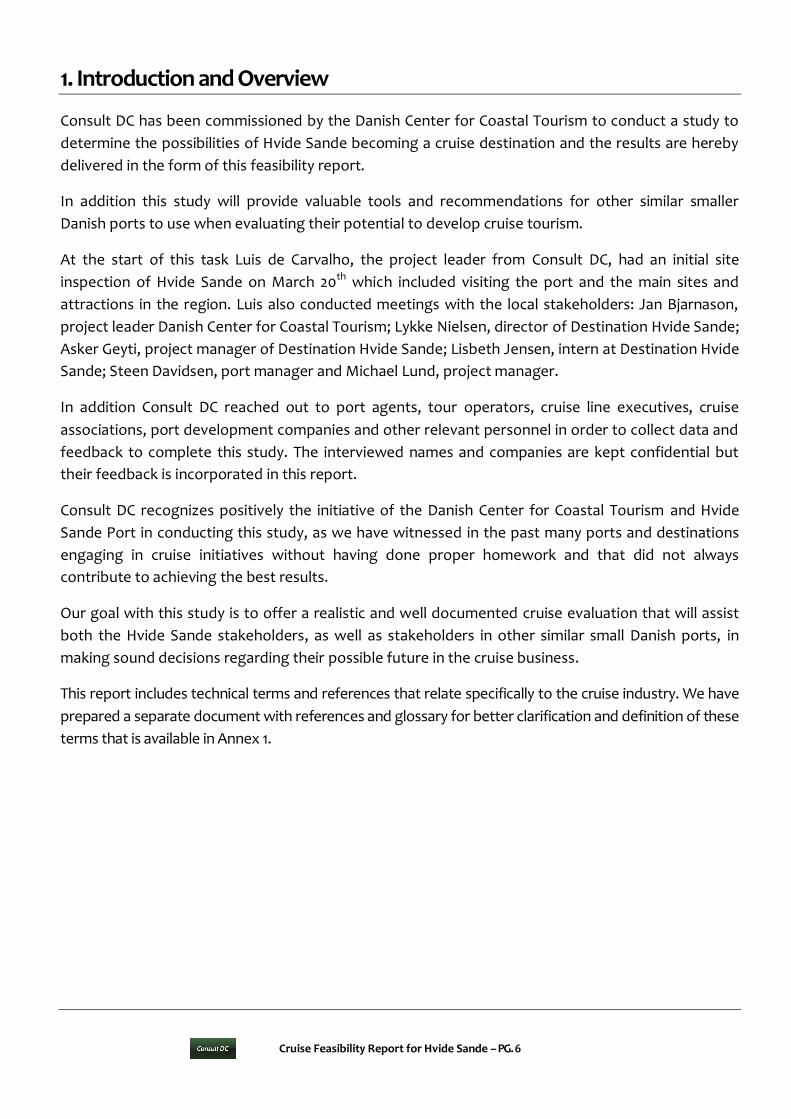
1. Introduction and Overview
Consult DC has been commissioned by the Danish Center for Coastal Tourism to conduct a study to
determine the possibilities of Hvide Sande becoming a cruise destination and the results are hereby
delivered in the form of this feasibility report.
In addition this study will provide valuable tools and recommendations for other similar smaller
Danish ports to use when evaluating their potential to develop cruise tourism.
At the start of this task Luis de Carvalho, the project leader from Consult DC, had an initial site
inspection of Hvide Sande on March 20th which included visiting the port and the main sites and
attractions in the region. Luis also conducted meetings with the local stakeholders: Jan Bjarnason,
project leader Danish Center for Coastal Tourism; Lykke Nielsen, director of Destination Hvide Sande;
Asker Geyti, project manager of Destination Hvide Sande; Lisbeth Jensen, intern at Destination Hvide
Sande; Steen Davidsen, port manager and Michael Lund, project manager.
In addition Consult DC reached out to port agents, tour operators, cruise line executives, cruise
associations, port development companies and other relevant personnel in order to collect data and
feedback to complete this study. The interviewed names and companies are kept confidential but
their feedback is incorporated in this report.
Consult DC recognizes positively the initiative of the Danish Center for Coastal Tourism and Hvide
Sande Port in conducting this study, as we have witnessed in the past many ports and destinations
engaging in cruise initiatives without having done proper homework and that did not always
contribute to achieving the best results.
Our goal with this study is to offer a realistic and well documented cruise evaluation that will assist
both the Hvide Sande stakeholders, as well as stakeholders in other similar small Danish ports, in
making sound decisions regarding their possible future in the cruise business.
This report includes technical terms and references that relate specifically to the cruise industry. We have
prepared a separate document with references and glossary for better clarification and definition of these
terms that is available in Annex 1.

Cruise Feasibility Report for Hvide Sande – PG. 7
2. Summary of Analysis and Recommendations
The port and city of Hvide Sande
Hvide Sande is a picturesque port town located on the West Coast of Denmark. Originating from
1931, Hvide Sande is Denmark’s newest town. The town has approximately 3,500 inhabitants and the
port is the 5th largest fishing port in Denmark.
The access to the port by sea is mainly done through a water channel 6 meter deep up to the
extremity of the West Harbor and from then the depth decreases to a low 3.5 meters. This limits the
number of ships that are able to enter the port to a safe draft of 4.5 to 5 meters given that the port
experiences a tide variation of approximately 70/80 cm.
The port is currently working on redeveloping the West Harbor, which will offer a berth of 150 meter
LOA, 6.5-meter draft, and a 30-meter apron area with 50-ton bollards at 21-meter distance from each
other. The port recommends that the maximum length of the cruise vessels berthing should not
exceed 140 meter LOA and 5-meter draft.
The currents oscillate between 1 to 3 meters in variation and the wind is predominantly SW to NW
with 10m/s speed. If the ship anchors at 3km distance the tender ride is estimated to last between 20
to 25 minutes (one way) depending on the ship’s tender characteristics.
As main attractions in the region within 1 hour drive we must single out: Ringkøbing old town and
museums, the unique West Coast nature landscapes around the Fjord, Lyngvig light tower, WWII
bunkers, the gourmet stops and some of Denmark’s best water sports facilities. But nature remains
the main attraction.
Analysis
It is difficult to make projections for possible cruise calls in Hvide Sande at this stage, but given all the
data analyzed and taking into consideration:
· The current port limitations,
· The reduced amount of ships that can actually fit the pier,
· The anchoring conditions and tendering time;
· The tendency for cruise lines to build larger ships,
· The lack of major attractions in the region, and
· The location of the destination not being favored and featured regularly in cruise line
itineraries,
We estimate that it will be difficult for the port to attract any cruise business at all given the current
situation.

Cruise Feasibility Report for Hvide Sande – PG. 8
Probably the most important challenge to mention is the access to the port. With the current
facilities, Hvide Sande is very limited in terms of cruise ships that it can accommodate at the pier
while the anchoring / tendering process could be deemed unsafe by the cruise lines given the rough
sea and strong winds experienced in the region.
While several options to improve the reception facilities can be considered, the port would
eventually need to invest in port development to accommodate larger vessels or guarantee safer
anchoring / tendering operations.
If the port would extend its pier to 225 meters and dredge its depth to 8 meters, we calculated that
out of the worldwide fleet of 340 vessels, the port could accommodate 122 vessels with a maximum
LOA of 200 meters and 7 meters draft. Of these 122 ships, only 30 ships are actually operating in the
region (25%), and only 15 ships are actually bypassing Hvide Sande, carrying a total of 8,655
passengers.
However, in terms of navigation, the port would still face challenges, as the turning basin is only 150
meters, meaning that most ships would have to back down from the entrance of the port to the
berth. Given the strong winds many captains could say no to this operation.
The statistics for smaller destinations (with similar characteristics as Hvide Sande) that have pursued
cruise business for the last 7 years do not show any major increases and this also means that the
contributions to the local economies have not been significant.
In summary, Hvide Sande needs to evaluate these statistics carefully before making any decisions, as
the ROI need to be properly calculated.
Conclusion
Given the current conditions, it is very unlikely for Hvide Sande to have any chances of attracting
cruise ships at this stage - the challenges outweighing the opportunities by great length.
On a workshop that took place in Hvide Sande on May 15th 2013, the local stakeholders decided not
to pursue the cruise business.
We find the local stakeholder’s decision wise, as we cannot predict any proper return on investment
or any significant economic impacts to the local economy at this stage.
Recommendations
While the study clearly concludes that Hvide Sande’s prospects of developing cruise tourism are very
slim given the current technical port conditions and limitations of the product offer, the challenges
Cruise Feasibility Report for Hvide Sande – PG. 9
by far outweighing the opportunities, we offer some general and specific recommendations in case
Hvide Sande or other similar smaller Danish ports still wants to pursue the cruise business.
This would require the engagement in more detailed assessments and studies to determine the
investment needed, especially at the port level.
Destination challenges are often cruise line needs. If any given port wants to attract or increase its
number of cruise passenger visits, its needs to provide adequate facilities in order to accommodate
the larger vessels that are being built and provide profitable tour offers.
In addition, the port and destination need to agree on a long-term cruise business strategy for the
region focusing on passenger satisfaction, cost control and revenue opportunities. The cruise
business is a long-term business and requires vision, development and investment in order to be
successful.
Hvide Sande, or other similar port destinations, should not contact a cruise line if not 100% certain to
provide all the services required for that specific cruise line and be able to meet or exceed their
expectations.
If Hvide Sande wishes to pursue cruise tourism, it could be wise to approach Esbjerg, Rømø and
maybe some of the smaller German islands in the region, or even Hirtshals to discuss a possible
collaboration and agree on a strategy to attract cruise lines to the region.
Other coastal destinations in North Europe have successfully engaged in joint promotional and
marketing initiatives including “Cruise Atlantic Alliance” and “Cruise Atlantic Europe”. But again, this
will need the development of a well-structured cruise business strategy.
General guidelines for ports to engage in cruise business
While each region and destination is different and unique in respect of landscapes, cultural
characteristics, attractions and port facilities, the following factors that determine why cruise lines
visit a destination remain the same:
1. Consumer demand – passengers tell the cruise lines and travel agents which regions and
destinations they want to visit, and cruise lines plan their itineraries accordingly;
2. Revenue opportunities – cruise lines analyse the choice of shore side programs and tour
options to be offered to their guests and how much revenue it can produce on each specific
destination;
3. ROI – Return on investments – Cruise lines look at the costs of operating a vessel when visiting
a destination / region and compare it to the revenue that they are able to create. At the end

Cruise Feasibility Report for Hvide Sande – PG. 10
of the day, a cruise line wants to make sure that they actually make a profit when visiting a
destination;
4. Visitor satisfaction levels – if cruise passengers are happy, they will rate the destination high
and the cruise lines will most likely visit again. If the ratings are low, they will probably not
return;
5. Safety and security – Operations (either at berth or anchor) need to be conducted safely, the
port needs to be ISPS certified, there need to be a safety plan for the port area, and the city
and port need to provide a safe environment for the cruise passengers;
6. Fit in greater itinerary – a destination does not exist on its own in the itinerary. Cruise lines
look for destinations that complement each other in an itinerary and that are able to sell well
to the consumer.
Based on the above and on our discussions with cruise line executives, we have prepared a list of key
items that need to be in place for a destination to pursue cruise:
Adequate port infrastructures to receive cruise ships given the current and future
construction trends;
Ample variety of tour programs for different cruise lines to chose from;
It is an advantage for the destination to have a famous attraction that is already recognized
internationally. This could apply to the city and its brand name;
Venues and attractions located in proximity of the port and not further than 1 hour drive;
A good number of professional guides in several languages (depending on the markets to
attract);
Good quantity and quality of transportation offers, ranging from big buses to mini buses and
vans, private vehicles and taxis;
Preferably your destination should be located in a region neighboring other cruise
destinations or with easy navigation access to assure better positioning on possible cruise
itineraries;
Options in the city and the region for independent guests that can include shopping, food &
beverages, museums, historical sites, shows and festivals and other options;

Cruise Feasibility Report for Hvide Sande – PG. 11
Good cooperation between the port, local politicians, tourism organizations, chambers of
commerce and local stakeholders; and
The acceptance of cruise tourism by the city inhabitants.
If a pre-feasibility study like the present study for Hvide Sande as a case proves that there is scope
for cruise tourism, one of the most important steps that an aspiring cruise destination should do first
is to conduct a more specific market study to determine its real chances of becoming a cruise
destination. This is also the basis for a cruise business strategy agreed by all the local stakeholders
that needs to be in place for any destination to have better chances to be successful.
Cruise Feasibility Report for Hvide Sande – PG. 12
3. Worldwide Cruise Industry
3.1. Cruise vessel trends and new-build program
Cruise operators have been highly successful in introducing new vessel inventory and developing on-
board products that generate sustained interest in cruising. Cruise brands continuously work to
improve the quality and quantity of on-board experiences with more diverse food and beverage
venues, entertainment and deck activities, meeting and conference facilities and recreation areas.
Among the largest of their efforts is the creation of larger and more lavish vessels furnished with
veranda-style outside cabins, grand central atriums, health spas and other amenities found in the
best land-based resorts. This trend became the norm in the mid-1990s and has continued as cruise
brands introduce innovative products and services on the newest vessels to further differentiate
themselves from the competition and generate renewed public interest in cruising. Consumers
generally meet each new vessel launch with enthusiasm, and ultimately, increased passenger
bookings.
To forecast future regional facility requirements and passenger throughput to individual ports, it is
important to take the anticipated trends in ship construction and deployment into account.
Since November 2009, Royal Caribbean International delivered the first new-build of the next
generation of cruise vessel – the Oasis of the Seas, followed by the Allure of the Seas in fall
2010, both with passenger loads exceeding 5,400. Norwegian Cruise Line delivered the
150,000-GT, 325-meter LOA Norwegian Epic, capable of accommodating more than 4,200
passengers and crew in the summer of 2010. Additional vessels are now on order for both
brands with capacities exceeding 4,000 passengers and more than 150,000 GT (RCI Quantum
of the Seas).
As of April 2013, there are 21 new cruise vessels on order with a total berth capacity of 61,139
are scheduled for delivery over the next four years (2013 through 2016). For comparison
purposes, in spring 2006, the forward cruise vessel order book contained 29 vessels with a berth
capacity of approximately 85,000.
For any cruise port to be truly competitive in the cruise marketplace and be able to fully
accommodate the future generation of cruise vessels, it will need to improve the current and future
berth, terminal facilities and upland support areas in order to accommodate these larger cruise
vessels. The review of future vessel deliveries, as shown in Annex 2, remains the primary tool used to
project future industry passenger growth.
Responding to cruise passenger demand, cruise operators continue to order new vessels, although
at a more restrained pace than observed at the peak of vessel orders in the late 1990s through the
mid-2000s. The last of the larger 120,000-GT + vessels for delivery into the worldwide cruise fleet is

Cruise Feasibility Report for Hvide Sande – PG. 13
far from over. More than 70% of the vessels delivered or on order since 2009 exceed the 120,000-GT
mark, with this number increasing annually.
Additionally, the Length Overall of the new build vessels is also increasing as shown in Annex, 2 and later
in this report. Even if smaller ports do not intend to capture bigger vessels, they should still be aware of
the industry trends to build larger vessels.
Figure 1 illustrates the growth of the cruise line industry from 1995 through 2012. As shown, the North
American market continues to be the main consumer generating market. However, there has been
significant growth in the European market over the past ten years. Asia has maintained a relatively flat
growth over this period, but has an inexhaustible growth potential due the large population base with
fast-growing income streams and the desire to travel abroad and within the vast Asian region.
Figure 1: Conventional cruise worldwide and regional expansion, 1995 - 2012
Source: CLIA
Europe and North America have very similar
population overlays and demographics which
allow for an easy growth comparison.
Additionally, dedicated cruise lines such as
Pullmantur (RCCL Spanish brand), AIDA
(Carnival Corp. German brand), TUI Cruises
(RCCL German brand), Thomson Cruises (UK
brand), Crosiers de France (RCCL French
brand) and many other smaller lines
specifically target national markets to further
drive growth in the larger regional market.
0
5.000
10.000
15.000
20.000
25.000
'95 '96 '97 '98 '99 '00 '01 '02 '03 '04 '05 '06 '07 '08 '09 '10 '11 '12
Pas
sen
ge
rs (
'00
0)
Asia Europe North America

Cruise Feasibility Report for Hvide Sande – PG. 14
As shown, in 2012 the Caribbean region was the number one cruise destination by way of passenger bed-
days (a formula based upon lower cabin berths x cruise length x sailings) with the Mediterranean ranking
second and Northern Europe third overall. The Alaska and Mexico West regions round out the top 5
destinations. However, Mexico West has lost significant capacity in the past two years and will drop lower
according to the outcome of a 2013 statistical analysis. Furthermore, there are signs that the
Mediterranean region, from a North American industry perspective, is saturated.
This will likely motivate brands to further expand their deployments to the Black Sea region and northern
climates during the peak summer seasonal months if the costs associated with ECA’s and Marpol waste
regulations can work in their revenue model.
Figure 2 below shows the deliveries of new-build cruise vessels from 1990 through 2016. This supply
propels the industry forward. As noted, there are established trends within the delivery pattern that
coincide with the industry utilizing deliveries as a tool to adjust demand and pricing. They are also
affected by exchange rates and slot availability in the limited number of yards that build these high quality
vessels.
The potential development of shipyards with the technical capabilities to build and deliver cruise vessels in
China and Asia would provide for added capacities in a relatively short timeframe once the industry
accepts the standards of the vessels.
Figure 2: Conventional cruise vessel deliveries and on order, 1990 - 2016
Source: Cruise Community
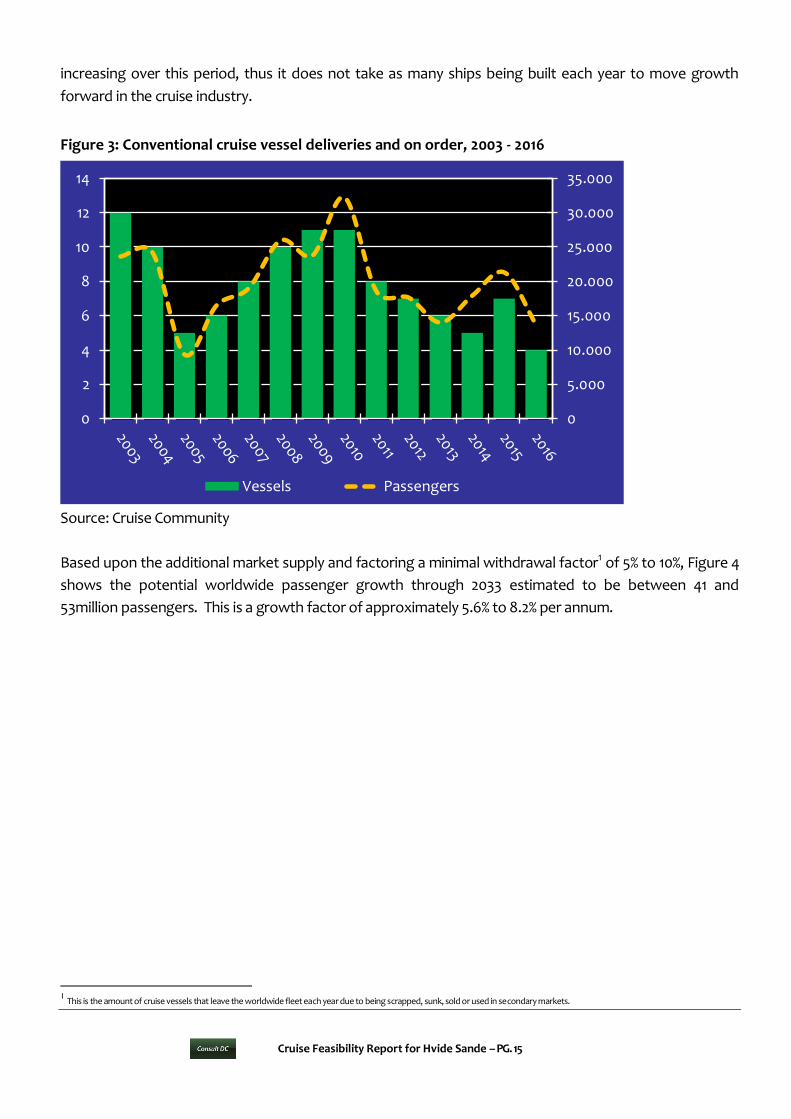
Figure 3 further defines the link between the number of new cruise vessel deliveries and the vessel
passenger loads that have increased over the past 9 and next 4 years. The capacities of vessels are
0
2
4
6
8
10
12
14
16
Cruise Feasibility Report for Hvide Sande – PG. 15
increasing over this period, thus it does not take as many ships being built each year to move growth
forward in the cruise industry.
Figure 3: Conventional cruise vessel deliveries and on order, 2003 - 2016
Source: Cruise Community
Based upon the additional market supply and factoring a minimal withdrawal factor1 of 5% to 10%, Figure 4
shows the potential worldwide passenger growth through 2033 estimated to be between 41 and
53million passengers. This is a growth factor of approximately 5.6% to 8.2% per annum.
1 This is the amount of cruise vessels that leave the worldwide fleet each year due to being scrapped, sunk, sold or used in secondary markets.
0
5.000
10.000
15.000
20.000
25.000
30.000
35.000
0
2
4
6
8
10
12
14
Vessels Passengers

Cruise Feasibility Report for Hvide Sande – PG. 16
Figure 4: Conventional cruise worldwide growth projections, 2013 - 2033
Source: Bermello, Ajamil and partners (B&A)
3.2. Cruise industry success factors
The industry is constrained by ships (supply), not passengers (demand). The delivery of new large
capacity vessels with an extended life cycle provides for a compelling growth strategy;
There is a high level of repeat clientele demand due to satisfaction and the demand for new and
different passenger experiences;
The industry is rapidly expanding in several cruise regions worldwide due to passenger demand
and the quest for increased revenue opportunities and lower costs;
Major deployment factors include:
o Passenger demand – cruise lines use survey tools, travel agents and passenger feedback as
key indicators for future deployment; and,
o Yields – cruise lines place vessels into itinerary patterns with high demand and lower
operating costs to maximize passenger spending per day.
There are opportunities for ports worldwide to become part of the cruise business. However,
there is a cost in the development of infrastructure and support of tourism businesses that must
be addressed. Return on investment parameters and the ability of ports and cities to provide
41.598.989
47.707.730
20.140.922
53.156.627
10.000.000
15.000.000
20.000.000
25.000.000
30.000.000
35.000.000
40.000.000
45.000.000
50.000.000
55.000.000
60.000.000
Low Medium High
Cruise Feasibility Report for Hvide Sande – PG. 17
platforms for a variety of social and economic impacts on the community must be addressed as
part of any development opportunity;
Some cruise brands and consumers see a saturation of traditional ports and regions, which allows
for new port opportunities on a worldwide basis. This is further exacerbated by the
implementation of costly regulatory and operational costs in some regions;
The industry is controlled by a handful of US based profitable cruise operators that has become a
global industry with key players in Europe and Asia;
Currency exchange rates play a major role in shipbuilding and deployment patterns that define the
timing and deployment patterns of cruise brands;
Weather patterns, consumer demand and cruise line operations have influenced deployments in
many regions extending or moving seasonality into non-traditional time slots. This includes new
cruise sailings that now include Christmas and holiday sailings in traditionally summer cruise
regions, such as the Baltic, as well as year round cruises from New York that depart in the winter
for the Bahamas and Caribbean; and,
The industry has proved itself to generally be recession resistant by controlling and reducing costs.
Furthermore, it has shown flexibility when it comes to shifting capacity between longer and
shorter cruises, but also innovative thinking, with the development of vessels with more outside
cabins, on-board amenities, the re-fitting of vessels for all year around cruising in specific regions
and allowing for discounting on cabin fares to pick up the potential for on-board revenue spending
in order to stay profitable.
3.3. European consumer demand
The European cruise interest is rapidly increasing with the German, English and Italian markets booming
over the past two years, while the Spanish passenger market yields are down (primarily due to a more
than 20% unemployment rate). The European market has seen passenger growth of more than 25% over
the past five years. There is a very similar population and income level demographic as that of North
America that can be used for comparative purposes. Tailored cruise products to meet consumer needs
including homeport options, vessels, on-board services and new cruise line products are propelling the
European markets forward. In addition, small lines are also moving in and out of the marketplace.
Table 1 illustrates the cruise line penetration of the major markets based upon a recent study by the
European Cruise Council. As shown, while the cruise brands have fared well in the primary European
consumer markets, there are still significant gains that can be made. By comparison, passenger market
penetration is still just 1.55%, which is 41% of the penetration of today’s North American market. Both are
anticipated to grow in the coming years as cruising becomes a more familiar and popular vacation activity.

Cruise Feasibility Report for Hvide Sande – PG. 18
Table 1: Worldwide cruises market penetration, 2012 est.
Source: Clia Europe
3.4. Cruise line business model
There are four major cruise corporations that control the majority of the worldwide cruise capacity. See
Figure 5 below:
Carnival Corporation is the largest with more than 10 cruise brands ranging from luxury (Cunard
and Seabourn) to mass market (Carnival Cruise Lines) with a fleet of over 100 cruise vessels sailing
worldwide
RCCL is half the size of Carnival Corporation in terms of passenger capacity and a fleet of 42 cruise
vessels, followed by the fleets of:
MSC Cruises and
NCL (Apollo Management)

Cruise Feasibility Report for Hvide Sande – PG. 19
Figure 5: Major worldwide cruise corporations’ passenger capacity, 2012
Source: Cruise Community
Key European cruise corporations, Distribution of Fleet 2012
Although there are significant numbers of cruise vessels in Europe serving numerous consumer groups,
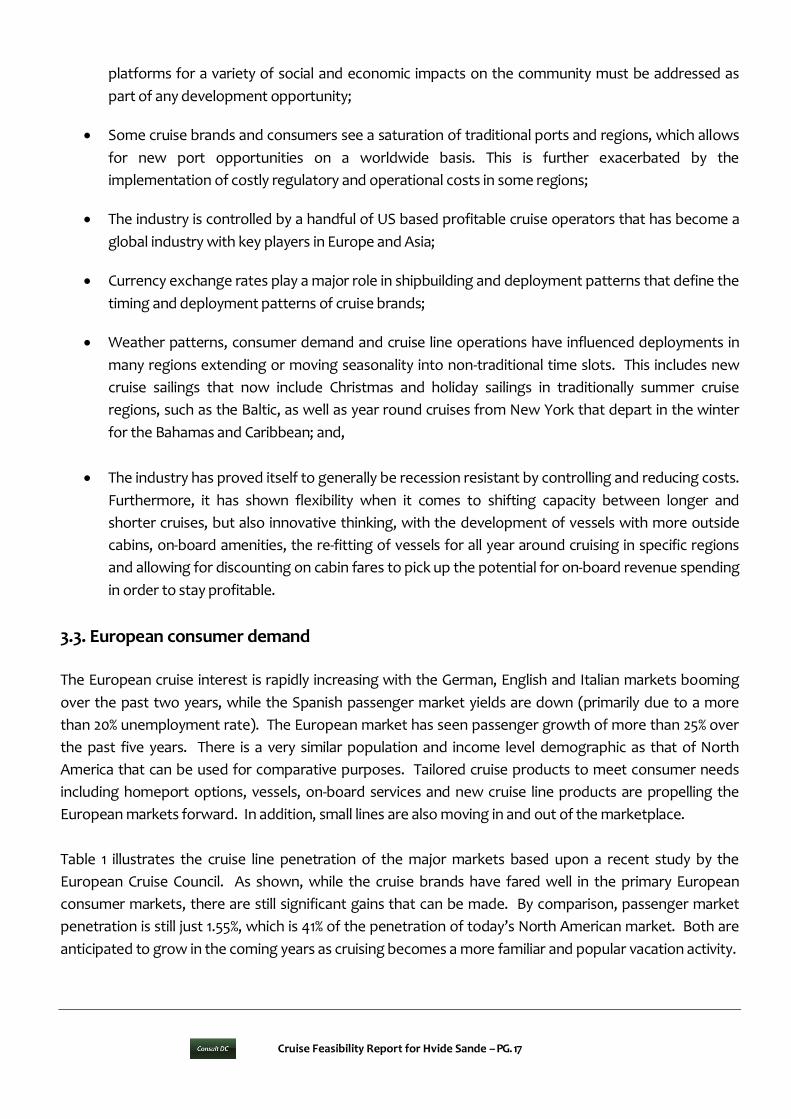
there are five key brand operators with some 65 ships and a bed capacity of 120,316 that accounts for
74.9% of the European market bed capacity. These five brands (further broken down into 7 major cruise
lines) are shown in Figure 6. The operators are as follows:
Carnival Corporation (headquartered in North America) with 6 European brands serving consumer
markets in Spain, U.K., Germany, France and Italy. They include the following brands with a total of
37 ships:
o Costa;
o AIDA;
o P&O Cruises;
o Cunard Line;
o Iberocruceros; and,
o Ocean Village.
RCCL (headquartered in North America) with three brands dedicated to the European
marketplace (specifically the Spanish, German and French markets). RCCL utilizes its Royal
Caribbean International brand to tap into the lucrative U.K. and Italian markets, amongst others.
Their European brands with 8 ships are as follows:
o Pullmantur;
o TUI; and,
RCCL; 24%
NCL; 7%
MSC; 8%
Carnival Corp; 47%
Others; 14%
Cruise Feasibility Report for Hvide Sande – PG. 20
o CDF.
MSC is a singular brand with many newer cruise vessels (12 in total and 1 under construction);
Thomson is primarily a UK cruise provider tapping into a regional market (4 vessels); and,
Louis Cruises is primarily a Greek Isles and Mediterranean deployed operator with a variety of older
vessels (7 ships).
Figure 6: Major European cruise operators’ passenger capacity, 2012
Source: Cruise Community
3.5. European growth factors
Based upon cruise line input there are some key growth factors that must be considered and resolved to
allow for more growth in the region over the mid- to long-term. They include:
Cruise infrastructure capable of supporting larger cruise vessels and passenger loads throughout
the region. The Northern European region requires more port options to reach key demographic
areas and provide a cruise product within a short fly or drive area;
Environmental zoning and fuel issues that impact speed & distance in itinerary planning exercises
which may limit the number of ports offered or impact the amount of time spent in each port will
be an on-going challenge that ports must consider and work to accommodate cruise lines in this
regard. Secondly, with the ever increasing pressure on the industry to continue its efforts to
reduce emissions, the environmental control zone of the Mediterranean and Baltic regions will
Costa; 24,6%
MSC; 19,6%
AIDA; 10,1%
P&O; 7,0%
Pullmantur; 5,6%
Thomson; 5,2%
Louis; 2,8%

Cruise Feasibility Report for Hvide Sande – PG. 21
affect the ability of the cruise brands to deliver key products due to high fuel costs and supply of
low sulphur fuels in these regions; and,
Continuous development of distribution channels throughout Europe and emerging former Soviet
bloc countries will provide an expanding consumer market eager to cruise in the adjacent areas.
3.6. Destination challenges: Cruise line needs
Table 2 outlines a number of cruise line needs that in many cases become challenges for destinations on a
regional or port basis. These are separated into four distinct areas. Each one is important, but it is
necessary to address each of these key components in order to meet the needs and expectations of the
cruise industry over the long-term. Marketing and Sales is the key deployment driver based upon
consumer awareness and demand. Marine operations also play a key role in ensuring the itinerary pattern
routing and ports provide a safe and secure environment for the cruise vessel and passengers. All of
these areas work together on the formulation of final itineraries.
Table 2: Destination challenges and cruise line needs
It is important for any cruise port to assess all of the cruise line issues above and determine how they can
best work with the operators to meet their individual needs.
3.7. Design Vessels
Based on cruise line interviews and an understanding of the cruise line market, the next generation
vessels (more than 320 to 350 metres) will initially be deployed to the primary cruise regions of the
Mediterranean and Caribbean regions. However, it is likely that these vessels will be deployed to

Cruise Feasibility Report for Hvide Sande – PG. 22
new destinations worldwide over time inclusive of Northern Europe. See Figure 7 for data on the
continued growth of the passenger capacity per vessel. New build vessels are increasing in size and
the trend is continuing.
Figure 7: Average passengers per ship by year of construction, 1999 - 2012
Source: Cruise Community
Figure 8 illustrates the projected number of passengers per ship in the fleet through 2040.
Figure 8: Projected percentage of passengers per ship, 2012 - 2040
Source: B&A
1427
1782
1464
1833 2098
2077 2200
2703 2714 2845
3456 3379 3298
2713
1.000
1.500
2.000
2.500
3.000
3.500
4.000
0%
20%
40%
60%
80%
2012 2015 2020 2025 2030 2035 2040
>2500 passengers >3000 passengers >4000 passengers

Cruise Feasibility Report for Hvide Sande – PG. 23
The choice of design vessel(s) provide the criteria for berth requirements, apron, fenders & mooring
structures, gangways in terms of quantity and capacity, terminal space allocation, size of the ground
transportation area – for coach, taxi, private vehicle and mini-bus quantities and parking space needs.
Future vessel sizes are driven by the need to optimize capacity providing for more space to increase
revenue options and spread the cost structure over a greater area in terms of passenger load. Thus, this
larger vessel format provides for more passenger amenities and better sales yields through the use of
outside cabins on the larger perimeter hulls with more balconies. There are also grander atriums for
better space allocation allowing for better flow and logistics related to the distribution of passengers,
boarding and disembarking. The economics of the vessels are also better in terms of crew to passenger
ratios and power / fuel consumption.
Figure 9: Average length overall (LOA) of ships by year of construction, 1980 - 2012
Source: Cruise Community
The lengths and beams of cruise vessels are also increasing over time to accommodate the increased
passenger capacity, cabin configuration and on-board revenue source accommodations.2 Figure 9 above
shows the length of vessels in metres by year of construction hovering at more than 300-metres.
2 On-board Revenue Source Accommodations are spaces built into the vessels whereby revenues can be generated inclusive of bars, casino, retail outlets, spa facilities, specialty restaurants,
etc. Larger vessels have more spaces for these types of revenue producing amenities.
0
50
100
150
200
250
300
350
Ave
rag
e L
en
gth
(m
etr
es)

Cruise Feasibility Report for Hvide Sande – PG. 24
4. Northern European Region
The Northern European cruise region is comprised of a
variety of cruise itinerary patterns taking advantage of a
wide variety of natural areas, marquee ports and smaller
destinations throughout the region. There is a wide
variety of cultural, historical and varied natural
resources within the regional zone that provide for a
variety of cruise pattern options as shown. Cruise
consumers from a diverse array of countries are lured by
the offerings with the Scandinavia & Russia destinations
as the core itinerary offering.
Cruise offerings include complete variety of cruise line brands and demographics from North American to
European brands and from budget to all inclusive brands. The region competes with the Mediterranean
region for core summer traffic. The primary feeder homeports for the Northern European itineraries are
typically inclusive of Harwich, Southampton, Copenhagen and Hamburg as the primary ports. However,
dependent upon the brand, such as AIDA or TUI, they may also sail from homeports such as Lubeck /
Travemunde, Kiel, Rostock / Warnemunde and Amsterdam. The selection of the homeport is often
dependent upon the cruise brands, primary passenger demographic and itinerary pattern offered. These
homeports in proximity to key itinerary regions and ports of call allow for multiple itinerary offerings
throughout the region.
Combined, Northern Europe is the 3rd largest cruise deployment region worldwide, behind the Caribbean
and Mediterranean. Northern Europe is a traditionally summer seasonal market that is slowly moving
toward more year round cruise options as consumer appeal for a broader array of itineraries evolves.
These are typically 7 to 14-day cruise patterns that combine excellent ports with historical, cultural and
natural influences. However, there appears to be a push toward shorter holiday sailings by European lines
into the region off-season. This will play out more fully over the next two years as the Emission Control
Area (ECA) and the International Convention for the Prevention of Pollution from Ships (Marpol) waste
regulations come into effect and cost implications are realized.
Figure 10 provides an overview of the historical and potential growth opportunities envisioned for the
region based upon anticipated deployment patterns. The key deployments shown are those in the
Northern / Western areas (such as Baltic, Coastal and Norwegian Fjords sailings) that provide the vast
majority of passenger capacity for the region and Transatlantic and World cruise patterns that effectively
provide a transitional baseline for the region. These sectors combined may provide the region with an
effective growth from 1.5-million to more than 4-million passengers by 2033. This projection of 7.7% annual
growth over the 20-year period is robust, but due to the cruise opportunities and continued growth of the
regional European cruise market passenger this appears to be a strong option.

Cruise Feasibility Report for Hvide Sande – PG. 25
Figure 10: Northern Europe regional growth
Source: B&A
Macro Challenges for the region
While the cruise industry is expanding and deploying more vessels to the region and increasing demand
for berths, tourism venues and support infrastructure, the overall European land-based tourism market is
also continuing to grow at a rate of 3.1% annually. Based upon a World Tourism Organization (WTO) study,
as many as 717 million people will visit Europe by 2020. Thus, for future tourism development
considerations, destinations must assess the impacts of the overall visitor arrival totals and experience in
the decision-making process.
Destination name brand recognition continues to drive consumer demand. However, new high value
destinations can also sell cruises to a savvy consumer market. There are also fewer opportunities at key
homeports to increase capacity limits based on port configurations, location and waterfront uses. Thus,
for ports and cities with the ability to meet the needs and expectations of cruise lines for homeport and
port-of-call infrastructure within key regional markets that is the potential for further operations
development.
Finally, the ECAs and Marpol waste provisions will have an impact on deployment throughout the
European and North American cruise spheres. Coming 2015, all vessels sailing in the North Europe and
Baltic Emission Control Areas will need to use fuel with 0,1% sulphur content, which is more expensive than
the average fuel used at present. In addition, and under the revised Annex IV of the MARPOL Convention
the Baltic Sea, I also designated a Special Area with respect to pollution by sewage, whereby any
discharge of sewage into the sea from a passenger ship will be prohibited unless the ship uses an
approved sewage treatment plant capable to reduce nutrients according to the established
1.582.291
4.031.968
0250.000500.000750.000
1.000.0001.250.0001.500.0001.750.000
2.000.0002.250.0002.500.0002.750.0003.000.0003.250.0003.500.0003.750.0004.000.0004.250.000
Historical Anticpated Growth

Cruise Feasibility Report for Hvide Sande – PG. 26
concentrations. Alternatively, untreated sewage could be delivered to a port reception facility (PRF).
Please find more details on these regulations in Annex 3.
Cruise lines are currently assessing deployments to ensure that by 2015 and beyond their ships are
positioned in regions that have the best opportunity to provide maximum revenue potential through
consumer demand and the lowest overall expenses based upon fuel cost and availability amongst a
variety of other considerations.
4.1. Northern Europe itinerary types
Table 3: Northern Europe itinerary types, 2013 (not including West Europe and British Islands)
Source: Consult DC
As shown in Table 3 there are some 589 sailings in the region. A snapshot of the 2013 deployments for the
Northern European region that specifically impact Hvide Sande and the surrounding ports are as follows:
Total passengers 934,316
Number of sailings 589
Passengers per ship 1,594
Length of Season (days) 276
Number of Weeks 39
Number of Cruise Lines 40
Number of ships 82
Avg. LOA 234.3 m.

Cruise Feasibility Report for Hvide Sande – PG. 27
Table 4: Hvide Sande fit in regional itinerary patterns
Hvide Sande’s geographical location favors the port for coastal cruises that explore the Northern Europe
coast for its primary destinations. Historically, these types of cruises are either re/positioning cruises
where ships move between their high yield sailing regions such as the Mediterranean, Baltic and British
isles, or explore options that include destinations in the vicinity of the new and upcoming Northern
Europe turnaround ports such as Hamburg, Bremerhaven, Ijmuiden, Amsterdam, Le Havre and Bilbao.
Interporting is also becoming popular in the region using the proximity to the rising EU markets to attract
and embark new passengers in several ports during a given cruise.
But as per Table 3, the percentage of these cruises is quite small (3,8% on ships) compared to the
percentages of other sailings and itineraries being the Baltic and Norwegian fjords the most popular,
meaning that destinations that are positioned in these regions will have more possibilities to take
advantage of this situation.
4.2. Position of Hvide Sande in relationship to the Northern Sea region
Out of the 589 cruise itineraries scheduled to take place in the region in 2013 (excluding West Europe and
most of the British Islands itineraries), 262 itineraries (44%) are crossing Hvide Sande either originating in
the UK, Germany and Holland and sailing to Norway or the Baltic via Skagen. The remaining 55% of all the
itineraries are either taking place in other areas in the region such as the Baltic and Norway or include
ships that are actually accessing the Baltic via the Kiel Canal. While 1% of them are not disclosed as they are
chartered. See Figure 11 below.

Cruise Feasibility Report for Hvide Sande – PG. 28
Figure 11: Number of itineraries in the region that cross Hvide Sande
Source: Consult DC
Per Figure 12, the current cruise line fleet is comprised of a total of 340 active cruise ships of different
sizes and characteristics sailing worldwide being able to carry a total capacity of 485,000 passengers
and 188,000 crew members. Of those 340 vessels, 82 vessels are currently sailing in the Northern Sea
region (excluding West Northern Europe and British Isles cruises) being able of carrying a total of
101,000 passengers and 60,000 crewmembers. One element to point out is that the average LOA of
the 82 ships is 234,3 meters which exceeds the limitation of the Hvide Sande port (ref. section 5).
Figure 12: Number of ships that sail in the Northern sea region
Source: Consult DC
589CruiseI nerariesintheNorthernSearegion
26244%
32355%
41%
CrossingHvideSande-262i neraries
NotcrossingHvideSande:323i neraries
Notavailable:4i neraries
I nerariesintotal:589

Cruise Feasibility Report for Hvide Sande – PG. 29
Out of the 340 vessels sailing worldwide, only 48 vessels (14,1 %) are limited to a LOA of 140 meters
and a draft of 5m, being able to fit safely in the West Harbor of Hvide Sande. 292 ships, or 85,9% of
the total cruise fleet do not fit the pier. See Figure 13 below. You will find a complete list of the 48
vessels that currently fit in Hvide Sande port in Annex 5.
Figure 13: Number of ships worldwide that fit in the pier of Hvide Sande
Source: Consult DC
The combined average age of these 48 ships is 27 years. The average age of a cruise ship is 25 years.
This means that in a few years most of these ships will not be around being either sold for scrap or
moved to regions with less strenuous maritime and environment regulations. Most the above vessels
are already operating in remote regions such as Africa, Asia and South America while others sail in
the Caribbean or other exotic destinations as expedition ships.
Also some of these older ships are equipped with older engines that tend to burn more fuel than
newer ships. With the ECA’s coming in place in 2015 requiring ships to use the more expensive 0.1%
fuel sulphur fuel, many of the older ships will be moved to other regions.
The tendency is to build bigger ships, as these are more profitable as operating costs can be easily
mitigated and more revenue created if the cruise line can sell more berths on any given ship.
But these ships will also require ports and destinations that can accommodate their vessels
alongside and that can offer great shore side revenue opportunities.
Cruise Feasibility Report for Hvide Sande – PG. 30
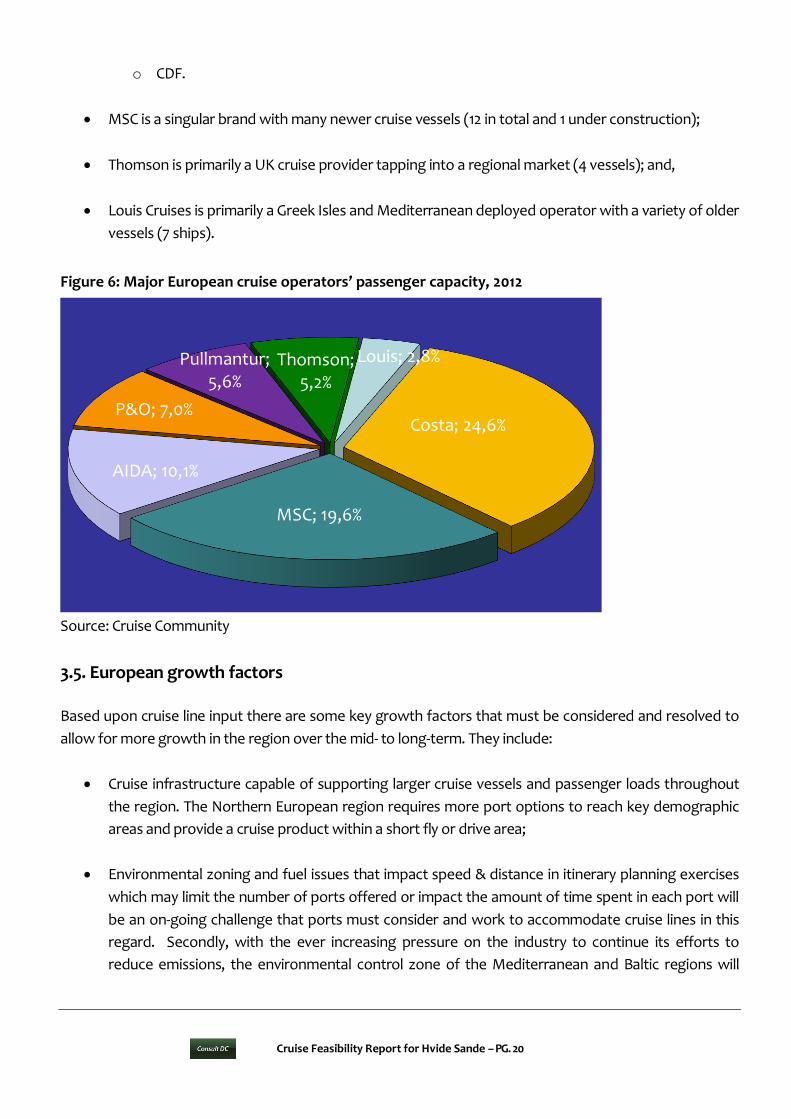
Unfortunately, out of those 48 ships, there are only 4 ships currently operating in the Northern Sea
region that could berth safely at Hvide Sande, which accounts for only 8% out of the 48 ships. See
Figure 14 below.
Figure 14: Number of ships worldwide that fit in the port of Hvide Sande
Source: Consult DC
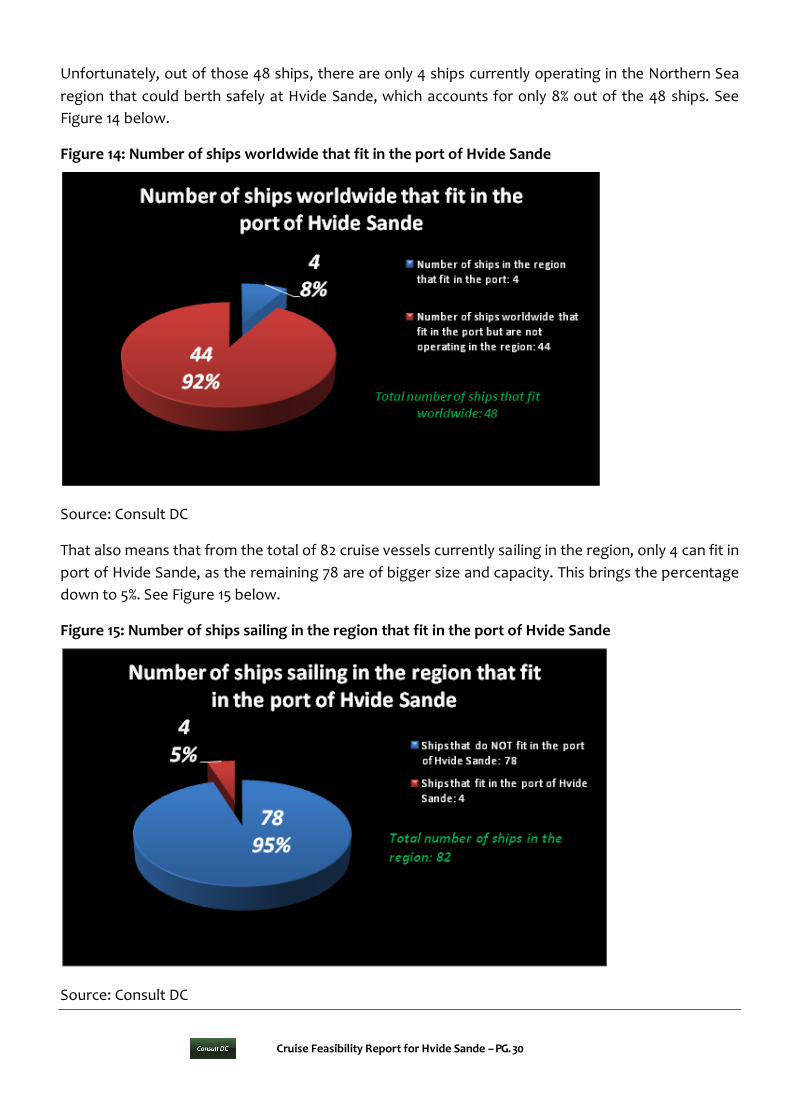
That also means that from the total of 82 cruise vessels currently sailing in the region, only 4 can fit in
port of Hvide Sande, as the remaining 78 are of bigger size and capacity. This brings the percentage
down to 5%. See Figure 15 below.
Figure 15: Number of ships sailing in the region that fit in the port of Hvide Sande
Source: Consult DC

Cruise Feasibility Report for Hvide Sande – PG. 31
The names of the 4 ships are: Hanseatic, Island Sky, National Geographic Explorer and the Seabourn
Pride and they have a total of 12 itineraries in the region with a total of 2116 passengers on board
their ships. Compared to the total of 934,000 passengers sailing in the region that represents 0,3% of
possible capture rate.
But there is also another factor to take into consideration: most of the smaller ships that sail into the
Baltic use the Kiel canal in order to save sailing time and fuel instead of sailing around the tip of
Jylland.
This means that out of these 4 ships, there is actually only one that crosses Hvide Sande at this stage:
the Hanseatic which belongs to Hapag Lloyd, a cruise operator based in Hamburg, Germany, while
the other vessels use the Kiel Canal. The Hanseatic has 1 cruise itinerary in the region carrying 184
passengers.
Table 5: Ships that can fit in the pier and are operating in the region
Source: Consult DC
So in summary: from a total of 262 cruise itineraries that are crossing Hvide Sande in 2013, only 1
itinerary out of the possible 262 is conducted by a cruise ship that could potentially fit in the port of
Hvide Sande given its current characteristics – the Hanseatic. The percentage for a possible capture
of vessels is 0,4%. See Figure 16

Cruise Feasibility Report for Hvide Sande – PG. 32
Figure 16: Cruise itineraries crossing Hvide Sande with ships that fit in the port
Source: Consult DC
Please note that for the above calculations we only took in consideration the ability of the port to attract
and accommodate safely ships at berth. The anchoring and tender option has not been fully explored, but
of course any cruise ship sailing in the region will be a potential target for this option and this means that
the 934,000 passengers that are cruising in the region are effectively the potential catch basin of future
traffic as they move to the Baltic, Norwegian Fjords, British Isles, Coastal and other itinerary patterns
offered to their passengers.
Nevertheless we have been able to collect some feedback from selected cruise line executives and
maritime professionals; the prospects of anchoring at 3km distance and operating a 20 to 25 minute
tender ride with possible rough sea conditions normally experienced in the West Coast does not appeal
immediately to a cruise line taking into consideration the safety and cost aspect of the operation and also
the possible return on investment (ROI). We will tackle this topic later in the report
But what we can already deduct at this stage is that improving the port facilities will probably be a key
factor for Hvide Sande to have a good shot at attracting and accommodating larger ships.
4.3. Baltic Sea Region
The Baltic Sea cruise region forms part of the Northern Region and is comprised of a variety of cruise
itinerary patterns taking advantage of a wide variety of marquee ports and smaller destinations
throughout the region offering an abundant choice of nature, history, culture and sightseeing options.
Cruisei nerariescrossingHvideSandewithshipsthatfitintheport
26199,6%
10,4%
I nerariesthatdoNOTfit:261 I nerariesthatfit:1
Cruise Feasibility Report for Hvide Sande – PG. 33
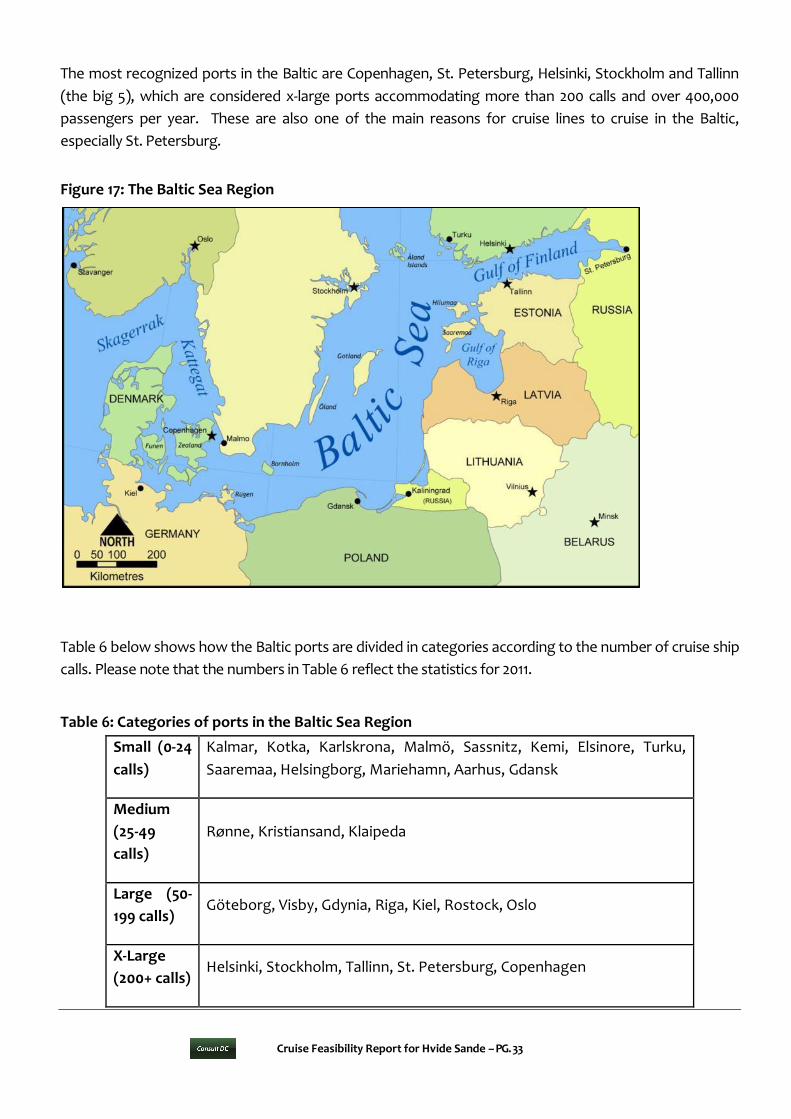
The most recognized ports in the Baltic are Copenhagen, St. Petersburg, Helsinki, Stockholm and Tallinn
(the big 5), which are considered x-large ports accommodating more than 200 calls and over 400,000
passengers per year. These are also one of the main reasons for cruise lines to cruise in the Baltic,
especially St. Petersburg.
Figure 17: The Baltic Sea Region
Table 6 below shows how the Baltic ports are divided in categories according to the number of cruise ship
calls. Please note that the numbers in Table 6 reflect the statistics for 2011.
Table 6: Categories of ports in the Baltic Sea Region
Small (0-24
calls)
Kalmar, Kotka, Karlskrona, Malmö, Sassnitz, Kemi, Elsinore, Turku,
Saaremaa, Helsingborg, Mariehamn, Aarhus, Gdansk
Medium
(25-49
calls)
Rønne, Kristiansand, Klaipeda
Large (50-
199 calls) Göteborg, Visby, Gdynia, Riga, Kiel, Rostock, Oslo
X-Large
(200+ calls) Helsinki, Stockholm, Tallinn, St. Petersburg, Copenhagen

Cruise Feasibility Report for Hvide Sande – PG. 34
Source: Cruise Baltic
For a complete Baltic Sea Region port statistical table including expectations for 2013 please see the tables
in Annex 4, showing the numbers of cruise ship calls and numbers of passengers since 2000.
Please note that these figures are taking into account how many passengers visit each port and the total
is the sum of all ports. That means that one cruise passenger can visit 4 or 5 ports and the total number for
the statistics will be the number of Cruise Baltic port that he visited.
Cruise Baltic is a network of cruise destinations in the Baltic Sea offering easy access to 10 countries
on a string with an ocean of adventures. The association - started in 2004 with 12 destinations has
now grown to 27 destinations http://www.cruisebaltic.com/
The Baltic Sea region reports positive growth and the results of Cruise Baltic market review 2013
announced at The Cruise Shipping Miami shows that from 2000 – 2012, the number of passengers to the
region has increased by an average annual rate of 11.6% - from 1.1 million in 2000 to 4.2 million in 2012.
Looking ahead to 2013, it is anticipated that the number of passengers will increase at a growth rate of
4.7%, representing an estimated increase of approximately 196,000 passengers, to more than 4.3million.
While the number of passengers and volume of calls has been increasing in general, we can observe
that the increases are mainly in the medium to large port segments – basically ports that are able to
accommodate larger vessels and that are engaging in port development initiatives.
There are still ports that have not been able to register any significant increase in their numbers
throughout the years. These include mostly the smaller destinations that can accommodate ships at
berth and tender, but also others that are similar to Hvide Sande in terms of port characteristics and
pier limitations such as Elsinore and Karlskrona, where most ships have to tender, although they
have a solid tour and attraction offer. But still their numbers remain low, as cruise lines seem to
prefer ports where they are able to dock to avoid safety and security hazards and also tend to chose
more recognized and well branded ports that help to sell better their itineraries.
Analyzing the statistics above, we can also deduct that the ports that offer larger piers and more
adequate facilities to accommodate larger vessels are also the ports that are currently able to receive the
most number of calls and passenger visits. And these are also the ports that are able to secure greater
economic benefits to the local economy.
4.4. Danish Ports
Copenhagen is still the main cruise port in Denmark with 372 calls and 840,000 passengers in 2012. Most of
the other ports have relatively small figures and were not able to increase their numbers significantly over
the last 7 years, while other smaller harbors that have similar port limitations as Hvide Sande have not

Cruise Feasibility Report for Hvide Sande – PG. 35
been able to make any significant impact in terms of growth either. And these are destinations that are
able to deliver a good and solid tour and attraction offer.
Please find in Annex 6 a full table of statistics for Danish cruise destinations.
In summary, there has been little growth regarding the number of passengers and cruise ship calls in all
small and medium ports and the numbers are very inconsistent overall. But we would like to point out
that in some cases like Ronne, even if the port seems to be loosing on the number of calls (from 2012 to
2013), the passenger numbers are still increasing. This is due to the fact that cruise ships are getting
bigger. And this brings an added pressure for ports in general to eventually engage in port development
to safely accommodate larger vessels.
We also want to point out that there has been a solid interest from cruise lines in Danish destinations
given the work of Cruise Copenhagen Network in promoting Denmark to the international markets, but
the tendencies in the future given the ECA’s and rise in fuel prices will be for itineraries with fewer ports,
shorter stays in port and slower steaming speeds.
This means that there will be “winners and losers”, and the smallest destinations or most “out of the
way” destinations could be the ones that suffer the most. The destinations that are most likely to succeed
will be destinations that are able to position themselves as:
Fitting in an itinerary (basically being on the way between some of the most important and well
known ports);
That can accommodate larger vessels;
That can guarantee low port costs; and
That can provide a good shore excursion offer and help the cruise lines to increase their tour
revenue and guest satisfaction ratings.
And this applies to other regions as well. Based upon cruise line input, there are some key growth factors
that must be considered and resolved to allow for more growth in Denmark, Baltic and in the Northern
Sea Region over the mid- to long-term. They include:
Additional cruise infrastructure capable of supporting larger cruise vessels and passenger loads
throughout the region. The region continues to require more port options to reach key
demographic areas and provide for the cruise product within a short fly or drive area;
Environmental zoning and fuel issues that impact speed & distance in itinerary planning exercises
which may limit the number of ports offered or impact the amount of time spent in each port will
be an ongoing challenge that ports must consider and work to accommodate cruise lines in this
regard. With the ever increasing pressure on the industry to continue its efforts to reduce
emissions, the environmental control zone of the Mediterranean and Baltic regions will affect the
ability of the cruise brands to deliver key products due to high fuel costs and supply of low sulfur
fuels in these regions; and,

Cruise Feasibility Report for Hvide Sande – PG. 36
Continuous development of key distribution channels throughout Europe will provide for a newer
expanding consumer market eager to cruise in the adjacent areas.
4.5. Economic Impacts
The cruise industry provides a wide variety of direct and indirect economic impacts to the communities
they visit based upon passenger and crew spending; provisions required by the vessels including food &
beverage, fuel and other supplies; tourism venues, guides, coach companies and other transportation
providers; port and operational charges; air and hotel for homeport operations; and a myriad of
secondary impacts based upon trickle down spending. The development of new cruise facilities also
provide for cruise impacts with the development of the project, construction and employment of
personnel to operate the facility.
Based upon current European Cruise Commission Economic Impact Assessment data on average passengers
visiting a port of call spent an average of €62 per call. Including embarkation port and ports of call, each
passenger that visits a European port generated an average total expenditure of nearly €100.
Crewmembers spent an average of €21 per visit to a port in Europe.
Danish port economic impacts
Until now, only the port of Copenhagen and the port of Aarhus have engaged on cruise economic impact
studies. Cruise Copenhagen Network attempted a similar exercise but the number of participants was too
low to guarantee a proper evaluation of a few selected destinations, so we will not use those figures.
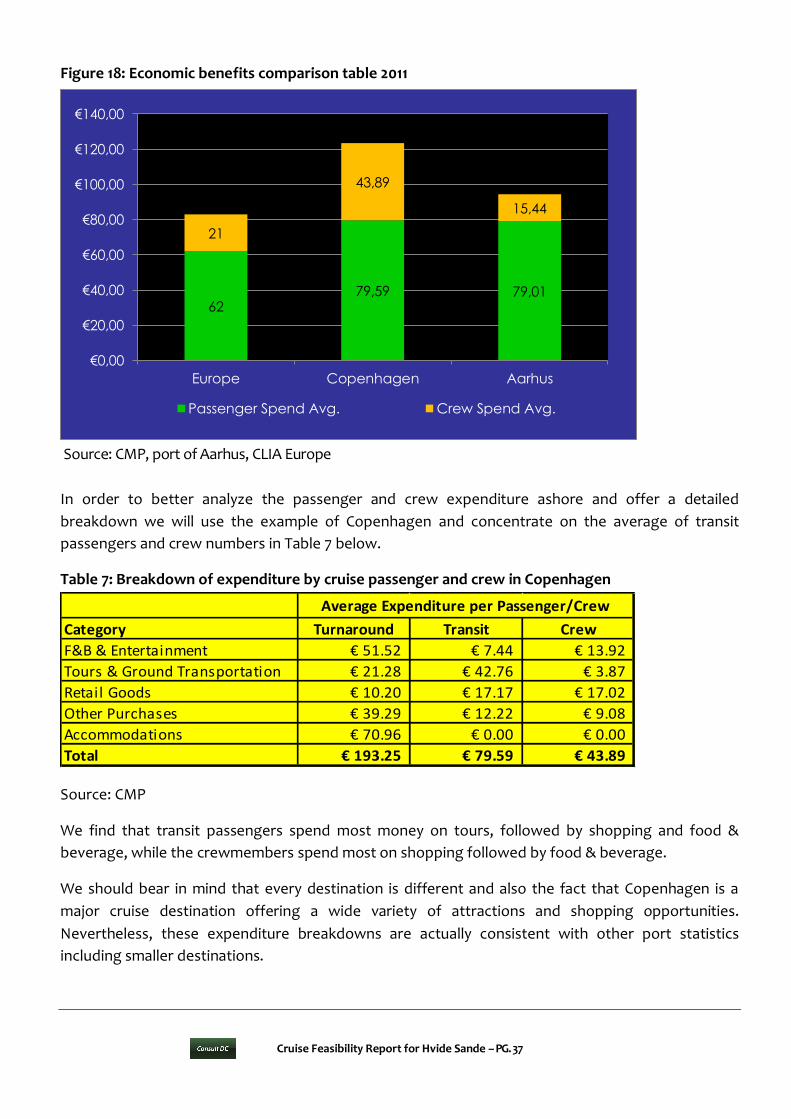
Copenhagen - In 2011 the total expenditures by transit passengers, including tours, averaged € 79.59 per
passenger. This is 25% higher than the European average of €62. Crew visiting Copenhagen reported
spending an average of € 43.89 while ashore. This is 95% above the European average.
In total, the port and city of Copenhagen report an overall contribution of € 71.8 million in passenger and
crew spending that generated an estimated 975 direct jobs and € 24.1 million in compensation in
Copenhagen and the surrounding region. Source: Copenhagen Malmo port.
Aarhus – In 2011 the total expenditures by transit passengers, including tours, averaged €79.01 per
passenger. This is 24% higher than the European average of €62. Crew visiting Arhus reported spending an
average of €15.44 while ashore. This is 40% below the European average.
The fact that passengers currently spend in average more in Danish destinations than in Europe is a very
good sign, but it is not a given one. A destination that wishes to take advantage of these possible
economic impacts needs to improve their offering and options for cruise passengers and crewmembers
when they go ashore.
Cruise Feasibility Report for Hvide Sande – PG. 37
Figure 18: Economic benefits comparison table 2011
Source: CMP, port of Aarhus, CLIA Europe
In order to better analyze the passenger and crew expenditure ashore and offer a detailed
breakdown we will use the example of Copenhagen and concentrate on the average of transit
passengers and crew numbers in Table 7 below.
Table 7: Breakdown of expenditure by cruise passenger and crew in Copenhagen
Source: CMP
We find that transit passengers spend most money on tours, followed by shopping and food &
beverage, while the crewmembers spend most on shopping followed by food & beverage.
We should bear in mind that every destination is different and also the fact that Copenhagen is a
major cruise destination offering a wide variety of attractions and shopping opportunities.
Nevertheless, these expenditure breakdowns are actually consistent with other port statistics
including smaller destinations.
62 79,59 79,01
21
43,89
15,44
€0,00
€20,00
€40,00
€60,00
€80,00
€100,00
€120,00
€140,00
Europe Copenhagen Aarhus
Passenger Spend Avg. Crew Spend Avg.
Category Turnaround Transit Crew
F&B & Entertainment € 51.52 € 7.44 € 13.92
Tours & Ground Transportation € 21.28 € 42.76 € 3.87
Retail Goods € 10.20 € 17.17 € 17.02
Other Purchases € 39.29 € 12.22 € 9.08
Accommodations € 70.96 € 0.00 € 0.00
Total € 193.25 € 79.59 € 43.89
Average Expenditure per Passenger/Crew

Cruise Feasibility Report for Hvide Sande – PG. 38
This should give us an indication on what sort of income should be expected from the cruise business
and also which areas a destination should focus on developing in order to maximize their potential
sources of revenue.
Still we need to take into consideration that the ultimate economic impact on the destinations varies
depending on the ship being berthed or anchored. The figures above were captured when ships
were at berth.
In average, the number of passengers coming ashore varies between 65% to 85% depending on the
nature of the destination. Crew numbers vary from 20% to 40%.
When a ship anchors, the number of passengers and crewmembers coming ashore decreases to 40%
to 65% for passengers and 15% to 30% for crewmembers.

Cruise Feasibility Report for Hvide Sande – PG. 39
5. The port of Hvide Sande
Hvide Sande is a picturesque port town located on the West Coast of Denmark. Originating from
1931, Hvide Sande is Denmark’s newest town. The town has approximately 3,500 inhabitants and the
port is the 5th largest fishing port in Denmark.
The main sources of income for the city derive from fishing and land-based tourism originating
mainly from Germany.
Hvide Sande has never received a cruise call and in actual fact the whole West Coast of Jutland and
Germany is still pretty much “virgin lands” when it comes to cruise business. The region is
experiencing a few visits from smaller cruise lines coming from Germany or Holland on mini cruises,
coastal cruises or in the way to the Norwegian fjords.
The port is 100% a fishing port but the management is looking into other business areas such as
servicing of sea-based windmill parks and possible cruise tourism.
The access to the port by sea is mainly done through a water channel 6 meter deep up to the
extremity of the West Harbor and from then the depth decreases to a low 3,5 meters.
This limits the number of ships that are able to enter the port to a safe draft of 4,5 to 5 meters given
that the port experiences a tide variation of approximately 70/80 cm.
Figure 19: Port of Hvide Sande
The port is currently working on redeveloping the West Harbor which will offer a berth of 150 meter
LOA, 6,5 meter draft, a 30 meter apron area with 50 ton bollards at 21 meter distance from each
other.

Cruise Feasibility Report for Hvide Sande – PG. 40
This will be the most suitable pier to berth cruise ships and the port recommends that the maximum
length of the cruise vessels berthing should not exceed 140 meter LOA and 5 meter draft. The ships
might need the assistance of a tugboat, which is readily available at the port.
If the ships are bigger, then the other solution is to anchor outside the port at open sea. Safe
distances to anchor vary depending on the size and draft of the vessels but according to the port the
safest distance to anchor large ships could be at 3km distance where the water depth is 16 meters.
Up to this point the depth oscillates between 7 and 9 meters in relationship to the port entrance.
The currents oscillate between 1 to 3 meters in variation and the wind is predominantly SW to NW
with 10m/s speed. If the ship anchors at 3km distance the tender ride is estimated to last between 20
to 25 minutes (one way) depending on the ship’s tender characteristics.
If ships use the West Harbor we certainly recommend using a shuttle bus to transfer any passengers
that do not participate on organized tours to the center of town.
If tendering the most suitable pier to operate the tender operations is the furthest pier at the South
Harbor (see Figure 20) where there is space to operate two tenders simultaneously. The adjacent
ground area is ample in space and can easily accommodate 10 buses and additional vehicles, a
tourism information booth and welcoming set-up. A public toilette is also available. The walking
distance to the center is about 300 meters over the bridge.
Figure 20: Possible tender pier
5.1. Attractions - Hvide Sande and surroundings

Cruise Feasibility Report for Hvide Sande – PG. 41
The town of Hvide Sande is small and picturesque and it comes to life in the summer when visitors
flood the streets, shops and the few restaurants. The cruise tourist will be able to find some
souvenirs and good quality articles including gourmet choices in the local shops.
As main attractions in the region within 1 hour drive we must single out: Ringkøbing old town and
museums, the unique West Coast nature landscapes around the Fjord, Nr. Lyngvig light tower, WWII
bunkers, several historic and nature-based museums, aerial flights from Stauning Airfield, the
gourmet stops (Stauning Whisky Distillery, a number of farm shops, smoked fish and other
delicacies), some of Denmark’s best water sports facilities including three wind and kite surf schools,
the longest cable park in the country and the story telling about the region’s history of being located
on the edge of nature.
But nature remains the main attraction. This is probably the main reason for visitors to come to
Hvide Sande – the beaches, wild nature, the Fjord and all the outdoor activities associated with the
region.
The region has approximately 5 million visitor nights including day visits a year bringing an average of
2,1 billion dkk in contributions to the local economy. 83% of these visitors are foreigners mainly from
Germany.
It has been understood that one of the main objectives of the Destination Hvide Sande is to improve
the quality of tourism and offer to attract even more tourists, and to use Hvide Sande as a
recognized brand name. This is part of the new strategy and identity for the region and the new
website already reflects this upgrade.
Hvide Sande Service Group is an established network of business operators with the main strategic
aim of providing services to the coming offshore windmill business as well as to the growing tourism
industry.
As part of this research Consult DC requested from the local tourism professionals a list of possible
shore excursion options that could be offered to cruise lines. This was an exercise that allowed us to
evaluate the ability of the local stakeholders to create possible programs for cruise, and also to
obtain a more detailed and tailor-made data base to be used when surveying cruise lines and service
providers.
Consult DC is fully aware that this is the first time that the local stakeholders have prepared such
programs and we congratulate you on your efforts.
We have registered 6 half-day tours, 1 full day tour, and other additional activities such as 12 active
options (water and other sports and adventure activities), 2 special programs and 1 option for
children. Out of these, and from our experience, we estimate that cruise lines would probably select
2, maximum 3 tour options and offer the additional activities for independents guests.
While some cruise lines offered their feedback regarding the initial tour options for Hvide Sande, we
would like to point out the example of a destination that offers 23 possible tours on their website,

Cruise Feasibility Report for Hvide Sande – PG. 42
which we could consider above average. But still, the cruise lines do not choose all tours to be
offered on board.
For example a premium / luxury cruise line is offering 5 out of these possible 23 excursions with a
percentage of 43% participation of passengers. In fact these numbers are not bad considering that
the ship was tendering.
Another company catering for the mass market is only offering 3 tours in the same destination with a
participation of 24% and one tour was canceled due to low participation. The ship was also tendering
and the average age of the passengers was 65. Next year they will only operate 2 tours.
These statistics tell us two things:
Cruise lines do not sell all tours offered by the destination. What they do is evaluate which
tours are more profitable and with less costs involved and more appealing to their clientele’s
profile. Each company and clientele varies in class, nationality and age of passengers and
cruise lines put all these factors together when selecting tours. But still they like to have 23
choices so that they can evaluate all options;
The second factor is that when a cruise ship anchors and tenders its passengers ashore, it is
harder to sell tours as the older the guests are they tend to stay on board and not go ashore,
especially if the tender ride is long. In many cases when a ship tenders, 50% of the passengers
remain on board, 30% go on tour and 20% explore the destination on their own.
Taking the above into consideration, we deduct that the offer lacks in content and quantity and a
more tailor made product development is required.
For the record, we have excluded attractions and venues that are located further than one hour
driving distance from Hvide Sande. This includes for example: Legoland, Givskud Zoo and Ribe.
There is also a limitation in terms of transportation and guide availability. Most vehicles (including taxis)
will need to come from Ringkøbing and this will add an extra cost on any programs and there are no
active cruise guides in the region at this stage, meaning that training would need to take place.
Cruise Feasibility Report for Hvide Sande – PG. 43
6. Interviews and SWOT Analysis
In this chapter we include feedback from selected cruise lines, service providers and other cruise
related personnel that Consult DC felt that their contribution would be meaningful to include on this
report. The responses were kept confidential as per agreement with the survey participants. This
also allowed us to obtain more detailed and less “holding back” feedback that was vital to complete
this report.
6.1. Summary of interview responses
The region in general lacks the infrastructure (soft and hard) to accommodate cruises at this
stage;
At the moment we are visiting some destinations in the West Coast of Denmark and Germany
just to fill in the itineraries;
As things stand (lack of suitable berth and a long tender run) there's no possibility of us
considering the port. The second big concern would be the cost of the land program as
guides and transportation would probably need to be transported from other regions. With
the right investment in port infrastructure that could change, as the North Sea Coast of
Denmark would be very well placed strategically to attract cruises given the lower speeds
we'll be operating to in the future;
Hvide Sande and the area is lacking a big draw, and we would not expect to see a high take up
of shore excursions were we to call, particularly if the destination was placed at the end of a
Baltic or Norwegian itinerary. What we would need to see is a very attractive port tariff to
offset this. That said, given the age of our passengers tender ports are only considered as a
last resort;
Were the port to build a suitable berth to accommodate large vessels, we could consider it for
the future - it is well placed geographically and the North Sea coast needs something! We
visited Esbjerg way back but the UK market still sees it as a ferry port and it would need to do
some serious marketing to change that perception;
We are visiting some of the German islands in the region to offer our guests a more authentic
and nature driven and up close experience to our guests. Norway is becoming crowded and
we are interested in more “exotic” and off the beaten track to provide intimate experiences;
But if tendering we cannot offer a tender ride longer than 10 minutes as our guests get bored
and feel cheated. We prefer anchoring in front of the destinations to offer great views and
motivate the passengers to go ashore;
Cruise Feasibility Report for Hvide Sande – PG. 44
Hvide Sande and the region do not offer a big highlight, the tours are not appealing. Nature is
the biggest draw which is hard to sell;
Cruise lines are very aware of pricing and ask us to cut down on “add-ons” on most of the
tours to minimize the rates, so destinations need to do that in consideration especially of
planning full day tours (which are harder to sell). Venues need to consider what to charge;
The destination is very limited in the number of ships that can attract;
The locals at many destinations have this idea that cruise business is a “gold mine” and many
times get disappointed when passengers do not spend money ashore. People need to be
prepared for this;
On the other hand the destination needs to work constantly to create innovative
opportunities for passengers and crew to spend money in their destinations;
Anchoring at the very often windy and rough west coast would be a big challenge. Many
captains would decide to jump the port and continue to the next one as a tender ride would
really challenge the guests;
It will be hard to sell the destination tour wise, as venues are somehow specialized. An option
could be to offer theme cruises to smaller ships like Star Clipper and similar;
We draw a straight line from our UK embarkation ports straight line to Skagen when sailing to
the Baltic. It would be a big deviation to sail to Hvide Sande regarding costs of fuel;
What could we do with 1000 or even 2500 people in Hvide Sande?
Smaller cruise ships use the Kiel Canal to access the Baltic to save time and fuel. Hvide Sande
and the region are out of the picture;
The coast of West Jylland is well positioned for slower speeds itineraries that cruise lines are
adopting more and more, but the infrastructure needs to improve;
Ships are getting bigger and the maritime legislations do not favor older ships especially with
the implementation of the ECA’s and waste discharge regulations;
There is a great competition between ports to attract cruise line calls and the smaller and
more restricted ports in terms of access will have great difficulties in the future;

Cruise Feasibility Report for Hvide Sande – PG. 45
There is no shelter if anchoring;
Could be an option for explorer or expedition type of cruise lines;
It is important that a cruise destination delivers good quality services (enough guides, buses,
attractions) that are well recognized by the cruise lines. It does not only contribute to the
growth of the destination but also to the general impression of the country and all the other
Danish ports.
6.2. SWOT Analysis
We have compiled the below SWOT analysis extrapolating information collected on our surveys and
interviews, and also included findings from earlier research. The results were used on our
presentation / workshop with the local stakeholders on May 15th 2013 in order to better illustrate
Hvide Sande’s position relating to potential cruise tourism. We are also using this SWOT exercise on
our further analysis and conclusions below
Table 8: SWOT exercise
Strengths Weakness
New destination
Unique settings – potential to become
a niche destination
The city is used to handle tourism
Local support - city willing to have
cruise business
Shops are well prepared to take credit
cards and speak English, German and
Nordic languages
Attractive port fees
Ample space at port and at tender area
to handle cruise operations
Weak marquee value and brand recognition
Limited port facilities
Only 4 cruise ships sailing in the region can berth
Long tender ride if anchoring
Coastal cruises are only 3,8% of total cruises in
the region
Lack of shore excursion options – reduced
revenue options
Lack of recognized attractions
Cruise lines are generally not familiar with Hvide
Sande and the West Coast of Jylland
Tour operators and handlers based in
Copenhagen. Many port agents and operators
do like to operate smaller destinations given the
costs of moving ops from CPH
Inside ECA zone. Some cruise lines may reduce
their presence in the region by 40%
Guide limitations
Limitation on transportation (especially mini
vans, privates, taxis)

Cruise Feasibility Report for Hvide Sande – PG. 46
Source: Consult DC
6.3. Average cruise budget for a small destination
Below, we offer an average cruise budget for a small destinations covering marketing and promotion
initiatives and materials; international events such as Cruise Shipping Miami, Seatrade Med, Seatrade
Europe and others; cruise network affiliations such as Cruise Baltic, Cruise Europe, Cruise Copenhagen
Network; cruise line visits; site inspections; welcoming at the pier and operational costs, and other cruise
related expenses. The average spending for a small destination is approximately 1 million kroner per year.
Medium and large destinations and even smaller destinations with great ambitions can spend up to 2.5 to
3 million kroner a year.
The above-mentioned costs are normally, (but not always) shared by the port, the local tourism
organization and other local stakeholders.
The costs constitute a long term investment and historical facts and experience show that on
average, only after 3 to 4 years the ports will start to experience some results in the form of cruise
and passengers visits after initiating this work.
Destination still relatively unknown –
can create its own “space”
Product development can improve
Hvide Sande is already very popular
with German tourists
Local shop owners and businessmen to
expand options and offers for cruise
tourists
Cooperation with other Jylland
destinations such as Aalborg, Skagen
and Arhus to train guides for cruise
Possible inclusion on short itineraries
from German cruise lines in the region
Sell it as a “relaxed” destination to
break off busy ports of call in the Baltic
and Norway
Expedition cruise lines
West Coast of Denmark is relatively
unknown by cruise lines
Possible cooperation with other
destinations in the region
How ECA will affect the region
City center location from West Harbor pier
location (shuttle / walk?)
Marpol rules to handle waste management can
affect the whole region
Hvide Sande has a busy summer season –
possible tourism pollution if having many cruise
passengers in town at the same time
Not enough guides (quantity and languages)
for official and independent operators
Destination not able to fulfill guest and cruise
line expectations
Cruise lines might not see it as a regular port of
call in their itineraries, but only from time to
time
Esbjerg to get serious about cruise
Bigger ships being built
Cruise itineraries being reduced and port
eliminated due to high fuel costs
Opportunities Threats

Cruise Feasibility Report for Hvide Sande – PG. 47
For most of the destinations, it is hard to quantify and measure the return on investment. While the
port revenue based on port and passenger fees constitute a very small fraction of income to the port
(compared to other port business sectors), most of the economic contributions actually go to the
city (shops, restaurants, etc.) and service providers (tours, buses, guides).
Table 9: Estimated yearly cruise budget for a small destination
Source: Consult DC
EstimatedyearlycruisebudgetforasmalldestinationInternationalfairs-SeatradeConvention,Miami(incstand,travel,reception,etc.)70,000-SeatradeConvention,Hamburg12,000Visitstocruiselineoffices-USA60000-UK30000-Germany15000Marketing-Newsletter/mailingpostcards4pcs/year(includingproduction)50,000-Brochures50,000-Website(maintainandupdate)50,000Others-Siteinspections20,000-Participationadditionalseminars/conferences20,000-Giveaways5000-ShippingDispatch10000-Miscelaneous10000Estimatedtotalcostmarketing402,000dkkCruiseassociation’smembershipMembershipforCruiseBaltic(smallport)75,000MembershipforCruiseCopenhagen27,500Travelcoststoattendrelatedmeetingandevents10,000Estimatedtotalcostsforcruiseassociationparticipation,networking,learningexperience112,500dkkOperationalcostsassociatedwithshipatdock-Settinguptourisminformation-Signs-Replacementstaff-Musiconthedock-Smallgiftstopassengersonarrival-Representationduringthevisitofrepresentativesfromthecruiselines-ShipvisitsEstimatedtotaloperationscost100.000dkkWorkinghoursbyportandcitypersonnelordedicatedcruisecoordinator400,000dkkEstimatedTotal1,014,500dkk

Cruise Feasibility Report for Hvide Sande – PG. 48
6.4. Overall analysis of the case of Hvide Sande as a cruise destination
One executive from Carnival Corporation recently mentioned that it takes 4 years for cruise lines to
deliver a cruise ship and 40 years to deliver a suitable port and destination for cruise.
While this does not apply in general the comment still hits a note: it takes time to prepare and deliver
a cruise destination. It does not happen overnight. There is much work to be done and planning to
take place.
As per our SWOT analysis, we can identify several areas that need improvement, and probably the
most important factor to mention at this stage is the access to the port. With the current facilities,
Hvide Sande is very limited in terms of cruise ships that it can accommodate at the pier being the
maximum 140-meter of LOA and 5 meter of draft.
In actual fact, there are only 4 ships out of the 82 ships sailing in the region that can actually fit the
pier. And out of those 4, there is only one ship carrying 184 passengers that is actually crossing Hvide
Sande while the others use the Kiel Canal to access the Baltic. The options of the remaining 48 ships
to come in the region are very slim as these ships are mainly chartered to sail in more profitable and
exotic regions. And since most of these are older ships they will probably vanish with time and the
new and bigger ships will not be able to fit in the port.
So any calculations and plans to attract cruise ships cannot be based on these existing smaller
vessels.
It is difficult to make projections for possible cruise calls at this stage, but given all the data analyzed
above and taking into consideration:
The current port limitations,
The reduced amount of ships that can actually fit the pier,
The anchoring conditions and tendering time,
The tendency for cruise lines to build larger ships,
The lack of major attractions in the region, and
The location of the destination not being favored and featured regularly in cruise line itineraries,
We estimate that it will be difficult for the port to attract any cruise business at all given the current
situation.
Perhaps the port will get a cruise call here and there from a smaller ship at berth or at anchor (if not too
far from dock), but this will depend also on the promotion and product development done by the
destination and its stakeholders. Money and time will need to be invested for this to happen.

Cruise Feasibility Report for Hvide Sande – PG. 49
As per our research and statistics above, the trend is that ships are getting bigger and ports need to adjust
their facilities accordingly. This amounts to great pressure on new destinations that dream of pursuing
cruise business and substantial investments need to take place and of course the best options need to be
planned that are suitable to the port and city.
An option discussed, was to build a dedicated cruise pier structure (sort of a finger pier) directly
opposed to the West harbor on the East side of the channel, but the port will still be limited to a 6
meter draft and a turning basin of 150 meters. In addition, the length of the ships could block the
navigation channel.
A second option could be to use floating buoys strong enough to secure larger vessels inside the
breakwater, but again the draft of 6 meters is a limitation and the ships could also block the entrance
of the port.
A third option could be to rent a smaller and faster ship that could transport an average of 100 - 200
guests from the cruise ship at anchor to Hvide Sande, instead of using the cruise ship’s tenders. This
option would also need to be properly evaluated and cruise line marine departments consulted for
feedback on safety and security.
Of course if pursuing any alternative or option the port need to do a proper cost evaluation and the
pros and contras taken in consideration, but most important is to quantify the ROI (return on
investment).
If the port decides to invest in facilities to accommodate larger vessels or to safely anchor vessels closer to
the port, it would change the situation, but still the lack of recognized attractions and tour offer limitation
will remain a challenge.
As requested by the stakeholders, we did a further analysis by taking into account a possible
extension of the West Harbor to a LOA of 225 meters and the depth to 8 meters.
In this case, we would be using as search criteria ships of LOA 200 meters and 7 meters draft. Of the
340 existing cruise ships, 122 ships or 36% of the worldwide fleet could fit these improved port
specifications, compared to 82 ships fitting the existing conditions (see Figure 21 below). The
complete list of the 122 ships is found in Annex 7.

Cruise Feasibility Report for Hvide Sande – PG. 50
Figure 21: Number of ships worldwide that could fit in an expanded pier of 8m draft and 200m length
Source: Consult DC
Of these 122 ships, there are actually 30 ships (25%) that could fit in the West harbor if the port would
extend their facilities. See Figure 22 below:
Figure 22: Number of ships worldwide that could fit in the expanded port of Hvide Sande
Source: Consult DC
We break this down further by calculating that out of the total 82 ships that are currently sailing in
the region there are currently 30 cruise ships (37%) that would be able to fit in the port of Hvide
Sande as per Figure 23 below. The 30 ships carry a maximum of about 15,000 passengers.
122 36%
218 64%
Number of ships worldwide that could fit in an expanded pier of 8m
draft and 200m length
Number of ships that fit:122
Number of ships that doNOT fit: 218
Total number of ships worldwide:
30 25%
92 75%
Number of ships worldwide that could fit in the expanded port of Hvide
Sande Number of ships in the regionthat fit in the expanded port:30
Number of ships worldwidethat fit in the port but are notoperating in the region: 92
Total number of ships worldwide that could fit: 122
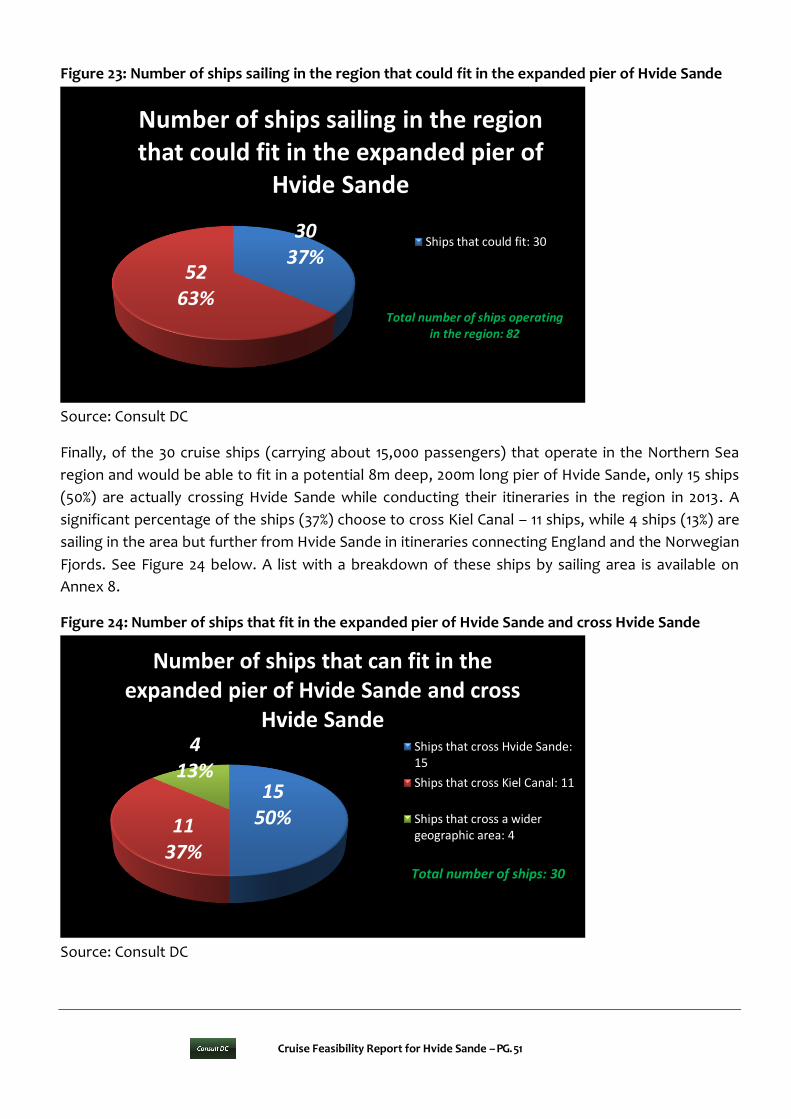
Cruise Feasibility Report for Hvide Sande – PG. 51
Figure 23: Number of ships sailing in the region that could fit in the expanded pier of Hvide Sande
Source: Consult DC
Finally, of the 30 cruise ships (carrying about 15,000 passengers) that operate in the Northern Sea
region and would be able to fit in a potential 8m deep, 200m long pier of Hvide Sande, only 15 ships
(50%) are actually crossing Hvide Sande while conducting their itineraries in the region in 2013. A
significant percentage of the ships (37%) choose to cross Kiel Canal – 11 ships, while 4 ships (13%) are
sailing in the area but further from Hvide Sande in itineraries connecting England and the Norwegian
Fjords. See Figure 24 below. A list with a breakdown of these ships by sailing area is available on
Annex 8.
Figure 24: Number of ships that fit in the expanded pier of Hvide Sande and cross Hvide Sande
Source: Consult DC
30 37%
52 63%
Number of ships sailing in the region that could fit in the expanded pier of
Hvide Sande
Ships that could fit: 30
Total number of ships operating in the region: 82
15 50% 11
37%
4 13%
Number of ships that can fit in the expanded pier of Hvide Sande and cross
Hvide Sande Ships that cross Hvide Sande:15
Ships that cross Kiel Canal: 11
Ships that cross a widergeographic area: 4
Total number of ships: 30

Cruise Feasibility Report for Hvide Sande – PG. 52
Hypothetically, the port could be a potential choice for 15 ships and a total of 8,655 passengers if
extending the port to 225 meters LOA and 8 meters of draft. But this is far from a given business. As
mentioned above, a considerable amount of promotion would need to be done and adequate
services guaranteed for any real business to materialize.
But in terms of navigation, the port would still face challenges, as the turning basin is only 150
meters, meaning that most ships would have to back down from the entrance of the port to the
berth. The diameter of the new entrance of the port (at breakwater) is 100 meters and the diameter
of the old entrance of the port is 80 meters. While this would not be a major obstacle for navigation
when adding the strong winds that frequently occur in Hvide Sande, most captains would not enjoy
the idea of backing all the way to the pier.
At this stage, therefore, it seems that the anchoring option is the best alternative but as we have
established, cruise lines in general do not like to tender and if doing it, they prefer short tender rides.
A 20 to 25 minute tender ride is simply too long and since the destination does not have any major
attractions, cruise passengers will be reluctant to come ashore and cruise lines will not stop at Hvide
Sande.
It has been further investigated that ships could anchor with a draft of 10 meters at approximately
1.5 kilometers of the coast. This would probably reduce the tender ride by half, which is good news.
The bad news is that even with relatively calmer winds between 6m/s and 7 m/s from S – SW and a
wave oscillation of 0.5 meters the sea is still rough for passenger tender navigation.
In the afternoon of May 15th 2013, we joined a small 2-hour trip aboard the sconner Maja and we
experienced firsthand the conditions of the sea at 1.5 km, and even the Maja captain mentioned that
these were relatively fair sea conditions. So the tender options are also becoming very limited unless
the weather is fantastic, which is very hard to predict 2 years in advance – the average time that it
takes for a cruise line to plan the itineraries up to execution.
While the port infrastructure is important, the actual destination experience and tour offer is equally
important as a determinant factor for cruise lines to decide which port to visit.
Cruise lines in general are looking for options to reduce costs and increase revenue. Given the
increasing fuel prices many cruise lines are removing ports out of their existing itineraries or cutting
down on time spent on the port to reduce speed on sailing and save on fuel costs. Smaller
destinations out of the main itineraries will probably suffer the most. This puts more pressure on
new destinations that want to “break in” to have any realistic chances.
Destinations and itineraries are driven by consumer demand and at the moment, cruise passengers
do not know Hvide Sande and in general are not familiar with the region. Much work would need to
be done to promote the destination, but as per the budget in Table9, it would require considerable

Cruise Feasibility Report for Hvide Sande – PG. 53
investments from the local stakeholders and it would take some years until the destination sees any
result.
The itinerary planning process from planning up to brochure publishing, sales to public and
execution takes an average of 2 years to be completed. Cruise lines at this stage are completing
planning for 2015 season and also already working on the 2016 season. Destinations need to also plan
their promotional activities well in advance.
The statistics for smaller destinations (with similar characteristics as Hvide Sande) that have pursued
cruise business for the last 10 years do not show any major increases and this also means that the
contributions to the local economies have not been significant, unless (as in the case of Elsinore) the
city and region receive visitors from cruise passengers originating from other neighboring ports such
as Copenhagen and Helsingborg.
So Hvide Sande needs to evaluate these statistics carefully before making any decisions, as the ROI
need to be properly calculated.
And one fact remains consistent: for a destination to increase its volume of cruise ships visits and
passengers, it needs to engage in port and facilities development and improve its tour / attraction
offer – this combination is crucial.
There are also limitations in terms of attractions, tours, venue capacities, transportation and guides
that need to be evaluated and added to the equation. Much work will need to take place to
overcome these challenges.
As per our research, cruise lines do not accept all tour options and actually choose the ones where
they can make more money and save more costs. A smart and successful destination is one that
thinks and plans on “how to better help cruise lines to increase their revenue shore side”.

Cruise Feasibility Report for Hvide Sande – PG. 54
7. Regional neighboring ports
In this section we will analyze ports in proximity to Hvide
Sande that offer similar upland products and experience
and provide for safe harbour can be seen as competitive.
However, there are some ports that may also be
complimentary in nature due to their draw and position
within a certain itinerary pattern. The regional ports that
are competitive / complementary in nature for Hvide
Sande include the following:
Skagen: Strategically located at the tip of Denmark Skagen has a major advantage as it can
accommodate smaller vessels at berth 170 meter LOA and 8 meter draft and a more sheltered anchor
point and shorter tender ride for larger vessels. In average the port welcomes 9 cruise ships a year and
these numbers have not changed for the last 10 years, mainly due to the limitations of the port. The
port is now planning the construction of a larger pier to accommodate vessels up to 340 meters and 11
meters draft to be ready in 2015. This will be a relevant development not only for Skagen for also for
the region as most of the ships that enter the Baltic cross Skagen in their itineraries. So the number of
passengers visiting Skagen could increase substantially. This can be positive for Hvide Sande, as more
passengers visiting the region will draw more attention to other possible destinations in Jylland.
Esbjerg: For the last few years the port has been welcoming an average of 3 cruise ships calls a year
predominantly from German cruise lines such as Transocean, Peter Deilmann that originate their trips
in Germany and Holland. Star Clippers has also called. Cruise lines associate the port mainly with cargo
and ferry activities. The port has not been active in promoting itself as a cruise destination and so far
they have been monitoring and evaluating the potential for cruise business. Englandkaj dock has LOA
310 mt and 7,6 mt draft but the port can accommodate even larger ships if necessary. Close proximity
to Ribe, Kolding and Legoland are pluses.
Rømø: Danish island that is very similar to Hvide Sande in terms of the charactetistics such as beach,
weather, nature, etc. The new pier with LOA 410 mt and 7 mt draft can accommodate larger ships at
berth. This is a huge advantage compared to Hvide Sande. Closer access to Ribe and other inland
options is also relevant. The port has one call this year from Peter Deilmann.
List / Sylt: This is a German island that shares the same characteristics as Hvide Sande in terms of
climate, landscapes and overall offer. It has a few calls a year (average 2 or 3) mainly from smaller lines
such as Peter Deilmann and Star Clipper which anchor at approximately 1 km distance from shore.
Basically this island is used to fill in gaps in the itinerary and not for any special reason, as one cruise
line pointed out. Passengers normally tender ashore as the port is limited.

Cruise Feasibility Report for Hvide Sande – PG. 55
Heligoland: small German island that again has similar characteritics shared by the other neighbouring
destinations in the region, but has some special distinctions in terms of landscape. The island has 16
cruise calls this year from Star Clipper, Phoenix Seereisen, Saga, and MSC that anchor in front of the
island. But apart from the tourism attarctions, one of the main reasons that cruise lines use this port is
to get a tax exempt status as the island is part of the EU but exempt from the EU VAT area and
customs union and consequently much of the economy is funded by the sales of alcohol, cigarettes,
perfumes and other VAT exempt items sold to tourists. Cruise ships are also allowed to have their
shops open during their stay in the island. Ships normally tender their passengers ashore as the port is
limited in size.
Copenhagen, Hamburg, Bremerhaven, Amsterdam, Ijmuiden: all these destinations have one thing in
common: they are larger ports are frequently used as turnaround ports on itineraries that sail in close
proximity to Hvide Sande. Therefore they will need to be taken in consideration for itinerary planning
if Hvide Sande decides to go ahead and pursue the cruise business.
Examples of itineraries in the region:
Peter Deilmann, Deutschsland 5 day itinerary: Hamburg, List/Sylt, Rømø, Heligoland, Hamburg
Peter Deilmann, Deutschsland 5 day itinerary: Hamburg, Esbjerg, At sea, Copenhagen, Kiel.
Star Clipper, Star Flyer 7 day itinerary: Travemunde, Kalundborg, Marstrand, Skagen, sea, Sylt,
Hamburg.
Star Clipper, Star Flyer 4 day itinerary: Amsterdam, Holland ; Den Helder, Holland; Heligoland,
Germany; Hamburg, Germany.
Saga, Quest for Adventure: 13 day itinerary: Dover, Heligoland, Kiel canal, Rønne,
Copenhagen, Helsingborg, Aalborg, Gothenburg, Oslo, Mandal, Stavanger, Dover
Phoenix Seereisen, Amadea 10 day cruise: Hamburg, Vik, Flam, Bergen, Arendal, Heligoland,
Hamburg.
MSC Magnifica 11 day itinerary: Hamburg, Heligoland, Edinburgh, Newcastle, Le Havre,
Zeebrugge, Amsterdam, Hamburg.
In terms of competition, any of the above ports can be competitors at this stage as Hvide Sande has not
yet a defined a position in the business. At the same time, any of the above ports can also be
complimentary ports to alternate calls in the region and most importantly, can be used to open the
“appetite” of cruise lines for new destinations options, and such a regional cooperation can facilitate the
the promotion of the destination and the product development in the region. So Hvide Sande will benefit
from monitoring further the cruise itinerary development in the region and the progress of the above
ports to further evaluate its position in the future.

Cruise Feasibility Report for Hvide Sande – PG. 56
8. Conclusion
Given the current conditions, it is very unlikely for Hvide Sande to have any chances of attracting
cruise ships at this stage - the challenges outweigh the opportunities by great length.
In our workshop in Hvide Sande on May 15th 2013, we also understood that the primary local
stakeholders do not want to pursue the cruise business given the findings of our study and the
realization of the current destination limitations.
For most smaller ports, cruise tourism comprise a very small business compared to the other sources
of income for the port. Cruise tourism is more like the "umbrella on a cocktail glass" - it looks nice
and the city inhabitants like it, but at the end of the day, someone needs to make solid investments
for it to happen.
Given the average budget needed to promote a new destination on an annual basis, in addition to
the time and management organization immediately involved, we find the local stakeholder’s
decision wise, as we cannot predict any proper return on investment or any significant economic
impacts to the local economy.
Another element to consider is that Hvide Sande is located in the North Europe coast and from our
research into the cruising regions, we have found that coastal cruises amount to a small 3.8% of
overall cruises in the region – leaving very slim chances for Hvide Sande to attract cruise lines.
Consult DC will not be able to make any final decisions for the local stakeholders but we will be
offering some recommendations on the next section that will hopefully help making the right
decisions.

Cruise Feasibility Report for Hvide Sande – PG. 57
9. Recommendations
While this study clearly concludes that Hvide Sande’s prospects of developing cruise tourism is very
slim given the current technical port conditions and limitations of the product offer, the challenges
by far outweighing the opportunities, this section contains a series of general and specific
recommendations in case Hvide Sande or similar smaller Danish ports should still want to pursue the
cruise business.
This would require the engagement in more detailed assessments and studies to determine the
magnitude of investment needed, especially at the port level. The navigation and facilities are far
from optimal to receive cruise ships at this stage.
Destination challenges are often cruise line needs. If any given port wants to attract or increase its
number of cruise passenger visits its needs to provide adequate facilities in order to accommodate
the larger vessels that are being built according to the cruise business trends and a profitable tour
offer.
In addition, there is a need to agree on a long term
cruise business strategy for the region that will
need to be in place to tie all the knots together
focusing on passenger satisfaction, cost control
and revenue opportunities.
The cruise business is a long-term business and
requires vision, development and investment in
order to be successful.
As some of the cruise lines pointed out, there is a need for new port developments given the lack of
suitable destinations in the region and the potential to provide new itinerary options. Smaller cruise
lines that want to offer a more intimate and “up and close” destination experience and focus on
nature can be swayed to visit the port, but homework will be needed to identify who the cruise line
targets are in order to engage in promotion activities.
In addition, and as per Table 7, passengers spend on average 42% of their money when going ashore
on tours, and as we have identified, there are no major tour attractions or programs in the region
that would bring this kind of participation and revenue. In actual fact, Hvide Sande seems to fall in
the category of a “nature” destination that could appeal to low passenger spending expedition
cruise ships.

Cruise Feasibility Report for Hvide Sande – PG. 58
Therefore, no cruise line should be contacted unless you are 100% certain that you will be able to
provide all the services required for that specific cruise line and that you will be able to meet or
exceed their expectations. Doing otherwise would set back any future opportunities.
This will require time and any work done now will only bring results in 2 to 3 years when a cruise call
may eventually materialize. Still, cruise tourism is not a static business and cruise lines have the
ability to move their business around and move ships elsewhere if their yields are down in a specific
region.
Working and cooperating with the tour operators that are based in Copenhagen and that sell and
operate the tours will be crucial in order to promote any small port destination in their meetings with
cruise line tour executives. The same applies to the port agents (also based in Copenhagen)
exploring their relationship with the cruise line marine executives. This is always a challenge as most
of these professionals see smaller destinations as costly to operate.
As we mentioned previously - while the numbers of passengers, sailings and ships being built
continue to grow, many cruise regions are becoming saturated. Therefore, cruise lines will look more
and more for new destinations and regions to explore and offer to their clientele.
If Hvide Sande despite the findings of this study wishes to pursue cruise tourism, it would be wise to
approach Esbjerg, Rømø and maybe some of the smaller German islands in the region, or even Hirtshals to
get together and discuss a possible collaboration and agree on a strategy to attract cruise lines to the
region. This would have to be a well-coordinated and planned project and the immediate focus could be
on:
1. Identifying the potential destinations to take part in this initiative;
2. Identifying challenges and advantages of each destination focusing on:
i. Port infrastructure
ii. Attractions and tour options
iii. Options for independent guests
iv. Special and unique features
v. Service quality and quantity (buses, guides, etc.);
3. Researching cruise lines that are either sailing in the region, are a possible fit in the region’s ports
(berth or tender) or that could be interested in exploring the region;
4. Agreeing on who does what in the network and explore the existing relationships with the local
service providers normally associated with cruise;
5. Devising a long term cruise business strategy, promotional plan and cruise budget for the region;
6. Creating and proposing cruise itineraries that include the chosen destinations and that are tailor-
made for each of the cruise lines identified under 3;
7. Involving ports, cities, local stakeholders, and most importantly, port agents and tour operators
that are regularly in touch with cruise lines and can be spokespersons for the region and,

Cruise Feasibility Report for Hvide Sande – PG. 59
8. Creating a recognized brand and in the process make the region more attractive and known to the
international markets.
This would also help in reducing any promotion and marketing costs that would be shared by the
participating destinations.
Hvide Sande is a coastal destination. Coastal European destinations were in the past mainly considered as
“one-off” port of call and included in re-positioning itineraries. During the last 5 years, this has changed
and two examples of what destinations have done to change their fate are shown in Annex 9.
In case Hvide Sande or any other similar small Danish port should decide to go ahead and pursue cruise
tourism, it would make sense to consider initiating discussions with Cruise Copenhagen Network (a
national association that promotes not only Copenhagen but an additional 9 Danish cruise destinations)
http://www.cruisecopenhagen.com/ and possibly take advantage of their great promotional and
educational platform and initiatives.
But Hvide Sande or other similar smaller ports will need to look at the map and see who the closest
destinations are, and how a working relation can be established. This will be crucial to ensure success. A
destination needs other destinations to create itineraries and cannot exist on its own.

Cruise Feasibility Report for Hvide Sande – PG. 60
10. General guidelines for ports to engage on cruise business
While the numbers of passengers, sailings and ships being build continue to grow, many cruise
regions are becoming saturated. Therefore, cruise lines will look more and more for new
destinations and regions to explore and offer to their clientele.
While each region and destination is different and unique in its landscapes, cultures, characteristics,
attractions and port facilities, the following factors that determine why cruise lines visit a destination
remain the same:
1. Consumer demand – passengers tell the cruise lines and travel agents which regions and
destinations they want to visit and cruise lines plan their itineraries accordingly;
2. Revenue opportunities – cruise lines analyze the choice of shore side programs and tour
options to be offered to their guests and how much revenue it can produce on each specific
destination;
3. ROI - costs vs. revenue – Cruise lines look at the costs of operating a vessel when visiting a
destination and compare it to the revenue that they are able to create. At the end of the day,
a cruise line wants to make sure that they actually make a profit when visiting a destination;
4. Visitor satisfaction levels – if cruise passengers are happy they will rate the destination high
and the cruise lines will most likely visit again. If the ratings are low, they will probably not
return;
5. Safety and security – Operations (either at berth or anchor) need to be conducted safely, the
port needs to be ISPS certified, there needs to be a safety plan for the port area, the city and
port need to provide a safe environment for the cruise passengers;
6. Fit in greater itinerary – a destination does not exist on its own in the itinerary. Cruise lines
look for destinations that complement each other in an itinerary and that are able to sell well
to the consumer.
Based on the above and discussions with cruise line executives, we have prepared a list of key items
that need to be in place for a destination to pursue cruise tourism:
Adequate port infrastructures to receive cruise ship vessels given the current and future
construction trends;
Ample variety of tour and program offers for cruise lines from different sectors to chose
from;

Cruise Feasibility Report for Hvide Sande – PG. 61
It is an advantage for the destination to have a famous / well-known attraction that is already
recognized internationally. This could apply to the city and its brand name;
Venues and attractions located in proximity of the port and not further than 1 hour’s drive
away;
A good number of professional guides conversed in several languages (depending on the
markets to attract);
Good quantity and quality of the transportation offer, ranging from big buses to mini vans,
mini buses, private vehicles and taxis;
Preferably the destination should be located in a region neighboring other cruise destinations
or with easy navigation access to assure better positioning on possible cruise itineraries;
Options in the city and the region for independent guests that can include shopping, food &
beverages, museums, historical sites, shows and festivals and other options;
Good cooperation between the port, the city politicians, tourism organizations, chamber of
commerce and local stakeholders; and
The acceptance of cruise tourism by the city inhabitants.
Please note that the size of port infrastructures, the number of guides and transportation needed
depends if the destination wants to pursue big ships, medium ships or smaller ships and also on the
type of cruising: luxury, premium, standard or expedition.
If a pre-feasibility study like the present study for Hvide Sande as a case proves that there is scope
for cruise tourism, one of the most important steps that an aspiring cruise destination should do first
is to conduct a more specific market study to determine its real chances of becoming a cruise
destination and to base any future initiatives and investments on.
This will also form the basis for a cruise business strategy to be agreed by all the local stakeholders
that needs to be in place for any destination to have better chances to be successful.

Port and Destination Development
Consult DC
Gothersgade 11, 2tv – 1123 Copenhagen K – Denmark Tel: (+45) 2221 0131 [email protected] www.consult-dc.dk
Annex 1
References and glossary
Several definitions, cruise industry terms and acronyms used throughout this report may not be familiar to the reader. We define several of these terms in the following section.1
1) Anchorage. Location where a vessel may anchor. In destinations where docks are not present to accommodate vessel operations, anchorages are used and passengers are shuttled to/from the cruise vessel to a landside location using a small boat (tender). Anchorages are generally only used in ports-‐of-‐call.
2) Beam. The width of the cruise vessel at its widest part. Panamax Vessels refer to vessels with beams than can transit the Panama Canal (beam is equal to 36m or less). Post-‐Panamax Vessels and Super-‐post Panamax have beams that exceed the width of the Panama Canal, or greater than 36m.
3) Bed (berth)-‐nights. A typical cruise industry form of capacity measurement representing the number of lower berths (a bed on a cruise vessel, with the aggregate total generally determining the vessel’s normal passenger capacity) times nights of operation in a region.
4) Berth. (1) A bed, generally attached to the deck and/or bulkhead onboard a vessel. (2) An anchorage or dock space for a vessel in port.
5) Bunkers. Marine fuel used for propulsion.
6) CLIA. Cruise Line International Association
7) Dockage. Fees levied by a port or destination for the right to dock a vessel.
8) Draft. The depth of water required by a vessel to float; the measurement in meters of the extent to which the vessel projects below the surface of the water.
9) ECA -‐ Emission Control Area. The International Maritime Organization (IMO) has officially designated waters off the North American coasts as an ECA in following an agreement with the IMO and incorporation into European law. The Baltic Sea became the first fully implemented SOx Emission Control Area in August 2006. One year later, in August 2007 the North Sea and English Channel became the second SECA. In March 2010 IMO’s Marine Environmental Protection Committee adopted a proposal from the USA and Canada for an ECA extending 200 nautical miles from both east and west coasts and around the islands of Hawaii. The ECA is not only for SOx emissions, but also particulate matter and NOx. It will become fully implemented on or after August 2012. In September 2010 another US proposal for an ECA around Puerto Rico and the US Virgin islands was

Port and Destination Development
Consult DC
Gothersgade 11, 2tv – 1123 Copenhagen K – Denmark Tel: (+45) 2221 0131 [email protected] www.consult-dc.dk
discussed at IMO and seems set to enter into force in 2014. Further ECAs seem likely to be proposed for Norway, Japan and the Mediterranean.
10) Ferry. Term usually applied to a vessel transporting passengers and vehicles from point to point. The key difference between these operations and conventional cruises is that ferry operations have as their primary business focus offering transportation services, not a travel and leisure experience.
11) Gross Tonnage (GT). A measure of a vessel’s enclosed volume. This term has emerged as the standard measure of communicating a vessel’s size. A Mega-‐vessel generally refers to a vessel of 70,000 GT or larger.
12) Independent guests. Guests not participating on ship excursions and going out of the ship on their own.
13) IMO. International Maritime Organization
14) Itinerary. Ports visited on a given cruise. Two itinerary types are generally observed. Open-‐jaw (OJ) itineraries refer to those deployments where the cruise begins at one homeport and end at another. Round Trip or Closed-‐jaw itineraries—the more common type observed—begins and end from the same homeport.
15) Length Overall (LOA). Total length of a cruise vessel, including any incidental structure that may extend this dimension.
16) Low Sulfur fuel. Ships use of low sulfur fuel, typically with a sulfur content of 1.5%, is the primary abatement approach considered by the current international and regional legislation. Fuel with sulfur content of 1.5% or lower is currently only 1% of all the fuel used by ships around the world. The availability and price of low sulfur fuel is a source of much debate and discussion in both the shipping and oil industries ahead of the implementation of the 2015 legislation.
17) Lower Berth Capacity. The number of beds of standard height on a cruise vessel. The number of lower berths determines the vessel’s normal passenger capacity. Maximum Passenger Capacity refers to the total number of passengers that can be accommodated on the cruise vessel in lower berths and other flexible berths (also referred to as upper berths).
18) Marpol -‐ International Convention for the Prevention of Pollution from Ships
19) Need. A condition or situation in which something is required or wanted. Necessity; obligation. To be necessary.2
20) Operational costs. They are directly related to operating the vessel in the different ports. These can be port fees, fuel costs, ground handler and agent’s fees, etc.
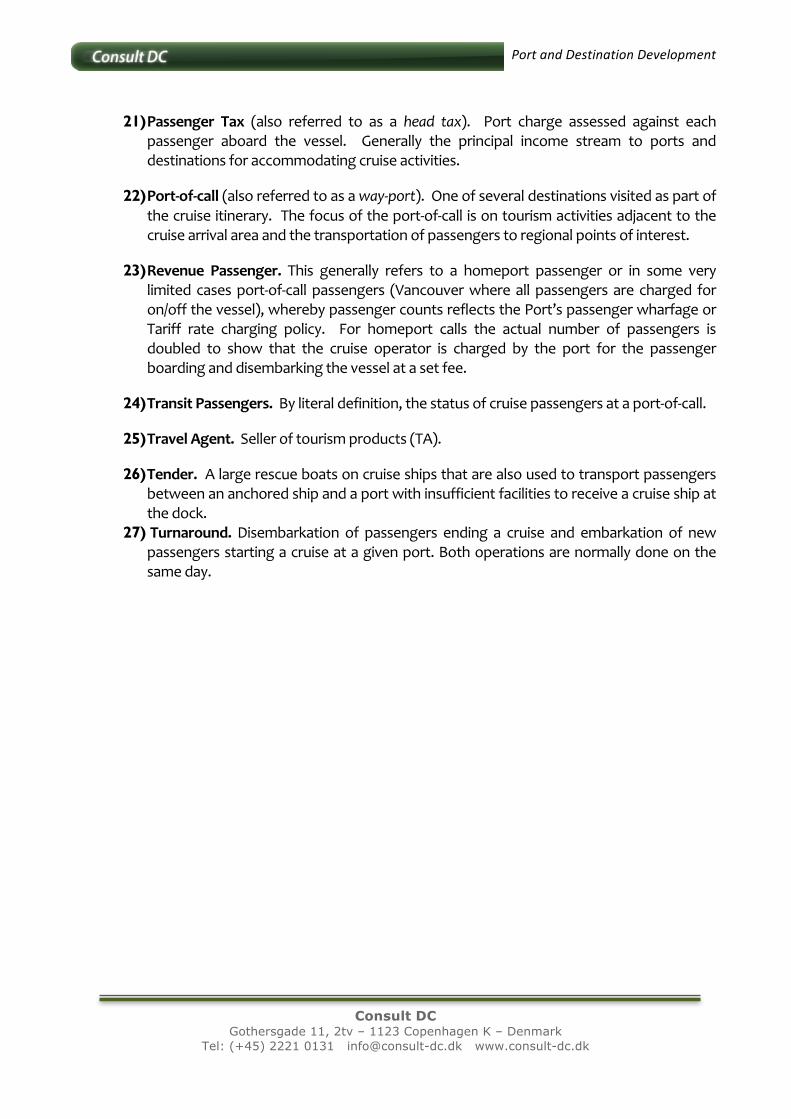
Port and Destination Development
Consult DC
Gothersgade 11, 2tv – 1123 Copenhagen K – Denmark Tel: (+45) 2221 0131 [email protected] www.consult-dc.dk
21) Passenger Tax (also referred to as a head tax). Port charge assessed against each passenger aboard the vessel. Generally the principal income stream to ports and destinations for accommodating cruise activities.
22) Port-‐of-‐call (also referred to as a way-‐port). One of several destinations visited as part of the cruise itinerary. The focus of the port-‐of-‐call is on tourism activities adjacent to the cruise arrival area and the transportation of passengers to regional points of interest.
23) Revenue Passenger. This generally refers to a homeport passenger or in some very limited cases port-‐of-‐call passengers (Vancouver where all passengers are charged for on/off the vessel), whereby passenger counts reflects the Port’s passenger wharfage or Tariff rate charging policy. For homeport calls the actual number of passengers is doubled to show that the cruise operator is charged by the port for the passenger boarding and disembarking the vessel at a set fee.
24) Transit Passengers. By literal definition, the status of cruise passengers at a port-‐of-‐call.
25) Travel Agent. Seller of tourism products (TA).
26) Tender. A large rescue boats on cruise ships that are also used to transport passengers between an anchored ship and a port with insufficient facilities to receive a cruise ship at the dock.
27) Turnaround. Disembarkation of passengers ending a cruise and embarkation of new passengers starting a cruise at a given port. Both operations are normally done on the same day.

Port and Destination Development
Consult DC
Gothersgade 11, 2tv – 1123 Copenhagen K – Denmark Tel: (+45) 2221 0131 [email protected] www.consult-dc.dk
Annex 2
Cruise vessels on order worldwide, as of April 2012
Cruise vessels on order worldwide, as of April 2012
Source: Cruise Community and B&A
Cruise Operator Vessel Name Gross Tonnage Length Overall (M est.)
Lower Berth Capacity
Cost
(US Millions)
2012
AIDA Cruises AIDAmar 71,000 253 2174 $565
Carnival Cruises Carnival Breeze 130,000 306 3690 $738
Celebrity Cruises Celebrity Reflection 122,000 315 2850 $798
Costa Cruises Costa Fascinosa 114,200 293 3012 $726
MSC Cruises MSC Divina 140,000 335 3502 $742
Disney Cruise Line Disney Fantasy 124,000 339 2500 $899
Oceania Cruises Riviera 65,000 248 1260 $530
2013
AIDA Cruises (DEL.) AIDAstella 71,300 253 2192 $417
NCL Nor. Breakaway 143,500 324 4000 $840
Princess Cruises (DEL.) Royal Princess 141,000 325 3600 $735
MSC Cruises MSC Preziosa 140,000 335 3500 $742
Hapag-‐Lloyd Europa 2 39,500 205 516 $360
Compagnie du Ponant Le Soleal 10,700 142 264 $134
2014
Princess Cruises Regal Princess 141,000 325 3600 $735
NCL Norwegian Getaway 143,500 324 4000 $840
Costa Costa Diadema 132,500 306 3700 $788
TUI Cruises Mein Schiff 3 97,000 295 2500 $515
RCI Quantum of the Seas 167,000 350 4100 $1032
2015
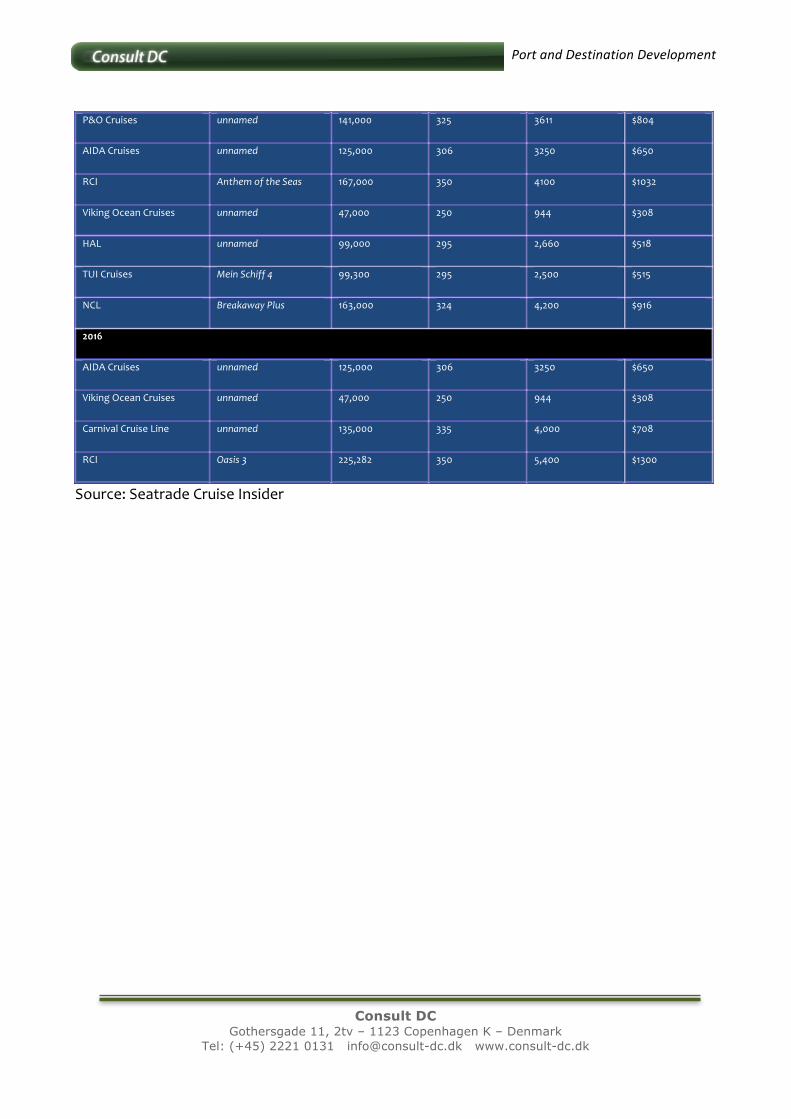
Port and Destination Development
Consult DC
Gothersgade 11, 2tv – 1123 Copenhagen K – Denmark Tel: (+45) 2221 0131 [email protected] www.consult-dc.dk
P&O Cruises unnamed 141,000 325 3611 $804
AIDA Cruises unnamed 125,000 306 3250 $650
RCI Anthem of the Seas 167,000 350 4100 $1032
Viking Ocean Cruises unnamed 47,000 250 944 $308
HAL unnamed 99,000 295 2,660 $518
TUI Cruises Mein Schiff 4 99,300 295 2,500 $515
NCL Breakaway Plus 163,000 324 4,200 $916
2016
AIDA Cruises unnamed 125,000 306 3250 $650
Viking Ocean Cruises unnamed 47,000 250 944 $308
Carnival Cruise Line unnamed 135,000 335 4,000 $708
RCI Oasis 3 225,282 350 5,400 $1300
Source: Seatrade Cruise Insider
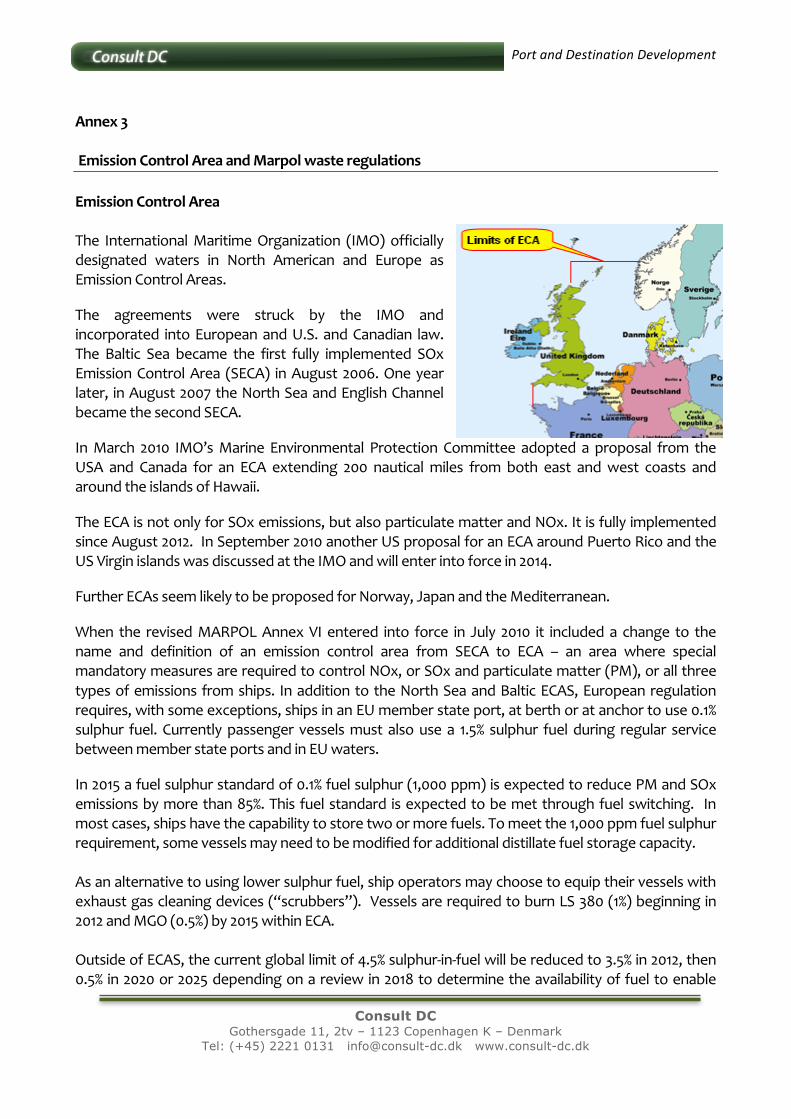
Port and Destination Development
Consult DC
Gothersgade 11, 2tv – 1123 Copenhagen K – Denmark Tel: (+45) 2221 0131 [email protected] www.consult-dc.dk
Annex 3 Emission Control Area and Marpol waste regulations Emission Control Area
The International Maritime Organization (IMO) officially designated waters in North American and Europe as Emission Control Areas.
The agreements were struck by the IMO and incorporated into European and U.S. and Canadian law. The Baltic Sea became the first fully implemented SOx Emission Control Area (SECA) in August 2006. One year later, in August 2007 the North Sea and English Channel became the second SECA.
In March 2010 IMO’s Marine Environmental Protection Committee adopted a proposal from the USA and Canada for an ECA extending 200 nautical miles from both east and west coasts and around the islands of Hawaii.
The ECA is not only for SOx emissions, but also particulate matter and NOx. It is fully implemented since August 2012. In September 2010 another US proposal for an ECA around Puerto Rico and the US Virgin islands was discussed at the IMO and will enter into force in 2014.
Further ECAs seem likely to be proposed for Norway, Japan and the Mediterranean.
When the revised MARPOL Annex VI entered into force in July 2010 it included a change to the name and definition of an emission control area from SECA to ECA – an area where special mandatory measures are required to control NOx, or SOx and particulate matter (PM), or all three types of emissions from ships. In addition to the North Sea and Baltic ECAS, European regulation requires, with some exceptions, ships in an EU member state port, at berth or at anchor to use 0.1% sulphur fuel. Currently passenger vessels must also use a 1.5% sulphur fuel during regular service between member state ports and in EU waters.
In 2015 a fuel sulphur standard of 0.1% fuel sulphur (1,000 ppm) is expected to reduce PM and SOx emissions by more than 85%. This fuel standard is expected to be met through fuel switching. In most cases, ships have the capability to store two or more fuels. To meet the 1,000 ppm fuel sulphur requirement, some vessels may need to be modified for additional distillate fuel storage capacity. As an alternative to using lower sulphur fuel, ship operators may choose to equip their vessels with exhaust gas cleaning devices (“scrubbers”). Vessels are required to burn LS 380 (1%) beginning in 2012 and MGO (0.5%) by 2015 within ECA. Outside of ECAS, the current global limit of 4.5% sulphur-‐in-‐fuel will be reduced to 3.5% in 2012, then 0.5% in 2020 or 2025 depending on a review in 2018 to determine the availability of fuel to enable

Port and Destination Development
Consult DC
Gothersgade 11, 2tv – 1123 Copenhagen K – Denmark Tel: (+45) 2221 0131 [email protected] www.consult-dc.dk
implementation of this standard. It is currently estimated that the USD cost is between $9 and $21 per passenger per day for fuel Based upon cruise line feedback and our assessment for the Northern European cruise region there will be the following impacts due to ECAS:
• Cruise lines may opt to remove one or more ports out of given itineraries and shorten the time spent on port in order to reduce the speed of sailing and fuel consumption;
• It will likely shorten the shoulder seasonality of the region and reduce any repositioning’s within the ECA areas; and,
• UK based companies operating older vessels estimater a drop 0f 40% of sailings in the region;
• It may also drive some new itinerary developments with selections of cruises outside of the ECA when sailing from and to key regions.
However, until the scope of the cost of fuel, compliance and the availability of fuel is fully known, the implications will not be fully understood. Marpol waste regulations On July 15, 2011 the IMO through the Marine Environment Protection Committee (MEPC) 62nd session approved the new regulations under Annex IV of the MARPOL Convention and designated the Baltic Sea as a Special Area with respect to pollution by sewage, whereby any discharge of sewage into the sea from a passenger ship will be prohibited unless the ship uses an approved sewage treatment plant capable to reduce nutrients according to the established concentrations. Alternatively, untreated sewage could be delivered to a port reception facility (PRF).
Helcom (Helsinki Commission – Baltic Marine Environment Protection Commission) further states that since systems do not yet exist to treat sewage onboard to the standards required by the IMO it is highly uncertain if technology will be capable of operating to the required standard in a compliance regime in 2016. Until the 2014 review of available technology has been completed, ports should proceed on the basis that cruise ships would need to discharge all sewage ashore.
According to CLIA Europe this implies that the port should provide a direct shore side connection and be able to provide at least 200 m3 per hour of discharge rate. Larger ships will require 280 to 300 m3. This will need to be available across all berths and 24/7. The port will also need to be able to receive 270 m3 of bio residuals per ships. These services will need to be provided under no-‐special-‐fee arrangements.
At the time of this report, CLIA Europe and Helcom are still evaluating the possible scenarios to offer further recommendations to IMO regarding this important matter for the region, as it seems to be highly unlikely at this stage that cruise ships develop and implement suitable technology aboard all vessels sailing in the Baltic or that the ports are all able to deliver the facilities to accommodate the required services by 2016.
Port and Destination Development
Consult DC
Gothersgade 11, 2tv – 1123 Copenhagen K – Denmark Tel: (+45) 2221 0131 [email protected] www.consult-dc.dk
While this may or may not immediately affect the ports outside the Baltic Sea region such as Hvide Sande, the future consequences still need to be determined. As with The Eca’s it seems that sooner or later more regions are adopting common maritime environmental protection regulations and common standards.

Baltic passenger numbers, 2012 and est. 2013
Name of port 2000 2001 2002 2003 2004 2005 2006 2007 2008 2009 2010 2011 2012 est. 2013Arendal - - - - - - - - - - - - 496 2.000 Copenhagen 166.000 185.000 173.000 259.000 362.000 428.000 458.000 509.000 560.000 675.000 662.000 819.000 840.000 810.000 Elsinore 400 - 169 1.042 4.519 3.245 3.322 1.800 - 450 2.600 5.500 2.560 2.900 Gdansk 3.643 3.486 3.609 3.367 7.359 8.353 9.703 12.193 13.276 16.753 8.378 6.787 8.294 10.000 Gdynia 57.610 56.460 26.666 58.411 72.977 88.723 94.135 89.088 123.521 134.884 125.005 78.418 108.628 105.000 Gothenburg 3.400 3.600 2.440 5.500 14.167 12.700 11.272 11.404 12.445 35.598 51.730 62.154 83.000 50.000 Helsingborg 6.266 8.422 2.678 3.205 3.062 5.984 8.311 7.350 3.900 25.987 15.648 7.600 11.300 10.400 Helsinki 140.000 148.000 127.000 161.000 195.000 240.000 270.000 260.000 360.000 360.000 342.000 385.000 368.000 400.000 Kalmar 4.100 14.000 13.800 3.700 1.600 2.134 2.717 1.007 1.100 1.158 325 - 1.235 2.100 Karlskrona - - 1.160 1.270 1.095 1.350 2.460 3.100 5.778 1.250 1.000 680 850 2.230 Kemi 600 - - - 600 1.750 2.000 2.020 2.000 2.145 1.773 2.126 3.145 1.860 Kiel 48.033 51.128 65.940 93.172 128.604 131.784 154.250 172.937 222.130 291.388 341.391 377.205 348.180 380.000 Klaipeda 4.613 11.886 7.766 9.115 14.250 23.701 24.914 35.680 32.820 33.300 35.201 21.478 26.769 30.000 Kotka - - - - - - - - - 302 380 - 542 -Kristiansand 14.000 20.000 21.500 16.600 35.000 43.000 38.000 52.000 22.000 24.000 31.700 50.000 70.000 75.000 Malmö - - - - - 523 1.350 565 500 625 850 777 - 34.000 Mariehamn 1.678 2.461 324 5.282 6.027 3.764 3.366 4.934 2.174 2.426 5.312 3.500 6.742 5.883 Oslo 108.813 92.726 86.408 120.044 145.726 183.725 206.234 197.173 239.991 269.763 261.000 312.859 303.486 305.000 Riga - 22.307 54.040 89.949 62.306 48.028 40.843 65.438 50.077 69.413 58.248 63.527 83.000 80.000 Rostock 52.622 69.499 77.656 95.092 92.000 124.500 173.500 133.700 171.500 161.800 214.800 257.300 385.800 400.000 Rønne 12.000 14.250 12.200 10.800 17.000 13.800 16.311 13.046 16.921 21.864 14.894 18.095 31.717 40.000 Saaremaa - - - - - - 4.909 2.580 1.974 1.030 683 5.655 1.120 8.500 Sassnitz 3.047 3.356 2.255 1.833 780 6.200 19.099 3.437 23.331 25.945 9.384 1.707 3.814 6.100 St. Petersburg 149.252 163.895 142.647 204.405 252.553 299.703 305.835 335.502 394.827 425.665 427.500 472.000 452.000 500.000 Stockholm 157.000 170.000 135.000 202.000 210.000 250.000 287.000 281.000 365.000 447.000 415.000 452.000 470.000 500.000 Tallinn 109.511 134.176 127.000 204.151 205.578 295.424 305.026 292.158 375.578 415.575 390.000 437.517 440.504 490.000 Turku 5.654 5.327 7.398 6.338 12.132 9.700 3.273 2.372 2.996 2.736 2.000 5.456 2.600 2.000 Visby 48.339 33.657 78.249 102.418 68.631 113.387 77.578 62.263 64.324 32.874 52.067 42.819 54.158 55.000 Aalborg 400 800 - - 750 410 2.550 - 1.813 3.130 386 4.596 6.451 5.900 Århus 12.868 13.279 15.880 24.978 17.136 30.514 26.317 18.043 25.536 22.815 6.325 39.472 39.436 37.719 Total 1.109.849 1.227.715 1.184.785 1.682.672 1.930.852 2.370.402 2.552.275 2.569.790 3.095.512 3.504.876 3.477.580 3.933.228 4.153.331 4.349.592 Yearly Growth 10,6% -3,5% 42,0% 14,7% 22,8% 7,7% 0,7% 20,5% 13,2% -0,8% 13,1% 5,6% 4,7%
Average Annual Growth Rate 00-12: 11,6% p.a.(expected) Average Annual Growth Rate 00-13: 11,1% p.a.

Baltic call numbers, 2012 and est. 2013
Name of port 2000 2001 2002 2003 2004 2005 2006 2007 2008 2009 2010 2011 2012 est. 2013Arendal 4 3 3 1 6 4 2 1 1 6 1 - 3 5Copenhagen 193 215 176 246 264 282 280 289 301 334 307 368 372 350Elsinore 1 - 3 3 9 7 7 3 - 2 1 5 2 2Gdansk 14 17 14 7 28 32 29 39 36 40 26 21 29 31Gdynia 72 74 53 95 82 94 89 87 89 96 85 56 69 65Gothenburg 9 13 5 13 18 20 18 23 18 34 41 52 69 36Helsingborg 6 9 3 18 18 5 6 3 4 13 6 9 5 7Helsinki 185 191 168 191 208 247 259 238 269 263 247 258 265 284Kalmar 7 12 17 6 5 4 6 3 4 2 2 - 3 4Karlskrona - - 2 2 2 2 3 4 9 3 2 1 2 10Kemi 1 - - - 1 3 4 3 3 4 3 4 3 2Kiel 47 72 74 80 95 93 93 116 125 117 136 120 137 127Klaipeda 15 22 23 28 49 59 48 65 46 50 45 36 43 44Kotka - - - - - - - - - 1 1 - 1 -Kristiansand 19 34 22 15 24 33 23 27 17 16 20 32 51 56Malmö - - - - - 2 4 2 2 2 2 2 - 10Mariehamn 4 5 1 21 30 28 12 19 9 10 19 18 20 21Oslo 112 115 88 109 114 144 156 138 148 149 150 173 166 161Riga 38 41 94 126 105 83 58 88 76 88 63 69 92 72Rostock 47 64 62 76 85 97 138 92 116 114 114 158 181 197Rønne 27 34 28 34 47 33 34 29 31 36 24 25 44 37Saaremaa - - - - - - 7 6 6 5 2 8 3 15Sassnitz 12 15 11 11 3 8 20 7 13 19 10 3 7 8St. Petersburg 238 221 212 275 303 364 302 292 311 321 304 309 307 325Stockholm 180 191 175 214 208 259 260 255 265 293 261 263 274 289Tallinn 181 175 165 236 232 324 289 268 298 305 279 293 294 330Turku 5 7 9 9 18 17 6 9 9 8 6 7 4 3Visby 100 61 107 118 97 150 104 80 72 53 66 53 62 64Aalborg 1 1 - - 3 2 3 - 3 3 2 4 7 10Århus 18 13 16 23 15 20 23 16 21 14 3 18 20 13Total 1.532 1.602 1.528 1.956 2.063 2.412 2.281 2.201 2.301 2.378 2.227 2.365 2.532 2.573Yearly Growth 4,6% -4,6% 28,0% 5,5% 16,9% -5,4% -3,5% 4,5% 3,3% -6,3% 6,2% 7,1% 1,6%
Average Annual Growth Rate 00-12: 4,3% p.a.(expected) Average Annual Growth Rate 00-13: 4,1% p.a.
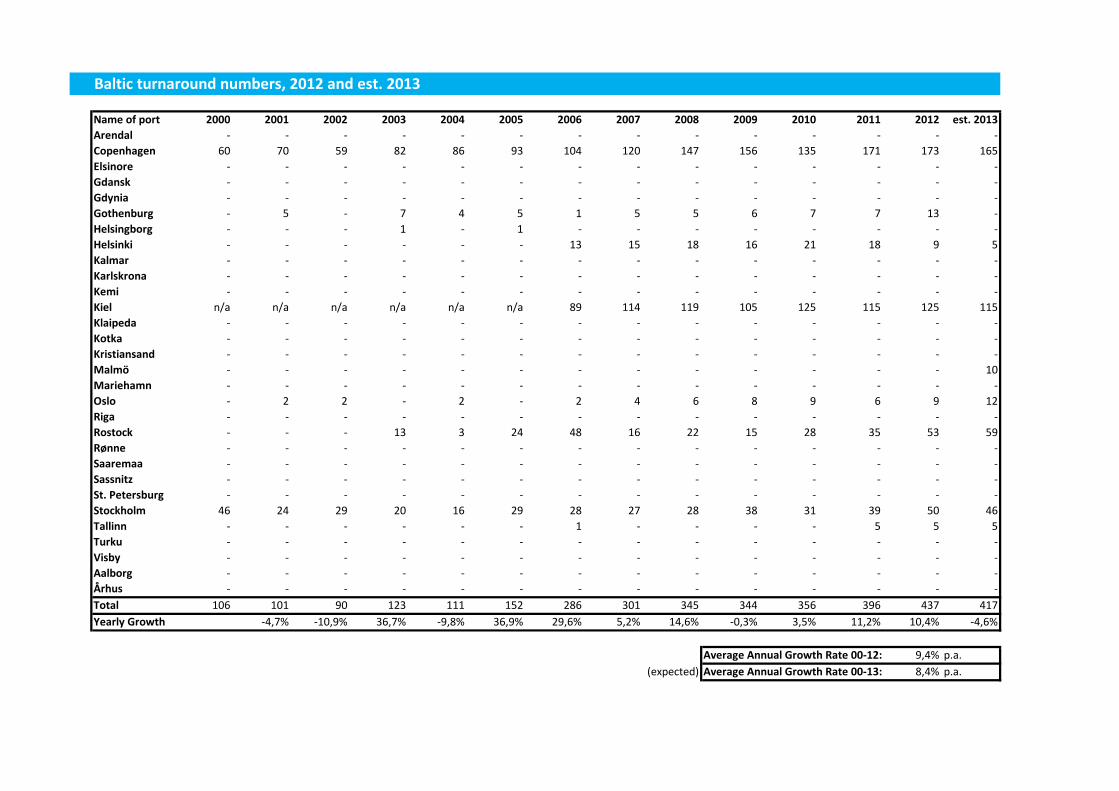
Baltic turnaround numbers, 2012 and est. 2013
Name of port 2000 2001 2002 2003 2004 2005 2006 2007 2008 2009 2010 2011 2012 est. 2013Arendal - - - - - - - - - - - - - -Copenhagen 60 70 59 82 86 93 104 120 147 156 135 171 173 165Elsinore - - - - - - - - - - - - - -Gdansk - - - - - - - - - - - - - -Gdynia - - - - - - - - - - - - - -Gothenburg - 5 - 7 4 5 1 5 5 6 7 7 13 -Helsingborg - - - 1 - 1 - - - - - - - -Helsinki - - - - - - 13 15 18 16 21 18 9 5Kalmar - - - - - - - - - - - - - -Karlskrona - - - - - - - - - - - - - -Kemi - - - - - - - - - - - - - -Kiel n/a n/a n/a n/a n/a n/a 89 114 119 105 125 115 125 115Klaipeda - - - - - - - - - - - - - -Kotka - - - - - - - - - - - - - -Kristiansand - - - - - - - - - - - - - -Malmö - - - - - - - - - - - - - 10Mariehamn - - - - - - - - - - - - - -Oslo - 2 2 - 2 - 2 4 6 8 9 6 9 12Riga - - - - - - - - - - - - - -Rostock - - - 13 3 24 48 16 22 15 28 35 53 59Rønne - - - - - - - - - - - - - -Saaremaa - - - - - - - - - - - - - -Sassnitz - - - - - - - - - - - - - -St. Petersburg - - - - - - - - - - - - - -Stockholm 46 24 29 20 16 29 28 27 28 38 31 39 50 46Tallinn - - - - - - 1 - - - - 5 5 5Turku - - - - - - - - - - - - - -Visby - - - - - - - - - - - - - -Aalborg - - - - - - - - - - - - - -Århus - - - - - - - - - - - - - -Total 106 101 90 123 111 152 286 301 345 344 356 396 437 417Yearly Growth -4,7% -10,9% 36,7% -9,8% 36,9% 29,6% 5,2% 14,6% -0,3% 3,5% 11,2% 10,4% -4,6%
Average Annual Growth Rate 00-12: 9,4% p.a.(expected) Average Annual Growth Rate 00-13: 8,4% p.a.

Port and Destination Development
Consult DC
Gothersgade 11, 2tv – 1123 Copenhagen K – Denmark Tel: (+45) 2221 0131 [email protected] www.consult-dc.dk
Annex 5
List of worldwide cruise vessels that fit in the current harbor of Hvide Sande
Source: Consult DC
YoB Operator Name GT LOA Beam Dft Pax (LB) Crew 2001 Celebrity Xpeditions Celebrity Xpedition 2842 88,5 14,8 3,5 92 56 1989 Clipper Cruise Line Clipper Odyssey 5218 102,9 15,4 4,3 120 70 2000 Clipper Stad Amsterdam Stad Amsterdam 723 76,2 10,52 4,78 28 30 1974 Compagnie du Ponant Le Diamant 8282 124,7 16 4,57 226 130 1998 Compagnie du Ponant Le Levant 3504 100,26 13,9 3,5 90 49 1991 Compagnie du Ponant Le Ponant 1489 88 12 4 64 32 1980 FTI Berlin FTI Berlin 9570 139,3 17,52 4,86 352 170 1972 GAP Adventures Expedition 6172 105,2 18,9 4,4 116 0 1990 Hapag-Lloyd Bremen 6752 111,5 16,98 4,78 164 80 1991 Hapag-Lloyd Hanseatic 8378 122,83 17,98 4,7 184 122 1964 Hebridean Island Cruises Hebridean Princess 2112 71,6 14 3 48 35 1983 Heritage Expeditions Akademik Shokalskiy 1764 72 12,6 4,5 37 20 1983 Heritage Expeditions Spirit of Enderby 1764 71,6 12,8 4,5 48 32 2007 Hurtigruten Fram 12000 110 20 5 268 150 1956 Hurtigruten Nordstjernen 2193 80,77 12,5 4,9 156 40 1982 Lindblad Expeditions National Geographic Explorer 6167 108,6 16,5 4,6 148 50 1976 Murmansk Shipping Klaudiya Yelanskaya 3941 100,01 16,24 4,65 104 80 1992 n.k Quest 1211 49,65 11 3,5 52 18 1960 n.k Serenissima 2632 87,48 13,26 4,9 107 48 1991 Noble Caledonia Caledonian Sky 4280 90,4 15,3 3,9 80 65 1992 Noble Caledonia Island Sky 4280 90,4 15,3 3,9 118 66 1991 Oceanwide Expeditions Aleksey Maryshev 2000 64,9 12,92 3,6 46 40 1990 Oceanwide Expeditions Grigoriy Mikheev 2000 64,9 12,8 3,6 46 20 1976 Oceanwide Expeditions Plancius 0 89 14,45 5 106 43 1983 Oceanwide Expeditions Professor Molchanov 2142 71,6 12,8 4,5 52 27 1983 Oceanwide Expeditions Professor Multanovskiy 1832 71,6 12,8 4,5 52 27
0 Oceanwide Expeditions Rembrandt van Rijn 0 56 7 2,5 34 0 2003 Orion Expedition Cruises Orion 4050 102,72 14,25 3,72 106 71 2009 Pearl Seas Cruises Pearl Mist 8700 100,5 17 3,1 214 60 1989 plantours & partner Vistamar 7498 121 16,82 4,55 300 110 1976 Quark Expeditions Clipper Adventurer 4364 101,01 16,3 4,65 122 79 1992 Quark Expeditions Ocean Nova 2118 73 11 3,7 82 34 1992 Quark Expeditions Sarfak Ittuk 1127 49,65 11 3,4 62 15 1991 Quark Expeditions Sea Spirit 4280 90,4 15,3 3,9 114 65 1988 Seabourn Cruise Seabourn Pride 9975 133,8 19,2 5 208 164 1989 Seabourn Cruise Seabourn Spirit 9975 133,8 19,2 5 208 164 1984 SeaDream Yacht SeaDream I 4253 104,8 14,6 4 118 89 1985 SeaDream Yacht SeaDream II 4253 104,8 14,6 4 118 89 1989 Silversea Silver Explorer 6072 108,11 15,6 4,38 132 106 1989 Star Cruises Megastar Aries 2928 82,2 14 3,4 82 59 1989 Star Cruises Megastar Taurus 2928 82,2 14 3,4 82 59 1970 Terra Magica Travel Monet 1395 64,01 9,14 3,5 60 30 1991 Travel Dynamics International Corinthian II 4280 90,4 15,3 3,9 114 65 1991 Travel Dynamics International Orion II 4077 88,2 15,3 3,8 100 60 1972 Tropicana Cruises Adriana 4490 103,7 14 4,5 250 135 1988 Windstar Cruises Wind Spirit 5350 134,2 15,8 4,1 148 91 1986 Windstar Cruises Wind Star 5350 134,2 15,8 4,1 148 91 1989 Zegrahm Expeditions Clipper Odyssey 5218 102,9 15,4 4,3 128 52

Port 2005 2006 2007 2008 2009 2010 2011 2012 2013Copenhagen -‐CMP Copenhagen Malmö Port 2005 2006 2007 2008 2009 2010 2011 2012 2013Calls 282 280 289 301 334 307 368 372 349PAX 428.000 458.000 509.000 560.000 675.000 662.000 819.000 840.000 800.000
max LOA unlimited Draft 9,7mtAalborg -‐ Port of Aalborg 2005 2006 2007 2008 2009 2010 2011 2012 2013Calls 2 3 0 3 4 2 4 10 10PAX 410 2.550 -‐ 1.813 4.350 386 4.600 6.522 6.000
max LOA 250mt Draft 9mtAarhus -‐ Port of Aarhus 2005 2006 2007 2008 2009 2010 2011 2012 2013Calls 16 21 14 5 18 20 13PAX 18.043 25.536 22.185 6.325 39.472 39.436 38.225
max LOA 400mt Draft 13mtElsinore -‐ Port of Elsinore 2005 2006 2007 2008 2009 2010 2011 2012 2013Calls 3 0 2 1 5 2 2PAX 1.800 -‐ 450 2.600 5.500 2.560 2.835
max LOA 150mt Draft 6,5mtFaaborg/Odense -‐ Ports of H C Andersen 2005 2006 2007 2008 2009 2010 2011 2012 2013Calls 4 4 1PAX 918 1.094 777
max LOA 185mt Draft 6,2mtSkagen -‐ Top Denmark 2005 2006 2007 2008 2009 2010 2011 2012 2013Calls 5 9 6 4 5 6 7 7 11PAX 2.565 2.150 3.302 541 3.206 1.966 4.892 2.671 4400
max LOA 155mt Draft 9mtKorsoer -‐ Port of Korsoer 2005 2006 2007 2008 2009 2010 2011 2012 2013Calls 2 4 0 2 0 0 0PAX 1800 3600 0 1320 0 0 0
max LOA 210mt Draft 7mtNaksov -‐ Port of Naksov 2005 2006 2007 2008 2009 2010 2011 2012 2013Calls 0 0 0 0 0 0 0PAX -‐ -‐ -‐ -‐ -‐ -‐ -‐
max LOA 320mt Draft 7,5mtRønne -‐ Port of Rønne* 2005 2006 2007 2008 2009 2010 2011 2012 2013Calls 33 34 29 31 36 24 25 44 37PAX 13.800 16.311 13.046 16.921 21.864 14.898 18.095 31.717 40.079
max LOA 260mt Draft 8,5mt
Source: Cruise Copenhagen Network*Tilmeldte skibe og fakKske anløb afviger med 4-‐9 pr. år pga. vejrliget.
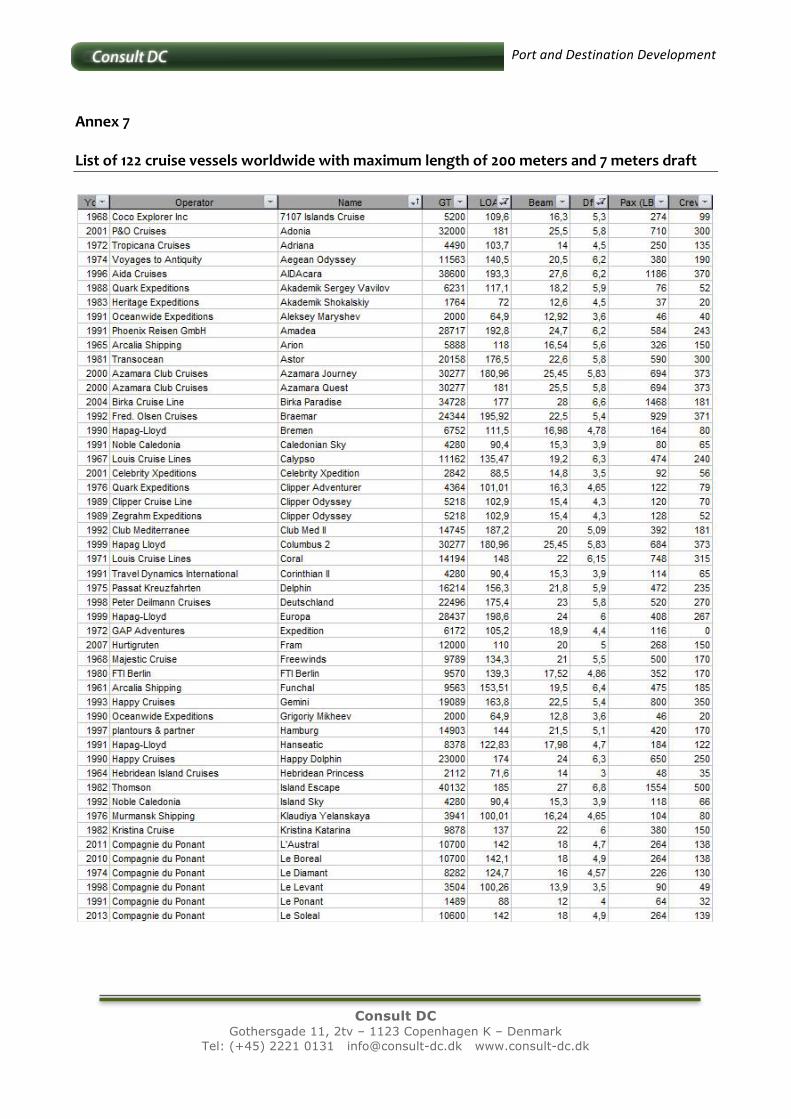
Port and Destination Development
Consult DC
Gothersgade 11, 2tv – 1123 Copenhagen K – Denmark Tel: (+45) 2221 0131 [email protected] www.consult-dc.dk
Annex 7 List of 122 cruise vessels worldwide with maximum length of 200 meters and 7 meters draft

Port and Destination Development
Consult DC
Gothersgade 11, 2tv – 1123 Copenhagen K – Denmark Tel: (+45) 2221 0131 [email protected] www.consult-dc.dk
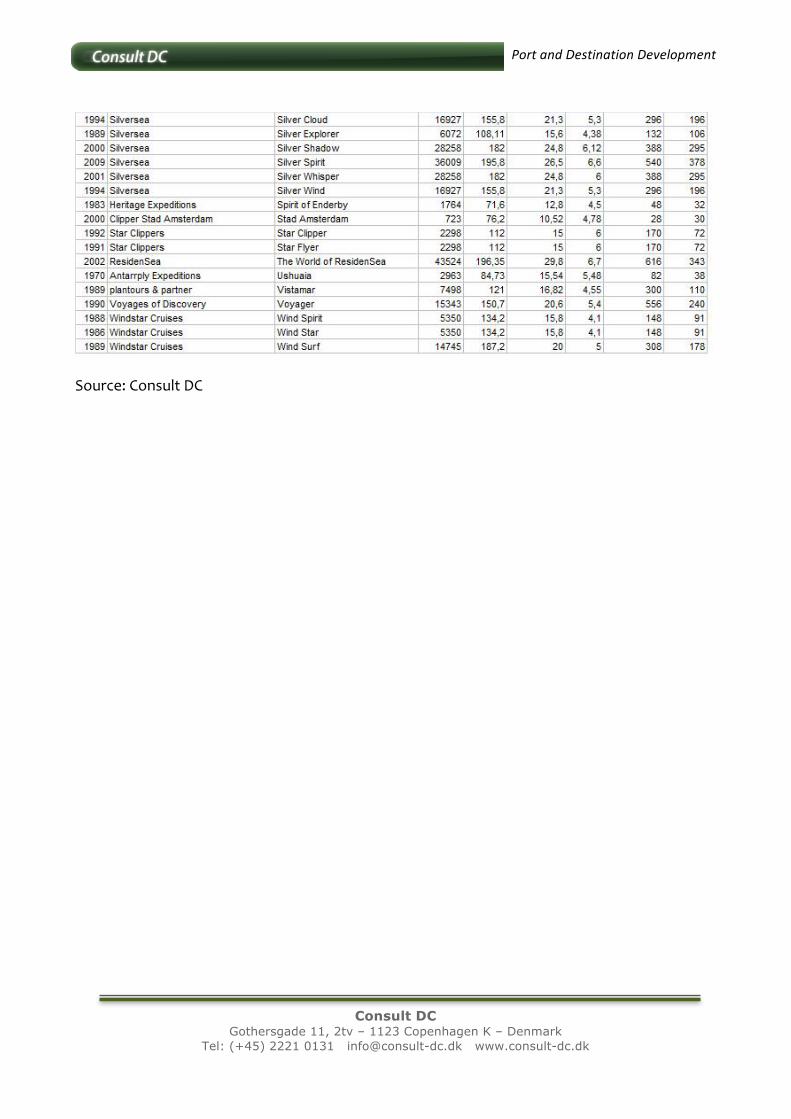
Port and Destination Development
Consult DC
Gothersgade 11, 2tv – 1123 Copenhagen K – Denmark Tel: (+45) 2221 0131 [email protected] www.consult-dc.dk
Source: Consult DC

Port and Destination Development
Consult DC
Gothersgade 11, 2tv – 1123 Copenhagen K – Denmark Tel: (+45) 2221 0131 [email protected] www.consult-dc.dk
Annex 8
Breakdown of ships that could fit the expanded West Harbor pier with LOA 225 meters and 8 meters draft
List of 15 cruise ships that cross Hvide Sande
List of 11 cruise ships that sail through the Kiel Canal
List of 4 cruise ships that cross Hvide Sande through a wider geographic area (England to Norway itineraries)
Source: Consult DC

Port and Destination Development
Consult DC
Gothersgade 11, 2tv – 1123 Copenhagen K – Denmark Tel: (+45) 2221 0131 [email protected] www.consult-dc.dk
Annex 9 Two examples of regional cooperation which have changed the perception of cruise lines One of the cases involved destinations located in the north of France, Spain, Portugal and south of the UK that identified common challenges to attract cruise lines. They decided to join forces and together created the Cruise Atlantic Europe http://cruiseatlanticeurope.com/ While the network was headed by more well known destinations such as Lisbon and Dover, it was the less know destinations such as Bilbao, A Coruna, Leixoes, St. Malo, Brest and Cork that actually gained more benefits from this initiative. They were able to showcase to the cruise lines that the region was more than just an option for cruise operators when ships are re-‐positioning to the Mediterranean, and were able to explore opportunities for short cruises in the region where cruise lines visiting this selection of ports can both save money in terms of fuel costs and lower port charges but also to increase revenue by promoting profitable shore excursions.
With cruise visitors set to exceed 1.25 million in 2013, all the member ports of Cruise Atlantic Europe have experienced growth as cruise traffic in the region continues to increase. This was also prompted by investment of the smaller ports in their infrastructure and much needed product development.
Secondly, there is the case of the Atlantic Alliance where 15 coastal destinations situated in countries ranging from Portugal, Spain, and France to the UK but also including closer destinations located in Belgium, Holland and Germany got together for similar objectives and gains. One of their main goals was to establish the Atlantic Alliance region as a destination in its own right, capable of competing fully with the Baltic, Mediterranean and Norwegian Fjords. They have since created interesting itineraries for the region and continue to improve the cruise statistics. They actually have one of the best websites of any cruise associations: http://www.atlanticalliance.eu/ This is just to offer some examples as we are aware that the above mentioned destinations are in general bigger and are also better known than Hvide Sande, but the fact of the matter is that they were able to change the perceptions of the cruise lines and in the process help big and small destinations. It had to start somewhere.