Embed Size (px)
Citation preview
Int. J. Environ. Res. Public Health 2014, 11, 10480-10503; doi:10.3390/ijerph111010480
International Journal of Environmental Research and
Public Health ISSN 1660-4601
www.mdpi.com/journal/ijerph
Article
Cryptosporidium and Giardia in Surface Water: A Case Study from Michigan, USA to Inform Management of Rural Water Systems
Erin A. Dreelin 1,*, Rebecca L. Ives 2, Stephanie Molloy 3 and Joan B. Rose 2
1 Department of Fisheries and Wildlife and Center for Water Sciences, Michigan State University,
301 Manly Miles Building, 1405 S. Harrison Road, East Lansing, MI 48823, USA 2 Department of Fisheries and Wildlife, Michigan State University, 480 Wilson Road, East Lansing,
MI 48823, USA; E-Mails: [email protected] (R.L.I.); [email protected] (J.B.R.) 3 Environmental Services Department, City of San Jose, 200 E. Santa Clara St. 10th Floor, San Jose,
CA 95113, USA; E-Mail: [email protected]
* Author to whom correspondence should be addressed; E-Mail: [email protected];
Tel.: +1-517-353-7746; Fax: +1-517-353-9807.
External Editor: Charlotte D. Smith
Received: 31 July 2014; in revised form: 22 September 2014 / Accepted: 29 September 2014 /
Published: 14 October 2014
Abstract: Cryptosporidium and Giardia pose a threat to human health in rural
environments where water supplies are commonly untreated and susceptible to
contamination from agricultural animal waste/manure, animal wastewater, septic tank
effluents and septage. Our goals for this paper are to: (1) explore the prevalence of these
protozoan parasites, where they are found, in what quantities, and which genotypes are
present; (2) examine relationships between disease and land use comparing human health
risks between rural and urban environments; and (3) synthesize available information to
gain a better understanding of risk and risk management for rural water supplies. Our
results indicate that Cryptosporidium and Giardia were more prevalent in rural versus
urban environments based on the number of positive samples. Genotyping showed that
both the human and animal types of the parasites are found in rural and urban
environments. Rural areas had a higher incidence of disease compared to urban areas based
on the total number of disease cases. Cryptosporidiosis and giardiasis were both positively
OPEN ACCESS
Int. J. Environ. Res. Public Health 2014, 11 10481
correlated (p < 0.001) with urban area, population size, and population density. Finally, a
comprehensive strategy that creates knowledge pathways for data sharing among multiple
levels of management may improve decision-making for protecting rural water supplies.
Keywords: Cryptosporidium; Giardia; genotyping; land use; rural water supply;
water management
1. Introduction
Cryptosporidium and Giardia have caused multiple high-profile outbreaks around the globe and
are a major concern for water safety because they are resistant to chemical disinfection and are highly
infectious. Of the 199 waterborne disease outbreaks reported globally between 2004 and 2010 that
were caused by parasitic protozoa, Cryptosporidium and Giardia were the most common etiological
agents [1]. Cryptosporidium is responsible for approximately 20% of diarrheal cases in children in
developing countries and up to 9% of cases in developed countries, whereas Giardia is responsible for
20–30% in developing countries and 2–7% of cases in developed countries [2]. The pathogens are
transmitted by the fecal-oral route via human-human contact, human-animal contact, contaminated
food, or contaminated water. For this paper, we focus on the contamination of water supplies by the
parasites. Because of the difficulty with treating source water to eliminate these protozoan parasites in
drinking water, it is important to understand the sources, fate and transport in the environment [3].
Cryptosporidium and Giardia may be introduced into waterbodies by point or nonpoint (diffuse)
pollution sources. Human sources of Cryptosporidium and Giardia contamination may include
untreated or improperly treated sewage, discharges of untreated sewage via sanitary sewer overflows
or combined sewer overflows (CSOs), land application of biosolids and septage, and leaking sewer or
septic tank and drainage systems. Animal sources include runoff from domestic livestock operations or
fields fertilized using animal manure, defecation by pets in the environment, and defecation by
wildlife. Wildlife can contribute to Cryptosporidium contamination in water; however, wildlife sources
may not be a major public health concern due to host-specificity [4]. In the case of giardiasis, the
zoonotic transmission route of exposure does not appear to be as significant as compared to
Cryptosporidium [5]. Poor sanitation and hygiene are the key exposure risks for giardiasis, particularly
in undeveloped countries [5]. In general, fecal contamination of waterways from human sources and
livestock may be of greater human health concern than contamination by wildlife [4,6].
Rural and urban areas differ in the occurrence, distribution, and concentration of potential sources
of fecal contamination. Rural areas are typically characterized by lower human population densities,
higher domesticated livestock densities, and decentralized drinking water and sanitation systems.
In contrast, urban areas are typically characterized by high human population densities, a high
percentage of developed or artificial land cover, and more highly engineered drinking water and
sanitation infrastructure. Thus, populations in rural and urban areas may face different health risks
from protozoan parasites. Studies across the globe, such as those conducted in Switzerland [7],
Spain [8,9], Hungary [10], China [11], and Paris [12], have implicated agricultural activities and
livestock as major sources of protozoan parasites found in source waters. Few studies have examined

Int. J. Environ. Res. Public Health 2014, 11 10482
how land use and population characteristics are related to the presence of Cryptosporidium and
Giardia or the incidence of cryptosporidiosis and giardiasis. In Scotland, increased rates of C. parvum
infection were found in areas with lower human density, a higher ratio of farms to humans, and a
higher ratio of private water supplies to the human population, indicating an association of C. parvum
infection with rural areas [13]. In England and Wales, rates of cryptosporidiosis were higher in rural
areas (defined by housing density), areas with more agricultural manure application, and areas with
poorly treated water supplies [14]. However, only weak relationships were observed between
giardiasis rates and cattle density and between giardiasis rates and land application of animal manure
in a Canadian study [15].
In this paper, we use a case study from Michigan, USA to examine protozoan parasites in water
systems across an urban-rural gradient. Michigan provides a useful case study because the state
encompasses a diversity of land uses, types of source water, and types of water systems. For the case
study, we use a combination of observational data and literature to explore the risks from
Cryptosporidium and Giardia and implications for management based on two main lines of evidence: the
prevalence of the parasites and the incidence of disease. Our goals are to explore three main questions:
(1) How prevalent are Cryptosporidium and Giardia in rural versus urban environments? (2) What
relationships have been observed between disease, land use, and other environmental factors? and (3)
What are the implications for protecting rural waters? We hypothesize that Cryptosporidium is
typically more prevalent and poses more risk in rural areas whereas Giardia is a bigger concern in
urban areas.
2. Experimental Section
2.1. Case Study Background: Michigan, USA
The state of Michigan lies within the Laurentian Great Lakes watershed and is surrounded by
Lakes Superior, Michigan, Huron and Erie. Michigan is home to approximately 9.8 million people as
of 2013 [16]. Based on recent land cover estimates, approximately 5% of the state is urban, 26%
agriculture, and 38% upland forest with the remainder in lowland forest, wetland, open land, and non-
vegetated land cover types [17]. The main urban areas in the state are the Detroit metro area and the
cities of Grand Rapids, Flint, Lansing, and Ann Arbor; all of these population centers are located in the
southern portion of the Lower Peninsula. The remainder of the state is rural, with approximately 19%
of the population and 75% of the landmass classified as rural by the Michigan Department of
Community Health [18].
Michigan has approximately 1425 community water systems and over 10,000 non-community
water systems that are regulated under Safe Drinking Water Act programs by the Michigan
Department of Environmental Quality (MDEQ) with oversight from the US Environmental Protection
Agency (EPA) [19]. The state has the highest number of private wells in the US, with over 1 million
households served [19]. The MDEQ works with local health departments to regulate well construction
and safe decommission and requires that private drinking water wells be tested for indicator bacteria
after installation and prior to use; however, additional water quality monitoring requirements vary by
county and are determined by local health departments.

Int. J. Environ. Res. Public Health 2014, 11 10483
Groundwater is the most common source of drinking water in Michigan based on the number of
systems, with approximately 97% of public water systems using groundwater as reported in the EPA
SDWIS database [20]. However, most of the large urban areas in the state, including the cities of
Detroit, Grand Rapids, Flint and Ann Arbor, obtain drinking water from surface water sources. As a
result, approximately 65% of Michigan’s population is served by surface water. These patterns in land
use and water systems result in rural populations that are typically served by private wells with little to
no monitoring and treatment, whereas urban water systems are treated, monitored, and carefully
regulated (Table 1).
Table 1. Comparison of Michigan rural and urban communities.
Characteristic Rural Urban
Source Water Groundwater Surface water
Common Water System Type Private wells Community systems
Dominant Waste Streams Livestock Human
Drinking Water Regulations Minimal regulation once wells are constructed Safe Drinking Water Act requirements enforced
Figure 1. Annual number of cases of cryptosporidiosis (red) and giardiasis (blue) reported in the
United States (lines) and Michigan (MI; bars) from 1992–2010. Cryptosporidiosis reporting for the
US began in 1995 with 27 states reporting data; Michigan began reporting cryptosporidiosis in
1997. Note the difference in scales for Michigan (Y1) and US (Y2) cases. (Data sources: [22–24]).
Michigan began reporting cases of giardiasis and cryptosporidiosis in 1992 and 1997, respectively.
Cases of giardiasis are more common than cryptosporidiosis, which is similar to national trends (Figure 1).
Cryptosporidiosis is most commonly reported for the 0-9 age group; 25% of reported cases between

Int. J. Environ. Res. Public Health 2014, 11 10484
2003 and 2007 occurred in this group [21]. For giardiasis, approximately half of the cases reported are
in people under 19, with 31% of the cases occurring in the 0-9 age group during the same time
period [15]. As with the national data, the number of cases of giardiasis in Michigan peaked in the
mid-1990s and has declined, whereas cryptosporidiosis cases have increased since the 1990s.
2.2. Prevalence in the Environment
We used several data sources to assess prevalence of Cryptosporidium and Giardia across
Michigan. We compiled all data from multiple studies conducted in Michigan by our lab, the Michigan
State University (MSU) Water Quality, Environmental, and Molecular Microbiology Laboratory.
These data include samples from private wells and surface waters in both urban and rural areas of the
state (Figure 2). In addition to these field data, we also downloaded results from the USEPA Long
Term 2 Enhanced Surface Water Treatment Rule (LT2ESWTR or LT2) monitoring program [25] and
extracted data for Michigan. The LT2 data consist of raw water samples collected at intakes of
drinking water plants using surface water or groundwater directly under the influence of surface water
which were analyzed for Cryptosporidium following USEPA Method 1622 [26] or 1623 [27]. Giardia
data were included from LT2 samples analyzed by the MSU Water Quality, Environmental, and
Molecular Microbiology Laboratory.
Figure 2. Map of the sampling sites for (A) Cryptosporidium and (B) Giardia in Michigan,
USA. Green areas are classified as rural and gray areas are classified as urban by the
Michigan Department of Community Health [18]. Black borders highlight counties that
were sampled for either Cryptosporidium or Giardia. Circles within county boundaries
indicate intensity of monitoring based on the number of surface and groundwater samples
collected for each county.
Int. J. Environ. Res. Public Health 2014, 11 10485
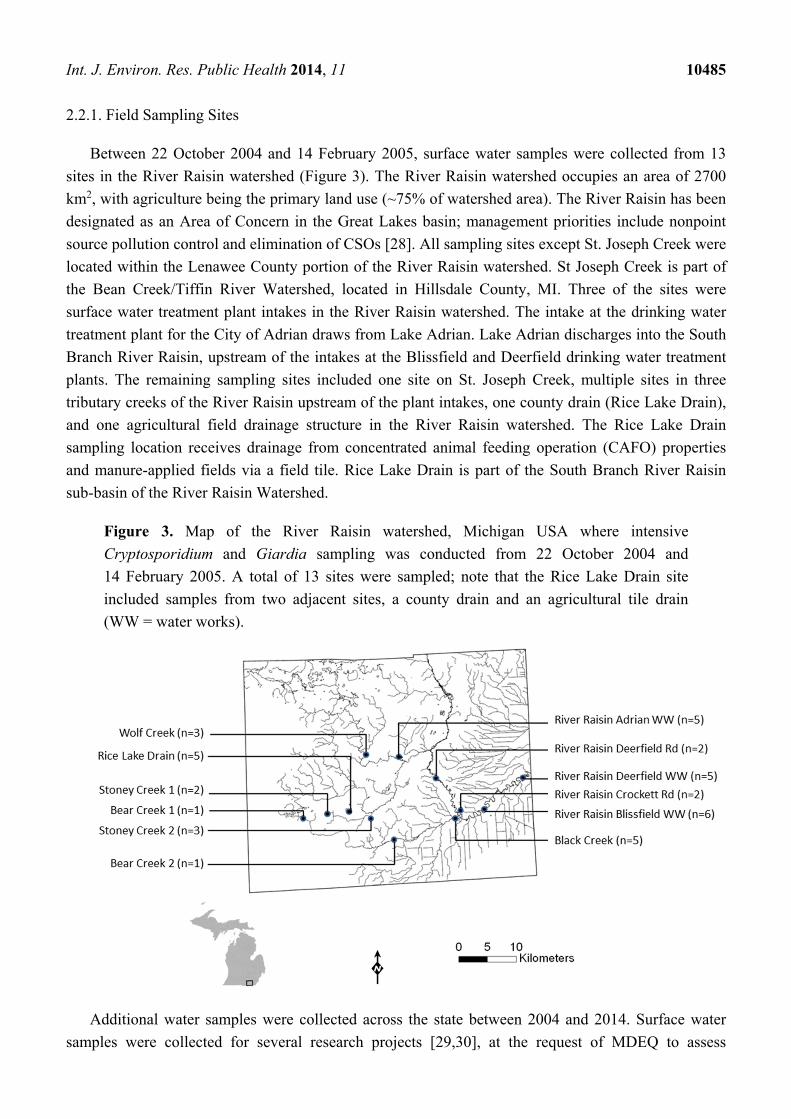
2.2.1. Field Sampling Sites
Between 22 October 2004 and 14 February 2005, surface water samples were collected from 13
sites in the River Raisin watershed (Figure 3). The River Raisin watershed occupies an area of 2700
km2, with agriculture being the primary land use (~75% of watershed area). The River Raisin has been
designated as an Area of Concern in the Great Lakes basin; management priorities include nonpoint
source pollution control and elimination of CSOs [28]. All sampling sites except St. Joseph Creek were
located within the Lenawee County portion of the River Raisin watershed. St Joseph Creek is part of
the Bean Creek/Tiffin River Watershed, located in Hillsdale County, MI. Three of the sites were
surface water treatment plant intakes in the River Raisin watershed. The intake at the drinking water
treatment plant for the City of Adrian draws from Lake Adrian. Lake Adrian discharges into the South
Branch River Raisin, upstream of the intakes at the Blissfield and Deerfield drinking water treatment
plants. The remaining sampling sites included one site on St. Joseph Creek, multiple sites in three
tributary creeks of the River Raisin upstream of the plant intakes, one county drain (Rice Lake Drain),
and one agricultural field drainage structure in the River Raisin watershed. The Rice Lake Drain
sampling location receives drainage from concentrated animal feeding operation (CAFO) properties
and manure-applied fields via a field tile. Rice Lake Drain is part of the South Branch River Raisin
sub-basin of the River Raisin Watershed.
Figure 3. Map of the River Raisin watershed, Michigan USA where intensive
Cryptosporidium and Giardia sampling was conducted from 22 October 2004 and
14 February 2005. A total of 13 sites were sampled; note that the Rice Lake Drain site
included samples from two adjacent sites, a county drain and an agricultural tile drain
(WW = water works).
Additional water samples were collected across the state between 2004 and 2014. Surface water
samples were collected for several research projects [29,30], at the request of MDEQ to assess

Int. J. Environ. Res. Public Health 2014, 11 10486
compliance with surface water regulations and at the request of MDCH to assist with an outbreak
investigation [31]. Groundwater samples were collected and analyzed from private wells at the request
of homeowners. These groundwater samples were often collected after individuals in the household
were diagnosed with cryptosporidiosis or giardiasis. Typically, only one sample on a single date was
collected for these private wells.
2.2.2. Sampling Methods
All samples were collected and analyzed following USEPA Method 1623 [27]. At surface water
sites, approximately 20 L of water were collected for Cryptosporidium and Giardia analysis. For
private wells, larger volumes (up to 100 L) were collected. All samples were transported on ice and
then stored at 4 °C until processed. Samples with turbidity levels less than 35 NTU were filtered
through EnvirocheckTM HV filters (Pall Corp, New York, NY, USA) and then eluted according to
manufacturer’s instructions. To avoid blocking the filters, high turbidity (≥35 NTU) samples were
centrifuged at 1000–1100 G for 15 min instead of filtered to obtain a water concentrate from a water
sample of relevant size.
Eluted volumes from filters were centrifuged to concentrate the sample as described in USEPA
Method 1623 [27]. Giardia cysts and Cryptosporidium oocysts were separated from water sample
concentrates by immunomagnetic separation (IMS), stained, and examined by microscopy as described
in EPA Method 1623 [27].
Samples from the River Raisin watershed that tested positive for Cryptosporidium via microscopy
were tested for infectivity using an in-vitro cell culture method as described by Slifko et al. [32]. A
most probable number was computed for infectious samples using the Environmental Protection
Agency’s ICR-MPNV program (version 1).
2.2.3. Genotyping
For the River Raisin samples collected during 2004–2005, samples positive for Cryptosporidium
by microscopy and PCR detection were genotyped. IMS concentrates were centrifuged (10,000 g for
3 min), and resuspended in 50 µL of molecular grade water. To extract DNA, water concentrates were
mixed with Chelex resin-Tris-EDTA buffer (1:1 ratio; vol/vol) and subjected to eight freeze-thaw
cycles (liquid nitrogen/boiling water). The sample was centrifuged and the supernatant removed for
genotype analysis. Samples of molecular grade water were included randomly as negative controls
during the DNA extraction procedures. PCR amplification reaction mixtures contained 1× PCR buffer
(10× PCR buffer with 15 mM MgCl2, Qiagen, Hilden, Germany), 3 mM MgCl2, 60 µM (each)
deoxynucleoside triphosphate, 100 nM (each) primer (500 nM in 100 µL reactions), 2.5 U of Hot Start
Taq polymerase (Qiagen), and 5 and 50 µL of DNA template in total 50- and 100-µL reaction
mixtures, respectively. Positive and negative PCR controls were run in parallel with each set of
samples. PCR-positive controls for the initial amplification reaction consisted of C. parvum template
DNA. PCR negative controls contained molecular-grade water. Primary and nested PCR was
performed. Primary PCR was performed with primers 5'-TTCTAGAGCTAATACATGCG-3' [33] and
5'-CCCATTTCCTTCGAAA CAGGA-3' [34]. Thirty five PCR cycles (94 °C for 45 s, 55 °C for 60 s,
and 72 °C for 90 s) were carried out in a thermal cycler with an initial hot start at 95 °C for 15 min
Int. J. Environ. Res. Public Health 2014, 11 10487
and a final extension at 72 °C for 7 mins. Nested PCR was carried out under the same conditions,
using 5 µL of the primary PCR product as reaction template, and nested primers
5'-GGAAGGGTTGTATTTATTAGATAAAG-3' and 5'-AAGGAGTAAGGAACAACCTCCA-3' [33].
Cycling conditions were identical to those used for the primary PCR. PCR products were analyzed on
1.5% agarose gels containing 4 µL/100 mL of Gel Star nucleic acid stain (Cambrex, Rockland, ME,
USA) in 1× Tris-borate-EDTA buffer. Resulting bands were visualized by UV transillumination.
Restriction fragment analysis was performed as described by Xiao et al. [33]. Digested products
were fractioned on a 2.0% agarose gel containing 4 µL/100 mL of Gel Star nucleic acid stain
(Cambrex) and were visualized by UV transillumination. The patterns of DNA bands were used to
differentiate the species and genotypes of Cryptosporidium parasites [33].
Nested PCR products were cloned for sequencing, using the TOPO TA cloning kit (Invitrogen,
Carlsbad, CA, USA) and plasmid DNA was isolated and purified using the Wizard Plus SV Minipreps
DNA purification kit (Promega, Madison, WI, USA) prior to submission for sequencing. Automated
sequencing was performed on the ABI PRISM 3100 Genetic Analyzer (Applied Biosystems, Foster
City, CA, USA) of the Genomic Technology Support Facility at Michigan State University.
Sequencing was performed on two clones from each sample in both directions, and the resulting
consensus sequences were compared (BLAST; www.NCBI.NIH.gov) with sequences available in the
GenBank database to identify possible matches with the sample sequences.
2.2.4. Statistical Analyses
We used the Mann-Whitney Rank Sum Test to analyze differences between the percent of positive
samples for urban and rural sites and the percent of positive samples for surface and groundwater sites.
We also compared differences between the percent of positive samples for urban and rural sites for just
surface water samples. We chose this non-parametric analysis because the data did not meet the
assumption of normality and data transformations failed to achieve normality.
2.3. Relationship between Disease and Land Use
To investigate patterns between land cover type and the incidence of giardiasis and
cryptosporidiosis, we constructed a database in ArcGIS (ArcGIS 9.2, ESRI). The database was
populated with publicly available information from the Michigan Geographic Data Library including
census tracts from the counties of interest (Hillsdale, Lenawee, Ottawa, and Kent) and the 2001 land
cover raster image of Michigan’s Lower Peninsula (30m × 30m cell size). The database also included
information obtained from the United States Census Bureau on the five digit ZIP code tabulation areas
(ZCTAs) for the year 2000 [16]. Information on giardiasis and cryptosporidiosis cases was obtained
from the Michigan Department of Community Health (MDCH). Case information over the time span
of January 2000 to December 2008 was summed by ZIP code and included in the database. Data on
additional attributes for each ZIP code in the study area were obtained from the 2000 United States
Census. These attributes were: (1) population, (2) percentage of individuals below poverty level, (3)
median household income, (4) median age, (5) mean travel time to work, and (6) percentage of
Caucasian/white individuals. The end product was a database with records of ZIP codes, percentage of
“rural” area, percentage of “urban” area, percentage of “other” area, numbers of cases of giardiasis,

Int. J. Environ. Res. Public Health 2014, 11 10488
and numbers of cases of cryptosporidiosis during the period from January 2000 to December 2008.
ZIP codes that were ≥50% rural by area were designated as rural ZIP codes. ZIP codes that were ≥50%
urban by area were designated as urban ZIP codes. For further information on database creation, see
the Supplemental Materials.
Using the database, ZIP codes that overlapped into counties other than Kent, Ottawa, Lenawee, and
Hillsdale counties were identified and excluded from statistical analysis of disease occurrence and land
cover type. There were 102 ZIP codes identified in the Kent, Ottawa, Lenawee, and Hillsdale counties
and 54 of these ZIP codes were excluded from the statistical analysis. Two of the excluded ZIP codes
had neither >50% urban area or >50% rural area, five ZIP codes were generic 3 digit ZIP codes which
had no population associated with them (i.e., areas located alongside interstate highways), two ZIP
codes had no area associated with them in the ArcGIS database, and 45 of the ZIP codes extended
beyond the borders of Hillsdale, Lenawee, Kent, and Ottawa county. Thus, 48 ZIP codes of the 102
ZIP codes in Kent, Ottawa, Lenawee, and Hillsdale counties were analyzed.
Information on study area attributes for each of the 48 ZIP codes was obtained from either the
constructed ArcGIS database or the 2000 United States Census [16] for statistical comparison. These
attributes were: (1) population, (2) area, (3) population density, (4) percentage of individuals below
poverty level, (5) median household income, (6) median age, (7) mean travel time to work, and
(8) percentage of Caucasian/white individuals. We compared these attributes between the urban and
rural ZIP codes and examined for statistically significant differences. Datasets for statistical analysis
were not normally distributed. The “Median household income” and “Percentage of individuals below
poverty level” attributes could be transformed to produce normally distributed datasets using a log
transformation. For these attributes, t-tests were used to examine the datasets for statistically
significant differences. No transformation was found that produced normally distributed datasets for
the other demographic attributes; therefore, the non-parametric Mann-Whitney Rank Sum Test was
used to analyze differences between urban and rural zip codes.
Statistical analysis of urban cryptosporidiosis, rural cryptosporidiosis, urban giardiasis, and rural
giardiasis was performed using ZIP codes that had been classified as either urban or rural. We first
analyzed the case data (January 2000 to December 2008) for each disease, then performed the analysis
on data normalized by three different methods: (1) case data for each disease normalized by the area of
the ZIP code, (2) case data for each disease normalized by the population of the ZIP code, and finally
(3) case data for each disease normalized by the population density of the ZIP code. We used
non-parametric tests because the data were not normally distributed and no transformation was found
that produced normally-distributed datasets. For each analysis, a Kruskal-Wallis One Way Analysis of
Variance (ANOVA) on Ranks was performed (SigmaPlot 11, Systat Software, Inc., San Jose, CA,
USA), followed by a Dunn's test to evaluate multiple pairwise differences. We used Spearman
correlation on ranks to analyze relationships between the percentage of urban area and percentage of
rural area of ZIP codes in the study area and seven other factors. These factors were population,
population density, percentage of Caucasian/white individuals, percentage of individuals below
poverty level, median household income, median age, and mean travel time to work. We considered
correlations to be strong if r > 0.9 and moderately strong if r > 0.75.

Int. J. Environ. Res. Public Health 2014, 11 10489
3. Results and Discussion
3.1. Prevalence in the Rural and Urban Water Environments
3.1.1. Occurrence of Cryptosporidium and Giardia in Rural versus Urban Areas
We detected a significant difference in the percent of samples testing positive for Cryptosporidium
between urban and rural sites (Mann-Whitney U = 916.0, p = 0.05). Of the urban sites, 37% tested
positive for Cryptosporidium whereas 52% of the rural sites tested positive (Figure 4). Surface and
groundwater sites were also significantly different (U = 256.5, p < 0.001), with 56% surface water sites
and none of groundwater sites testing positive for Cryptosporidium. We did not detect any differences
in the concentrations of Cryptosporidium in positive samples between urban and rural sites or between
surface and groundwater sites. We also did not detect a significant difference in the percent of samples
testing positive for Giardia between urban and rural sites (Figure 4); however, we did detect a
significant difference between surface water and groundwater sites (U = 209.0, p = 0.001). Of the
surface water sites, 50% tested positive for Giardia whereas only one of the groundwater sites tested
positive. The single positive groundwater sample was from a drinking water plant in an urban county
using groundwater under the influence of surface water. When we excluded groundwater samples, we
did not detect significant differences between surface water samples from urban and rural sites for
either Cryptosporidium or Giardia. However, more samples are available from urban areas compared
to rural areas.
Figure 4. Percent of positive samples for (A) Cryptosporidium at rural sites (n = 29),
(B) Cryptosporidium at urban sites (n = 51), (C) Giardia at rural sites (n = 29), and
(D) Giardia at urban sites (n = 33). Samples were collected across Michigan from
2004–2014 from both surface and groundwater sites.
Int. J. Environ. Res. Public Health 2014, 11 10490
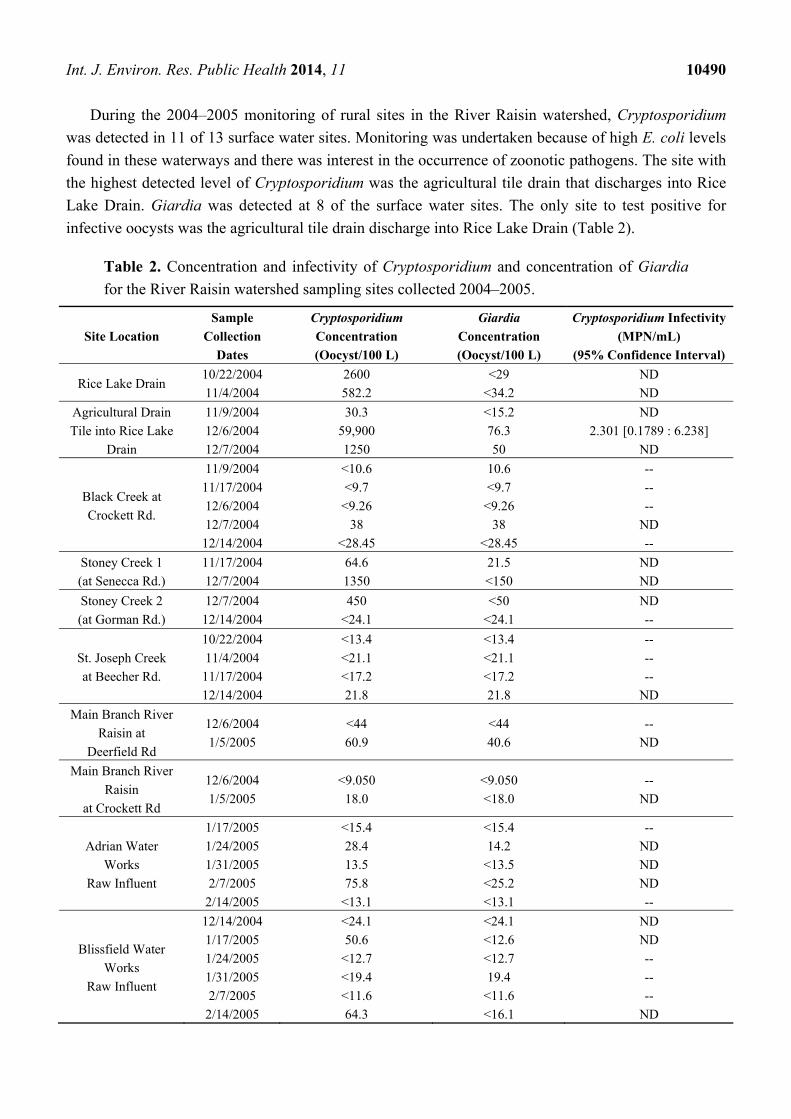
During the 2004–2005 monitoring of rural sites in the River Raisin watershed, Cryptosporidium
was detected in 11 of 13 surface water sites. Monitoring was undertaken because of high E. coli levels
found in these waterways and there was interest in the occurrence of zoonotic pathogens. The site with
the highest detected level of Cryptosporidium was the agricultural tile drain that discharges into Rice
Lake Drain. Giardia was detected at 8 of the surface water sites. The only site to test positive for
infective oocysts was the agricultural tile drain discharge into Rice Lake Drain (Table 2).
Table 2. Concentration and infectivity of Cryptosporidium and concentration of Giardia
for the River Raisin watershed sampling sites collected 2004–2005.
Site Location
Sample
Collection
Dates
Cryptosporidium Concentration
(Oocyst/100 L)
Giardia Concentration
(Oocyst/100 L)
Cryptosporidium Infectivity
(MPN/mL)
(95% Confidence Interval)
Rice Lake Drain 10/22/2004
11/4/2004
2600
582.2
<29
<34.2
ND
ND
Agricultural Drain
Tile into Rice Lake
Drain
11/9/2004
12/6/2004
12/7/2004
30.3
59,900
1250
<15.2
76.3
50
ND
2.301 [0.1789 : 6.238]
ND
Black Creek at
Crockett Rd.
11/9/2004
11/17/2004
12/6/2004
12/7/2004
12/14/2004
<10.6
<9.7
<9.26
38
<28.45
10.6
<9.7
<9.26
38
<28.45
--
--
--
ND
--
Stoney Creek 1
(at Senecca Rd.)
11/17/2004
12/7/2004
64.6
1350
21.5
<150
ND
ND
Stoney Creek 2
(at Gorman Rd.)
12/7/2004
12/14/2004
450
<24.1
<50
<24.1
ND
--
St. Joseph Creek
at Beecher Rd.
10/22/2004
11/4/2004
11/17/2004
12/14/2004
<13.4
<21.1
<17.2
21.8
<13.4
<21.1
<17.2
21.8
--
--
--
ND
Main Branch River
Raisin at
Deerfield Rd
12/6/2004
1/5/2005
<44
60.9
<44
40.6
--
ND
Main Branch River
Raisin
at Crockett Rd
12/6/2004
1/5/2005
<9.050
18.0
<9.050
<18.0
--
ND
Adrian Water
Works
Raw Influent
1/17/2005
1/24/2005
1/31/2005
2/7/2005
2/14/2005
<15.4
28.4
13.5
75.8
<13.1
<15.4
14.2
<13.5
<25.2
<13.1
--
ND
ND
ND
--
Blissfield Water
Works
Raw Influent
12/14/2004
1/17/2005
1/24/2005
1/31/2005
2/7/2005
2/14/2005
<24.1
50.6
<12.7
<19.4
<11.6
64.3
<24.1
<12.6
<12.7
19.4
<11.6
<16.1
ND
ND
--
--
--
ND

Int. J. Environ. Res. Public Health 2014, 11 10491
Table 2. Cont.
Site Location Sample
Collection Dates
Cryptosporidium Concentration
(Oocyst/100 L)
Giardia Concentration
(Oocyst/100 L)
Cryptosporidium Infectivity
(MPN/mL)
(95% Confidence Interval)
Deerfield Water
Works
Raw Influent
1/18/2005
1/24/2005
1/31/2005
2/7/2005
2/14/2005
15.7
<19.0
<14.7
39.6
64.3
<15.7
<19.0
<14.7
<13.2
<16.1
ND
--
--
ND
ND
Bear Creek 1
(at Medina Rd.) 11/9/2004 <8.8 8.8 --
Wolf Creek at
Forrister Rd.
10/22/2004
11/4/2004
11/17/2004
<20
<13.1
<10.3
<20
<13.1
<10.3
--
--
--
Bear Creek 2
(at Morse Rd.) 11/9/2004 <18.2 <18.2 --
Notes: ND—sample assayed for infectivity, no infectivity detected; “<”—sample below detection limit of assay.
3.1.2. Genotyping of Cryptosporidium in Rural Water Samples
Four samples from the River Raisin watershed were identified as C. hominis. This species is found
only in humans, indicating a human source of fecal pollution. Four samples matched C. parvum, which
is a species found in animals (including cattle) and humans. One sample did not match any known
sequence and is likely from a wildlife source. The sample collected from the agricultural tile discharge
into Rice Lake drain was identified as C. parvum via the RFLP pattern, and another Cryptosporidium
sequence from the tile sample had the closest relationship to sequences of C. parvum genotype 2 (Figure 5).
C. parvum genotype 2 infects humans and some other mammals, including ruminants [35,36]. The
presence of C. parvum indicates a human, cattle, or mixed human and cattle source of fecal
contamination in these waters. RFLP analysis showed that two samples from a small community’s
drinking water intake were matched closest to C. andersoni and C. parvum, thus drinking water
sources in these rural areas contain multiple Cryptosporidium species indicating an input of cattle fecal
pollution and a potential input of human fecal pollution.
The genotyping of Cryptosporidium found in Michigan waterways suggests that agricultural
practices are contributing to contamination of these waterways. C. andersoni is a species found in
cattle [37] and has been previously found in both cattle and surface water from farms in the lower
peninsula of Michigan [38]. C. andersoni infects both juvenile and adult cattle and has a long oocyst
shedding duration of months to years, compared to the short shedding duration (~1–2 weeks) of
C. parvum [37,38]. While the presence of C. andersoni in surface waters presents a low risk to public
health, it does indicate a probable cattle source of fecal contamination in these waters and may pose a
risk to farms if these surface waters are used as an animal drinking water source.

Int. J. Environ. Res. Public Health 2014, 11 10492
Figure 5. Dendrogram showing the relationship between the Rice Lake Drain 12/7/04 DNA
sequence and Cryptosporidium sequences of known host origin and genotype. Note: The further
to the right the branch is, the closer the relationship i.e. Rice Lake Drain 12/7/04 is more closely
related to the two C. parvum sequences than to the C. hominis sequences.
To answer our first research question, we found a higher number of positive samples for
Cryptosporidium and Giardia in rural versus urban environments; however, we are limited by the
number of samples available to draw conclusions regarding overall prevalence in urban versus rural
environments. For households that used private wells, no parasite contamination was found in either
rural (n = 4) or urban (n = 11) wells. One of the three urban centers that utilized groundwater tested
positive for Giardia and none tested positive for Cryptosporidium. The highest concentrations of
parasites were found in rural drains. The presence of infective C. hominis and C. parvum in tile drain
discharge to the Rice Lake Drain (Table 2) indicates both agricultural and human waste may be
sources of protozoa in the environment and in surface water that potentially impact drinking water
supplies.
3.2. Relationship between Disease and Land Use
Significant differences between urban and rural ZIP codes were found in all attributes examined
(i.e., population, area, population density, percentage of individuals below poverty level, median
household income, median age, mean travel time to work, and percentage of Caucasian/white
individuals). When compared to urban zip codes, the rural zip codes had a higher percentage of
Caucasian/white individuals in the population, the population age was older, the mean travel time to
work was longer, and the median household income was higher. Additionally, in the rural zip codes, a
lower percentage of individuals were living below the poverty level than in the urban zip codes. Three
of these attributes (population, area, and population density) were used to normalize the cases of
C. hominis isolate HFL2
C. hominis isolate HFL5
C. hominis isolate HCNV4
Rice Lake Drain 12/7/04
C. parvum isolate BOH6
C. parvum isolate GCH1
Int. J. Environ. Res. Public Health 2014, 11 10493
disease. The attributes of population and area both had higher values in rural areas than in urban areas.
In contrast, the population density was higher in urban areas than in rural areas. The three normalized
datasets and the non-normalized dataset were used to test the null hypothesis that disease levels in
urban and rural areas are the same.
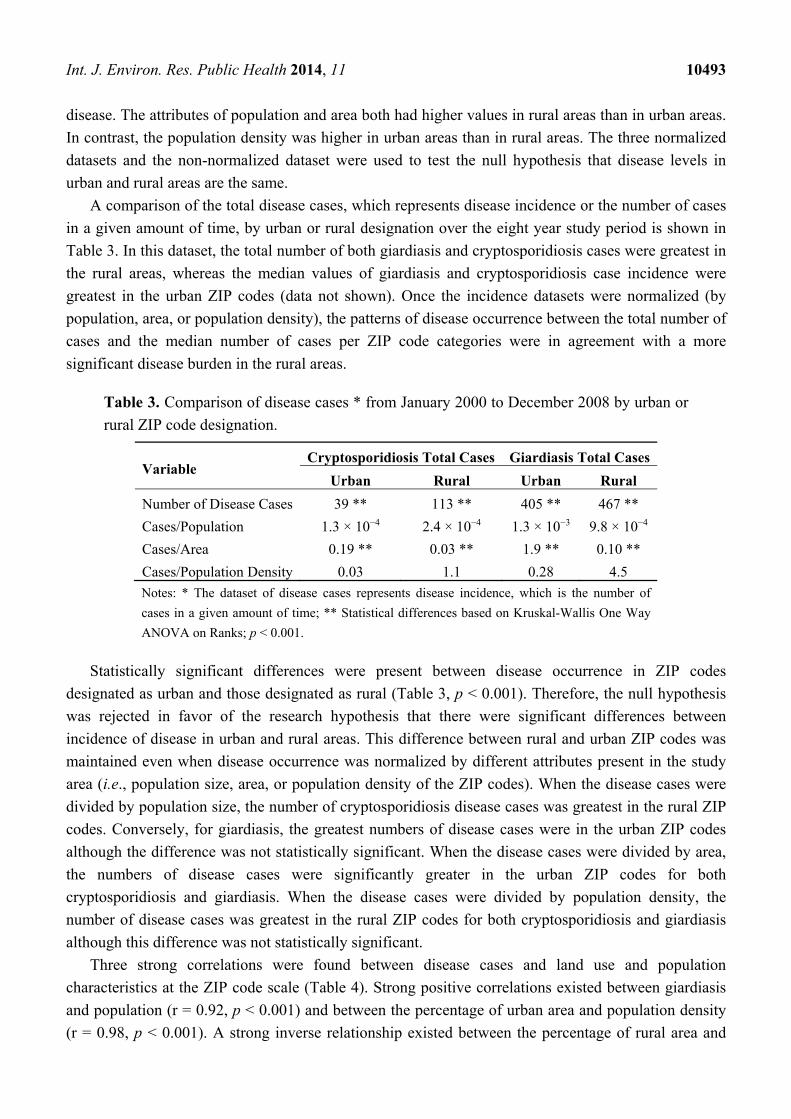
A comparison of the total disease cases, which represents disease incidence or the number of cases
in a given amount of time, by urban or rural designation over the eight year study period is shown in
Table 3. In this dataset, the total number of both giardiasis and cryptosporidiosis cases were greatest in
the rural areas, whereas the median values of giardiasis and cryptosporidiosis case incidence were
greatest in the urban ZIP codes (data not shown). Once the incidence datasets were normalized (by
population, area, or population density), the patterns of disease occurrence between the total number of
cases and the median number of cases per ZIP code categories were in agreement with a more
significant disease burden in the rural areas.
Table 3. Comparison of disease cases * from January 2000 to December 2008 by urban or
rural ZIP code designation.
Variable Cryptosporidiosis Total Cases Giardiasis Total Cases
Urban Rural Urban Rural
Number of Disease Cases 39 ** 113 ** 405 ** 467 **
Cases/Population 1.3 × 10⁻⁴ 2.4 × 10⁻⁴ 1.3 × 10⁻³ 9.8 × 10⁻⁴
Cases/Area 0.19 ** 0.03 ** 1.9 ** 0.10 **
Cases/Population Density 0.03 1.1 0.28 4.5 Notes: * The dataset of disease cases represents disease incidence, which is the number of
cases in a given amount of time; ** Statistical differences based on Kruskal-Wallis One Way
ANOVA on Ranks; p < 0.001.
Statistically significant differences were present between disease occurrence in ZIP codes
designated as urban and those designated as rural (Table 3, p < 0.001). Therefore, the null hypothesis
was rejected in favor of the research hypothesis that there were significant differences between
incidence of disease in urban and rural areas. This difference between rural and urban ZIP codes was
maintained even when disease occurrence was normalized by different attributes present in the study
area (i.e., population size, area, or population density of the ZIP codes). When the disease cases were
divided by population size, the number of cryptosporidiosis disease cases was greatest in the rural ZIP
codes. Conversely, for giardiasis, the greatest numbers of disease cases were in the urban ZIP codes
although the difference was not statistically significant. When the disease cases were divided by area,
the numbers of disease cases were significantly greater in the urban ZIP codes for both
cryptosporidiosis and giardiasis. When the disease cases were divided by population density, the
number of disease cases was greatest in the rural ZIP codes for both cryptosporidiosis and giardiasis
although this difference was not statistically significant.
Three strong correlations were found between disease cases and land use and population
characteristics at the ZIP code scale (Table 4). Strong positive correlations existed between giardiasis
and population (r = 0.92, p < 0.001) and between the percentage of urban area and population density
(r = 0.98, p < 0.001). A strong inverse relationship existed between the percentage of rural area and

Int. J. Environ. Res. Public Health 2014, 11 10494
population density (r = −0.98, p < 0.001). Five moderately strong positive correlations and four
moderately strong inverse correlations were found in this assessment (Table 4). The moderately strong
positive correlations consisted of giardiasis and population density, giardiasis and percentage urban
area, cryptosporidiosis and population, percentage urban area and population, and percentage rural area
and percentage of Caucasian/white individuals. The moderately strong inverse correlations consisted
of giardiasis and percentage rural area, the percentage of urban area and percentage of Caucasian/white
individuals, the percentage of rural area and population, and giardiasis and mean travel time to work.
The demographic characteristics (i.e., percentage of Caucasian/white individuals, median age and
mean travel time to work) are significantly correlated to percent urban and rural area. No significant
correlations with either the median household income or the percentage of individuals below poverty
level were found (p > 0.15). The relationship with population produced the highest correlation
coefficients for cases of either giardiasis or cryptosporidiosis, although the correlation with giardiasis
was strong and the correlation with cryptosporidiosis was only moderate. For both giardiasis and
cryptosporidiosis, the next strongest relationship was with population density.
Table 4. Statistically significant correlations (p < 0.001) between disease cases and land
use and population characteristics. Correlations (r values) greater than or equal to 0.75 are
shown in bold.
Factor Total Giardiasis
Cases
Total Cryptosporidiosis
Cases
% Urban
Area
% Rural
Area
% Urban Area 0.79 0.60 - -
% Rural Area −0.79 −0.59 - -
Population 0.92 0.79 0.75 −0.75
Population Density 0.80 0.61 0.98 −0.98
% White −0.69 −0.55 −0.78 0.76
Median Age −0.64 −0.49 −0.55 0.56
Mean Travel Time to Work −0.75 −0.66 −0.65 0.65
Livestock density and manure land application were not included in the prototype database,
although these may be important factors in disease transmission. Information on livestock density is
only available at the county scale. Including this information in the prototype database would require
all comparisons to be done at the county scale, potentially obscuring patterns that occur at more local
levels. However, several studies in the scientific literature that have examined associations between
cryptosporidosis/giardiasis and livestock density, manure application, and other livestock related
factors. These studies provide insight into which attributes would be desirable to include in an
expanded GIS database.
Previous studies of cryptosporidiosis and giardiasis in England, Scotland, and Wales have
demonstrated association with rural areas in some studies and associations with urban areas in others.
During the 2001 foot and mouth disease outbreak in livestock in England and Wales, in which control
measures were implemented including restriction of access to farms, limiting movement of livestock
for trade and between pasturage, and culling of affected herds and flocks, there was a corresponding
decrease in reported cryptosporidiosis in humans ranging from 35–63% [39] throughout England and

Int. J. Environ. Res. Public Health 2014, 11 10495
Wales with declines of 81.8% in northwest England [40]. During the interval of foot and mouth
disease control measures, the proportion of C. parvum cases decreased compared to case incidence in
2000, suggesting a decrease in human infection due to a decrease in exposure to pathogen reservoirs in
livestock [39]. No significant reduction in giardiasis cases was observed during this interval, which
may indicate a difference between Giardia and Cryptosporidium transmission routes and reservoirs of
infection [39]. Studies of area based cryptospordiosis rates in England and Wales using housing
density to define rural areas demonstrated higher illness rates in rural areas than urban areas, higher
rates in areas with more agricultural manure application, and higher rates in areas with inadequate
drinking water treatment [14,41]. A study of spatial epidemiology of sporadic cases of human
cryptosporidiosis in Scotland found increased rates of C. parvum infection in areas with lower human
density, a higher ratio of farms to humans, and a higher ratio of private water supplies to the human
population, indicating an association of C. parvum infection with rural areas [13]. Unlike C. parvum,
C. hominis was reported more often in the more heavily populated areas of south Scotland, associating
this genotype more strongly with urban areas [13]. In a case control study of cryptosporidiosis in the
United Kingdom, the urban-rural gradient was not found to be a significant variable in the full model
of disease etiology when both C. parvum and C. hominis cases were included. However, when
C. hominis cases were excluded, cryptosporidiosis was negatively associated with urban areas and
when C. parvum cases were excluded, cryptosporidiosis was positively associated with urban areas,
indicating genotype specific transmission associated with the geographical classifications [41]. The
differences in the association of cryptosporidiosis with urban or rural areas in the scientific literature
may therefore be partially due to the Cryptosporidium genotype causing the infections.
In a spatial investigation of giardiasis in Canada that explored associations with livestock density
and land application of manure with disease patterns, low correlation coefficients between giardiasis
rates and cattle density (r = 0.11) and between giardiasis rates and land application (r = 0.09) were
observed when all geographic regions in the study area were included [15]. However, these correlation
coefficients were higher in certain regions of the study area when disease rates were examined at
smaller spatial scales [15].
These results suggest that livestock density and land application of manure can contribute to
transmission of Giardia, but that other factors may be more important. In the current study, the major
caveat to the conclusion that significant differences in the patterns of giardiasis and cryptosporidiosis
exist between urban and rural ZIP codes is the small number of ZIP codes that are designated as urban
in the study area. Because this method of examining health data appears promising, expanding the
study area to larger geographic regions of the United States (i.e., the Midwest) in future work is
recommended. Expanding the geographic region would also allow for agricultural census data to be
incorporated into the study design by allowing analysis at the county level, which is the minimum
scale of the agricultural census data. Previous studies from the scientific literature suggest that
livestock density, animal transport frequency, the number of farm workers/visitors, manure application
rate, ratio of farms to humans, and the Cryptosporidium genotype would be informative attributes in an
expanded GIS database. Utilizing GIS as a tool to integrate factors from the rural environment with
factors from the urbanized environment has the potential to be extremely useful to public health
agencies in targeting funds to reduce disease transmission in communities.
Int. J. Environ. Res. Public Health 2014, 11 10496
To summarize our results regarding our second research question, we found significant differences
in the number of reported disease cases from 2000–2008 between urban and rural areas. Rural areas
had a higher incidence of disease compared to urban areas. Cryptosporidiosis and giardiasis were both
significantly and positively correlated urban area, population size and population density.
3.3. Lessons Learned: Implications for Management
Managing human health risks from Cryptosporidium and Giardia has been largely reactionary.
In Michigan, the current strategy for managing these pathogens has been driven by federal regulations
for drinking water systems and responses to outbreaks. Federal regulation in the US was spurred by the
Cryptosporidium outbreaks in Milwaukee, Wisconsin and Carrolton, Georgia [42]. One result was
creation of the LT2 rule and monitoring program. A similar pattern was described in the UK by
Austin et al. [43], where evolving management practices for Cryptosporidium were triggered by high
profile outbreaks which in turn triggered regulation. The additional regulation spurred advances in
technological methods for monitoring Cryptosporidium that ultimately provided information necessary
for improved risk management [43]. The monitoring results provided managers with information
regarding how frequent raw water samples tested positive, where source waters tested positive, and
uncovered uncertainties related to risk such as if positive samples were infectious to humans. These
results informed risk assessments and development of water safety plans [43]. The authors conclude
that continuous assessment and improvement in decision-making is required to prevent the negative
health and social effects of disease [43]. Central to this improvement in decision-making for
Cryptosporidium and Giardia is access to data and information regarding where the threats are and
how best to manage them.
Our limited analysis reveals that surface waters in rural areas have a higher occurrence of positive
samples and a greater number of disease cases. However, transmission through exposure to
contaminated surface water, animals, animal wastes/manure and septage or septic tank discharges was
not revealed. Oocysts and cysts have limited movement in soils and groundwater aquifers; however,
our understanding of risks due to groundwater contamination is limited by the paucity of information
collected from wells. Exposure to contaminated surface water in these rural environments is a known
risk, as demonstrated by a recent outbreak of cryptosporidiosis in firefighters who were exposed to
pond water that tested positive for Cryptosporidium [31]. Greater treatment of manure and septage
may be warranted to limit contamination of waters in rural environments used for livestock and
irrigation. Heat and composting are effective against oocysts and cysts compared to high lime pH
treatment [44–46].
A greater understanding of the quality of groundwater in rural environments is needed. In
Michigan, there are no requirements for water quality testing of private wells beyond those required
during well construction. The MDEQ, MDCH, and local health departments rely on public education
programs for private well owners and recommend testing well water annually for coliform bacteria or
if color, odor or taste abruptly changes. However, it is unclear if or how often private well owners test
their wells. Community water systems in rural areas are regulated by the Safe Drinking Water Act, but
they are often small (serve less than 3300 people) or very small systems (serve less than 500 people)
with limited financial and human resources. These conditions are exacerbated by a general lack of

Int. J. Environ. Res. Public Health 2014, 11 10497
resources in rural areas. Rural counties in Michigan have higher percentages of unemployment and
poverty compared to urban counties [18]. Comprehensive monitoring using expensive tests, such as
those required for Cryptosporidium and Giardia, is not a feasible option for many private well owners
and rural community water systems that lack financial and technical resources.
Our analysis also found key gaps in available water quality data. In order to fill data gaps and
provide technical assistance to rural areas, a comprehensive monitoring strategy for Cryptosporidium
and Giardia is needed. Because such an effort is likely to be resource-intensive, we recommend the
use of GIS to identify sampling sites in areas that currently lack data or in areas experiencing high
incidence of disease. Monitoring efforts should prioritize groundwater and rural areas given the higher
number of disease cases and higher number of positive samples in rural areas. We also encourage the
use and development of new monitoring technologies that reduce monitoring costs and provide critical
information, such as genotype and infectivity in addition to presence/absence.
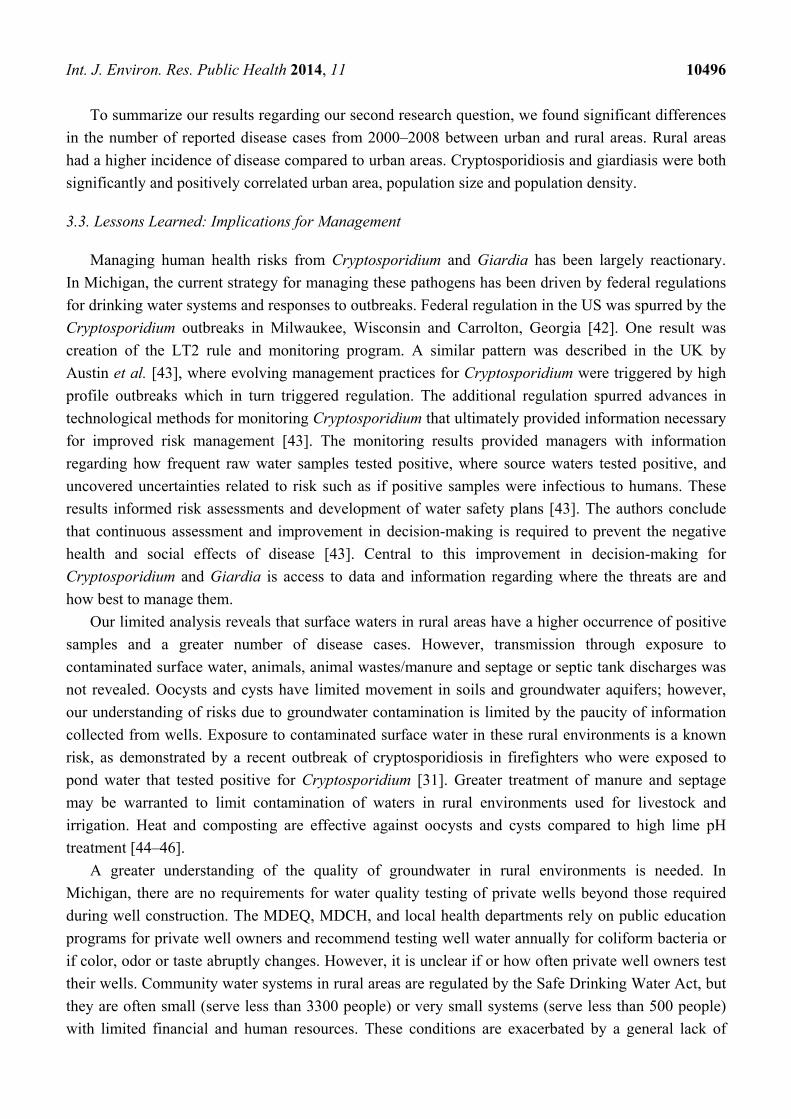
In addition to monitoring in order to fill data gaps, we recommend creating an easily-accessible,
online knowledge hub for information sharing to support management and communication at multiple
levels (Figure 6). Ideally, the knowledge hub would be a spatial database that includes environmental
data, water monitoring data, and disease reporting and epidemiological data for the state. As with
many jurisdictions, databases for each of these types of data currently exist; however, they are not
linked. Exploring relationships among environmental, water quality and disease data can provide
insight for risk management. For example, a Wisconsin study that used epidemiological data,
landscape information based on public records, and water quality data demonstrated that septic system
holding tank density in a rural area is a risk factor for diarrheal disease in children [47]. Our own case
study also demonstrated how GIS-based analysis can help identify relationships between disease and
landscape variables to help target management. A knowledge hub would potentially improve data
sharing and provide information for decision-making, particularly at lower levels of government and in
rural areas without the capacity to create such a resource for their own jurisdictions. Michigan already
has a web-based system, Michigan BeachGuard [48], which is used for recreational water quality data
that could serve as a model. The MDEQ maintains and manages the online database, which they use to
assess beach water quality and attainment of water quality standards. Data are uploaded by local health
departments through a secure site on BeachGuard. The public can also log onto the system to gain
information on beach closures and access historical data. The knowledge hub could operate in a similar
fashion, in which the state, or those in the tactical policy level, manages the database and those in the
operational policy level input and/or export information (Figure 6). The tactical policy level would also
have ready access to information in the knowledge hub to report to and inform groups in the strategic
level. Thus, the system could facilitate information sharing while supporting management duties at
multiple levels. Such a resource could also assist in filling the current management gap regarding
private well owners by providing information on disease and pathogen occurrence. For example, a
private well owner might log into the system to access maps showing areas of with positive samples
for Cryptosporidium and Giardia or high disease rates and be able to assess if their own well is located
in a potential hot spot. This may assist them in making more informed decisions about testing their
wells. Finally, a geospatial database would enable managers to examine regional patterns and
potentially move to regional or watershed-based management.
Int. J. Environ. Res. Public Health 2014, 11 10498
Figure 6. Schematic diagram of strategy to create a knowledge hub that facilitates pathways
for data sharing among multiple levels of managers to improve decision-making
for protecting rural water supplies. Knowledge pathways and policy levels based on
Austin et al. [43]. MDEQ = Michigan Department of Environmental Quality; MDCH =
Michigan Department of Community Health.
To summarize, our analysis highlights the need to identify potential risks and create mechanisms to
improve information gathering and sharing to protect rural water supplies. Because we found that
surface waters in rural areas have a higher prevalence of parasite contamination and greater disease
incidence, policies that require or promote greater treatment of manure and septage may be warranted
to protect human and animal health. We also identified several major data gaps, including lack of
information about the quality of groundwater in rural environments and lack of comprehensive spatial
and temporal data. In order to fill data gaps and provide technical assistance to rural areas, a
comprehensive monitoring strategy that incorporates and links environmental data, disease data, and
water quality data in a spatial database is needed. We recommend creating an easily-accessible, online
knowledge hub for information sharing to support management and communication at multiple levels
(Figure 6).
4. Conclusions
We compiled all known sources of Cryptosporidium and Giardia data available for the state of
Michigan to explore differences between urban and rural areas. Cryptosporidium and Giardia were
more commonly found in samples from rural areas and in surface water. Only one groundwater sample
tested positive for Giardia; however, the number of groundwater samples was limited. Rural areas had

Int. J. Environ. Res. Public Health 2014, 11 10499
a higher incidence of cryptosporidiosis and giardiasis compared to urban areas. There is a need for
further monitoring to fill spatial and temporal data gaps regarding the occurrence of Cryptosporidium
and Giardia, particularly in groundwater and in rural environments. Of particular concern is
elucidating the exposure pathways in rural environments in order to design more effective management
strategies.
Rural environments in Michigan, and many areas around the globe, pose a particular concern for
cryptosporidiosis and giardiasis because the majority of residents drink water from untreated drinking
wells. Groundwater sources are typically assumed to be safe, however the total number of cases for
both cryptosporidiosis and giardiasis are higher in rural versus urban environments. A complicating
factor for management is the lack of regulation on private drinking well water quality and the lack of
resources available in rural areas. We recommend a state-wide monitoring strategy and knowledge hub
to share information critical for managing human health risks from Cryptosporidium and Giardia.
Acknowledgments
We thank the Michigan Department of Environmental Quality and Michigan Department of
Community Health for supporting this work. The spatial analyses were funded in part by National
Oceanic and Atmospheric Administration (NOAA) grant #89043. The Michigan Department of
Community Health provided all disease data.
Author Contributions
Erin Dreelin synthesized the available information, analyzed data, interpreted results, and managed
the manuscript. Rebecca Ives, Stephanie Molloy, and Joan Rose designed the studies. Rebecca Ives
conducted Cryptosporidium and Giardia sampling and analysis, created the GIS database, completed
all spatial analyses, and managed all Cryptosporidium and Giardia data. Stephanie Molloy managed
the River Raisin watershed project and conducted genotyping analyses. She performed the work while
a post-doctoral researcher at Michigan State University. Joan Rose conceived of the article and
reviewed all drafts. All authors reviewed and approved the final version.
Conflicts of Interest
The authors declare no conflict of interest.
References
1. Baldursson, S.; Karanis, P. Waterborne transmission of protozoan parasites: Review of worldwide
outbreaks—An update 2004–2010. Water Res. 2011, 45, 6603–6614.
2. Fletcher, S.M.; Stark, D.; Harkness, J.; Ellis, J. Enteric protozoa in the developed world: A public
health perspective. Clin. Microbiol. Rev. 2012, 25, 420–449.
3. Jellison, K.L.; Hemond, H.F.; Schauer, D.B. Sources and species of Cryptosporidium oocysts in
the Wachusett Reservoir watershed. Appl. Environ. Microbiol. 2002, 68, 569–575.

Int. J. Environ. Res. Public Health 2014, 11 10500
4. Feng, Y.; Alderisio, K.A.; Yang, W.; Blancero, L.A.; Kuhne, W.G.; Nadareski, C.A.; Reid, M.;
Xiao, L. Cryptosporidium genotypes in wildlife from a New York watershed. Appl. Environ.
Microbiol. 2007, 73, 6475–6483.
5. Hunter, P.R.; Thompson, R.C.A. The zoonotic transmission of Giardia and Cryptosporidium.
Int. J. Parasitol. 2005, 35, 1181–1190.
6. Wilkes, G.; Ruecker, N.J.; Neumann, N.F.; Gannon, V.P.J.; Jokinen, C.; Sunohara, M.; Topp, E.;
Pintar, K.D.M.; Edge, T.A.; Lapen, D.R. Spatiotemporal analysis of Cryptosporidium
species/genotypes and relationships with other zoonotic pathogens in surface water from
mixed-use watersheds. Appl. Environ. Microbiol. 2013, 79, 434–448.
7. Fuchslin, H.P.; Kotzch, S.; Egli, T. Cryptosporidium spp. in drinking water. Samples from rural
sites in Switzerland. Swiss Med. Wkly. 2012, 142, doi:10.4414/smw.2012.13683.
8. Castro-Hermida, J.A.; Garcia-Presedo, I.; Almeida, A.; Gonzalez-Warleta, M.; Correia Da Costa,
J.M.; Mezo, M. Presence of Cryptosporidium spp. and Giardia duodenalis through drinking
water. Sci. Total Environ. 2008, 405, 45–53.
9. Galvan, A.L.; Magnet, A.; Izquierdo, F.; Vadillo, C.F.; Peralta, R.H.; Angulo, S.; Fenoy, S.;
del Aguila, C. A year-long study of Cryptosporidium species and subtypes in recreational,
drinking and wastewater from the central area of Spain. Sci. Total Environ. 2014, 468, 368–375.
10. Plutzer, J.; Tako, M.H.; Marialigeti, K.; Torokne, A.; Karanis, P. First investigations into the
prevalence of Cryptosporidium and Giardia spp. in Hungarian drinking water. J. Water Health
2007, 5, 573–584.
11. Feng, Y.; Zhao, X.; Chen, J.; Jin, W.; Zhou, X.; Li, N.; Wang, L.; Xiao, L. Occurrence, source,
and human infection potential of Cryptosporidium and Giardia spp. in source and tap water in
Shanghai, China. Appl. Environ. Microbiol. 2011, 77, 3069–3616.
12. Mons, C.; Dumetre, A.; Gosselin, S.; Galliot, C.; Moulin, L. Monitoring of Cryptosporidium and
Giardia river contamination in Paris area. Water Res. 2009, 43, 211–217.
13. Pollock, K.G.J.; Ternent, H.E.; Mellor, D.J.; Chalmers, R.M.; Smith, H.V.; Ramsay, C.N.;
Innocent, G.T. Spatial and temporal epidemiology of sporadic human cryptosporidiosis in
Scotland. Zoonoses Public Health 2010, 57, 487–492.
14. Lake, I.R.; Nichols, G.; Harrison, F.C.D.; Bentham, G.; Sari Kovats, R.; Grundy, C.; Hunter, P.R.
Using infectious intestinal disease surveillance data to explore illness aetiology; A
cryptosporidiosis case study. Health Place 2009, 15, 333–339.
15. Odoi, A.; Martin, S.W.; Michel, P.; Middleton, D.; Holt, J.; Wilson, J. Investigation of
clusters of giardiasis using GIS and a spatial scan statistic. Int. J. Health Geogr. 2004, 3,
doi:10.1186/1476-072X-3-11
16. US Census Bureau US Census Bureau. Available online: www.census.gov/ (accessed on 10
July 2014).
17. Donovan, M.L.; Nesslage, G.M.; Skillen, J.J.; Maurer, B.A. The Michigan Gap Analysis Project
Final Report 2004. Available online: www.fw.msu.edu/~maurerb/gap/report.html (accessed on 19
September 2014).
Int. J. Environ. Res. Public Health 2014, 11 10501
18. Michigan Department of Community Health Michigan Rural Health Profile: A Report on
the Health Trends and Resources of Rural Michigan 1990–2005. Available online:
www.michigan.gov/documents/mdch/MichiganRuralHealthProfile-2008-0801_243955_7.pdf
(accessed on 19 September 2014).
19. Michigan Department of Environmental Quality DEQ—Drinking Water. Available online:
www.michigan.gov/deq/0,4561,7-135-3313_3675---,00.html (accessed on 10 July 2014).
20. US EPA, Office of Water. Safe Drinking Water Information System. Available online:
http://water.epa.gov/scitech/datait/databases/drink/sdwisfed/index.cfm (accessed on 10 July 2014).
21. Michigan Department of Community Health Reportable Infections Diseases in
Michigan 2003–2007 Summary 2008. Available online: www.michigan.gov/documents/mdch/
Final_Reportable_ID_2003_to_2007_Summary_251984_7.pdf (accessed on 19 September 2014).
22. Yoder, J.S.; Wallace, R.M.; Collier, S.A.; Beach, M.J.; Hlavsa, M.C. Cryptosporidiosis
surveillance—United States, 2009–2010. MMWR Surveill. Summ. 2012, 61, 1–12.
23. Furness, B.W.; Beach, M.J.; Roberts, J.M. Giardiasis Surveillance—United States, 1992–1997.
MMWR Surveill. Summ. 2000, 49, 1–13.
24. Hlavsa, M.C.; Watson, J.C.; Beach, M.J. Cryptosporidiosis surveillance—United States
1999–2002. MMWR Surveill. Summ. 2005, 54, 1–8.
25. US EPA. LT2 Rule. Available online: http://water.epa.gov/lawsregs/rulesregs/sdwa/lt2/
regulations.cfm#lt2data (accessed on 10 July 2014).
26. US EPA. Method 1622: Cryptosporidium in Water by Filtration/IMS/FA. 2005. EPA 815-R-05-001.
Available online: http://nepis.epa.gov/Adobe/PDF/P100997Q.PDF (accessed on 10 July 2014).
27. US EPA. Method 1623: Cryptosporidium and Giardia in Water by Filtration/IMS/FA. 2005. EPA
815-R-05-002. Available online: http://water.epa.gov/scitech/methods/cwa/bioindicators/upload/
method_1623.pdf (accessed on 10 July 2014).
28. US EPA, Region 5. River Raisin. Available online: http://epa.gov/greatlakes/aoc/river-raisin/
index.html (accessed on 28 July 2014).
29. Singh, S. Investigation of Bacterial Fecal Indicators and Coliphage Virus in Sediment and
Surface Water of Parks and Beaches along the Grand River (Michigan) and Lake Michigan
(Michigan); Michigan State University: East Lansing, MI, USA, 2007.
30. Ives, R.L. Giardiasis and Cryptosporidiosis in the Urban-Rural Spectrum; Michigan State
University: East Lansing, MI, USA, 2011.
31. Wilczynski, J.A.; Ives, R.; Peters, S.; Henderson, T.; House, J.; Hill, V.; Schneeberger, C.;
Xiao, L.; Dearen, T.; Webeck, J. Outbreak of cyptosporidiosis associated with a firefighting
response—Indiana and Michigan, June 2011. Morb. Mortal. Wkly. Rep. 2012, 61, 153–156.
32. Slifko, T.R.; Huffman, D.E.; Rose, J.B. A most-probable-number assay for enumeration of
infectious Cryptosporidium parvum oocysts. Appl. Environ. Microbiol. 1999, 65, 3936–3941.
33. Xiao, L.H.; Escalante, L.; Yang, C.F.; Sulaiman, I.; Escalante, A.A.; Montali, R.J.; Fayer, R.;
Lal, A.A. Phylogenetic analysis of Cryptosporidium parasites based on the small-subunit rRNA
gene locus. Appl. Environ. Microbiol. 1999, 65, 1578–1583.
34. Xiao, L.H.; Alderisio, K.; Limor, J.; Royer, M.; Lal, A.A. Identification of species and sources of
Cryptosporidium oocysts in storm waters with a small-subunit rRNA-based diagnostic and
genotyping tool. Appl. Environ. Microbiol. 2000, 66, 5492–5498.

Int. J. Environ. Res. Public Health 2014, 11 10502
35. Sulaiman, I.M.; Xiao, L.H.; Yang, C.F.; Escalante, L.; Moore, A.; Beard, C.B.; Arrowood, M.J.;
Lal, A.A. Differentiating human from animal isolates of Cryptosporidium parvum. Emerg. Infect.
Dis. 1998, 4, 681–685.
36. Peng, M.M.; Xiao, L.H.; Freeman, A.R.; Arrowood, M.J.; Escalante, A.A.; Weltman, A.C.;
Ong, C.S.L.; MacKenzie, W.R.; Lal, A.A.; Beard, C.B. Genetic polymorphism among
Cryptosporidium parvum isolates: Evidence of two distinct human transmission cycles. Emerg.
Infect. Dis. 1997, 3, 567–573.
37. Lindsay, D.S.; Upton, S.J.; Owens, D.S.; Morgan, U.M.; Mead, J.R.; Blagburn, B.L.
Cryptosporidium andersoni n. sp (Apicomplexa : Cryptosporiidae) from cattle Bos taurus.
J. Eukaryot. Microbiol. 2000, 47, 91–95.
38. Peng, M.M.; Wilson, M.L.; Holland, R.E.; Meshnick, S.R.; Lal, A.A.; Xiao, L. Genetic diversity
of Cryptosporidium spp. in cattle in Michigan: implications for understanding the transmission
dynamics. Parasitol. Res. 2003, 90, 175–180.
39. Smerdon, W.J.; Nichols, T.; Chalmers, R.M.; Heine, H.; Reacher, M.H. Foot and mouth disease in
livestock and reduced cryptosporidiosis in humans, England and Wales. Emerg. Infect. Dis. 2003,
9, 22–28.
40. Thompson, R.C.A.; Reynoldson, J.A.; Lymbery, A.J. Giardia: from Molecules to Disease; CAB
International: Wallingford, UK, 1994.
41. Lake, I.R.; Harrison, F.C.D.; Chalmers, R.M.; Bentham, G.; Nichols, G.; Hunter, P.R.;
Kovats, R.S.; Grundy, C. Case-control study of environmental and social factors influencing
cryptosporidiosis. Eur. J. Epidemiol. 2007, 22, 805–811.
42. Ongerth, J.E. LT2 Cryptosporidium data: What do they tell us about Cryptosporidium in surface
water in the United States? Environ. Sci. Technol. 2013, 47, 4029–4038.
43. Austin, Z.; Alcock, R.E.; Christley, R.M.; Haygarth, P.M.; Heathwaite, A.L.; Latham, S.M.;
Mort, M.; Oliver, D.M.; Pickup, R.; Wastling, J.M.; Wynne, B. Policy, practice and decision
making for zoonotic disease management: Water and Cryptosporidium. Environ. Int. 2012, 40,
70–78.
44. Van Herk, F.H.; McAllister, T.A.; Cockwill, C.L.; Guselle, N.; Larney, F.J.; Miller, J.J.;
Olson, M.E. Inactivation of Giardia cysts and Cryptosporidium oocysts in beef feedlot manure by
thermophilic windrow composting. Compost Sci. Util. 2004, 12, 235–241.
45. Robertson, L.J.; Campbell, A.T.; Smith, H.V. Survival of Cryptosporidium parvum oocysts under
various environmental pressures. Appl. Environ. Microbiol. 1992, 58, 3494–3500.
46. Zintl, A.; Keogh, B.; Ezzaty-Mirhashemi, M.; De Waal, T.; Scholz, D.; Mulcahy, G. Survival of
Cryptosporidium parvum oocysts in the presence of hydrated lime. Vet. Rec. 2010, 166, 297–300.
47. Borchardt, M.A.; Chyou, P.H.; DeVries, E.O.; Belongia, E.A. Septic system density and
infectious diarrhea in a defined population of children. Environ. Health Perspect. 2003, 111,
742–748.

Int. J. Environ. Res. Public Health 2014, 11 10503
48. Michigan Department of Environmental Quality Michigan BeachGuard System—Home.
Available online: www.deq.state.mi.us/beach/Default.aspx (accessed on 15 July 2014).
© 2014 by the authors; licensee MDPI, Basel, Switzerland. This article is an open access article
distributed under the terms and conditions of the Creative Commons Attribution license
(http://creativecommons.org/licenses/by/4.0/).


![Prevalence of Cryptosporidium and Giardia lamblia in Water ...cyst of Cryptosporidium and Giardia lamblia as described earlier [16,17]. Oocysts in the specimens are usually difficult](https://img.pdfslide.net/doc/110x75/6035961b3d575467871f6698/prevalence-of-cryptosporidium-and-giardia-lamblia-in-water-cyst-of-cryptosporidium.jpg)