Embed Size (px)
Citation preview

CTBTO radionuclide detections in the aftermath of Fukushima and a necessity for improved source inversion algorithms
International Workshop
CTBTO Page 1
on Source Term Reconstruction Methods
for Estimating the Atmospheric Radiation Release
from the Fukushima Daiichi Nuclear Power Plant
Monika Krysta1 and John Coyne21Atmospheric Sciences Officer, IDC/OD2Programme and Project Coordinator, IDC/OD
Preparatory Commission for the Comprehensive Nuclear-Test-Ban Treaty OrganizationVienna International CentreP.O. Box 1200A-1400 ViennaAUSTRIA
22 February 2012

• CTBTO
• Radionuclide network, measurement technology and
atmospheric transport modelling in support of radionuclide
measurements
Outline
CTBTO Page 2
• Source location method
• Fukushima detections by the International Monitoring System
of CTBTO
• vDEC platform
22 February 2012

CTBT (Comprehensive Nuclear-Test-Ban Treaty) bans all nuclear explosions
CTBTO(Comprehensive Nuclear-Test-Ban Treaty Organization) operates a system
(International Monitoring System) monitoring compliance with the CTBT
Monitoring based on four technologies
Seismic Infrasound Hydroacoustic Radionuclide
Atmospheric explosion
CTBTO
CTBTO 22 February2012 Page 3
Atmospheric explosion
Underground explosion
Underwater explosion

RN station locations of the International Monitoring System
(79 of 80 currently determined)
Network performance:
Detect debris from a 1 kt nuclear explosion within 14 days of an event with 90 % probability
CTBTO: IMS radionuclide network
CTBTO Page 4
All stations will be equipped with an aerosol sampling system(high volume sampling) and high-purity Germanium detectors
50% of the stations will, in addition, be equipped with a noble gas sampling system
22 February 2012
Radionuclide technology:Particulate sampling station
Compressed Filter
Compressed Filter
IDC
VSAT
AIR
Filter
CTBTO Page 5
AIR
SAMPLER
Inlet
Outlet
GAMMA
DETECTOR
DECAY
CHAMBER
VSAT
ANTENNA
COMPUTER &
ELECTRONICS
22 February 2012Slide courtesy: Mika Nikkinen
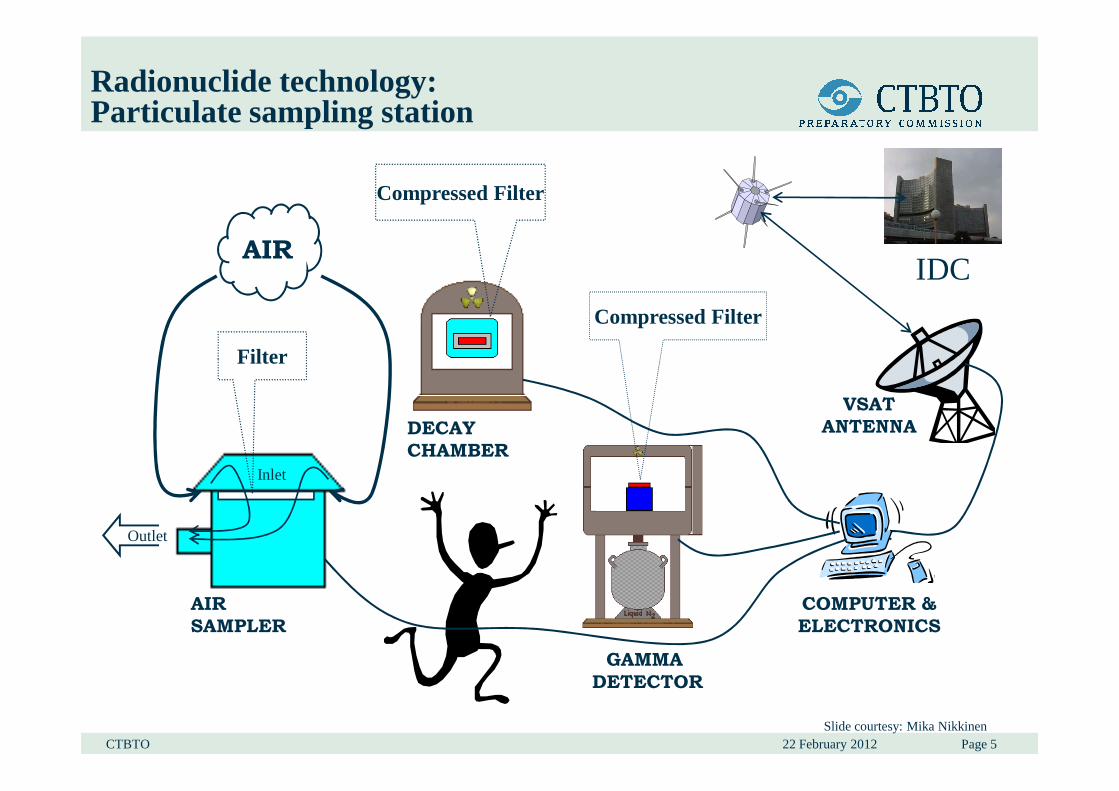
Number of γ-photons collected in the detector
What radionuclides and how much are in the sample?
What energy do they have?
Example of station sample spectra
CTBTO Page 6Slide courtesy: Mika Nikkinen

• or or
is specific to each radionuclide sample
• A retro-plume is simulated by running an atmospheric transport model backward
in time with “releases” corresponding to radionuclide samples
• SRS translates any release at position i,j and transport time from source
Source receptor relationship concept
dilution factor field [m-3]
grid point
Source Receptor Sensitivity (SRS) field retro-plumeijnkM
Page 7
• SRS translates any release at position i,j and transport time from source
to receptor n [Bq] into the activity concentration ck [Bqm-3] for the kth sample :
ijnSijnijnkk SMc ⋅=ijnkM
grid point
22 February 2012CTBTOSlide courtesy: Andreas Becker
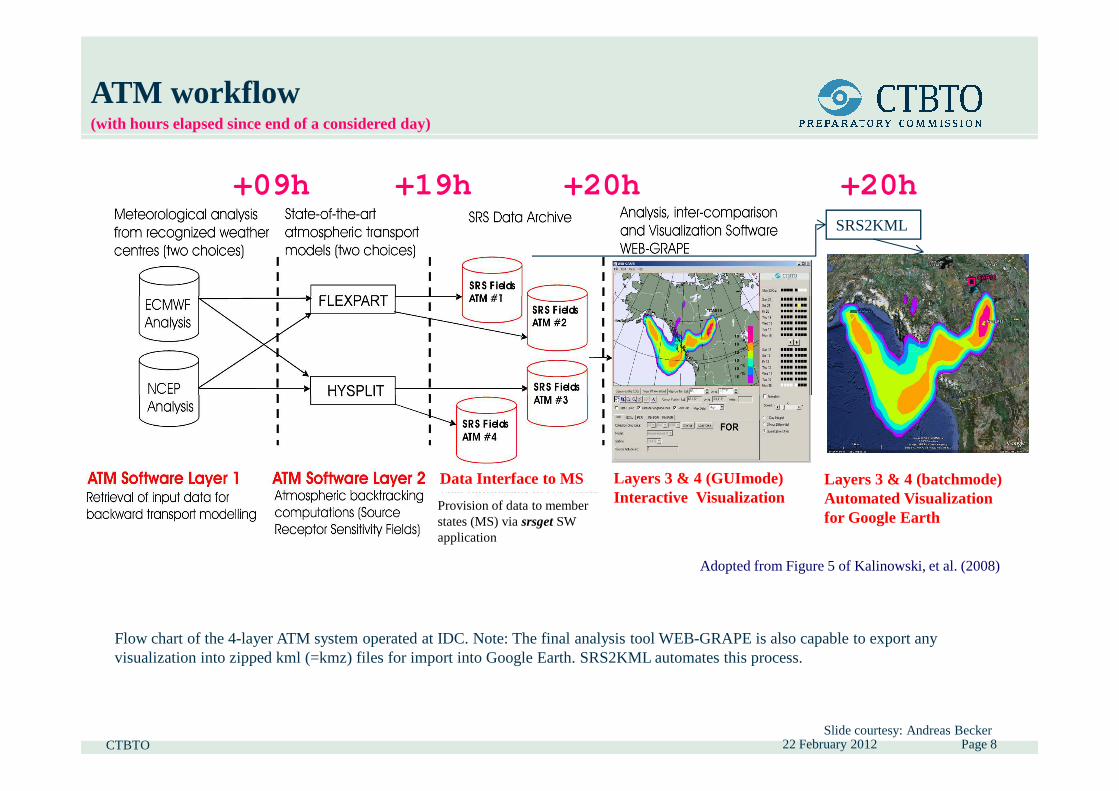
ATM workflow(with hours elapsed since end of a considered day)
+09h +19h +20h +20hSRS2KML
Flow chart of the 4-layer ATM system operated at IDC. Note: The final analysis tool WEB-GRAPE is also capable to export any visualization into zipped kml (=kmz) files for import into Google Earth. SRS2KML automates this process.
Adopted from Figure 5 of Kalinowski, et al. (2008)
Data Interface to MS
Provision of data to member states (MS) via srsget SW application
Layers 3 & 4 (GUImode)Interactive Visualization
Layers 3 & 4 (batchmode)Automated Visualizationfor Google Earth
22 February 2012CTBTO Page 8Slide courtesy: Andreas Becker

Step 1: source hypothesis field S(i,j,n) is folded for each sample with the related
SRS field Mk yielding a vector of calculated concentrations for the k stations
affected:
Step 2: For each of the geo-temporal source possibilities (permutations of i,j,n)
Source Location Algorithm
[ ] ijnkijnijnk SMSc ⋅=(1)
Page 9
Step 2: For each of the geo-temporal source possibilities (permutations of i,j,n)
a regression of the calculated vector elements ck[S(i,j,n)] against the vector of
the k measurements mk according to equation (2) yields the so-called “Possible
Source Region”, in terms of a geo-spatial distribution of correlation coefficients:
][0 ijnkijnk ScPSRcm ⋅+=(2)
The geo-temporal location of max[PSR(i,j,n)] is then the location where the
single grid cell source S(i,j,n) would cause calculated concentrations ck at the k
stations being most consistent with the vector of actually measured ones, mk.
22 February 2012CTBTOSlide courtesy: Andreas Becker

WEB-GRAPE is a piece of software that can be used to analyze the relation between a detection in the radionuclide network and possible emission points on the globe.
The WEB-GRAPE utilizes dispersion calculations at the CTBTO to conveniently make interactive map products on demand.
All ATM Products can be generated by ONE software: WEB-GRAPE
CTBTO Page 10
demand.
It also provides a fusion function as waveform error ellipses can be co-displayed for the corresponding time slices.
Also co-display of other potential nuclear sources can be configured.
22 February 2012
Slide courtesy: Andreas Becker

CTBTO: why interest in source location methods?• CTBTO provides a set of independent data (monitoring) but CTBT
verification is in the hands of States Signatories
• CTBTO is responsible for enhancing characterization of verification
parameters. Contribution of non Treaty-relevant sources of radionuclides needs
to be assessed
• The known sources originate mainly from emissions of noble gases by the
radiopharmaceutical industry. And those emissions are not precisely known
CTBTO Page 1122 February 2012
radiopharmaceutical industry. And those emissions are not precisely known
• Need to infer as much source information as possible from the radionuclide
detections in conjunction with an atmospheric transport model
• Need to perform source reconstruction – location and strength (quantity of
the released material)
• May also need to have an upper boundary for a potential non-detected
release

This series of events was tragic, but unprecedented all-inclusive stress test of
data gathering, processing, and distribution:
• Seismic detection of Earthquake of magnitude nine March 11 2011 and subsequent ten thousand aftershocks
• Hydroacoustic detection showing the rupture forming under the sea
Effects of Earthquake, Tsunami, and Fukushima NPP in CTBTO network
CTBTO
• Infrasound detections showing the explosions in the Fukushima NPP
• Subsequent radioactivity measurements in all the particulate and noble gas stations in the Northern Hemisphere and some in the Southern Hemisphere
• Atmospheric transport modeling played an important role as there was a need to see which stations are going to be affected by the release
22 February 2012 Page 12

Seismic: Japan earthquake 11 March 2011, Magnitude 9 earthquake and 9800 aftershocks
CTBTO
Slide courtesy: Spilio Spiliopulos
22 February 2012 Page 13

Hydroacoustics: evidence of fault ruptureafter 11 March 2011 earthquake
Plot shows arrival angle versus time, measured at Wake Island hydroacoustic station, during reception of T-phase from main event
Epicentre is at 316 degrees, variation from 312 to 317 degrees
★
CTBTO
Slide courtesy: Mark Prior
22 February 2012 Page 14

Infrasound: evidence of 11 March 2011 earthquake and 12 March 2011 NPP explosion
Up to 07:18
Infrasound signals generated in Japan on 11. March 2011 by earthquakes and tsunami as seen at I44RU (Kamchatka).
Up to 08:15
Detection of explosion at Fukushima Nuclear Power Plant
CTBTOSlide courtesy: Pierrick Mialle
22 February 2012 Page 15

Dynamics of particulate network detectionsoriginating from Fukushima This picture show time development of detections for each day after the accident. Level 5 Level 5 = multiple fission products detected, Level 4Level 4 = one fission product detected, Level 3 Level 3 = fission products typical for the station detectedLevel 1 and 2 Level 1 and 2 = only natural radioactivity detected
CTBTO Page 1622 February 2012Slide courtesy: Abdelhakim Gheddou

Atmospheric transport model (ATM) for the releaseATM simulations for Fukushima
CTBTO 22 February 2012 Page 17

Particulate network detections.Stations which detected radioactive particles originating from Fukushima
USP71
USP76
USP70 USP75 JPP38
RUP60CAP14
USP78
SEP63
CAP17
CAP15
CAP16
RUP58
ISP34
DEP33
RUP59RUP61
MNP45
NOP49
RUP54
CNP20
Network availability90-95%
All these stations detectedat least radioactiveiodine from Fukushima
USP79
USP70 USP74 USP75
USP77
JPP38USP78
USP80
MXP44 USP72
KIP39
JPP37KWP40PTP53
PHP52MRP43FRP28
PAP50
CMP13FRP31
PGP51
CNP21CNP20
FJP26
MYP42
from Fukushimain March and April2011
CTBTOSlide courtesy: Mika Nikkinen
22 February 2012 Page 18

USX74 USX75
CAX05
JPX38
Noble gas network detections.Stations which detected radioactivexenon originating from Fukushima
NOX49
SEX63
DEX33RUX58
CAX16
CAX17
MNX45
CNX20
Networkavailability85-90%
All these stations detectedat least radioactiveXe-133From Fukushimain March and AprilUSX79 USX77
CNX22PAX50 FRX31
AUX09
in March and April2011
BRX11
CTBTOSlide courtesy: Mika Nikkinen
22 February 2012 Page 19
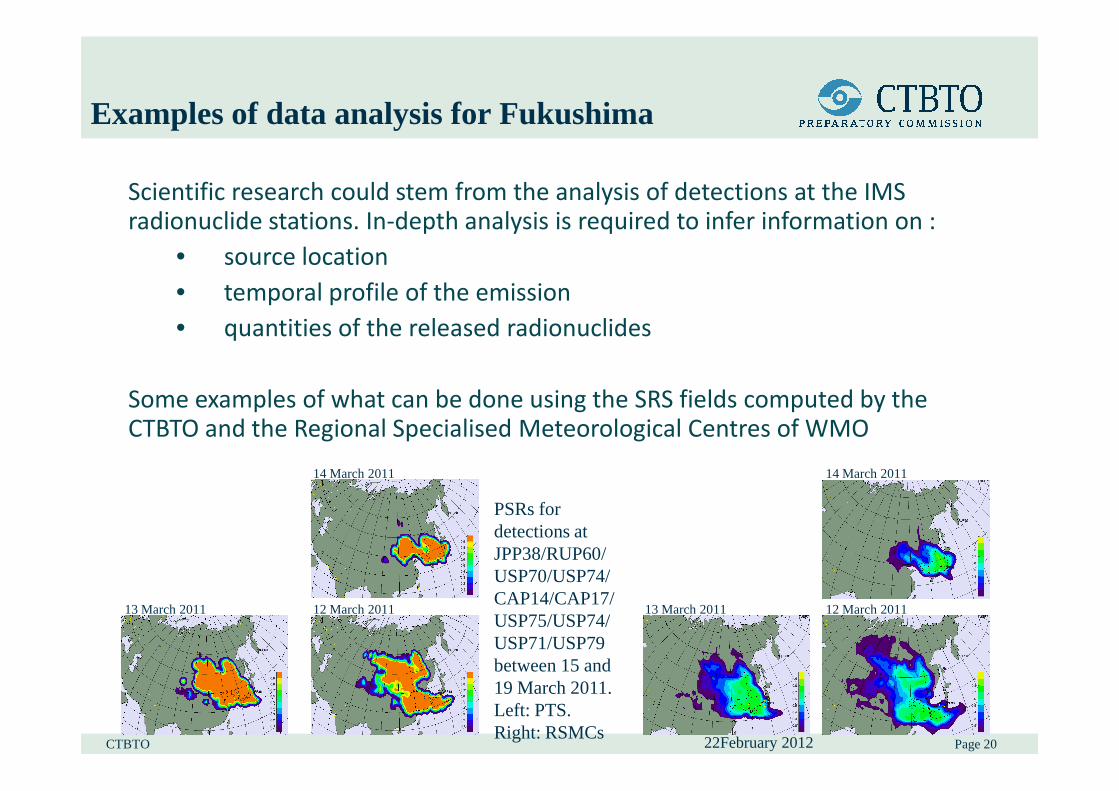
Scientific research could stem from the analysis of detections at the IMS
radionuclide stations. In-depth analysis is required to infer information on :
• source location
• temporal profile of the emission
• quantities of the released radionuclides
Some examples of what can be done using the SRS fields computed by the
Examples of data analysis for Fukushima
CTBTO Page 20
Some examples of what can be done using the SRS fields computed by the
CTBTO and the Regional Specialised Meteorological Centres of WMO
22February 2012
PSRs for detections at JPP38/RUP60/USP70/USP74/CAP14/CAP17/USP75/USP74/USP71/USP79 between 15 and 19 March 2011. Left: PTS. Right: RSMCs
14 March 2011
13 March 2011 12 March 2011
14 March 2011
13 March 2011 12 March 2011

Example of data analysis for Fukushima
PSRs for detections at JPP38 between 15 and 19 March 2011. Left: CTBTO.
14 March 201115 March 2011
13 March 2011 12 March 2011
15 March 2011 14 March 2011
13 March 2011 12 March 2011
CTBTO Page 2122 February 2012
PSRs for detections at USP70 between 15 and 19 March 2011. Left: CTBTO. Right: RSMCs
CTBTO. Right: RSMCs15 March 2011 14 March 2011
13 March 2011 12 March 2011
15 March 2011 14 March 2011
13 March 2011 12 March 2011

virtual Data Exploitation Centre (virtual Data Exploitation Centre (vDECvDEC) ) Establishment ProjectEstablishment Project• Purpose
• Provide a mechanism for a structured partnership and cooperation between the external community (academia, contractors, national institutes, international organizations) and CTBTO
• Mechanism• Virtual machine on powerful cluster of servers made available to users
• Legal framework for zero-cost, confidentiality-bound contracts • CTBTO software and archive installed • Helpdesk available• Collaborative wiki installed• Collaborative wiki installed
• Status• Pilot Project FEI (False Events Identification) used vDEC platform to access data
• FEI software integrated and being tested on the Development LAN• EU Council Decision funds to be used for CTBTO posts (e.g. for vDEC maintenance &
operation)• Currently a few years of waveform data (seismic, hydroacoustic, infrasound)• Three months of radionuclide data (March – May 2011)
22 February 2012 Page 22CTBTO

Access to Access to vDECvDEC
• Automatic access for NDCs
• Access for external Contractors when needed
• Zero-cost contracts
• Any research group can request access with a short proposal justifying the use of the platform
• CTBTO-internal process of evaluation of short proposal in place
• Fourteen requests received for access. Four contracts signed with university groups
• Requests can be sent to [email protected], enquiring about vDEC
CTBTO 22 February 2012 Page 23
CTBTO 22 February 2012 Page 24
Thank You!