Embed Size (px)
Citation preview
Cubans in Florida
Exile and Integration
1
Cuba/Florida Have Long Standing
Relations • Hernando de Soto, governor of Cuba, sailed into Tampa Bay in 1539,
establishing a connection between Cuba and Florida that continues to
this day.
• Spain governed Florida from 1513 to 1763 and then from 1783 to
1821. Became a U.S. territory in 1821.
• During those two intervals of Spanish domination, four Florida
governors were born in Havana.
• Often both colonies shared the same governor.
• In 1763, when England acquired Florida from Spain, most Floridians
escaped to Cuba, where each refugee family received thirty-three
acres of land and a black slave to help them settle on the island.
First Major Flow-1868 Migration
• Colonial insurrection begins on the island
• Beginning of major migration flow that lasts until the 1890s
• Hundreds of thousands traveled US/Cuba in latter third of century.
• Exile (destierro-from desterrar-to uproot) was decisive to ways Cubans arrived at nationality and identity.
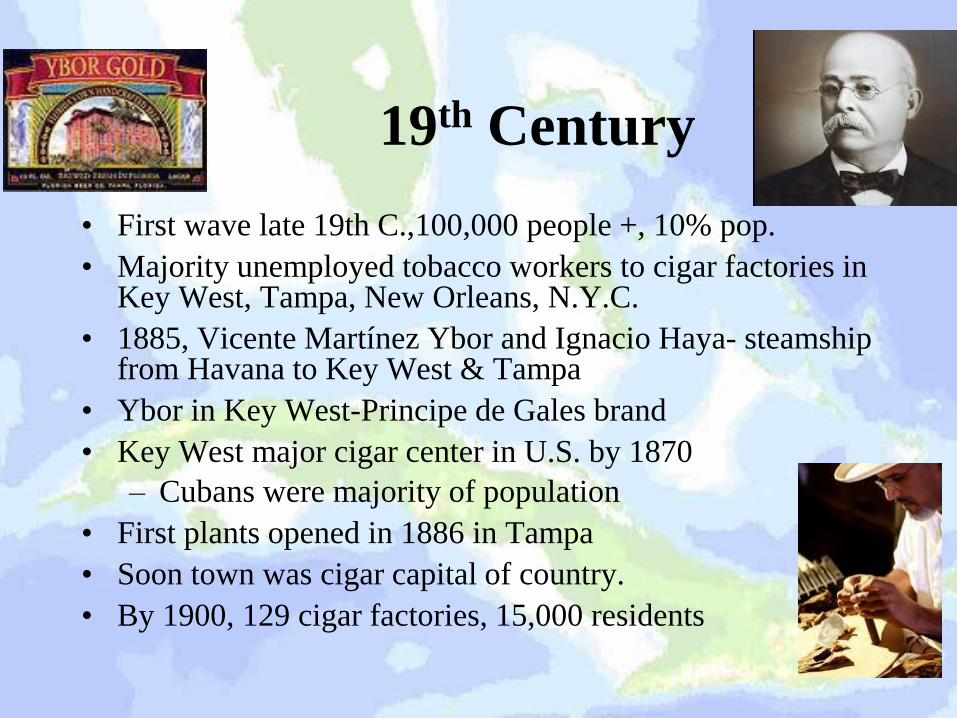
19th Century
• First wave late 19th C.,100,000 people +, 10% pop.
• Majority unemployed tobacco workers to cigar factories in Key West, Tampa, New Orleans, N.Y.C.
• 1885, Vicente Martínez Ybor and Ignacio Haya- steamship from Havana to Key West & Tampa
• Ybor in Key West-Principe de Gales brand
• Key West major cigar center in U.S. by 1870
– Cubans were majority of population
• First plants opened in 1886 in Tampa
• Soon town was cigar capital of country.
• By 1900, 129 cigar factories, 15,000 residents
Diaspora in Key West: 1892
5
“Key West has been built up by Cubans…The people
here look upon Florida as so much a part of their own
country that very often they come here and say ‘I want
to go to the Key,’ just as in Baltimore they would say,
‘I am going over to Washington.’”
---Ramon Williams, U.S. consul in Havana, 1892
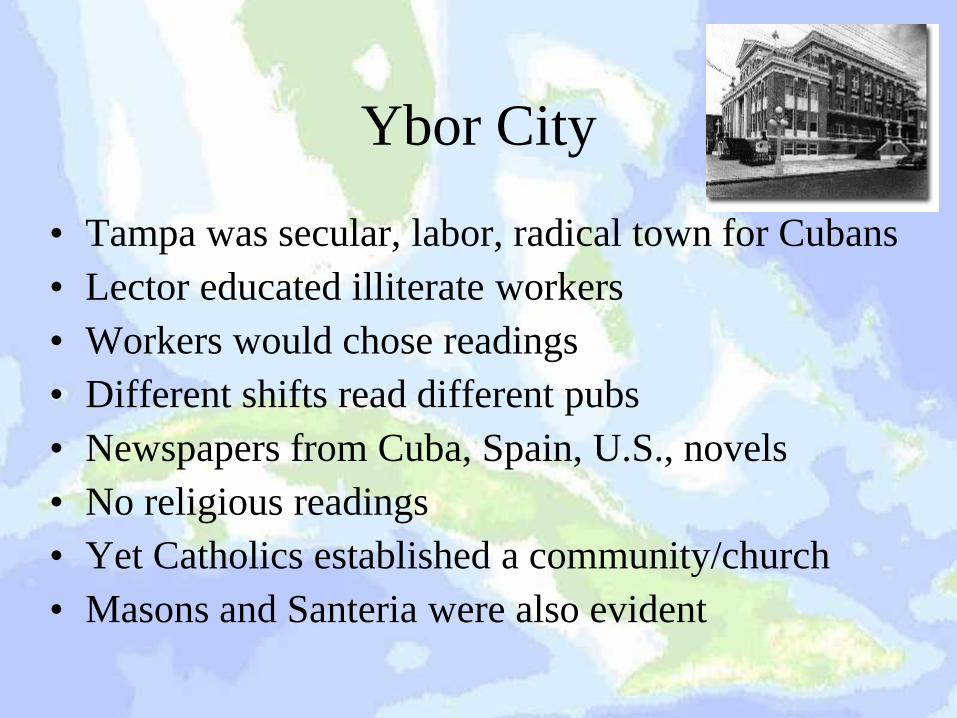
Ybor City
• Tampa was secular, labor, radical town for Cubans
• Lector educated illiterate workers
• Workers would chose readings
• Different shifts read different pubs
• Newspapers from Cuba, Spain, U.S., novels
• No religious readings
• Yet Catholics established a community/church
• Masons and Santeria were also evident
Diaspora in Tampa: 1897
7
“He who passes along Seventh Avenue or 14th Street
would not believe that he is in the United States, for such
is the large number of Cubans that one meets and the
many business establishements of all kinds that one sees
in which all signs are only in Spanish.”
--Carlos M. Trelles, “A Tampa,” Cuba y America
Cubans Travel North Through Out 19th
and Early 20th Century • Business links
• Brought human resources that transformed communities (Key
West/Tampa/Ocala/etc.)
• Worked in American companies
– Manufacturing
– Services
– Professional
• Transformed Cuban social structure
– Creoles gained power
– Sent children to be educated; by the thousands.
– Colonial education did not meet needs of Creoles
– Schools were “instruments of Americanization”
– Attained status and were prepared for changes occurring
Settlement in U.S. was a strategy
for securing civil liberties in Cuba
• Many would become US residents and
return with US protection.
• For property owners, US citizenship
provided protection against land seizures
• U.S. citizenship/residency protected
insurgents during the wars for independence
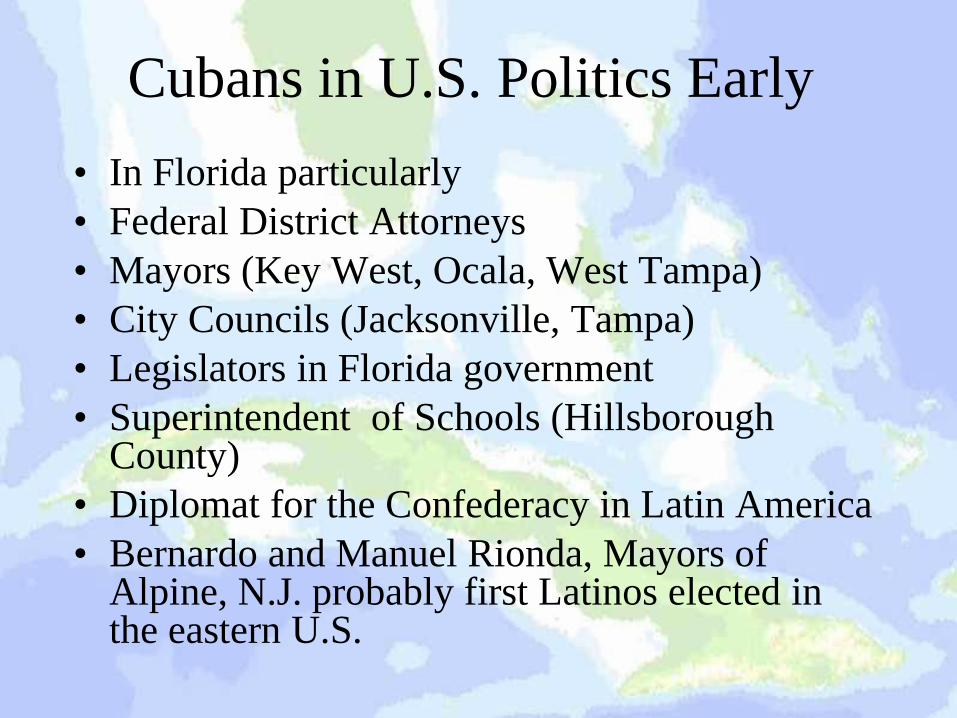
Cubans in U.S. Politics Early
• In Florida particularly
• Federal District Attorneys
• Mayors (Key West, Ocala, West Tampa)
• City Councils (Jacksonville, Tampa)
• Legislators in Florida government
• Superintendent of Schools (Hillsborough County)
• Diplomat for the Confederacy in Latin America
• Bernardo and Manuel Rionda, Mayors of Alpine, N.J. probably first Latinos elected in the eastern U.S.
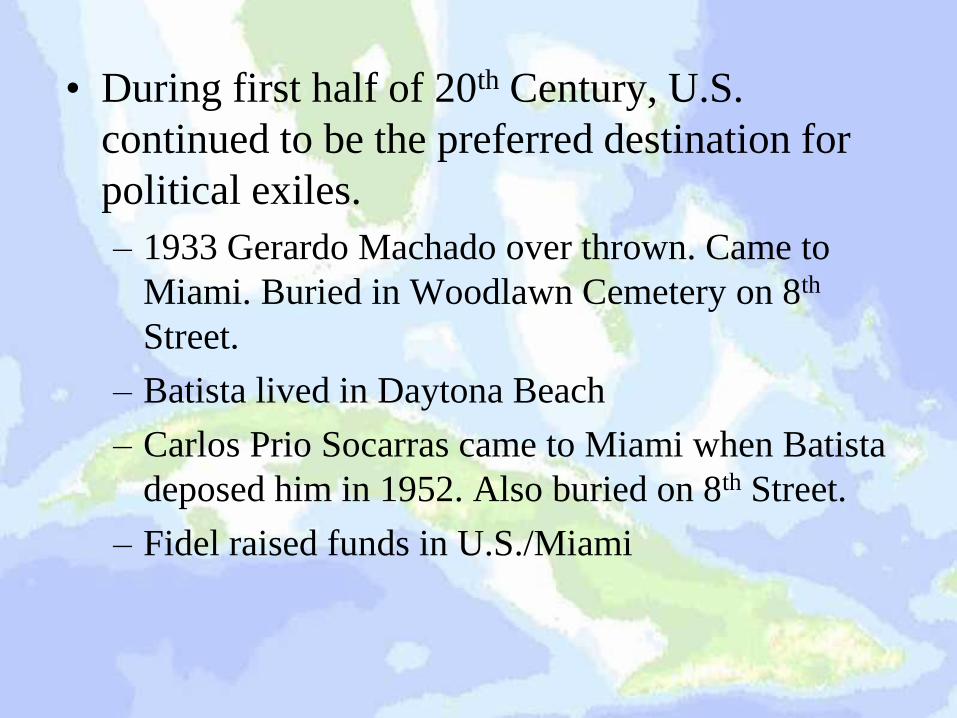
• During first half of 20th Century, U.S.
continued to be the preferred destination for
political exiles.
– 1933 Gerardo Machado over thrown. Came to
Miami. Buried in Woodlawn Cemetery on 8th
Street.
– Batista lived in Daytona Beach
– Carlos Prio Socarras came to Miami when Batista
deposed him in 1952. Also buried on 8th Street.
– Fidel raised funds in U.S./Miami
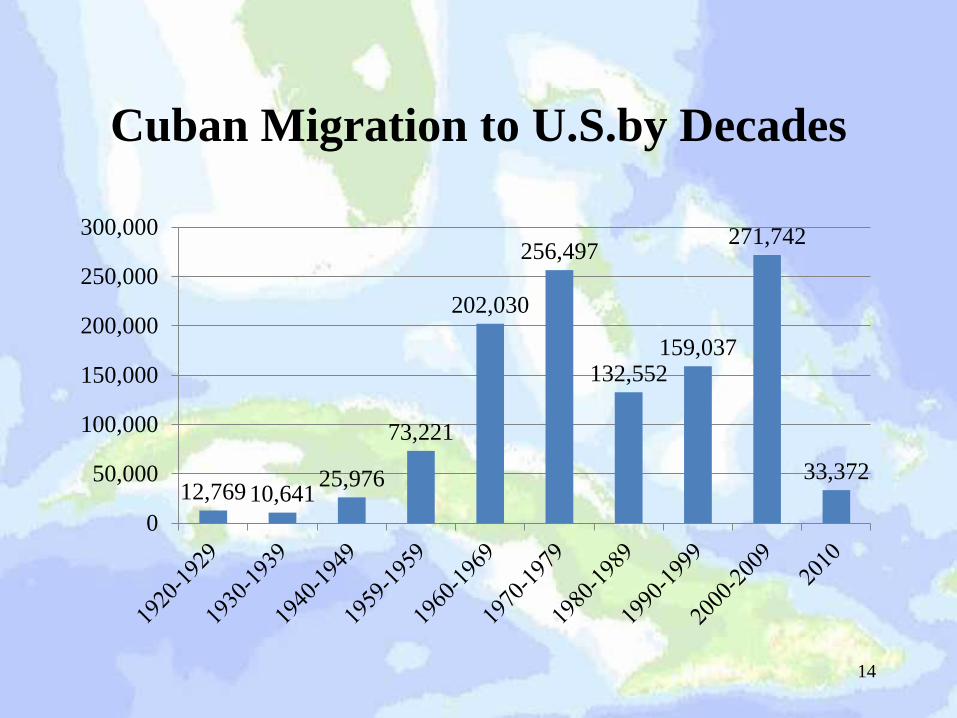
Cuban Migration to U.S.by Decades
12,769 10,641 25,976
73,221
202,030
256,497
132,552 159,037
271,742
33,372
0
50,000
100,000
150,000
200,000
250,000
300,000
14
15
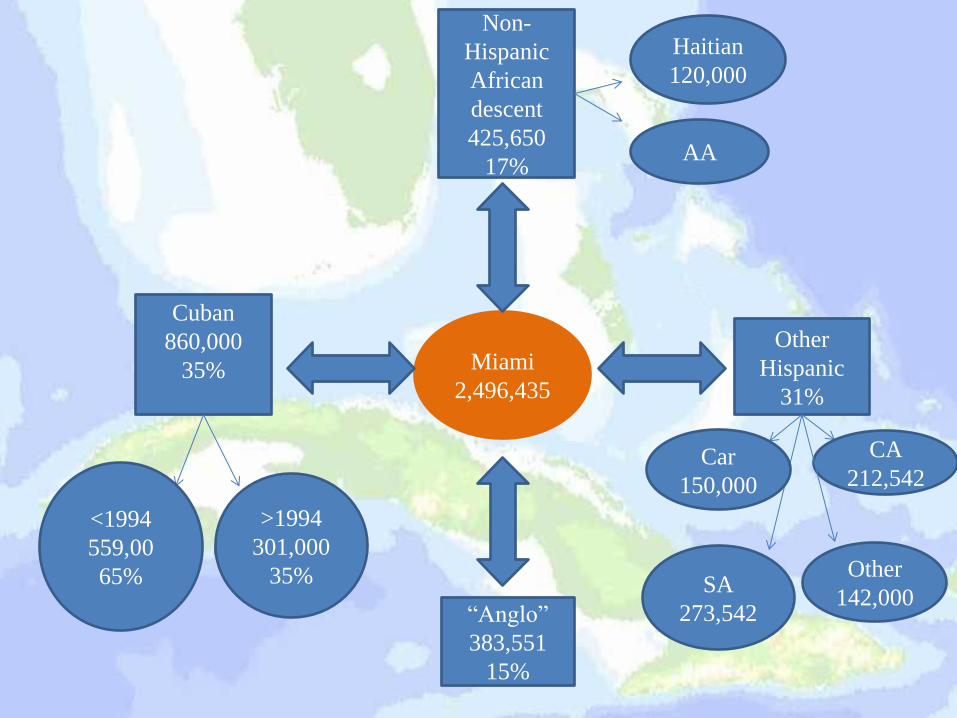
Miami
2,496,435
Non-
Hispanic
African
descent
425,650
17%
Other
Hispanic
31%
“Anglo”
383,551
15%
Cuban
860,000
35%
<1994
559,00
65%
1994
>
Haitian
120,000
AA
Car
150,000
CA
212,542
SA
273,542
>1994
301,000
35% Other
142,000
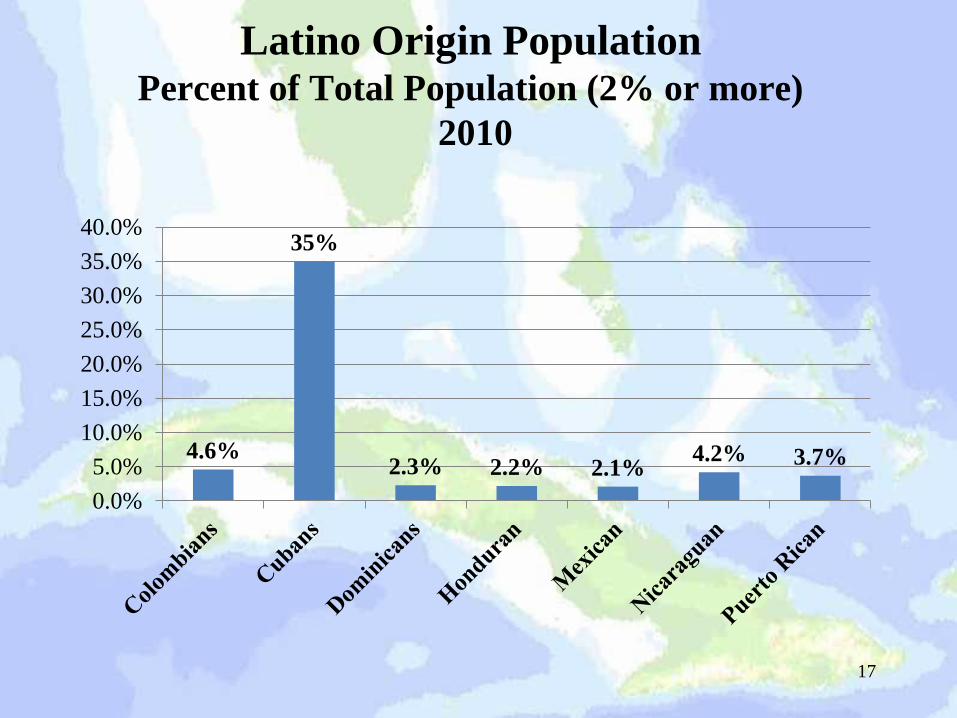
Latino Origin Population Percent of Total Population (2% or more)
2010
4.6%
35%
2.3% 2.2% 2.1% 4.2% 3.7%
0.0%
5.0%
10.0%
15.0%
20.0%
25.0%
30.0%
35.0%
40.0%
17
Cubans in Florida Now Inserted into the
National Discourse on the Importance
of Latinos in the United States
• The U.S. population and that of most states is undergoing major
demographic transformations.
• Latinos represent the engine of U.S. population change.
• The increasing presence of Latinos in the future population of the
U.S. will impact all institutions.
• Challenge to the traditional black-white framework that has
dominated U.S.
• New era?
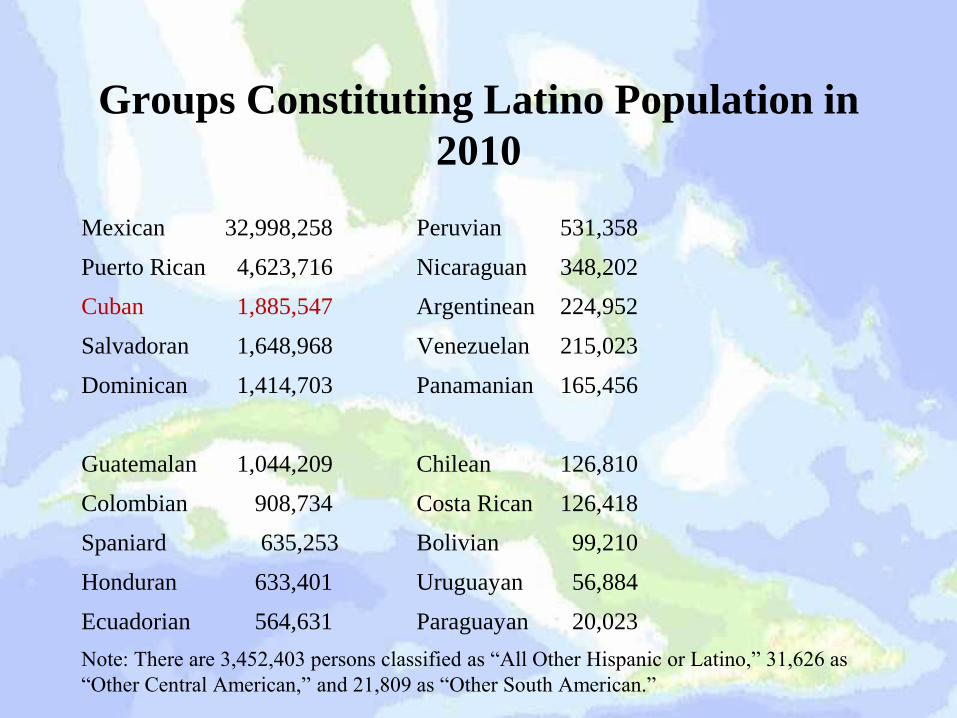
Groups Constituting Latino Population in
2010
Mexican 32,998,258 Peruvian 531,358
Puerto Rican 4,623,716 Nicaraguan 348,202
Cuban 1,885,547 Argentinean 224,952
Salvadoran 1,648,968 Venezuelan 215,023
Dominican 1,414,703 Panamanian 165,456
Guatemalan 1,044,209 Chilean 126,810
Colombian 908,734 Costa Rican 126,418
Spaniard 635,253 Bolivian 99,210
Honduran 633,401 Uruguayan 56,884
Ecuadorian 564,631 Paraguayan 20,023
Note: There are 3,452,403 persons classified as “All Other Hispanic or Latino,” 31,626 as
“Other Central American,” and 21,809 as “Other South American.”
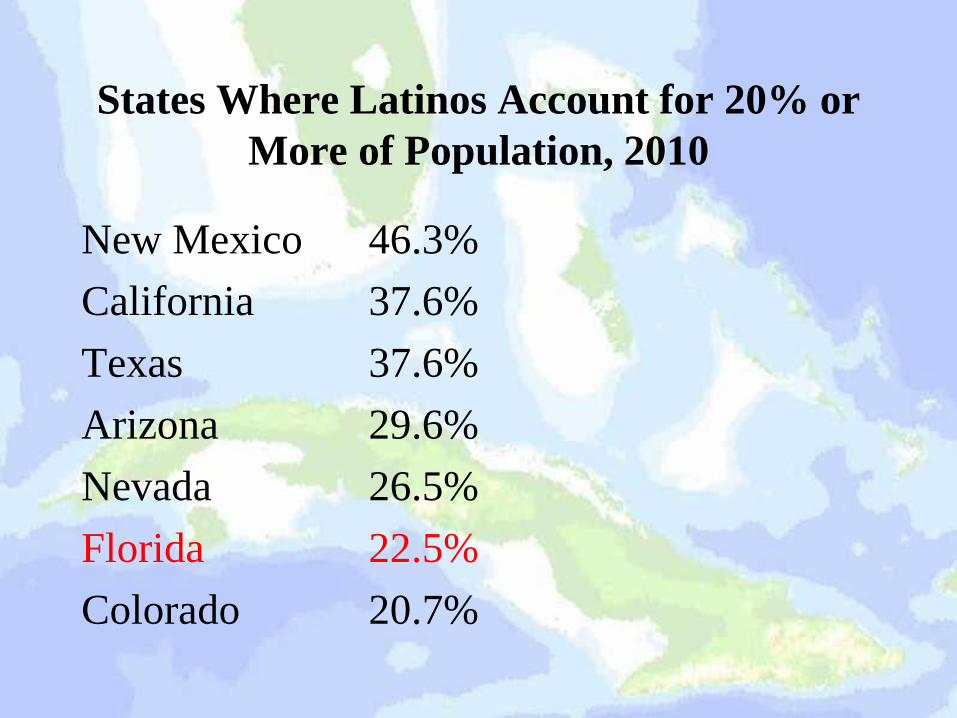
States Where Latinos Account for 20% or
More of Population, 2010
New Mexico 46.3%
California 37.6%
Texas 37.6%
Arizona 29.6%
Nevada 26.5%
Florida 22.5%
Colorado 20.7%
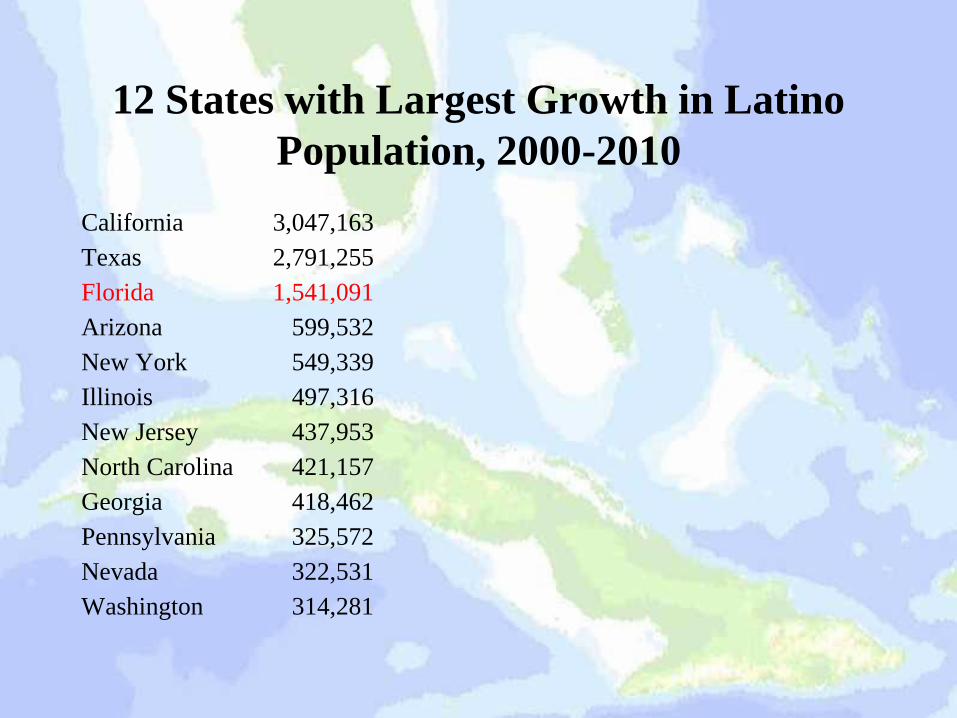
12 States with Largest Growth in Latino
Population, 2000-2010
California 3,047,163
Texas 2,791,255
Florida 1,541,091
Arizona 599,532
New York 549,339
Illinois 497,316
New Jersey 437,953
North Carolina 421,157
Georgia 418,462
Pennsylvania 325,572
Nevada 322,531
Washington 314,281
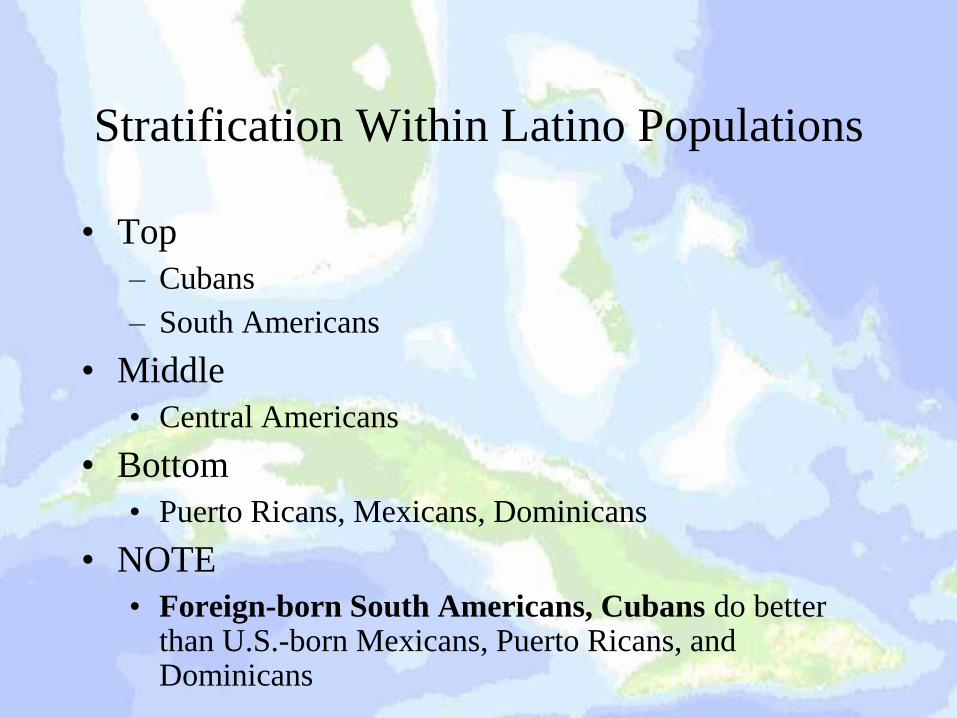
Stratification Within Latino Populations
• Top
– Cubans
– South Americans
• Middle
• Central Americans
• Bottom
• Puerto Ricans, Mexicans, Dominicans
• NOTE
• Foreign-born South Americans, Cubans do better than U.S.-born Mexicans, Puerto Ricans, and Dominicans
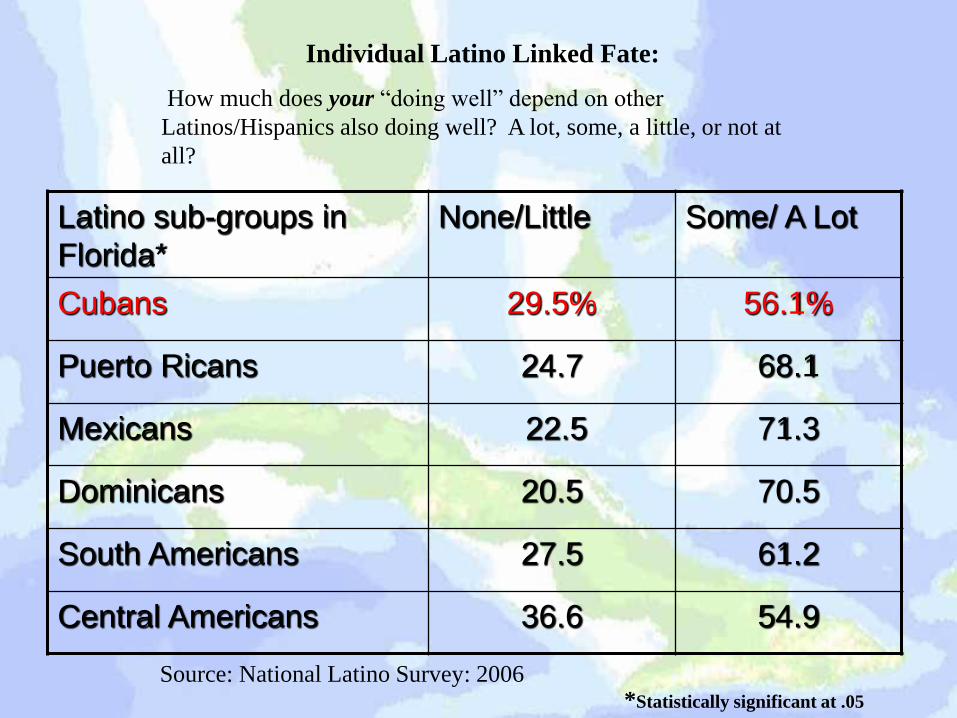
Latino sub-groups in
Florida*
None/Little Some/ A Lot
Cubans 29.5% 56.1%
Puerto Ricans 24.7 68.1
Mexicans 22.5 71.3
Dominicans 20.5 70.5
South Americans 27.5 61.2
Central Americans 36.6 54.9
Individual Latino Linked Fate:
How much does your “doing well” depend on other
Latinos/Hispanics also doing well? A lot, some, a little, or not at
all?
*Statistically significant at .05
Source: National Latino Survey: 2006
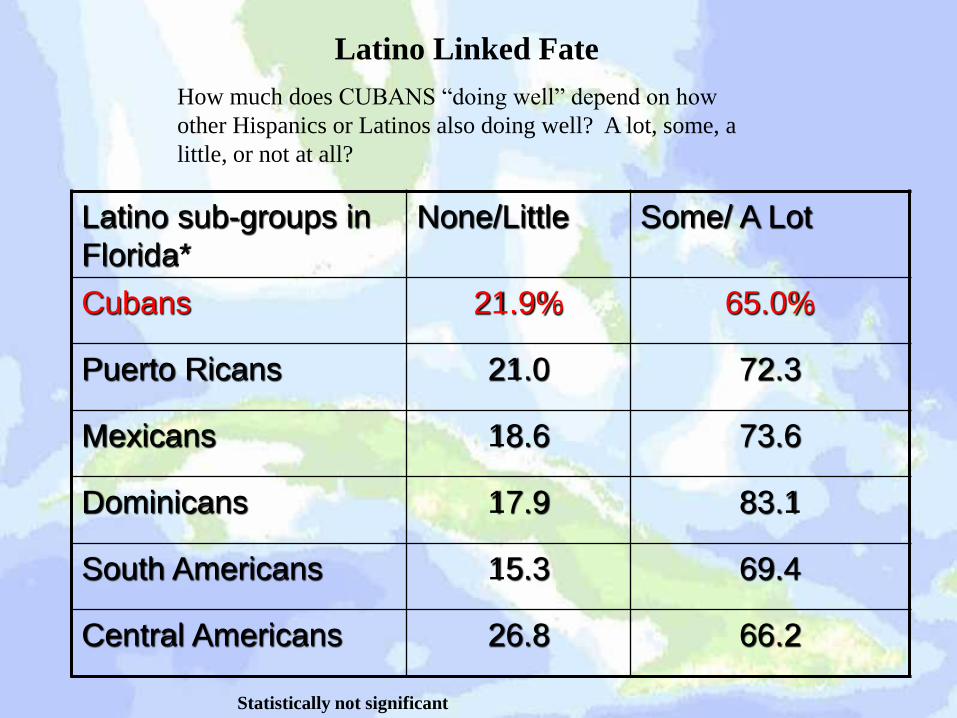
Latino Linked Fate
How much does CUBANS “doing well” depend on how
other Hispanics or Latinos also doing well? A lot, some, a
little, or not at all?
Latino sub-groups in
Florida*
None/Little Some/ A Lot
Cubans 21.9% 65.0%
Puerto Ricans 21.0 72.3
Mexicans 18.6 73.6
Dominicans 17.9 83.1
South Americans 15.3 69.4
Central Americans 26.8 66.2
Statistically not significant
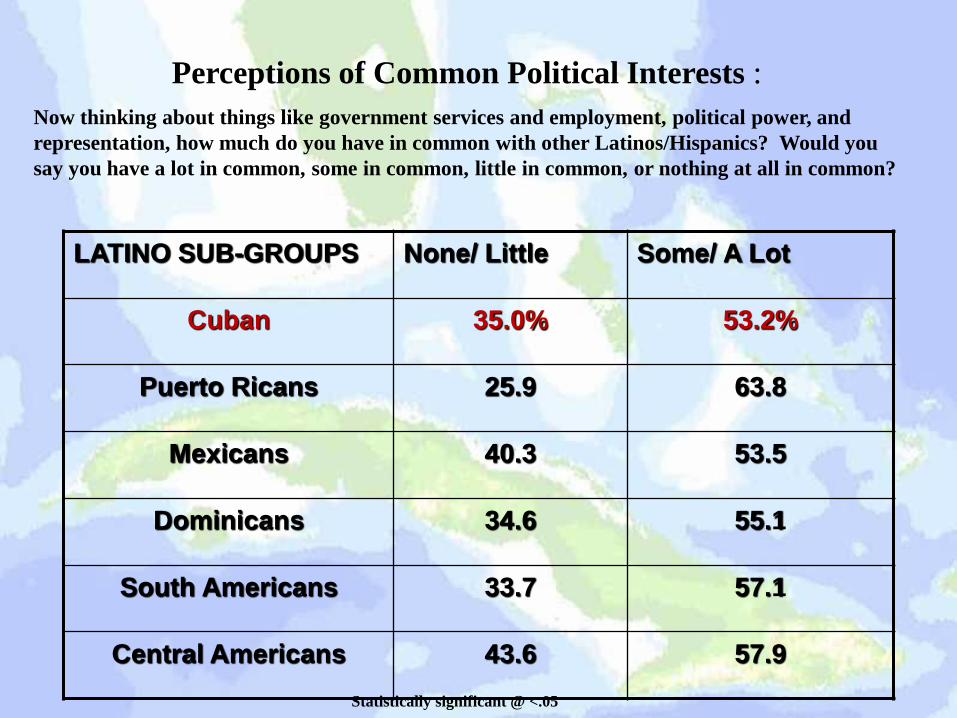
Perceptions of Common Political Interests :
Now thinking about things like government services and employment, political power, and
representation, how much do you have in common with other Latinos/Hispanics? Would you
say you have a lot in common, some in common, little in common, or nothing at all in common?
LATINO SUB-GROUPS None/ Little Some/ A Lot
Cuban 35.0% 53.2%
Puerto Ricans 25.9 63.8
Mexicans 40.3 53.5
Dominicans 34.6 55.1
South Americans 33.7 57.1
Central Americans 43.6 57.9
Statistically significant @ <.05
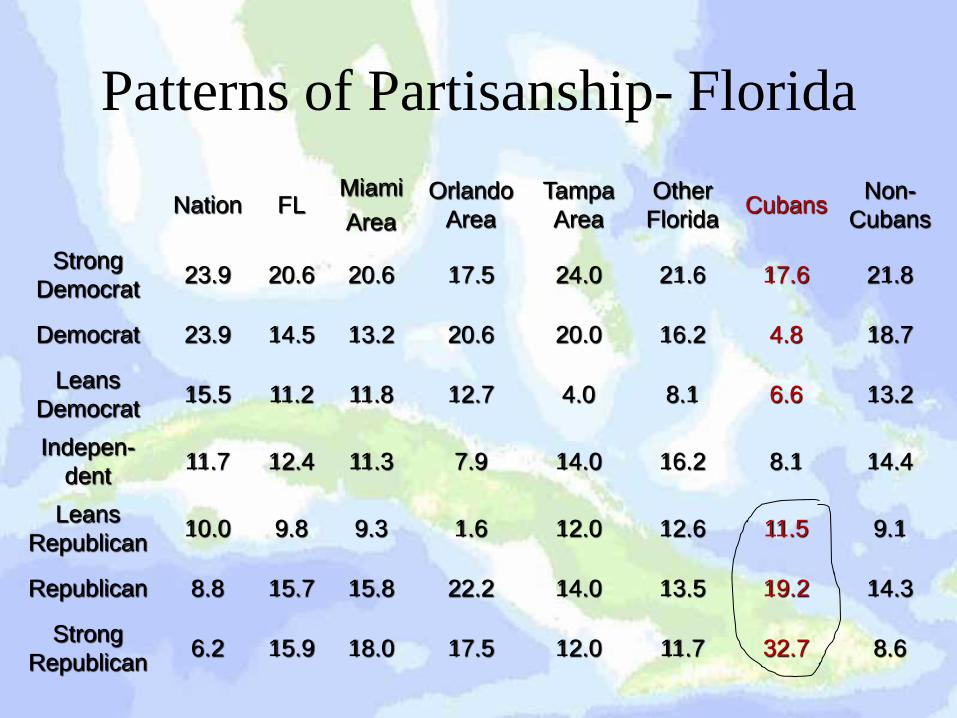
Patterns of Partisanship- Florida
Nation FL Miami
Area
Orlando
Area
Tampa
Area
Other
Florida Cubans
Non-
Cubans
Strong
Democrat 23.9 20.6 20.6 17.5 24.0 21.6 17.6 21.8
Democrat 23.9 14.5 13.2 20.6 20.0 16.2 4.8 18.7
Leans
Democrat 15.5 11.2 11.8 12.7 4.0 8.1 6.6 13.2
Indepen-
dent 11.7 12.4 11.3 7.9 14.0 16.2 8.1 14.4
Leans
Republican 10.0 9.8 9.3 1.6 12.0 12.6 11.5 9.1
Republican 8.8 15.7 15.8 22.2 14.0 13.5 19.2 14.3
Strong
Republican 6.2 15.9 18.0 17.5 12.0 11.7 32.7 8.6
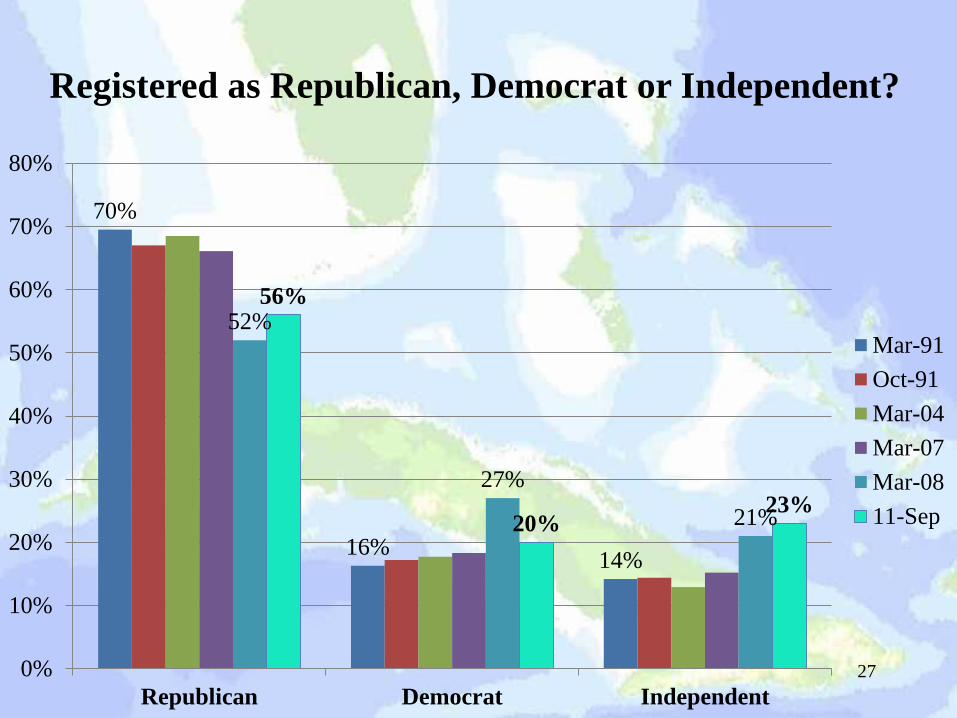
70%
16% 14%
52%
27%
21%
56%
20% 23%
0%
10%
20%
30%
40%
50%
60%
70%
80%
Republican Democrat Independent
Mar-91
Oct-91
Mar-04
Mar-07
Mar-08
11-Sep
Registered as Republican, Democrat or Independent?
27

1990 Polls vs 2000 Polls Average of Responses
Support for Embargo and Support for Dialogue
84%
58%
46%
60%
0%
10%
20%
30%
40%
50%
60%
70%
80%
90%
100%
1998 2000 2002 2004 2006 2008 2010 2012 2014
Embargo Support
Dialogue Support
Cuban Pop: 650,000
(2000 Census)
Cuban Pop: 856,000
(2010 Census)
28
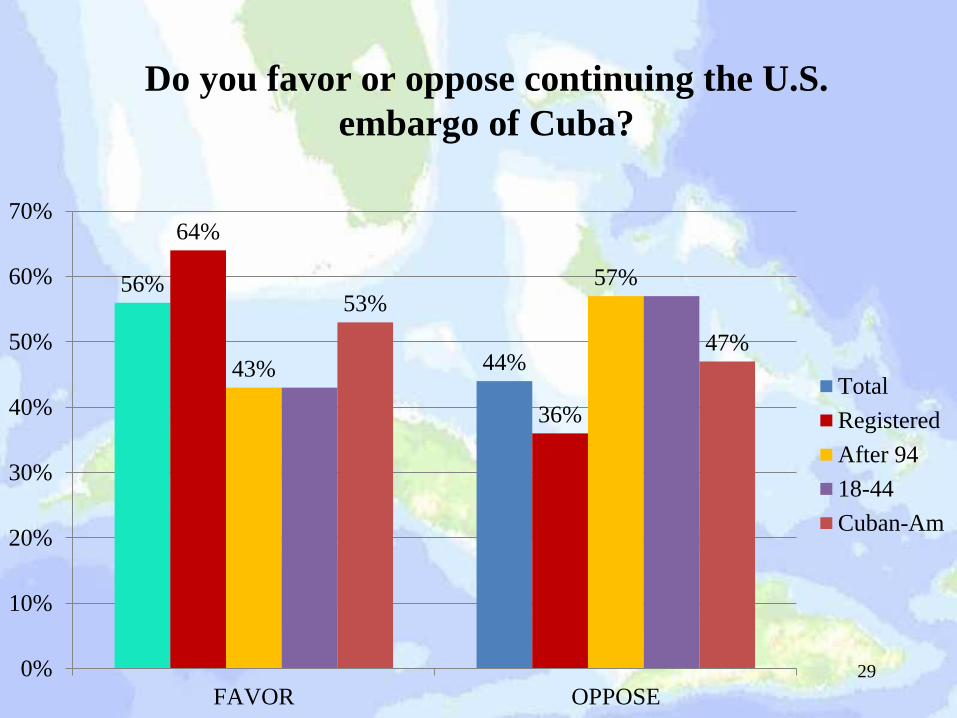
Do you favor or oppose continuing the U.S.
embargo of Cuba?
56%
44%
64%
36%
43%
57% 53%
47%
0%
10%
20%
30%
40%
50%
60%
70%
FAVOR OPPOSE
Total
Registered
After 94
18-44
Cuban-Am
29
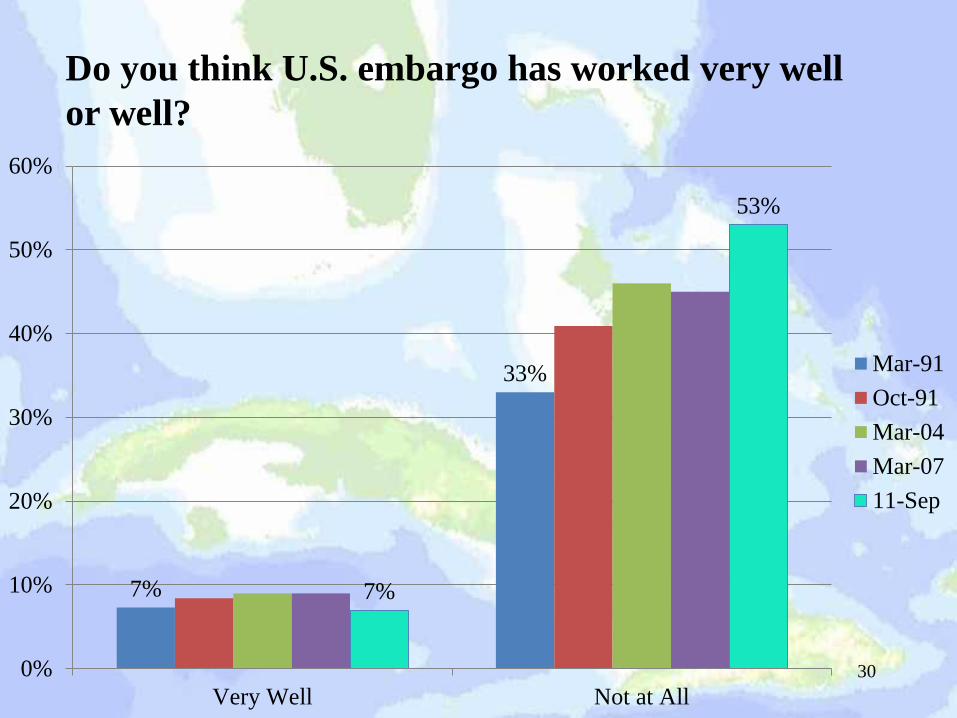
7%
33%
7%
53%
0%
10%
20%
30%
40%
50%
60%
Very Well Not at All
Mar-91
Oct-91
Mar-04
Mar-07
11-Sep
Do you think U.S. embargo has worked very well
or well?
30
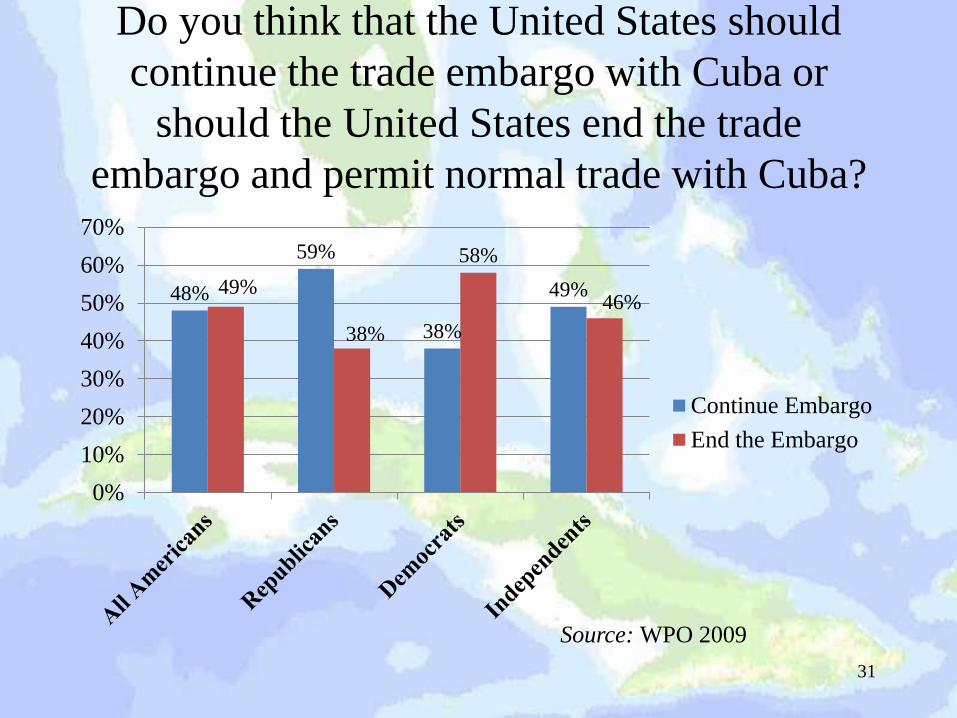
Do you think that the United States should
continue the trade embargo with Cuba or
should the United States end the trade
embargo and permit normal trade with Cuba?
48%
59%
38%
49% 49%
38%
58%
46%
0%
10%
20%
30%
40%
50%
60%
70%
Continue Embargo
End the Embargo
31
Source: WPO 2009
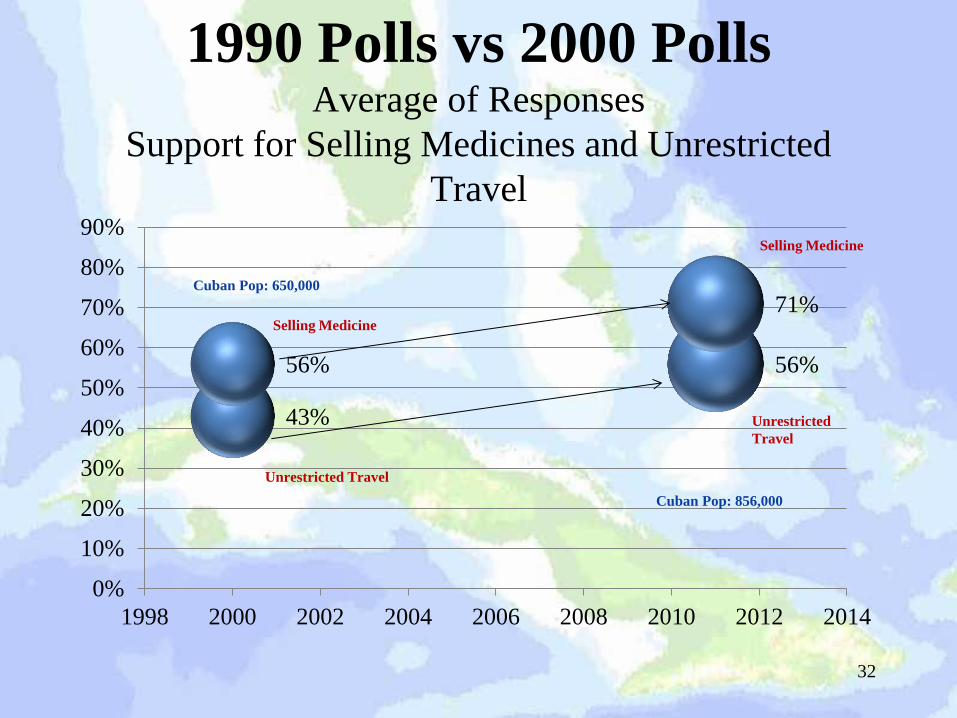
1990 Polls vs 2000 Polls Average of Responses
Support for Selling Medicines and Unrestricted
Travel
43%
56% 56%
71%
0%
10%
20%
30%
40%
50%
60%
70%
80%
90%
1998 2000 2002 2004 2006 2008 2010 2012 2014
Unrestricted Travel
Selling Medicine
Unrestricted
Travel
Selling Medicine
Cuban Pop: 650,000
Cuban Pop: 856,000
32

Should unrestricted travel by all Americans to Cuba
be allowed or not?
49%
75%
25%
63%
37%
0%
10%
20%
30%
40%
50%
60%
70%
80%
YES, ALLOWED NO, NOT ALLOWED
Total
Registered
After 94
18-44
Cuban-Am
33
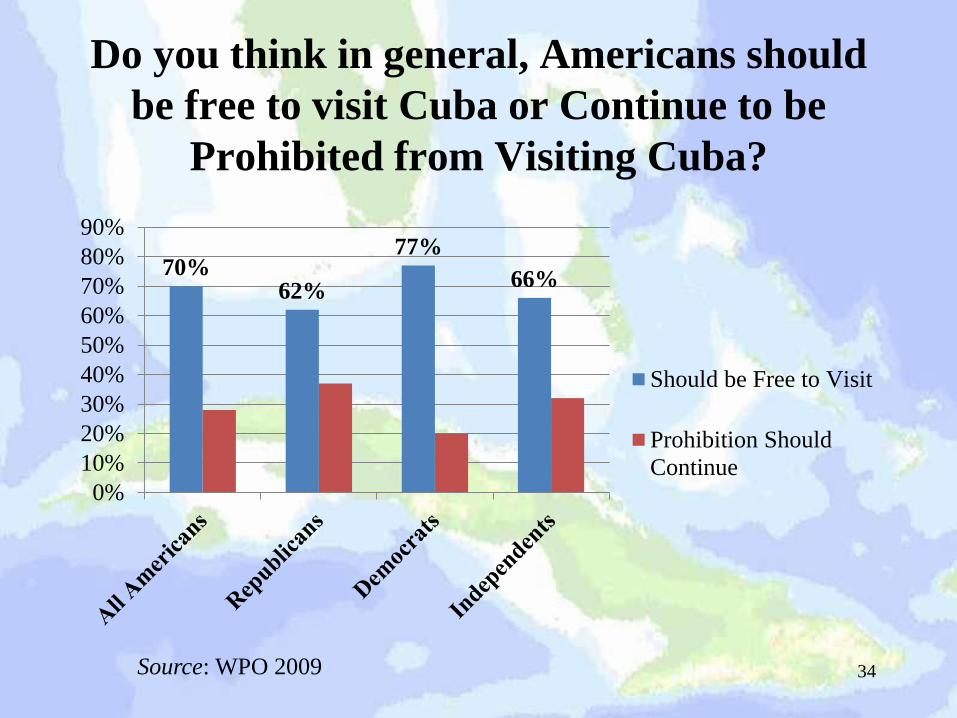
Do you think in general, Americans should
be free to visit Cuba or Continue to be
Prohibited from Visiting Cuba?
70% 62%
77%
66%
0%
10%
20%
30%
40%
50%
60%
70%
80%
90%
Should be Free to Visit
Prohibition Should
Continue
34 Source: WPO 2009
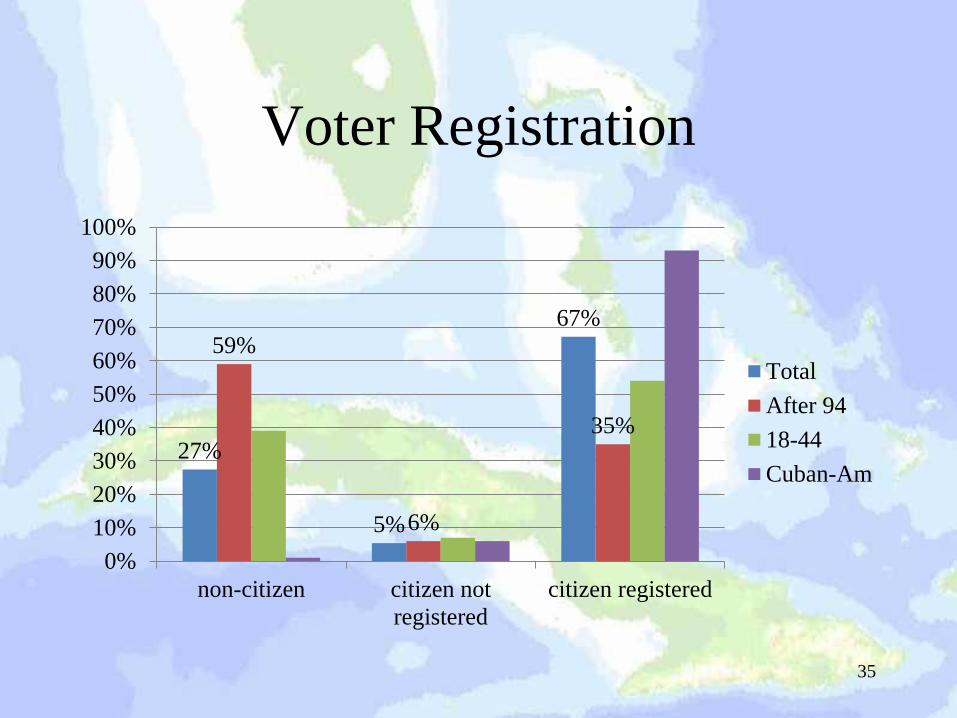
Voter Registration
27%
5%
67%
59%
6%
35%
0%
10%
20%
30%
40%
50%
60%
70%
80%
90%
100%
non-citizen citizen not
registered
citizen registered
Total
After 94
18-44
Cuban-Am
35