Embed Size (px)
Citation preview

Current and Future Role of DNA Technology in the Livestock Industry
Mark Allan, PhD
Beef Cattle Geneticist
ARS, U.S. Meat Animal Research Center
Clay Center, NE
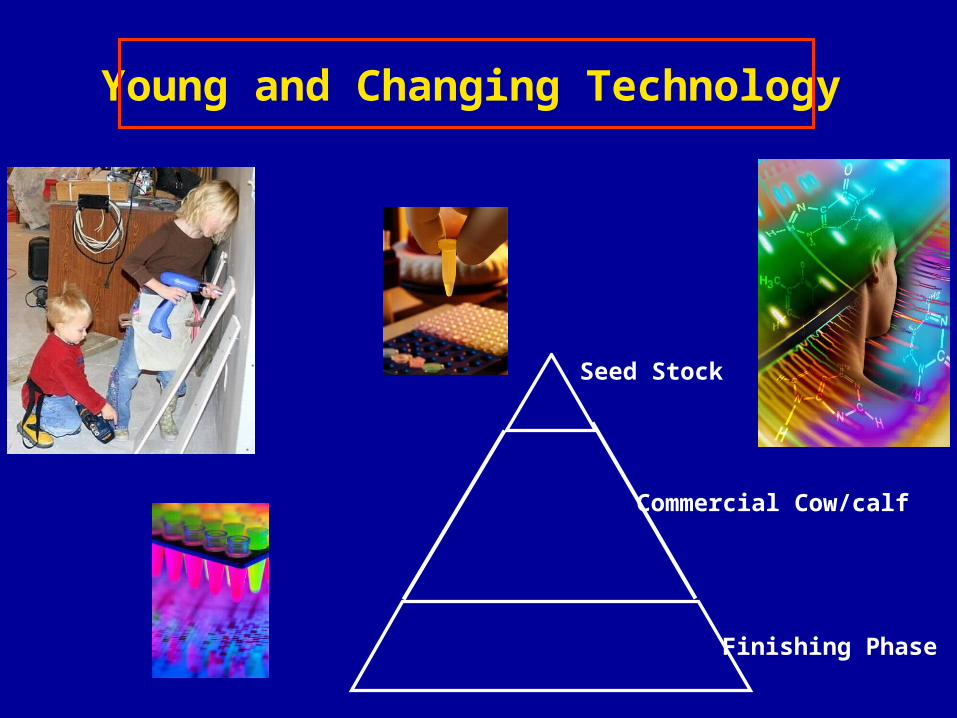
Young and Changing Technology
Seed Stock
Commercial Cow/calf
Finishing Phase
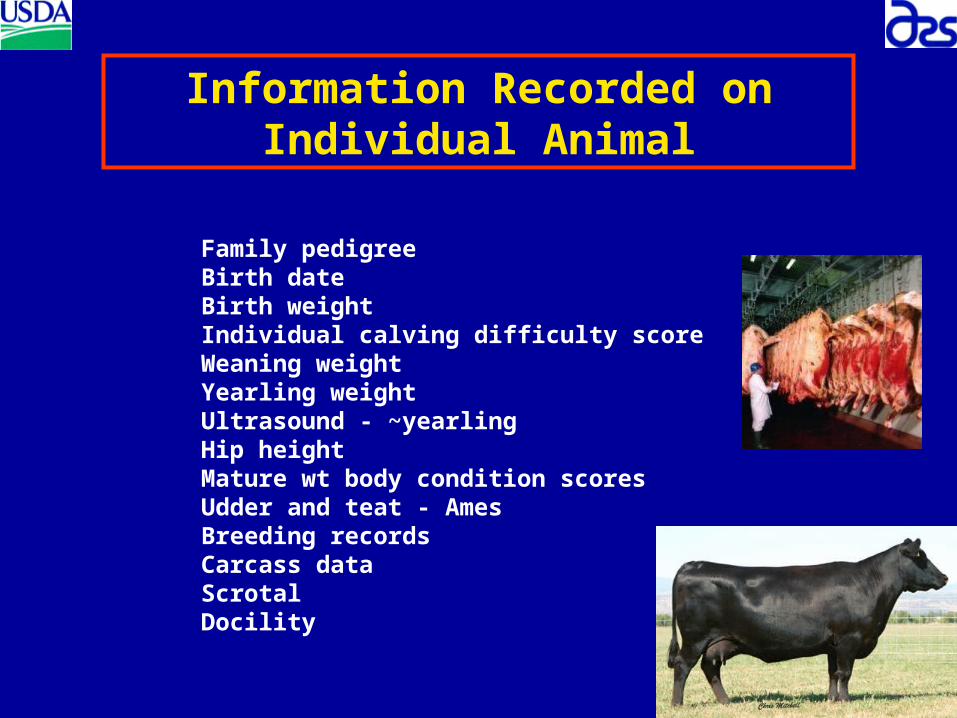
Family pedigree Birth date Birth weight Individual calving difficulty score Weaning weight Yearling weightUltrasound - ~yearlingHip heightMature wt body condition scoresUdder and teat - AmesBreeding records Carcass dataScrotalDocility
Information Recorded on Individual Animal
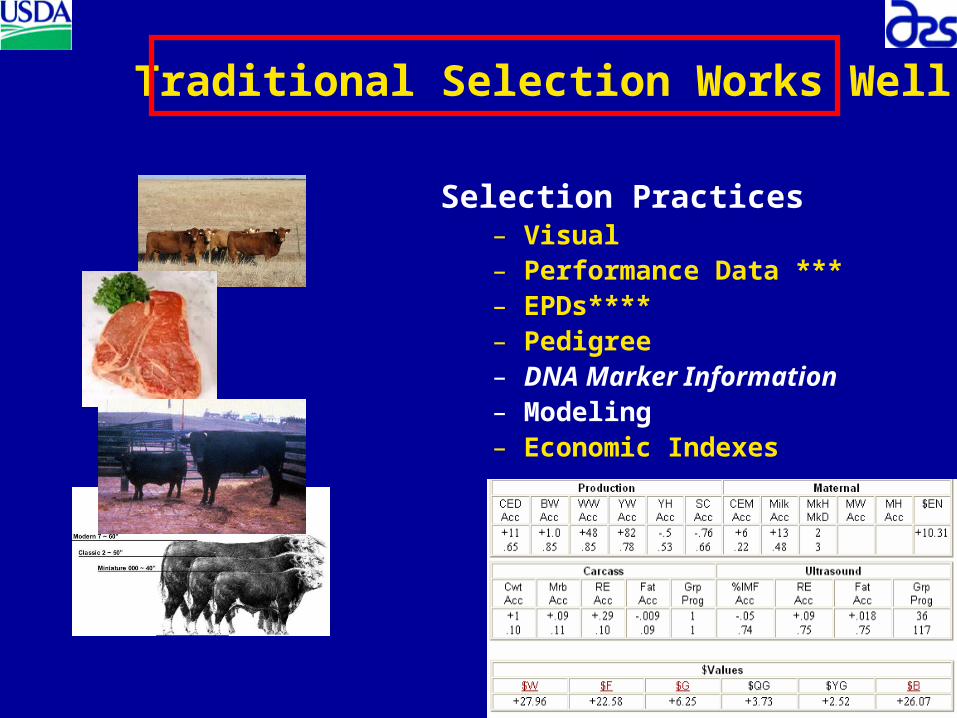
Traditional Selection Works Well
Selection Practices– Visual– Performance Data ***– EPDs****– Pedigree – DNA Marker Information– Modeling– Economic Indexes
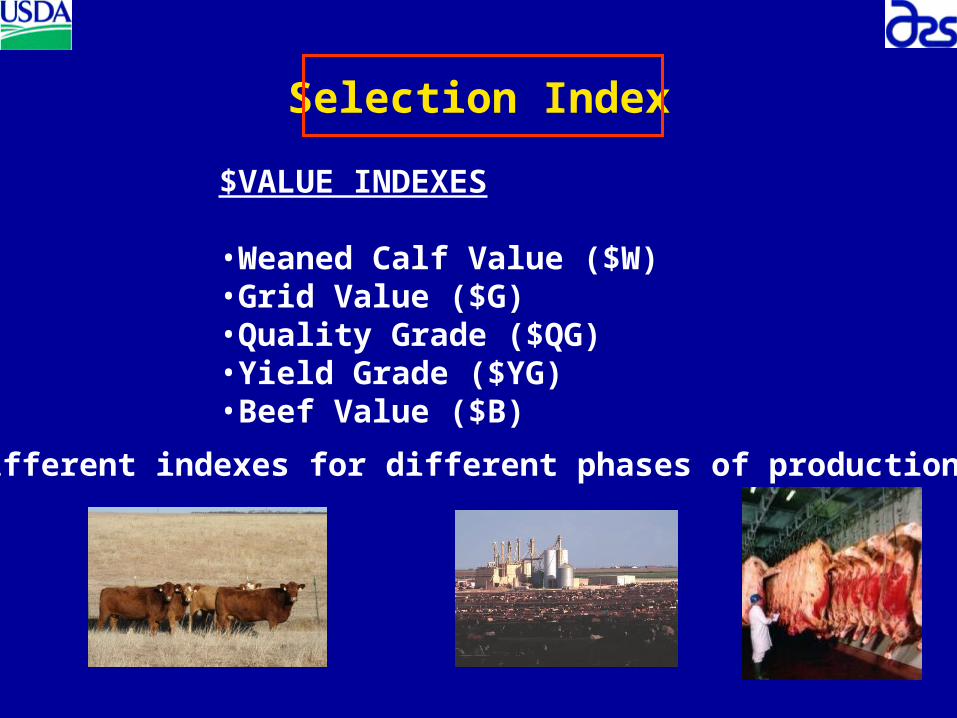
Selection Index
Different indexes for different phases of production!
$VALUE INDEXES
•Weaned Calf Value ($W) •Grid Value ($G) •Quality Grade ($QG) •Yield Grade ($YG)•Beef Value ($B)

How Do We Collect DNA?
• Blood• Hair Roots• Saliva• Skin• Semen • Fecal Samples• Other Tissues
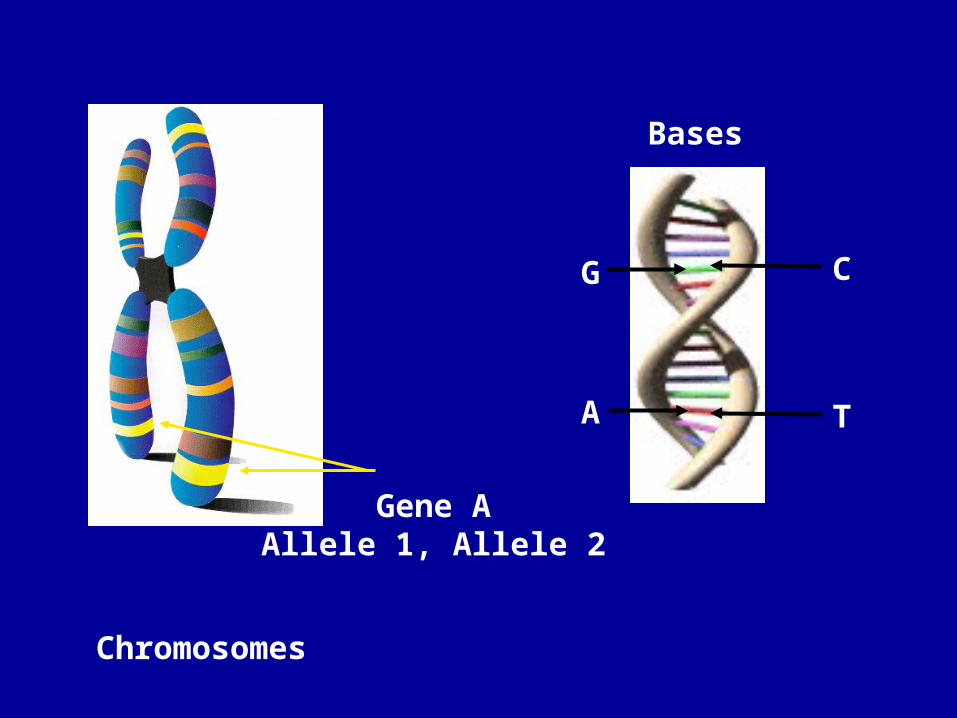
Chromosomes
G C
A T
Gene AAllele 1, Allele 2
Bases

Marker-Assisted Selection (MAS)
-Inherited Diseases
-Coat Color
-Embryo Sexing
-Horned/Polled
-Quantitative Traits
-Feed Efficiency, Growth, Reproduction, Carcass Traits
Marker-Assisted Management (MAM)

Populations QTL Scans
• Nellore (Indicus)/Hereford sire n=547
• Brahman/Angus sire n=620
• Belgian Blue/MARCIII sire n=246
• Piedmontese/Angus sire n=209
x
x
x
x
MARCIII
Sires were mated to Angus, Hereford and
MARCIII females
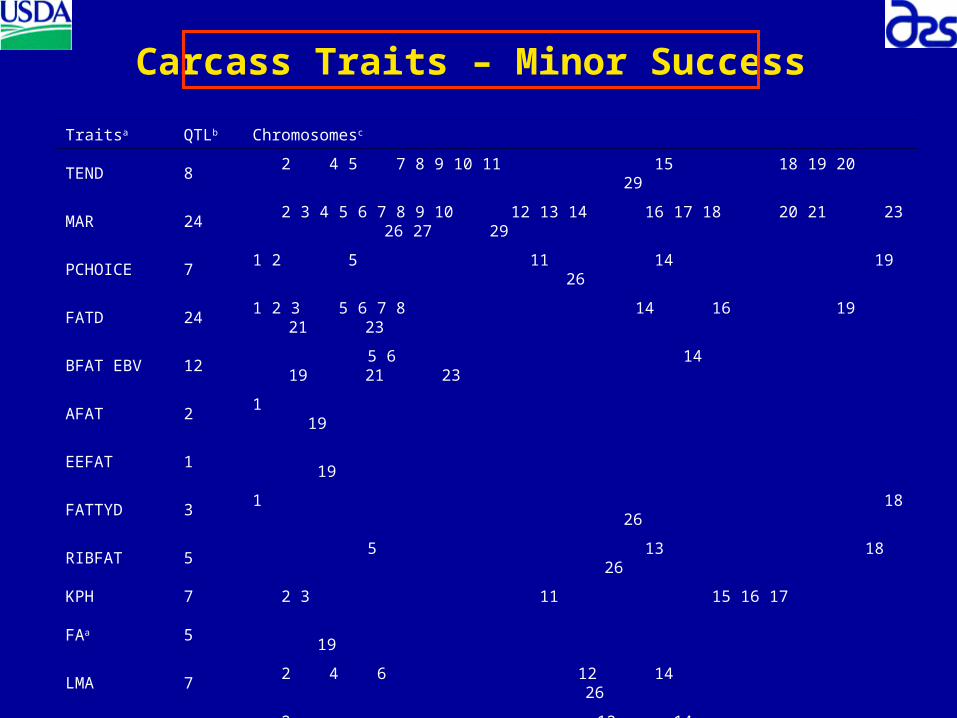
Carcass Traits – Minor Success
Traitsa QTLb Chromosomesc
TEND 8 2 4 5 7 8 9 10 11 15 18 19 20 29
MAR 24 2 3 4 5 6 7 8 9 10 12 13 14 16 17 18 20 21 23 26 27 29
PCHOICE 7 1 2 5 11 14 19 26
FATD 24 1 2 3 5 6 7 8 14 16 19 21 23
BFAT EBV 12 5 6 14 19 21 23
AFAT 2 1 19
EEFAT 1 19
FATTYD 3 1 18 26
RIBFAT 5 5 13 18 26
KPH 7 2 3 11 15 16 17
FAa 5 19
LMA 7 2 4 6 12 14 26
REA 6 2 12 14 19 21
RIBB 1 5
SWT 10 1 2 3 12 14 16 17 24
RPYD 13 1 2 3 5 9 12 13 18 19 26 29
CW 27 1 2 4 5 6 7 10 12 13 14 16 18 22 23 24 29
DP 8 1 5 10 13 16 24 29
YG 10 1 2 5 11 12 14 16 19 21 26

Phenotypes
Carcass Traitshot carcass wtfat depthmarbling scoreest. k & p fat, heart fatrib boneribfatribmusUSDA yield grade shear force
Predicted Carcass Traitsretail product yieldfat yieldwhole sale rib-fat yield
Growth Traitsbirth wtweaning wtyearling wtaverage daily gain
Reproductive TraitsFSH -malestesticular weighttesticular volumetwinning rateovulation rate
Discovery of QTL

Strategy to Identify Genes/Markers
Quantitative Trait Locus
(QTL)
CandidatePosition
Fine Mapping
Positional Candidate
Gene/MarkerValidation
Industry Application
Limiting
Need additional laboratory tools

Development of DNA Markers
DNA Marker
Biology
Differential gene expression
Genetically modified animals
Mutantmodels
Proteome analysis
Genome sequence
Comparative maps
Metanomics
Fine mapping Progeny testing
Gene candidates
Bioinformatics
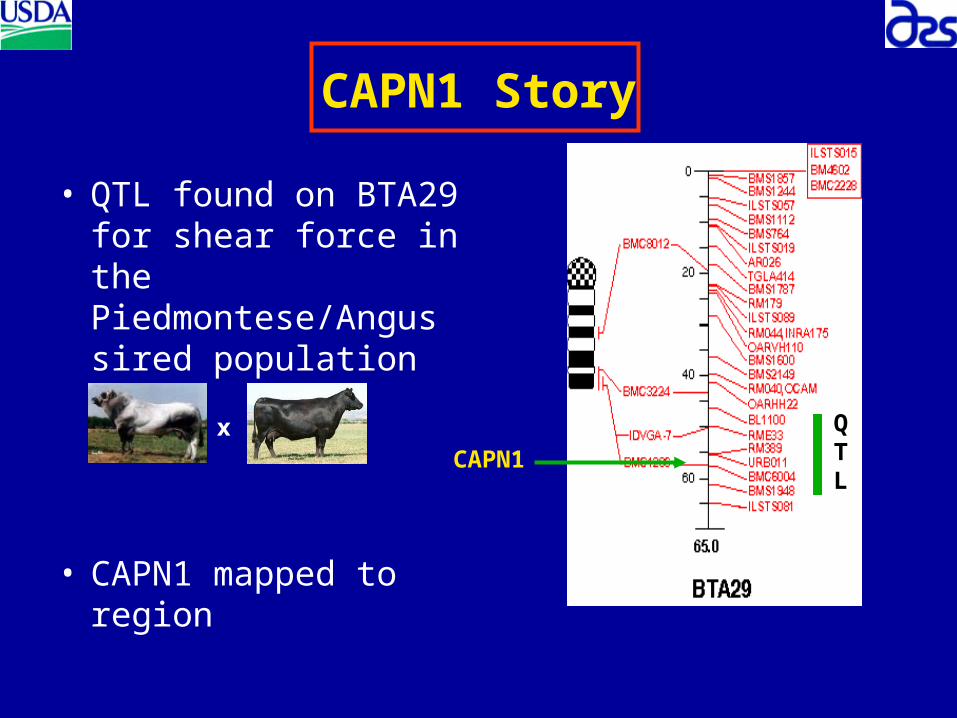
CAPN1 Story
• QTL found on BTA29 for shear force in the Piedmontese/Angus sired population
• CAPN1 mapped to region
QTL
CAPN1x
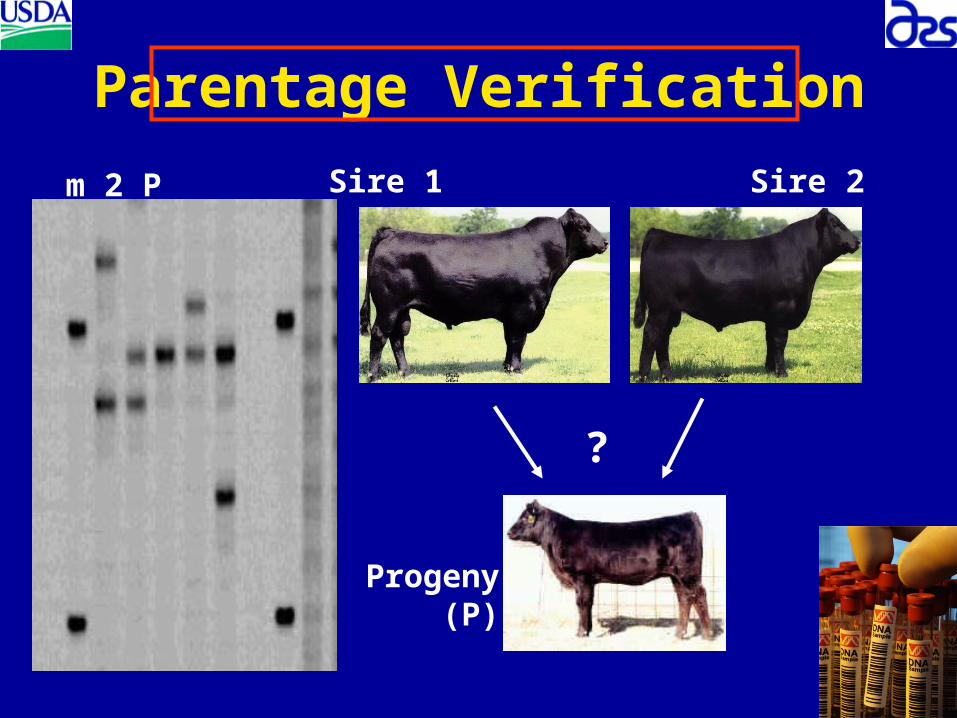
Parentage Verification
?
m 2 P Sire 1 Sire 2
Progeny (P)
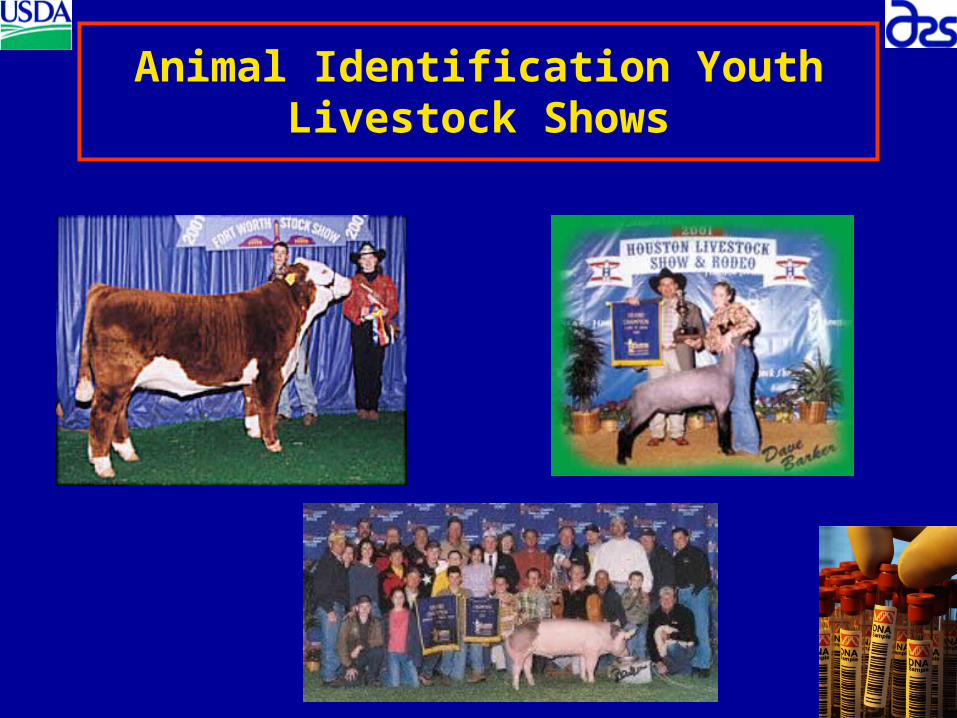
Animal Identification Youth Livestock Shows

Tracing Products
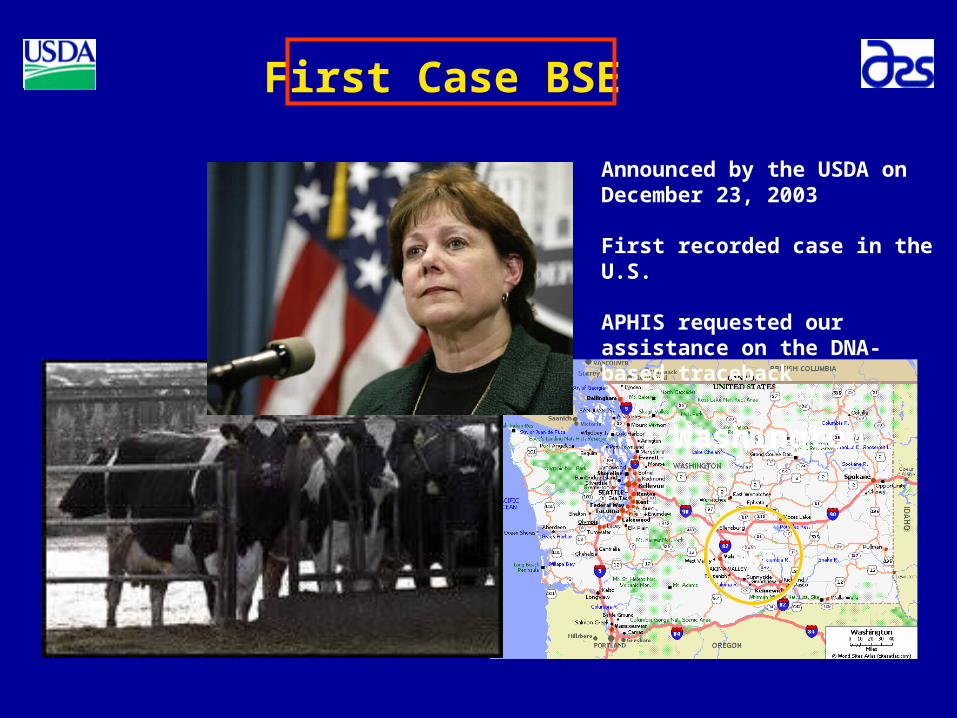
BSE
Washington
Announced by the USDA on December 23, 2003
First recorded case in the U.S.
APHIS requested our assistance on the DNA-based traceback
First Case BSE

Sequencing the Bovine Genome
PHASE1 - $53 million
• NHGRI - $25 million
• New Zealand - $1 million
• Texas - $5 to10 million
• National Cattlemen’s Beef Association,
Texas and South Dakota cattle producers - $820,000
Baylor College of Medicine-Human Genome Sequencing
Center
Hereford Cow from Miles City

SNPs- Single Nucleotide Polymorphisms
-Occur much more frequently throughout the genome
-2 alleles possible
ATGCAATTGCCACGTTGCAAT
ATGCAATTGCTACGTTGCAAT
ATGCAATTGCC/TACGTTGCAAT
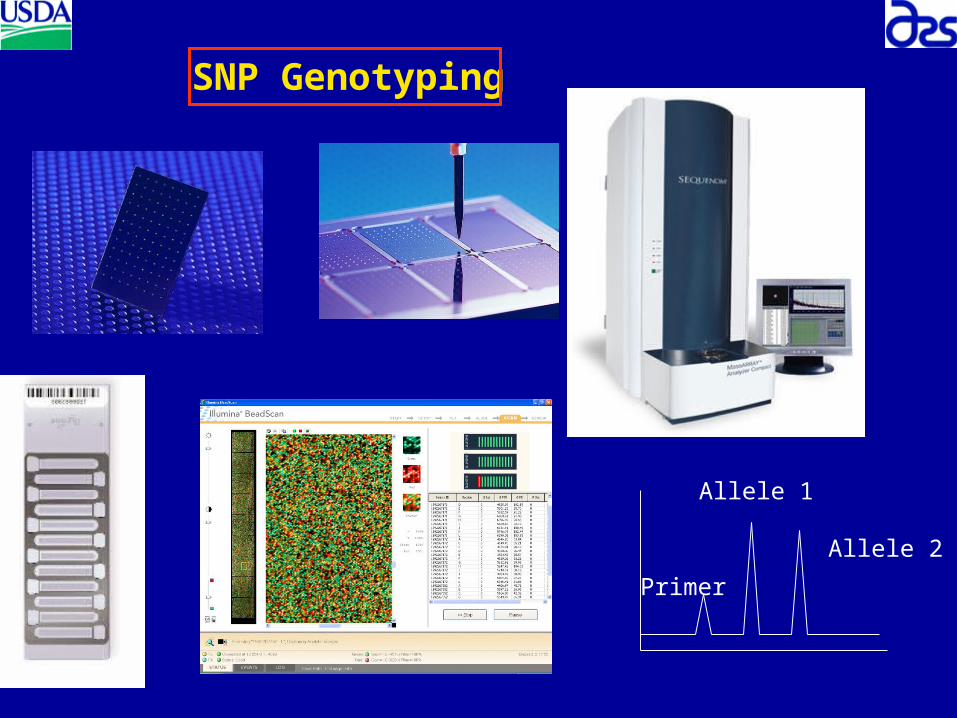
SNP Genotyping
Allele 1
Allele 2
Primer

Linkage Disequilibrium- LD*
*
*
*
*
*
*
**
*
*
**
*

Illumina Infinium Bovine BeadChip
~ 54,008 SNP markers across the bovine genome
- On average SNP every <67,000 base pair
- Discovery SNP includes many breeds
BARCUSMARCUniversity of MissouriUniversity of Alberta
(Van Tassell et al., 2008 Nature Methods)

Genotyping of Animals GPEVII
• 2,020 F12 animals with feed intake record for ~52,156 SNP/animal• 152 GPEVII AI sires• 73 GPEVII F1 sires• 580 GPEVII F1 steers• 150 GPEVII F1 dams
~155,164,000 genotypes
0 0.20 0.40 0.60 0.80 1
Norm Theta
BFGL-NGS-119315
-0.20
0
0.20
0.40
0.60
0.80
1
1.20
1.40
1.60
1.80
Norm
R
79 346 472
52,156 call rate >= 0.99
41,264 minor allele >= 0.1
31,466 minor allele >= 0.2

WGA vs. WGS
Bonferroni correction 1.03 e-6 = LOD 6.0
WGS?
• Using a large panel of markers to estimate genetic merit (MBV) marker breeding value.
• Using the marker information from across the whole-genome to estimate the sum of effects.
• How - Uses foundation information for the estimation process derived from training data sets (Equations).
• Animals are genotyped that may or may not have phenotypic information and genetic merit is estimated.
WGS – Whole-Genome Selection
• “There is no doubt that whole genome-enabled selection has the potential for being the most revolutionary technology since artificial insemination and performance-based index selection to change the nature of livestock improvement in the foreseeable future”
Dorrian Garrick, Iowa State University

AccurateMulti-traitSelection
Future Genetic Improvement of Beef Cattle?
U.S. Beef Cattle Grandsires USMARCGranddams
F1 Parents
Phenotypes
SNPGenotypes
Gene Flow
3rd Generation Progeny
Information Flow
Release the Data- Breed Association
• The results of the DNA tests will be critical in the National Sire Evaluations in the future.
• To estimate genetic effects for a trait all the data needs to be used (“good and bad alleles”).
• Selective reporting is a long-term disadvantage.
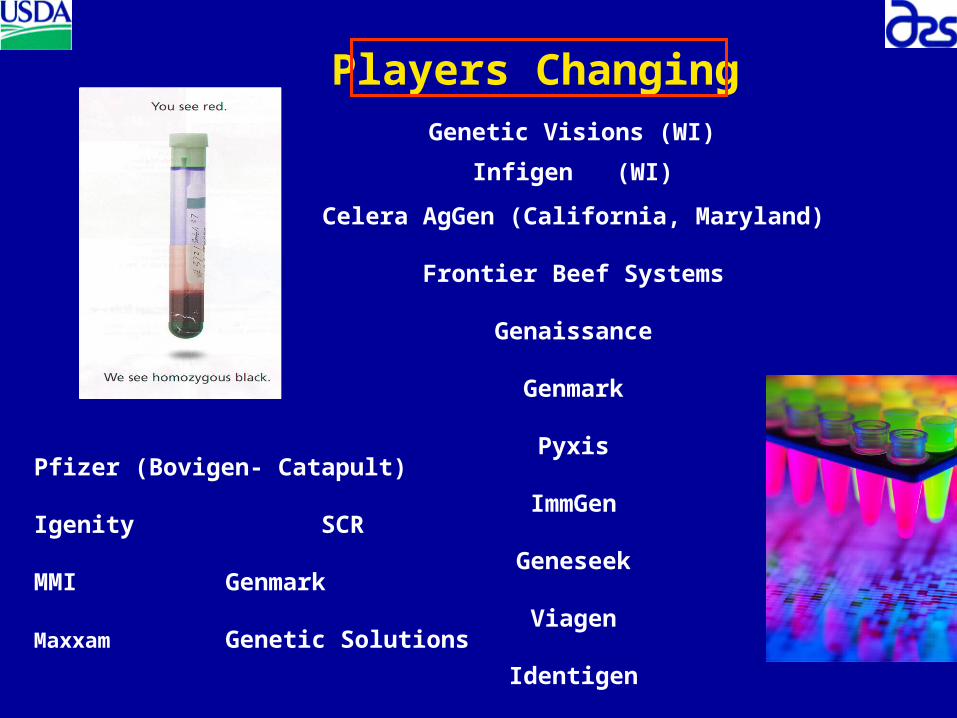
Players ChangingGenetic Visions (WI)
Infigen (WI)
Celera AgGen (California, Maryland)
Frontier Beef Systems
Genaissance
Genmark
Pyxis
ImmGen
Geneseek
Viagen
Identigen
Pfizer (Bovigen- Catapult)
Igenity SCR
MMI Genmark
Maxxam Genetic Solutions


Using DNA in Selection Programs
• Just because animal is not carrying the favorable allele for a specific test does not mean the animal is not genetically superior for the trait.
• Increase the accuracy of EPD
• Hard (expensive) traits to measure
• Sex-limited traits
• Lowly heritable traits
• Speed selection decisions
• Merchandising genetics
Tools for Selection
• - Growth
• - Feed efficiency
• - Carcass composition - quality
• - Reproduction
• - Disease resistance
Will markers replace “traditional” selection?
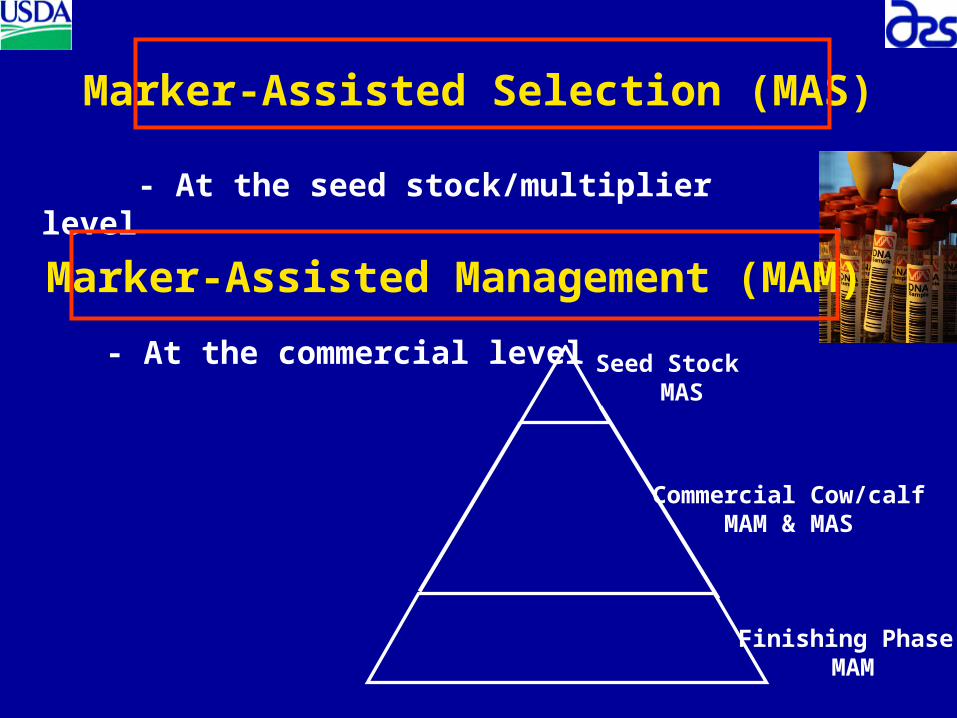
Marker-Assisted Selection (MAS)
- At the seed stock/multiplier level
Marker-Assisted Management (MAM)
- At the commercial level Seed Stock MAS
Commercial Cow/calfMAM & MAS
Finishing Phase MAM

Implementation to the Industry
Marker data- added to the databases to contribute to our
national genetic evaluation system already in place
Additional tool to be used in making genetic progress
2000 – Industry sires
Feed efficiency EBV through WGS

Where has animal genetic improvement lagged the most?
Animal Health - all species
BRD – Bovine Respiratory Disease
• Most costly disease to the cattle industry– 97.6% of feedlots treat – 14.4% of cattle are treated for symptoms– Accounts for over 50% of feedlot deaths
– Cattle treated for BRD are expected to return at least $40 less than untreated calves
NAHMS, 1999
Fulton et al., 2002
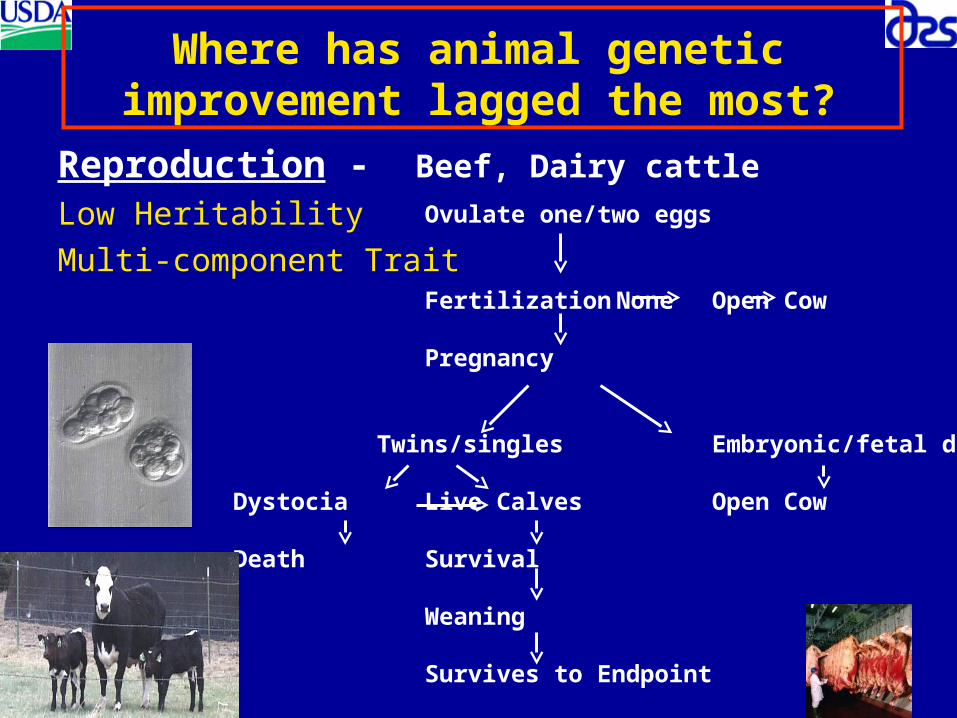
Reproduction - Beef, Dairy cattle
Low Heritability
Multi-component Trait
Where has animal genetic improvement lagged the most?
Ovulate one/two eggs
Fertilization None Open Cow
Pregnancy
Twins/singles Embryonic/fetal death
Dystocia Live Calves Open Cow
Death Survival
Weaning
Survives to Endpoint
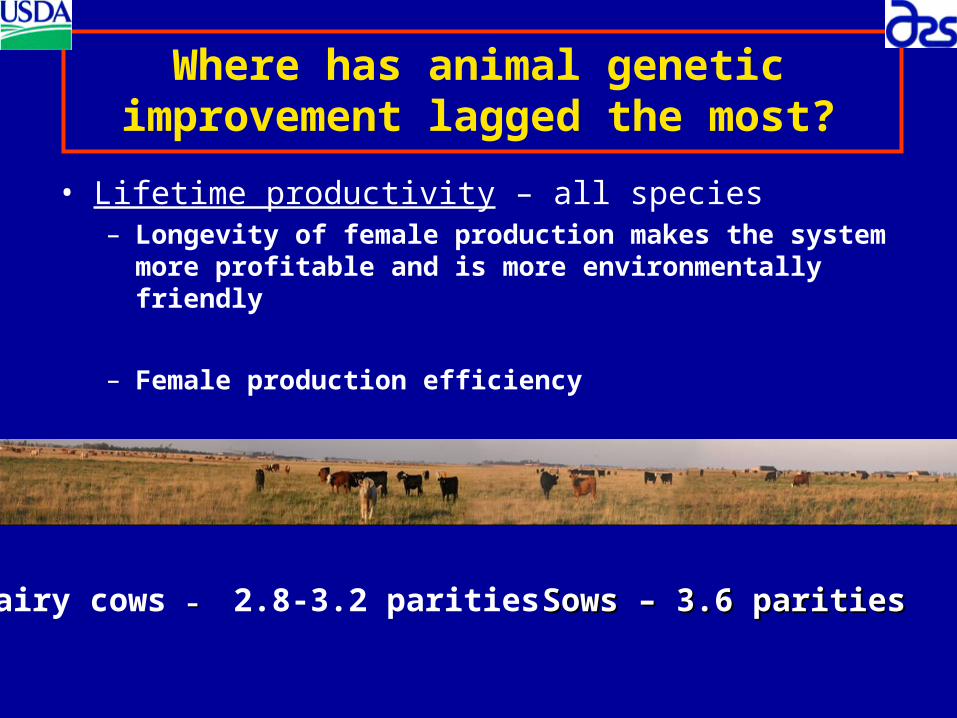
• Lifetime productivity – all species– Longevity of female production makes the system more
profitable and is more environmentally friendly
– Female production efficiency
Where has animal genetic improvement lagged the most?
Sows – 3.6 paritiesSows – 3.6 paritiesDairy cows –– 2.8-3.2 parities

• Feed Efficiency – ?
Where has animal genetic improvement lagged the most?
Cattle Fax Issue 25, Vol. 40 June 20, 2008
Hard to measure traitExpensive!
• Little effort has been focused on the amount or causes of individual variation in efficiency of energy utilization by cattle, even though differences among individuals have long been recognized. (Johnson et al., 2002). USMARC & CSU
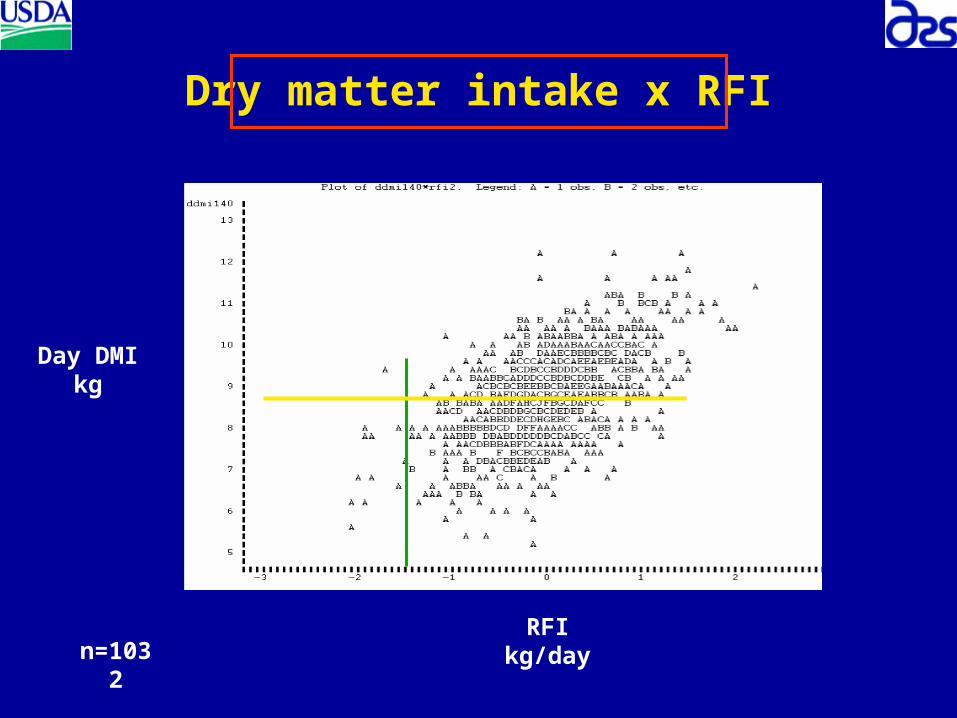
Dry matter intake x RFI
RFIkg/day
Day DMIkg
n=1032

Where has animal genetic improvement lagged the most?
Stage of production - Diet x Genetic interaction
GrowingCow production Finishing
Avoid single-trait selection
0
0.02
0.04
0.06
0.08
0.1
0.12
0.14
0.16
0 0.005 0.01 0.015 0.02 0.025
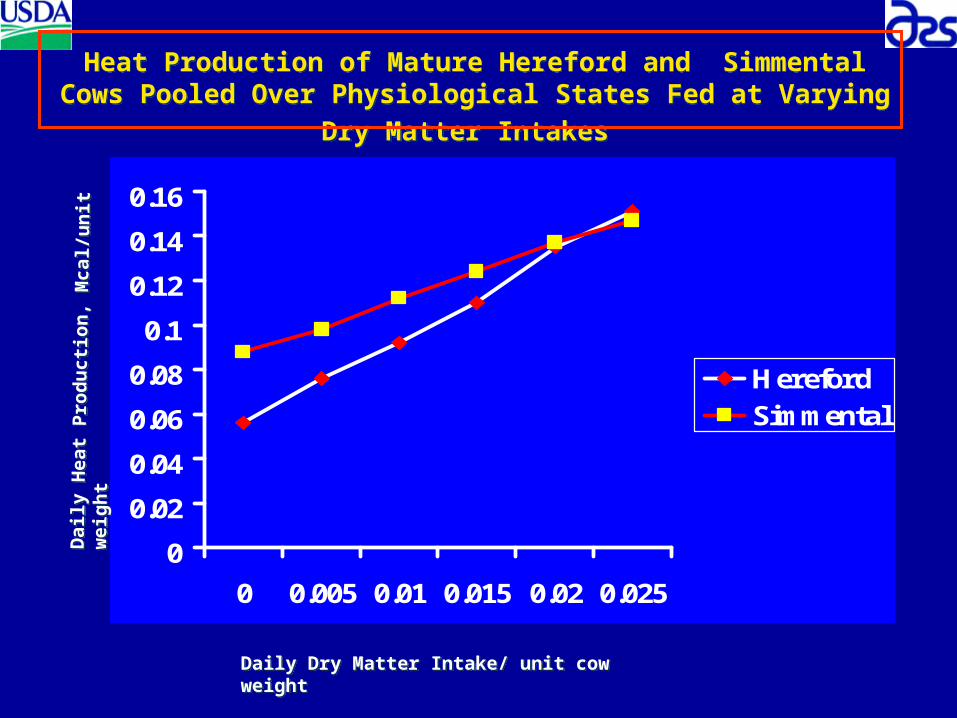
HerefordSimmental
Daily Dry Matter Intake/ unit cow weightDaily Dry Matter Intake/ unit cow weight
Dai
ly H
eat
Pro
du
ctio
n, M
cal/
un
it w
eigh
tD
aily
Hea
t P
rod
uct
ion
, Mca
l/u
nit
wei
ght
Heat Production of Mature Hereford and Simmental Cows Pooled
Over Physiological States Fed at Varying Dry Matter Intakes Heat Production of Mature Hereford and Simmental Cows Pooled
Over Physiological States Fed at Varying Dry Matter Intakes

Matching genetic potential to the Climatic Environment
Ability of animals to adapt to various environments“Adaptability”
Where has animal genetic improvement lagged the most?
Where has animal genetic improvement lagged the most?
“On the radar” may become important
Treatment x Genetic InteractionImplants & feed additives (muscle enhancement)Health interventions (antibiotics)
Healthfulness of ProductOmega3 FA content of protein products
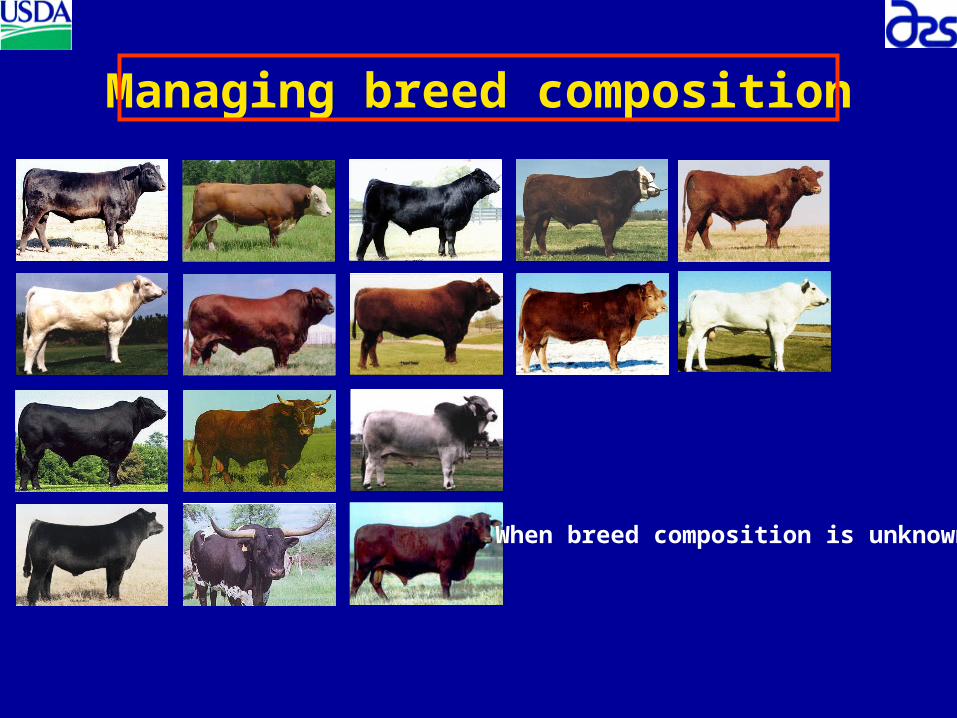
Managing breed composition
When breed composition is unknown
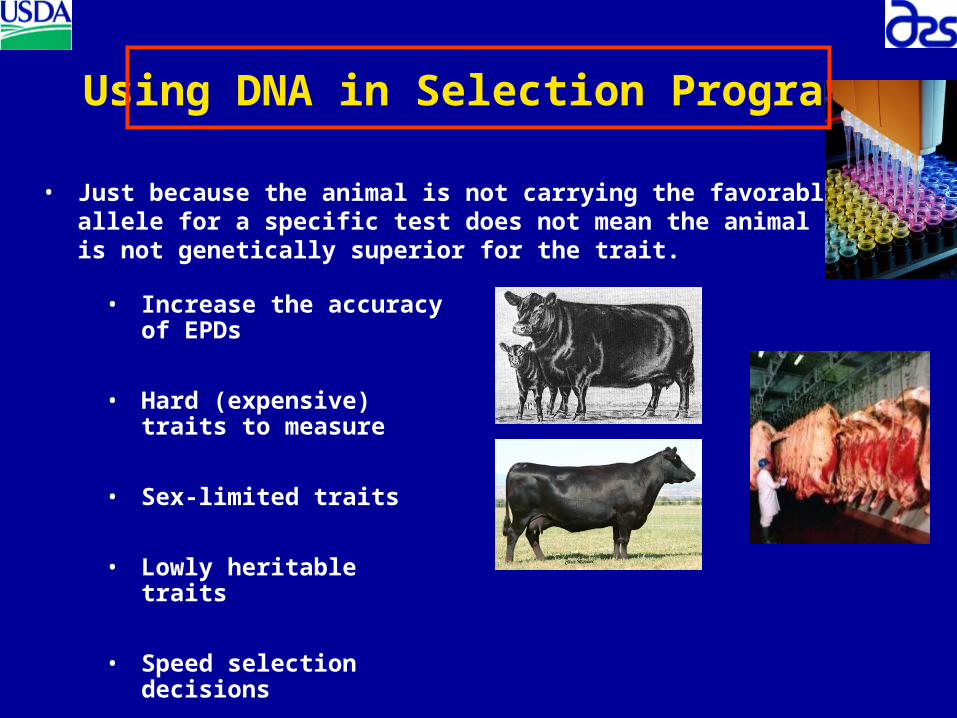
Using DNA in Selection Programs
• Just because the animal is not carrying the favorable allele for a specific test does not mean the animal is not genetically superior for the trait.
• Increase the accuracy of EPDs
• Hard (expensive) traits to measure
• Sex-limited traits
• Lowly heritable traits
• Speed selection decisions
• Merchandising genetics
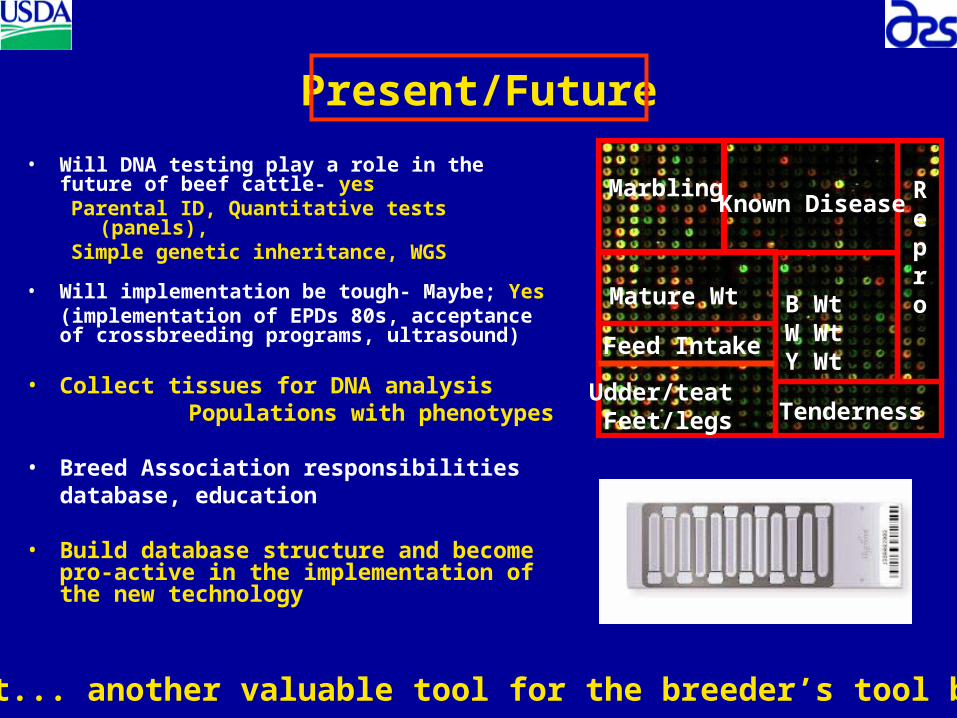
Present/Future
• Will DNA testing play a role in the future of beef cattle- yes
Parental ID, Quantitative tests (panels), Simple genetic inheritance, WGS
• Will implementation be tough- Maybe; Yes(implementation of EPDs 80s, acceptance of crossbreeding programs, ultrasound)
• Collect tissues for DNA analysis Populations with phenotypes
• Breed Association responsibilities database, education
• Build database structure and become pro-active in the implementation of the new technology
But... another valuable tool for the breeder’s tool box
Marbling
B WtW WtY Wt
Tenderness
Mature Wt
Repro
Known Disease
Feed Intake
Udder/teat Feet/legs
Vision
• Larger panels of markers that explain greater portions of the genetic variation for traits. MAS MAM
• WGS - ?
Example - BW EPD 1.2 acc .75 on yearling bull– Validation, implementation
• Change in costs? – Technology driven
Questions