Embed Size (px)
Citation preview

Customer Advanced Technologies Program Presents…
Prepared by Safdar Chaudhry (Nexant), Yanda Zhang (HMG) & Bruce Baccei (SMUD)
Energy Research & Development
Sacramento Municipal Utility District
December 15, 2011
Report # ET11SMUD1014
i
The information, statements, representations, graphs and data presented in this report are provided by SMUD as a service to our customers. SMUD does not endorse products or manufacturers. Mention of any particular product or manufacturer in this report should not be construed as an implied endorsement.
CONTENTS
1 EXECUTIVE SUMMARY ........................................................................................................1
1.1 TECHNOLOGY DESCRIPTION ......................................................................................................................... 1 1.2 SITE DESCRIPTION ...................................................................................................................................... 1 1.3 ASSESSMENT METHODOLOGY ...................................................................................................................... 1 1.4 RESULTS AND FINDINGS .............................................................................................................................. 1
2 INTRODUCTION ..................................................................................................................3
2.1 TECHNOLOGY DESCRIPTION ......................................................................................................................... 3 2.2 THE FACILITY ............................................................................................................................................ 4 2.3 HVAC EQUIPMENT .................................................................................................................................... 4
2.3.1 Cooling .................................................................................................................................... 4 2.3.2 Heating ................................................................................................................................... 5
2.4 BASELINE V.S. EFFICIENT MEASURE ............................................................................................................... 7
3 DATA MONITORING ............................................................................................................8
3.1 MONITORING PARAMETERS ......................................................................................................................... 8 3.1.1 One-time Measurement: ........................................................................................................ 8 3.1.2 Monitoring Measurement: ..................................................................................................... 8
3.2 SPECIFICATIONS OF MONITORING EQUIPMENT ................................................................................................ 8 3.3 MONITORING APPROACH .......................................................................................................................... 10 3.4 CHILLER CONTROL LOGIC .......................................................................................................................... 10 3.5 CHILLER OPERATING CONDITIONS ............................................................................................................... 11
4 RESULTS, ANALYSIS, AND DISCUSSIONS ............................................................................. 12
4.1 ANALYSIS METHOD .................................................................................................................................. 12 4.2 MONITORING RESULTS ............................................................................................................................. 13
4.2.1 Efficiency vs. Chiller Load ...................................................................................................... 13 4.2.2 Chiller Load V.S. Outside Air Temperature ........................................................................... 16 4.2.3 Chilled Water Cooling Load and Cooling Tower Duty ........................................................... 18 4.2.4 LCHWT and ECWS V.S. Outside Air Temperature ................................................................. 19 4.2.5 kW vs. Outside Air Temperature and Annual kWh Estimate ................................................ 20
5 CONCLUSIONS AND RECOMMENDATIONS ......................................................................... 21
APPENDIX A MONITORED AND WEATHER DATA AND CALCULATIONS ................................. A1
Contents
ii
The information, statements, representations, graphs and data presented in this report are provided by SMUD as a service to our customers. SMUD does not endorse products or manufacturers. Mention of any particular product or manufacturer in this report should not be construed as an implied endorsement.
TABLES AND FIGURES Tables
Table 3-1: AHRI 550/590 Test Conditions ....................................................................................................... 11 Table 4-1: Percent Load Difference between Chilled Water Cooling Load and Cooling Tower Duty ................ 18 Table 4-2: kWh Analysis TMY Data ................................................................................................................. 20
Figures
Figure 2-1: Chiller with three 90-ton Turbocor Compressors ............................................................................ 5 Figure 2-2: Chiller Control Panel ....................................................................................................................... 6 Figure 2-3: Chilled Water Circulation Pumps .................................................................................................... 6 Figure 2-4: Screen Capture of Energy Management System Monitor Display ................................................... 7 Figure 3-1: A HOBO 4-Channel Logger Installation for Water Temperature Measurements.............................. 9 Figure 3-2: Ultrasonic Flow Meter Installation for Chilled Water Flow Measurements ................................... 10 Figure 4-1: kW/Ton vs. % Chiller Load: Monitored.......................................................................................... 13 Figure 4-2: kW/Ton vs. % Chiller Load at various LCHWT set points: by SMARDT ........................................... 14 Figure 4-3: kW/Ton vs. % Chiller Load: SD Facility Case Study (3 x 150ton) ..................................................... 15 Figure 4-4: kW/Ton vs. % Chiller Load: SD Facility Case Study (3 x 150ton) ..................................................... 15 Figure 4-5: Chiller Load vs. OAT ...................................................................................................................... 17 Figure 4-6: CHW & CW Supply Temp vs. OAT .................................................................................................. 19
About the Customer Advanced Technologies Program…
SMUD’s Customer Advanced Technologies (C.A.T.) program works with customers to encourage the use and evaluation of new or
underutilized technologies. The program provides funding for customers in exchange for monitoring rights. Completed
demonstration projects include lighting technologies, light emitting diodes (LEDs), indirect/direct evaporative cooling, non -
chemical water t reatment systems, daylighting and a variety of other technologies.
For more program information, please visit: https://www.smud.org/en/business/save-energy/rebates-incentives-financing/customer-advanced-technologies.htm
1
The information, statements, representations, graphs and data presented in this report are provided by SMUD as a service to our customers. SMUD does not endorse products or manufacturers. Mention of any particular product or manufacturer in this report should not be construed as an implied endorsement.
1 EXECUTIVE SUMMARY
1.1 TECHNOLOGY DESCRIPTION
Turbocor is a frictionless, oil-free, variable speed, centrifugal compressor designed for mid-size
chiller applications. The permanent magnet motor with built-in variable speed drive allows the
system to match the compressor output to the load. The magnetic bearings allow frictionless
operation of the impeller shaft and eliminate the need for any oil and related components. The
control system allows for the ability to monitor and optimize performance, as well as integration
with many building automation systems.
The technology assessment was made on two SMARDT chillers with Turbocor compressors that
were installed in April, 2011. The Turbocor compressors are 90 ton in capacity each, with variable
speed control, 460V/3 phase/60Hz and Rated Load Amperes (or FLA) of 75A.
1.2 SITE DESCRIPTION
The monitored facility is a commercial office building built in 1989. Located at K Street in downtown
Sacramento, California, the building has eighteen floors, of which twelve floors are tenant occupied
and six floors are developed for parking. The typical building operating hours are 6am to 6pm on
weekdays. Most tenants in the building are lobbyists who work with the various federal and state
government agencies in the surrounding area.
1.3 ASSESSMENT METHODOLOGY
The monitoring objective was to gather data in order to assess technology performance and
compare site data with manufacturer performance specifications. Twenty-three full days’ worth of
data, in 5-minute intervals, was logged and analyzed. Data were collected at varying operating
conditions to characterize Turbocor compressor’s performance. The team set out to collect data
needed to plot the kW/ton curve over the full range of load conditions.
1.4 RESULTS AND FINDINGS
The SMARDT chillers with Turbocor compressors retrofitted in this case study exhibited part-load
kW/Ton performance similar to that provided by the equipment manufacturer. The monitored
results showed a relatively lower kW value at the lower range of part-load condition (~0.3 kW/Ton
for 20-40% part load) in comparison to results documented by other case studies.
The monitored results revealed areas of improvement for the control and operation of the chillers.
The team’s recommendations include:
Review and correct control programming

SECTION 1 Executive Summary
2
The information, statements, representations, graphs and data presented in this report are provided by SMUD as a service to our customers. SMUD does not endorse products or manufacturers. Mention of any particular product or manufacturer in this report should not be construed as an implied endorsement.
- Chiller #2 controls be checked and corrected due to the unusual performance curve.
- The control sequence logic between the two chillers should be checked so that load is shared equally amongst them to maximum high efficiency at part-load conditions.
- Both chillers should be checked to have variable chilled and condenser water setpoints, either based on ambient conditions or building load, to maximize the saving potential.
Provide additional staff training
- As with all emerging technologies, awareness and knowledge of measure usage is lower than typical measures. Similarly, in this case study, the facility staff was not fully aware of the extent and usage of the chiller controls. Additional staff training will likely improve system performance.
3
The information, statements, representations, graphs and data presented in this report are provided by SMUD as a service to our customers. SMUD does not endorse products or manufacturers. Mention of any particular product or manufacturer in this report should not be construed as an implied endorsement.
2 INTRODUCTION
This report assesses of the performance of Turbocor Chillers. The objective of this assessment has
been to determine chiller efficiency at varying loads and under AHRI conditions. Two recently
installed Turbocor Chillers were monitored for a period of approximately three weeks. This report
discusses the methodology and presents a summary of the results of this monitoring.
2.1 TECHNOLOGY DESCRIPTION
Turbocor is a frictionless, oil-free, variable speed, centrifugal compressor, designed for mid-size
chiller applications (60-90 tons), that compares favorably to the most efficient standard
compressors at full load, and offers significant savings at part load. Turbocor compressors are
designed for mid-size chillers and rooftop Heating, Ventilating, and Air Conditioning (HVAC) units.
However, this technology is not designed to serve medium- and low-temperature applications, such
as refrigerated storage or freezer applications. These can be used as a single compressor or bundled
together in parallel for larger applications. Features of the Turbocor include:
Magnetic Bearings: The compressor uses magnetically levitated bearings on the single rotating part – the rotor shaft – eliminating the need for oil. Having no oil eliminates the need for oil pumps, sumps, heaters, coolers, and oil separators. The rotating compressor shaft is suspended in a magnetic field. The bearing system uses permanent magnets for the primary work and electro-magnets for fine-tuning. An internal digital control system senses and repositions the shaft with the electro-magnets six million times each minute. The digital control can sense shaft movement of less than 0.00005 inches on five axes.
Motor: The Turbocor compressor uses a high efficiency permanent-magnet synchronous motor that is refrigerant-cooled and operates at speeds of up to 48,000 rpm. Using permanent magnets, instead of stator windings, makes the motor smaller and lighter than conventional induction motors. Though not specifically rated by the manufacturer, the motor delivers about 75 hp at full load, but is approximately the size of a 15-hp three-phase induction motor.
Variable Speed Drive (VSD): Turbocor’s inverter was developed for speed control. Power comes in between 50 and 60 hertz (Hz) alternating current (AC) and is converted to DC. The inverter reconstructs the AC wave to vary it between 300-800 Hz. This gives an operating range for the compressor of between 18,000 and 48,000 rpm. The VSD is integrated into the compressor housing. This allows the electronics to be refrigerant-cooled. The VSD also serves as a soft-start that reduces the initial starting current to less than five amps.
Centrifugal Compressor: The compressor uses two open-shrouded (“semi-open”) impellers and uses R-134a as the refrigerant. The compressor uses inlet guide vanes to pre-swirl the gaseous refrigerant before entering the compressor. This pre-swirl imparts a rotation to the refrigerant in the same direction as the impeller rotation before it enters the first stage of the compressor. This reduces some of the work needed to compress the refrigerant, particularly at part load. The inlet vanes are also adjustable to help balance the load. There

SECTION 2 Introduction
4
The information, statements, representations, graphs and data presented in this report are provided by SMUD as a service to our customers. SMUD does not endorse products or manufacturers. Mention of any particular product or manufacturer in this report should not be construed as an implied endorsement.
is a side-stream inlet port between the two compressor stages to allow for economizing. After the second stage, the refrigerant passes through the discharge with an integrated check-valve to prevent short-circuiting or reversal of the shaft.
Digital Control: The electronics and controls have been fully integrated into the system. They were designed to be easy to access and maintain and offer plug-and-play ease. The high-voltage and low-voltage systems are separated for ease of maintenance and troubleshooting. The controls can be integrated with a building management system for automation and data logging. The user interface is available in several different communication protocols for use with almost any system.
2.2 THE FACILITY
The monitored facility is a commercial office building built in 1989. Located in Sacramento,
California, the building has eighteen floors, of which twelve floors are tenant occupied and six floors
are developed for parking. The typical building operating hours are 6am to 6pm on weekdays. Most
tenants in the building are lobbyists who work with the various federal and state government
agencies in the surrounding area.
2.3 HVAC EQUIPMENT
The HVAC equipment serving the facility includes the following components:
2.3.1 Cooling
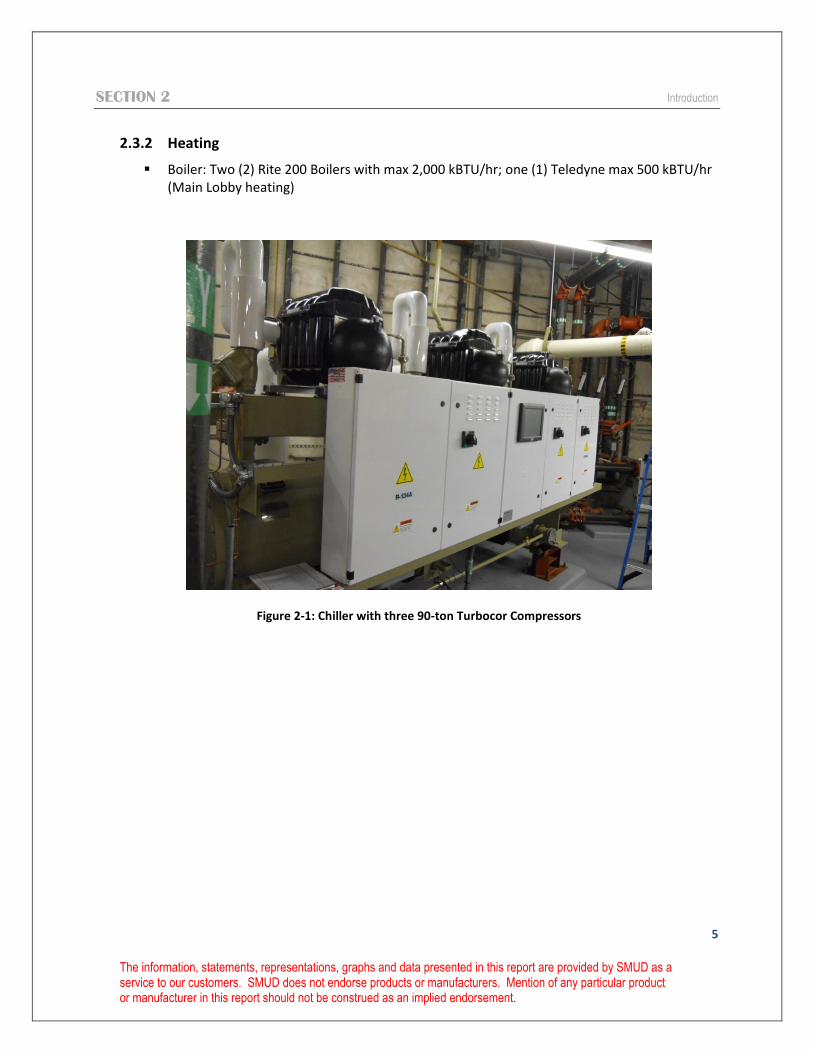
Two (2) Chillers with three (3) 90-ton Turbocor compressors each (chiller is shown in Figure 2-1 and control panel in Figure 2-2)
Air handling distribution (AHU): One (1) McQuay system per tenant floor
Cooling Tower: one (1) B.A.C. T-1 663-OC, with 660 ton force draft
Condenser water pumps: Two (2) Bell and Gosset Model #1510 (with 25hp Baldor Reliance Super-E motor and VFD controlled)
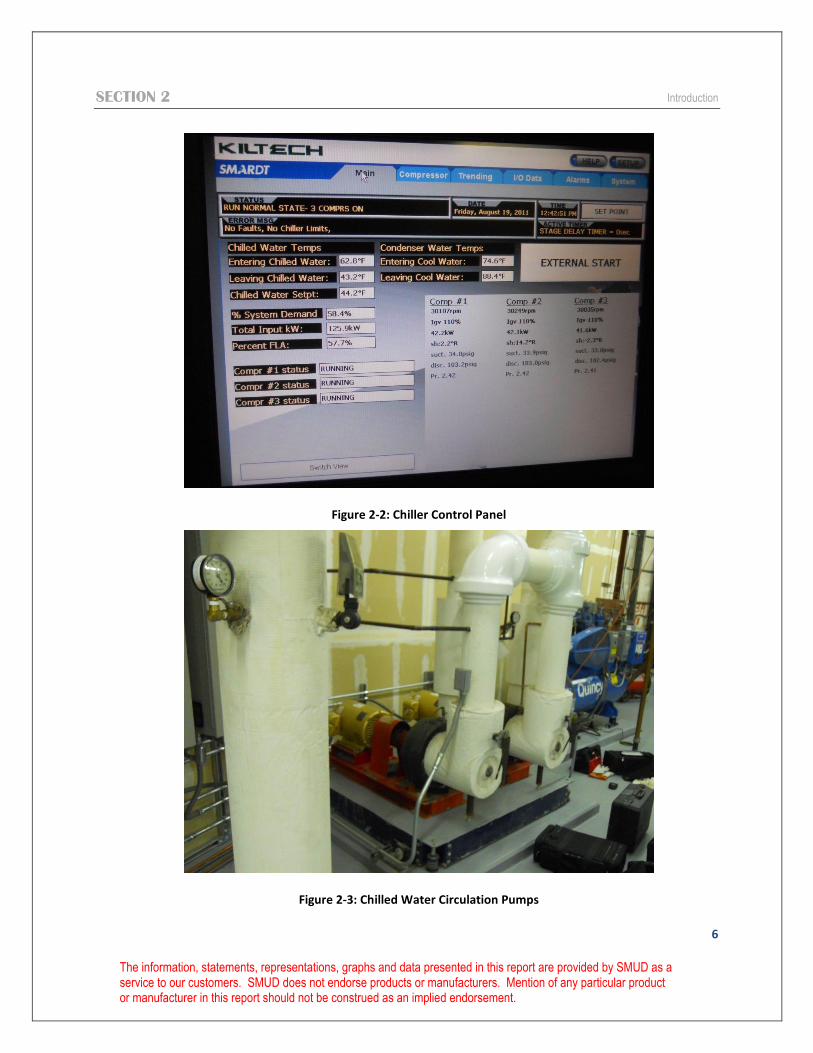
Chilled water pumps: Two (2) Bell and Gosset Model #1410/3E/10 3/8 (with 20hp Baldor Reliance Super-E motor and VFD controlled; shown in Figure 2-2)
Tenant loop condenser water pump: One (1) Model # 3x7 6.8758F (3hp Baldor Reliance Super-E motor and VFD controlled)
Energy Management System: Novar (screen capture of system monitor display is shown in Figure 2-4)
HVAC controls: The building has pneumatic controls on HVAC equipment. The building has a variable air volume distribution with variable frequency drive (VFD) equipped fan motors. The chilled water pumps, condenser water pumps, hot water pumps, and cooling tower fans were also equipped with VFD controls.
Heat pump: Two (2) 10-ton heat pumps (Main Lobby cooling)
SECTION 2 Introduction
5
The information, statements, representations, graphs and data presented in this report are provided by SMUD as a service to our customers. SMUD does not endorse products or manufacturers. Mention of any particular product or manufacturer in this report should not be construed as an implied endorsement.
2.3.2 Heating
Boiler: Two (2) Rite 200 Boilers with max 2,000 kBTU/hr; one (1) Teledyne max 500 kBTU/hr (Main Lobby heating)
Figure 2-1: Chiller with three 90-ton Turbocor Compressors
SECTION 2 Introduction
6
The information, statements, representations, graphs and data presented in this report are provided by SMUD as a service to our customers. SMUD does not endorse products or manufacturers. Mention of any particular product or manufacturer in this report should not be construed as an implied endorsement.
Figure 2-2: Chiller Control Panel
Figure 2-3: Chilled Water Circulation Pumps
SECTION 2 Introduction
7
The information, statements, representations, graphs and data presented in this report are provided by SMUD as a service to our customers. SMUD does not endorse products or manufacturers. Mention of any particular product or manufacturer in this report should not be construed as an implied endorsement.
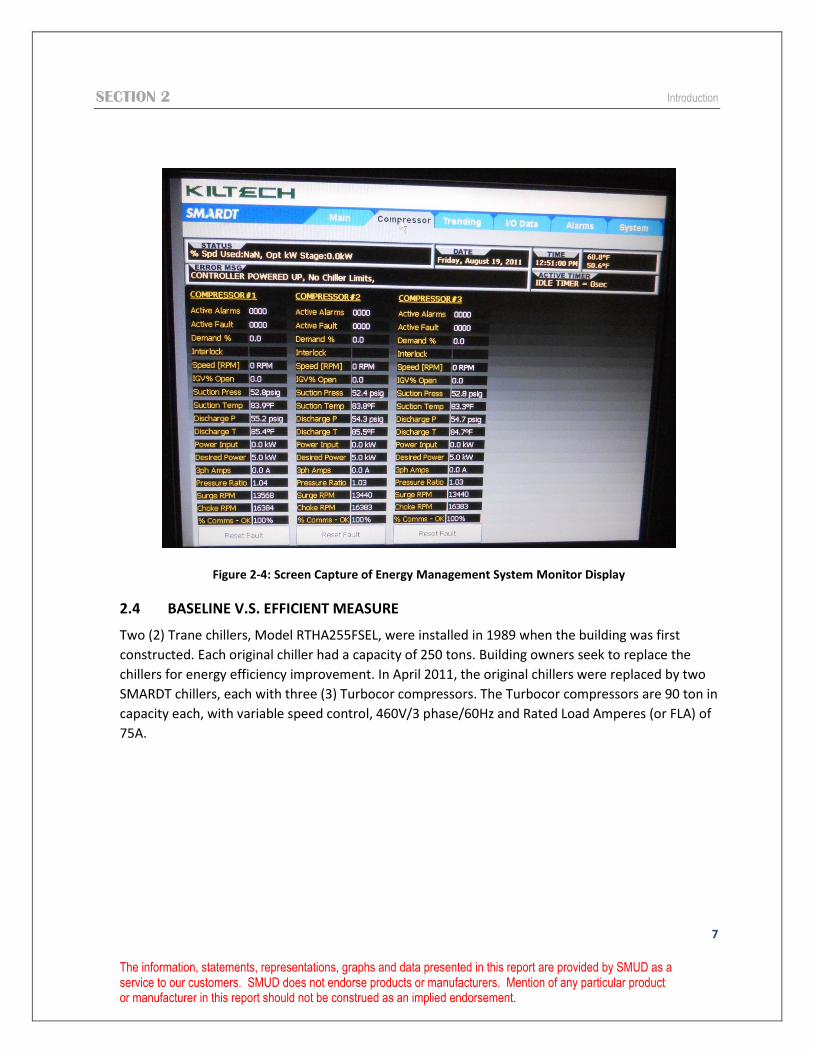
Figure 2-4: Screen Capture of Energy Management System Monitor Display
2.4 BASELINE V.S. EFFICIENT MEASURE
Two (2) Trane chillers, Model RTHA255FSEL, were installed in 1989 when the building was first
constructed. Each original chiller had a capacity of 250 tons. Building owners seek to replace the
chillers for energy efficiency improvement. In April 2011, the original chillers were replaced by two
SMARDT chillers, each with three (3) Turbocor compressors. The Turbocor compressors are 90 ton in
capacity each, with variable speed control, 460V/3 phase/60Hz and Rated Load Amperes (or FLA) of
75A.

8
The information, statements, representations, graphs and data presented in this report are provided by SMUD as a service to our customers. SMUD does not endorse products or manufacturers. Mention of any particular product or manufacturer in this report should not be construed as an implied endorsement.
3 DATA MONITORING
The monitoring objective was to gather data in order to assess technology performance and
compare site data with manufacturer performance specifications. Twenty-three full days’ worth of
data, in 5-minute intervals, was logged and analyzed. Data monitoring by Nexant, Inc. engineers
occurred from August 19th through September 12th, 2011.
3.1 MONITORING PARAMETERS
The following monitoring parameters were used in the study:
3.1.1 One-time Measurement:
Chiller voltage, amps, power factor (and consequently kW)
3.1.2 Monitoring Measurement:
Chiller amperage profiles
Entering and leaving chilled water temperatures (ECHWT and LCHWT)
Chilled water flow
Entering and leaving condenser water supply temperatures (ECWT and LCWT)
Condenser water flow
3.2 SPECIFICATIONS OF MONITORING EQUIPMENT
For the one-time power/energy quantity measurements, the study utilized the Summer PS3000
Energy Analyzer. Accuracy of the energy analyzer is as follows:
Current: 0.5% (in addition to the accuracy of the Summit current probe)
Voltage: 0.5%
Frequency: 0.5%
Power/power factor: 1% (in addition the accuracy of the Summit current probe)
For the continuous current measurements, Summit Technology HA 100 probes were deployed. The
probes have an accuracy of 2%.
For water temperature measurements, the study used Onset – HOBO 4-Channel Loggers with CTVA
and CTAB split core transducers. These have accuracy of ±4.5% of full scale. A typical logger
installation is shown in Figure 3-1.
SECTION 3 Data Monitoring
9
The information, statements, representations, graphs and data presented in this report are provided by SMUD as a service to our customers. SMUD does not endorse products or manufacturers. Mention of any particular product or manufacturer in this report should not be construed as an implied endorsement.
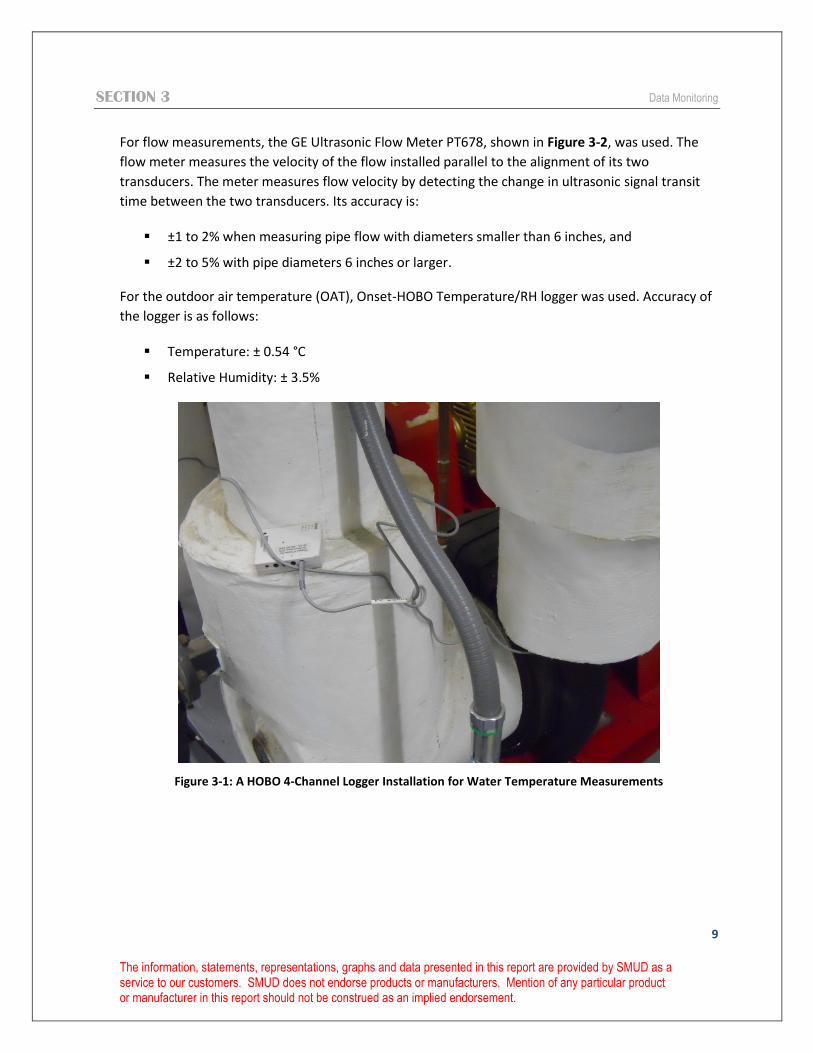
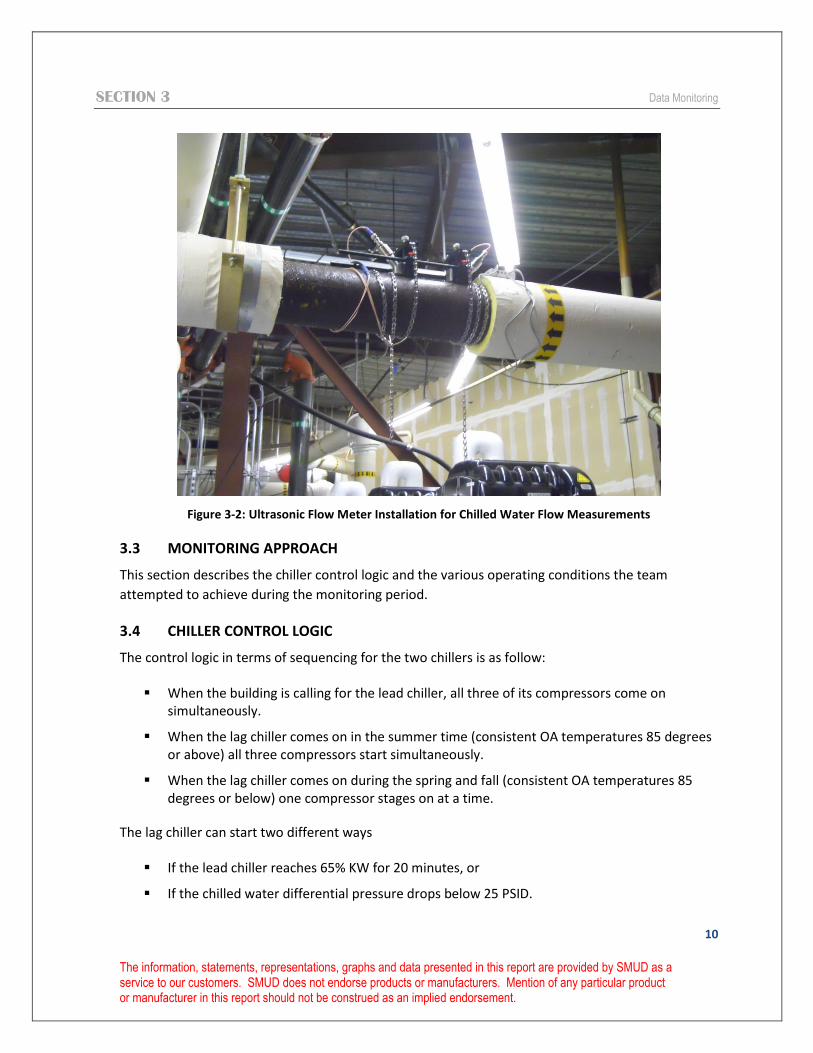
For flow measurements, the GE Ultrasonic Flow Meter PT678, shown in Figure 3-2, was used. The
flow meter measures the velocity of the flow installed parallel to the alignment of its two
transducers. The meter measures flow velocity by detecting the change in ultrasonic signal transit
time between the two transducers. Its accuracy is:
±1 to 2% when measuring pipe flow with diameters smaller than 6 inches, and
±2 to 5% with pipe diameters 6 inches or larger.
For the outdoor air temperature (OAT), Onset-HOBO Temperature/RH logger was used. Accuracy of
the logger is as follows:
Temperature: ± 0.54 °C
Relative Humidity: ± 3.5%
Figure 3-1: A HOBO 4-Channel Logger Installation for Water Temperature Measurements
SECTION 3 Data Monitoring
10
The information, statements, representations, graphs and data presented in this report are provided by SMUD as a service to our customers. SMUD does not endorse products or manufacturers. Mention of any particular product or manufacturer in this report should not be construed as an implied endorsement.
Figure 3-2: Ultrasonic Flow Meter Installation for Chilled Water Flow Measurements
3.3 MONITORING APPROACH
This section describes the chiller control logic and the various operating conditions the team
attempted to achieve during the monitoring period.
3.4 CHILLER CONTROL LOGIC
The control logic in terms of sequencing for the two chillers is as follow:
When the building is calling for the lead chiller, all three of its compressors come on simultaneously.
When the lag chiller comes on in the summer time (consistent OA temperatures 85 degrees or above) all three compressors start simultaneously.
When the lag chiller comes on during the spring and fall (consistent OA temperatures 85 degrees or below) one compressor stages on at a time.
The lag chiller can start two different ways
If the lead chiller reaches 65% KW for 20 minutes, or
If the chilled water differential pressure drops below 25 PSID.
SECTION 3 Data Monitoring
11
The information, statements, representations, graphs and data presented in this report are provided by SMUD as a service to our customers. SMUD does not endorse products or manufacturers. Mention of any particular product or manufacturer in this report should not be construed as an implied endorsement.
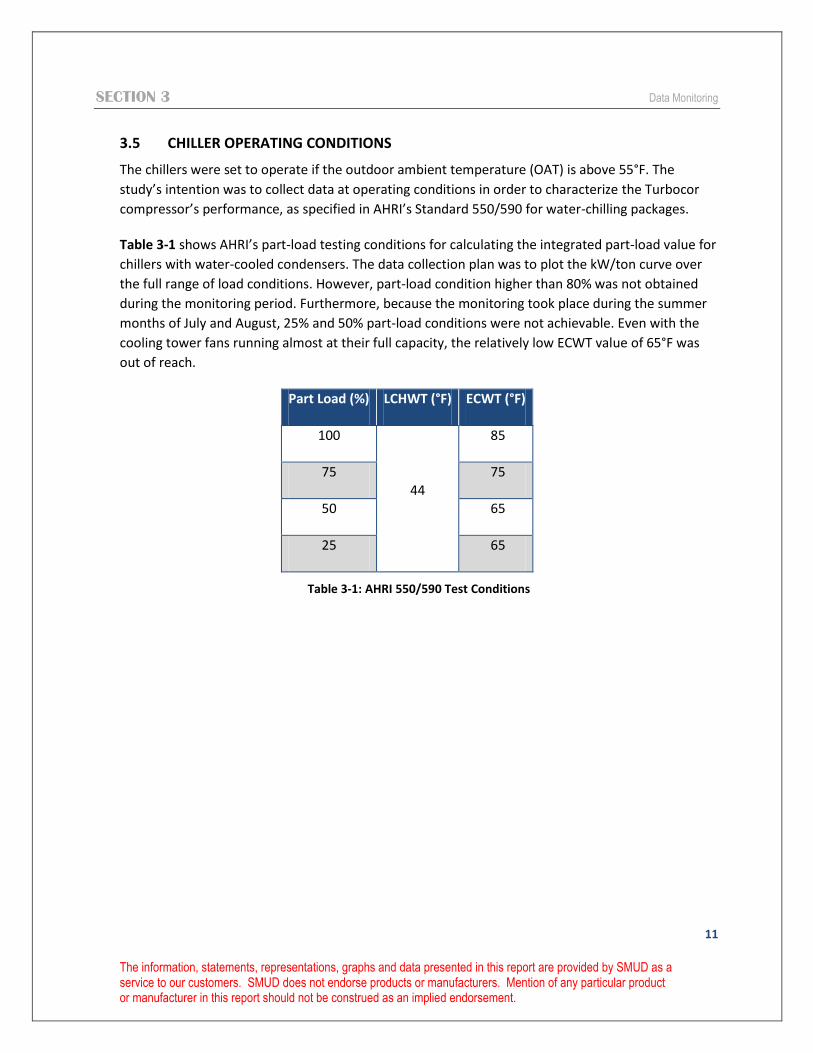
3.5 CHILLER OPERATING CONDITIONS
The chillers were set to operate if the outdoor ambient temperature (OAT) is above 55°F. The
study’s intention was to collect data at operating conditions in order to characterize the Turbocor
compressor’s performance, as specified in AHRI’s Standard 550/590 for water-chilling packages.
Table 3-1 shows AHRI’s part-load testing conditions for calculating the integrated part-load value for
chillers with water-cooled condensers. The data collection plan was to plot the kW/ton curve over
the full range of load conditions. However, part-load condition higher than 80% was not obtained
during the monitoring period. Furthermore, because the monitoring took place during the summer
months of July and August, 25% and 50% part-load conditions were not achievable. Even with the
cooling tower fans running almost at their full capacity, the relatively low ECWT value of 65°F was
out of reach.
Part Load (%) LCHWT (°F) ECWT (°F)
100
44
85
75 75
50 65
25 65
Table 3-1: AHRI 550/590 Test Conditions
12
The information, statements, representations, graphs and data presented in this report are provided by SMUD as a service to our customers. SMUD does not endorse products or manufacturers. Mention of any particular product or manufacturer in this report should not be construed as an implied endorsement.
4 RESULTS, ANALYSIS, AND DISCUSSIONS
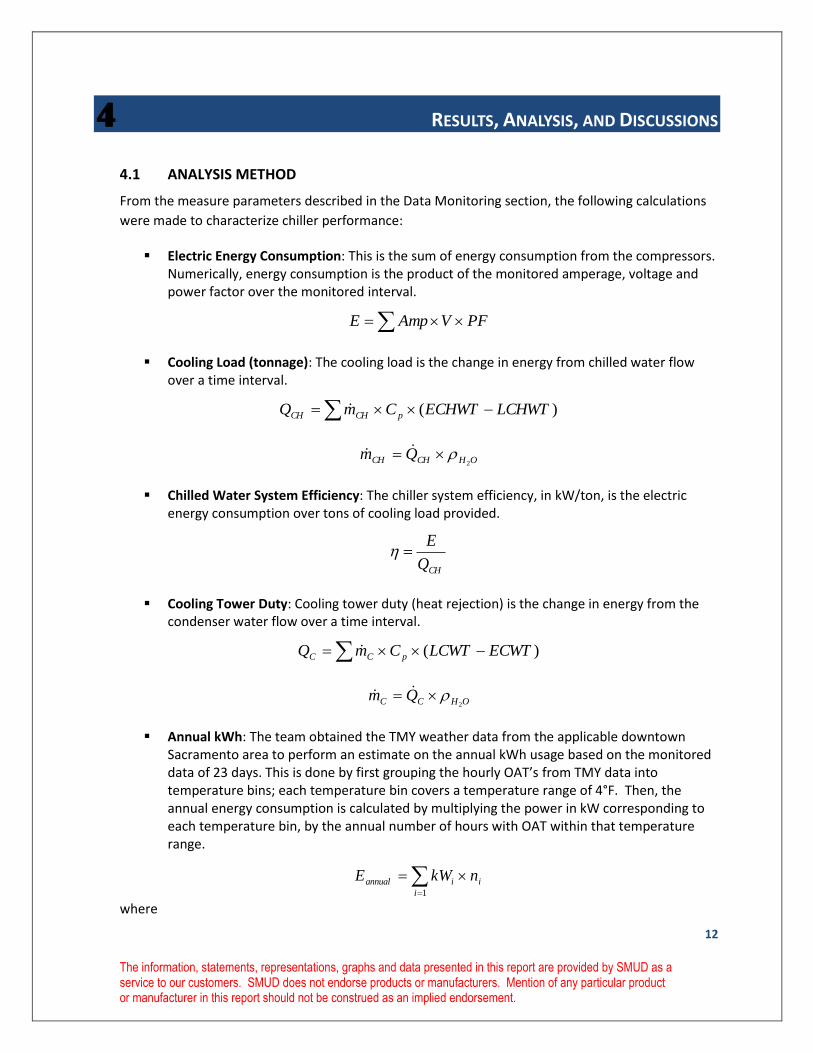
4.1 ANALYSIS METHOD
From the measure parameters described in the Data Monitoring section, the following calculations
were made to characterize chiller performance:
Electric Energy Consumption: This is the sum of energy consumption from the compressors. Numerically, energy consumption is the product of the monitored amperage, voltage and power factor over the monitored interval.
PFVAmpE
Cooling Load (tonnage): The cooling load is the change in energy from chilled water flow over a time interval.
)( LCHWTECHWTCmQ pCHCH
OHCHCH Qm2
Chilled Water System Efficiency: The chiller system efficiency, in kW/ton, is the electric energy consumption over tons of cooling load provided.
CHQ
E
Cooling Tower Duty: Cooling tower duty (heat rejection) is the change in energy from the condenser water flow over a time interval.
)( ECWTLCWTCmQ pCC
OHCC Qm2
Annual kWh: The team obtained the TMY weather data from the applicable downtown Sacramento area to perform an estimate on the annual kWh usage based on the monitored data of 23 days. This is done by first grouping the hourly OAT’s from TMY data into temperature bins; each temperature bin covers a temperature range of 4°F. Then, the annual energy consumption is calculated by multiplying the power in kW corresponding to each temperature bin, by the annual number of hours with OAT within that temperature range.
1i
iiannual nkWE
where
SECTION 4 Results, Analysis, and Discussions
13
The information, statements, representations, graphs and data presented in this report are provided by SMUD as a service to our customers. SMUD does not endorse products or manufacturers. Mention of any particular product or manufacturer in this report should not be construed as an implied endorsement.
kWi is the averaged monitored power within the bin temperature range
ni is the annual number of hours which fall within the bin temperature range
4.2 MONITORING RESULTS
This section displays the analyzed results and discusses the implications on chiller performances and
operation.
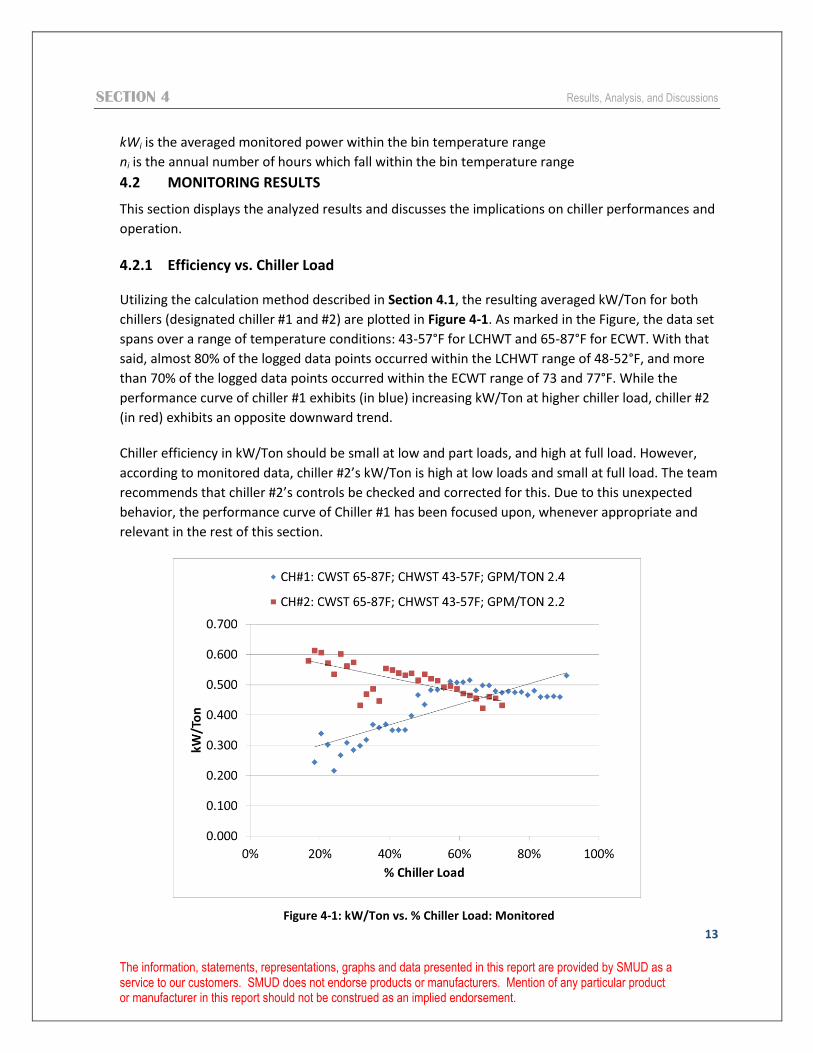
4.2.1 Efficiency vs. Chiller Load
Utilizing the calculation method described in Section 4.1, the resulting averaged kW/Ton for both
chillers (designated chiller #1 and #2) are plotted in Figure 4-1. As marked in the Figure, the data set
spans over a range of temperature conditions: 43-57°F for LCHWT and 65-87°F for ECWT. With that
said, almost 80% of the logged data points occurred within the LCHWT range of 48-52°F, and more
than 70% of the logged data points occurred within the ECWT range of 73 and 77°F. While the
performance curve of chiller #1 exhibits (in blue) increasing kW/Ton at higher chiller load, chiller #2
(in red) exhibits an opposite downward trend.
Chiller efficiency in kW/Ton should be small at low and part loads, and high at full load. However,
according to monitored data, chiller #2’s kW/Ton is high at low loads and small at full load. The team
recommends that chiller #2’s controls be checked and corrected for this. Due to this unexpected
behavior, the performance curve of Chiller #1 has been focused upon, whenever appropriate and
relevant in the rest of this section.
Figure 4-1: kW/Ton vs. % Chiller Load: Monitored
SECTION 4 Results, Analysis, and Discussions
14
The information, statements, representations, graphs and data presented in this report are provided by SMUD as a service to our customers. SMUD does not endorse products or manufacturers. Mention of any particular product or manufacturer in this report should not be construed as an implied endorsement.
There are a few general observations from the monitoring activities. First, the chillers are supposed
to produce chilled water temperature at 44°F anytime they operate. However, monitored data
indicated that the chillers are producing 50 to 52F chilled water for the majority of the time for
unknown reasons. Furthermore, the trend data reveals that the chiller tonnage is above 270 tons for
some morning hours. This could be due to the transient effects during the chiller start time.
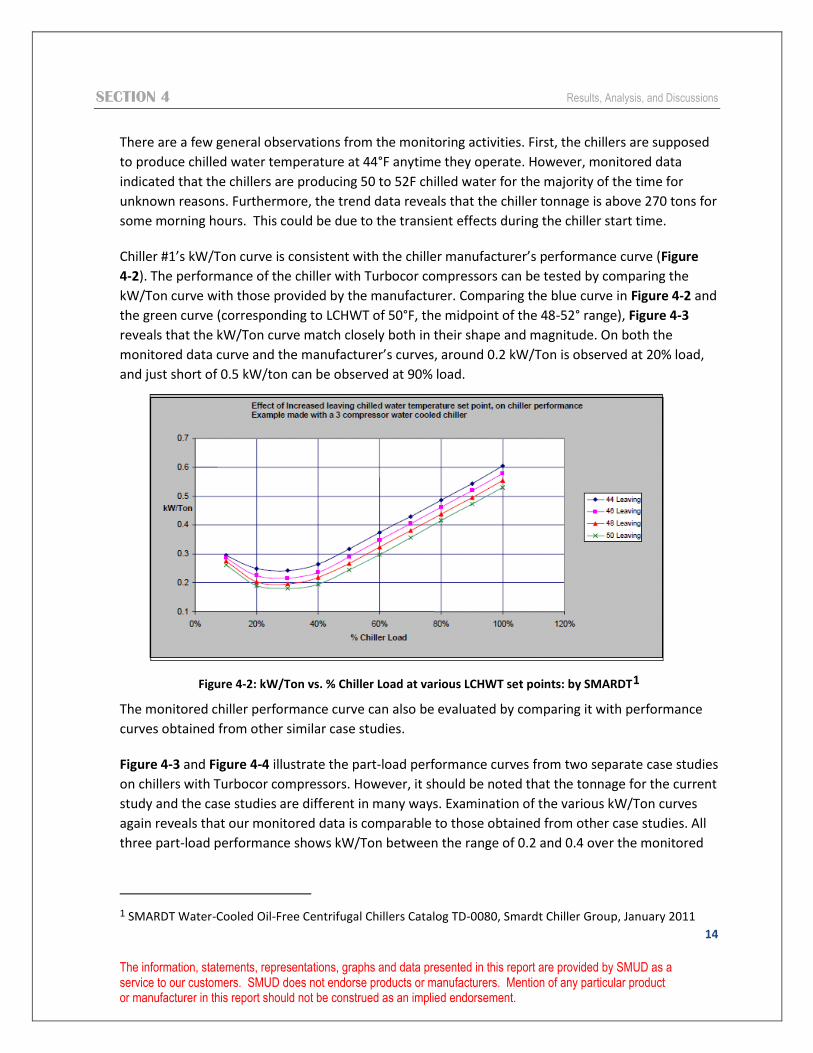
Chiller #1’s kW/Ton curve is consistent with the chiller manufacturer’s performance curve (Figure
4-2). The performance of the chiller with Turbocor compressors can be tested by comparing the
kW/Ton curve with those provided by the manufacturer. Comparing the blue curve in Figure 4-2 and
the green curve (corresponding to LCHWT of 50°F, the midpoint of the 48-52° range), Figure 4-3
reveals that the kW/Ton curve match closely both in their shape and magnitude. On both the
monitored data curve and the manufacturer’s curves, around 0.2 kW/Ton is observed at 20% load,
and just short of 0.5 kW/ton can be observed at 90% load.
Figure 4-2: kW/Ton vs. % Chiller Load at various LCHWT set points: by SMARDT1
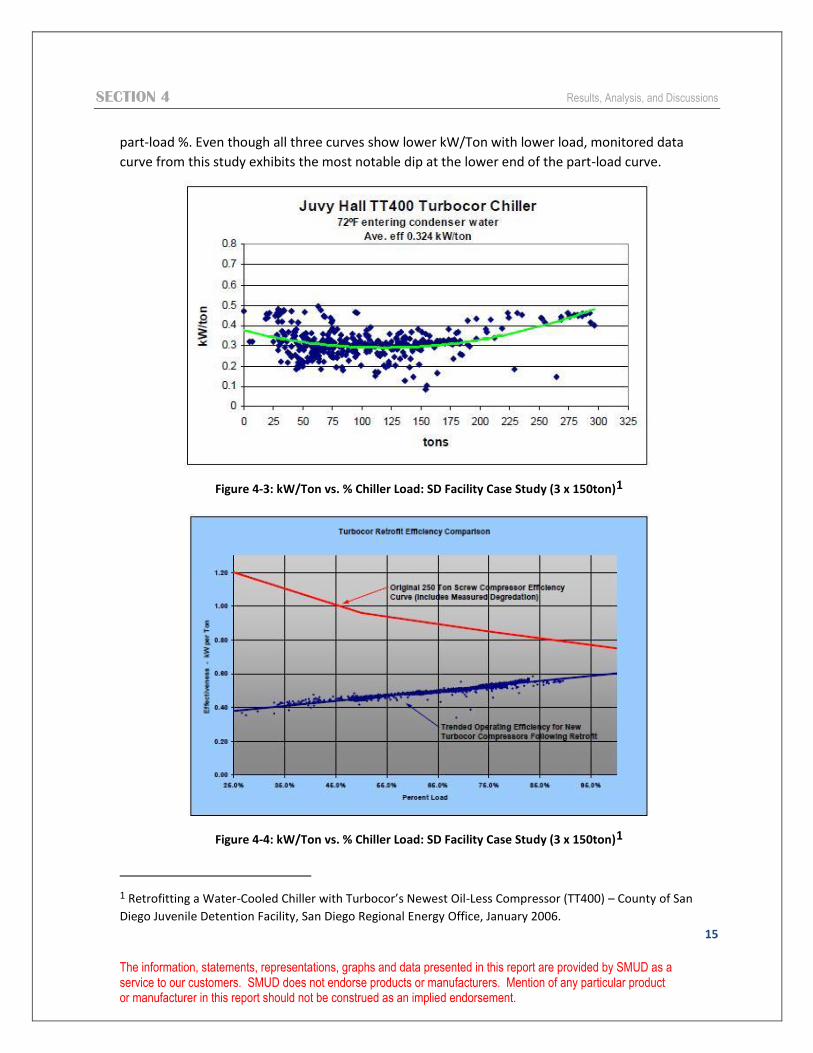
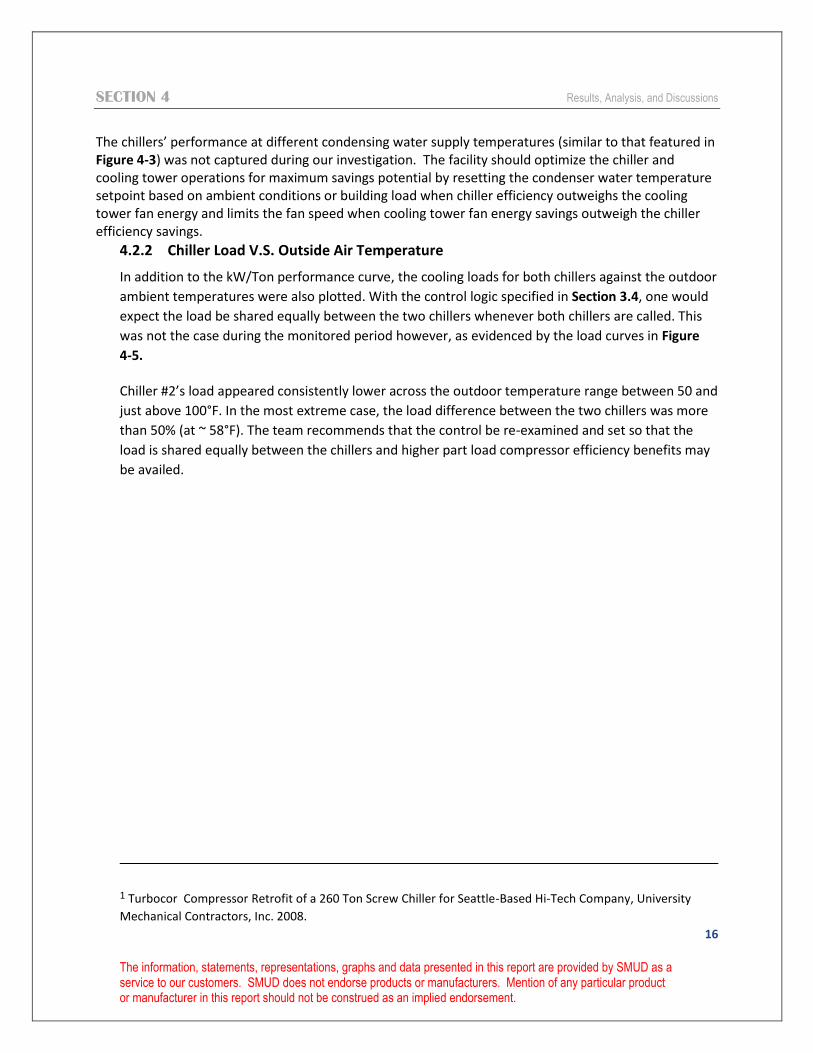
The monitored chiller performance curve can also be evaluated by comparing it with performance
curves obtained from other similar case studies.
Figure 4-3 and Figure 4-4 illustrate the part-load performance curves from two separate case studies
on chillers with Turbocor compressors. However, it should be noted that the tonnage for the current
study and the case studies are different in many ways. Examination of the various kW/Ton curves
again reveals that our monitored data is comparable to those obtained from other case studies. All
three part-load performance shows kW/Ton between the range of 0.2 and 0.4 over the monitored
1 SMARDT Water-Cooled Oil-Free Centrifugal Chillers Catalog TD-0080, Smardt Chiller Group, January 2011
SECTION 4 Results, Analysis, and Discussions
15
The information, statements, representations, graphs and data presented in this report are provided by SMUD as a service to our customers. SMUD does not endorse products or manufacturers. Mention of any particular product or manufacturer in this report should not be construed as an implied endorsement.
part-load %. Even though all three curves show lower kW/Ton with lower load, monitored data
curve from this study exhibits the most notable dip at the lower end of the part-load curve.
Figure 4-3: kW/Ton vs. % Chiller Load: SD Facility Case Study (3 x 150ton)1
Figure 4-4: kW/Ton vs. % Chiller Load: SD Facility Case Study (3 x 150ton)1
1 Retrofitting a Water-Cooled Chiller with Turbocor’s Newest Oil-Less Compressor (TT400) – County of San
Diego Juvenile Detention Facility, San Diego Regional Energy Office, January 2006.
SECTION 4 Results, Analysis, and Discussions
16
The information, statements, representations, graphs and data presented in this report are provided by SMUD as a service to our customers. SMUD does not endorse products or manufacturers. Mention of any particular product or manufacturer in this report should not be construed as an implied endorsement.
The chillers’ performance at different condensing water supply temperatures (similar to that featured in Figure 4-3) was not captured during our investigation. The facility should optimize the chiller and cooling tower operations for maximum savings potential by resetting the condenser water temperature setpoint based on ambient conditions or building load when chiller efficiency outweighs the cooling tower fan energy and limits the fan speed when cooling tower fan energy savings outweigh the chiller efficiency savings.
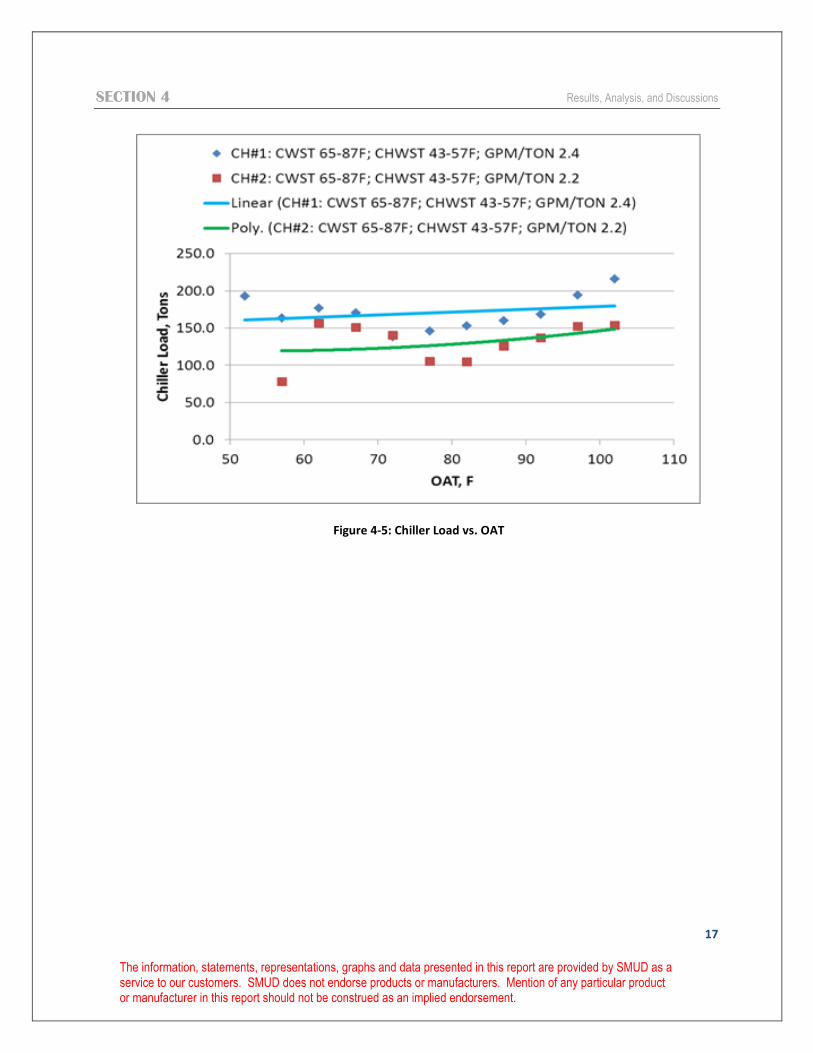
4.2.2 Chiller Load V.S. Outside Air Temperature
In addition to the kW/Ton performance curve, the cooling loads for both chillers against the outdoor
ambient temperatures were also plotted. With the control logic specified in Section 3.4, one would
expect the load be shared equally between the two chillers whenever both chillers are called. This
was not the case during the monitored period however, as evidenced by the load curves in Figure
4-5.
Chiller #2’s load appeared consistently lower across the outdoor temperature range between 50 and
just above 100°F. In the most extreme case, the load difference between the two chillers was more
than 50% (at ~ 58°F). The team recommends that the control be re-examined and set so that the
load is shared equally between the chillers and higher part load compressor efficiency benefits may
be availed.
1 Turbocor Compressor Retrofit of a 260 Ton Screw Chiller for Seattle-Based Hi-Tech Company, University
Mechanical Contractors, Inc. 2008.
SECTION 4 Results, Analysis, and Discussions
17
The information, statements, representations, graphs and data presented in this report are provided by SMUD as a service to our customers. SMUD does not endorse products or manufacturers. Mention of any particular product or manufacturer in this report should not be construed as an implied endorsement.
Figure 4-5: Chiller Load vs. OAT
SECTION 4 Results, Analysis, and Discussions
18
The information, statements, representations, graphs and data presented in this report are provided by SMUD as a service to our customers. SMUD does not endorse products or manufacturers. Mention of any particular product or manufacturer in this report should not be construed as an implied endorsement.
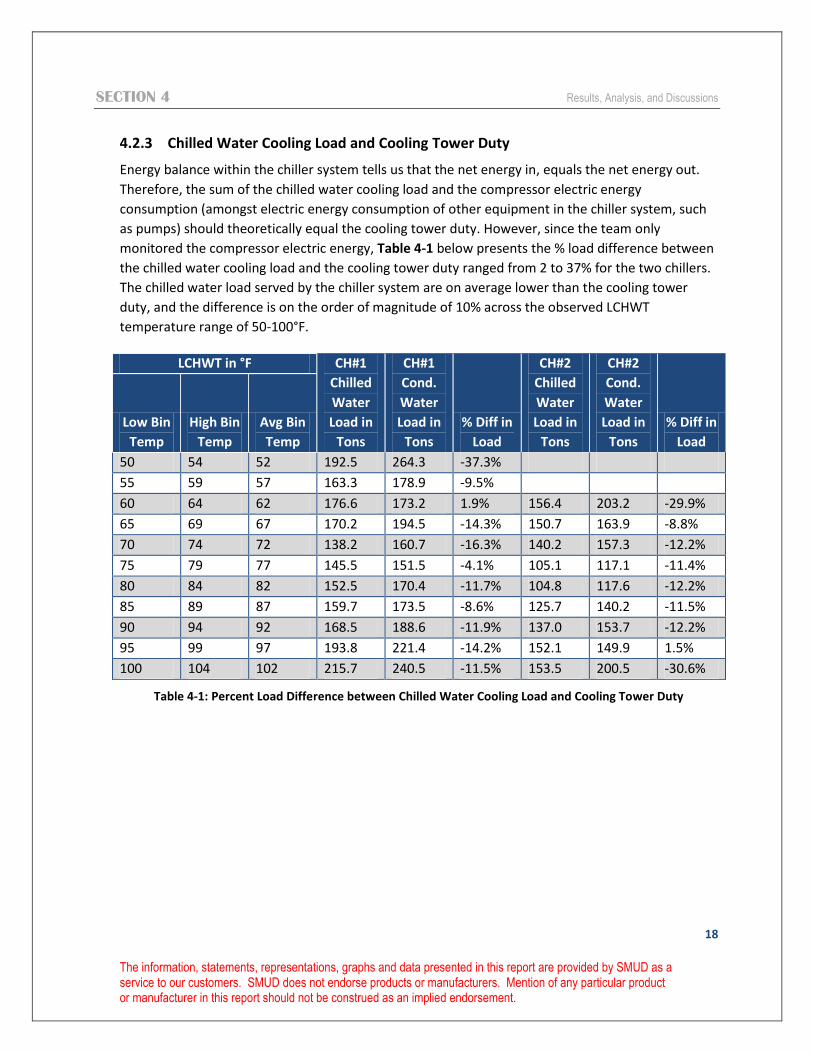
4.2.3 Chilled Water Cooling Load and Cooling Tower Duty
Energy balance within the chiller system tells us that the net energy in, equals the net energy out.
Therefore, the sum of the chilled water cooling load and the compressor electric energy
consumption (amongst electric energy consumption of other equipment in the chiller system, such
as pumps) should theoretically equal the cooling tower duty. However, since the team only
monitored the compressor electric energy, Table 4-1 below presents the % load difference between
the chilled water cooling load and the cooling tower duty ranged from 2 to 37% for the two chillers.
The chilled water load served by the chiller system are on average lower than the cooling tower
duty, and the difference is on the order of magnitude of 10% across the observed LCHWT
temperature range of 50-100°F.
LCHWT in °F CH#1
Chilled
Water
Load in
Tons
CH#1
Cond.
Water
Load in
Tons
% Diff in
Load
CH#2
Chilled
Water
Load in
Tons
CH#2
Cond.
Water
Load in
Tons
% Diff in
Load
Low Bin
Temp
High Bin
Temp
Avg Bin
Temp
50 54 52 192.5 264.3 -37.3%
55 59 57 163.3 178.9 -9.5%
60 64 62 176.6 173.2 1.9% 156.4 203.2 -29.9%
65 69 67 170.2 194.5 -14.3% 150.7 163.9 -8.8%
70 74 72 138.2 160.7 -16.3% 140.2 157.3 -12.2%
75 79 77 145.5 151.5 -4.1% 105.1 117.1 -11.4%
80 84 82 152.5 170.4 -11.7% 104.8 117.6 -12.2%
85 89 87 159.7 173.5 -8.6% 125.7 140.2 -11.5%
90 94 92 168.5 188.6 -11.9% 137.0 153.7 -12.2%
95 99 97 193.8 221.4 -14.2% 152.1 149.9 1.5%
100 104 102 215.7 240.5 -11.5% 153.5 200.5 -30.6%
Table 4-1: Percent Load Difference between Chilled Water Cooling Load and Cooling Tower Duty
SECTION 4 Results, Analysis, and Discussions
19
The information, statements, representations, graphs and data presented in this report are provided by SMUD as a service to our customers. SMUD does not endorse products or manufacturers. Mention of any particular product or manufacturer in this report should not be construed as an implied endorsement.
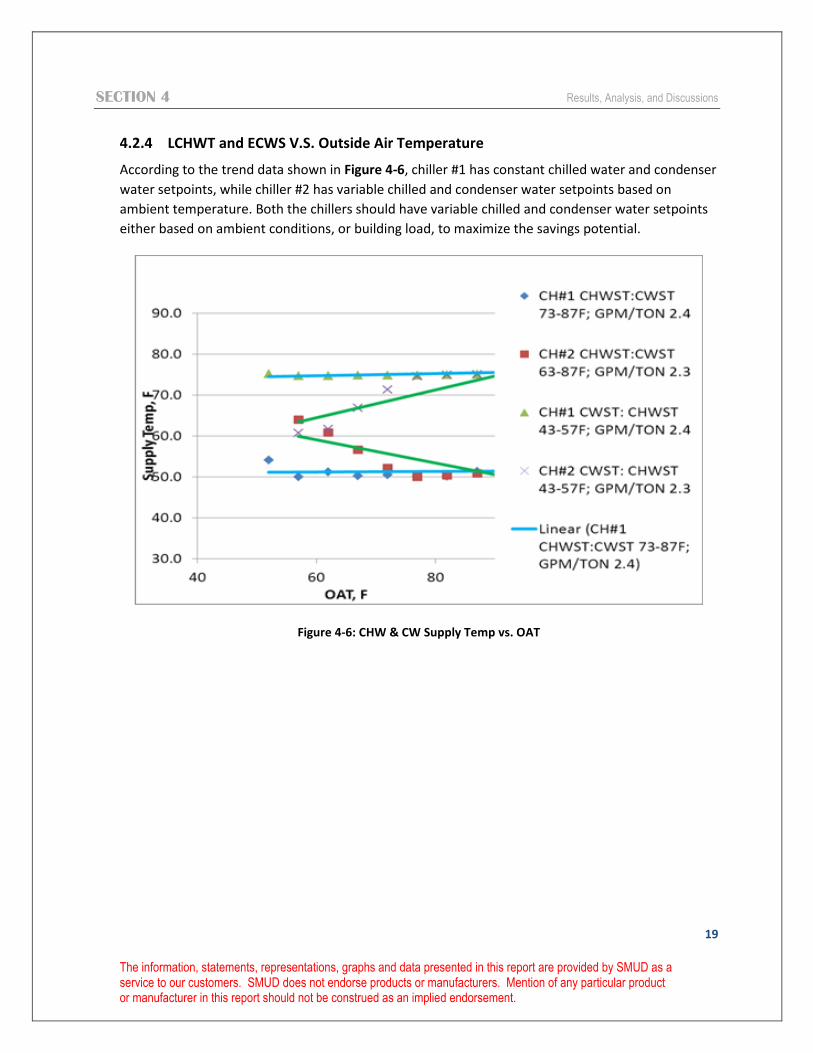
4.2.4 LCHWT and ECWS V.S. Outside Air Temperature
According to the trend data shown in Figure 4-6, chiller #1 has constant chilled water and condenser
water setpoints, while chiller #2 has variable chilled and condenser water setpoints based on
ambient temperature. Both the chillers should have variable chilled and condenser water setpoints
either based on ambient conditions, or building load, to maximize the savings potential.
Figure 4-6: CHW & CW Supply Temp vs. OAT
SECTION 4 Results, Analysis, and Discussions
20
The information, statements, representations, graphs and data presented in this report are provided by SMUD as a service to our customers. SMUD does not endorse products or manufacturers. Mention of any particular product or manufacturer in this report should not be construed as an implied endorsement.
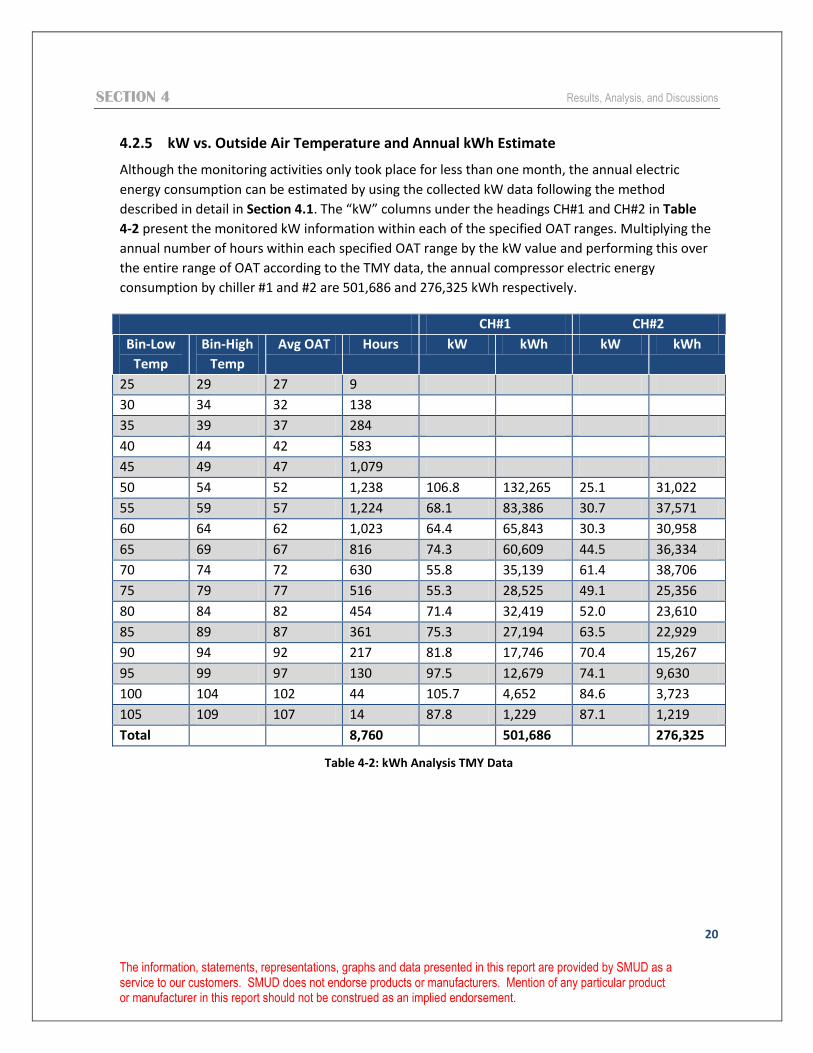
4.2.5 kW vs. Outside Air Temperature and Annual kWh Estimate
Although the monitoring activities only took place for less than one month, the annual electric
energy consumption can be estimated by using the collected kW data following the method
described in detail in Section 4.1. The “kW” columns under the headings CH#1 and CH#2 in Table
4-2 present the monitored kW information within each of the specified OAT ranges. Multiplying the
annual number of hours within each specified OAT range by the kW value and performing this over
the entire range of OAT according to the TMY data, the annual compressor electric energy
consumption by chiller #1 and #2 are 501,686 and 276,325 kWh respectively.
CH#1 CH#2
Bin-Low
Temp
Bin-High
Temp
Avg OAT Hours kW kWh kW kWh
25 29 27 9
30 34 32 138
35 39 37 284
40 44 42 583
45 49 47 1,079
50 54 52 1,238 106.8 132,265 25.1 31,022
55 59 57 1,224 68.1 83,386 30.7 37,571
60 64 62 1,023 64.4 65,843 30.3 30,958
65 69 67 816 74.3 60,609 44.5 36,334
70 74 72 630 55.8 35,139 61.4 38,706
75 79 77 516 55.3 28,525 49.1 25,356
80 84 82 454 71.4 32,419 52.0 23,610
85 89 87 361 75.3 27,194 63.5 22,929
90 94 92 217 81.8 17,746 70.4 15,267
95 99 97 130 97.5 12,679 74.1 9,630
100 104 102 44 105.7 4,652 84.6 3,723
105 109 107 14 87.8 1,229 87.1 1,219
Total 8,760 501,686 276,325
Table 4-2: kWh Analysis TMY Data

21
The information, statements, representations, graphs and data presented in this report are provided by SMUD as a service to our customers. SMUD does not endorse products or manufacturers. Mention of any particular product or manufacturer in this report should not be construed as an implied endorsement.
5 CONCLUSIONS AND RECOMMENDATIONS
The SMARDT chillers with Turbocor compressors retrofitted in this case study exhibited part-load
kW/Ton performance similar to that provided by the equipment manufacturer. The monitored
results showed a relatively lower KW value at the lower range of part-load condition (~0.3 kW/Ton
for 20-40% part load) in comparison to results documented by other case studies.
The monitored results revealed areas of improvement for the control and operation of chillers. The
team’s recommendations include:
Review and Correct Control Programming
- Chiller #2 controls should be checked and corrected, due to the unusual performance curve.
- The control sequence logic between the two chillers should be checked so that load is shared equally amongst them to maximum high efficiency at part-load conditions.
- Both chillers should be checked to have variable chilled and condenser water setpoints, either based on ambient conditions, or building load, to maximize the saving potential.
Provide Additional Staff Training
- As with all emerging technologies, awareness and knowledge of measure usage is lower than typical measures. Proper staff training will likely improve system performance.

A-1
The information, statements, representations, graphs and data presented in this report are provided by SMUD as a service to our customers. SMUD does not endorse products or manufacturers. Mention of any particular product or manufacturer in this report should not be construed as an implied endorsement.
Appendix A MONITORED AND WEATHER DATA AND CALCULATIONS
The contents of this section are being submitted electronically for convenience.
1. Raw Monitored Data
2. Processed Monitored Data
3. Weather Data
4. Turbocor Chiller Analysis