Embed Size (px)
Citation preview

CVP Seminar
Heathrow Academy - 7th December 2016
WELCOME
Guy Hitchcock, Clean Vehicle Partnership
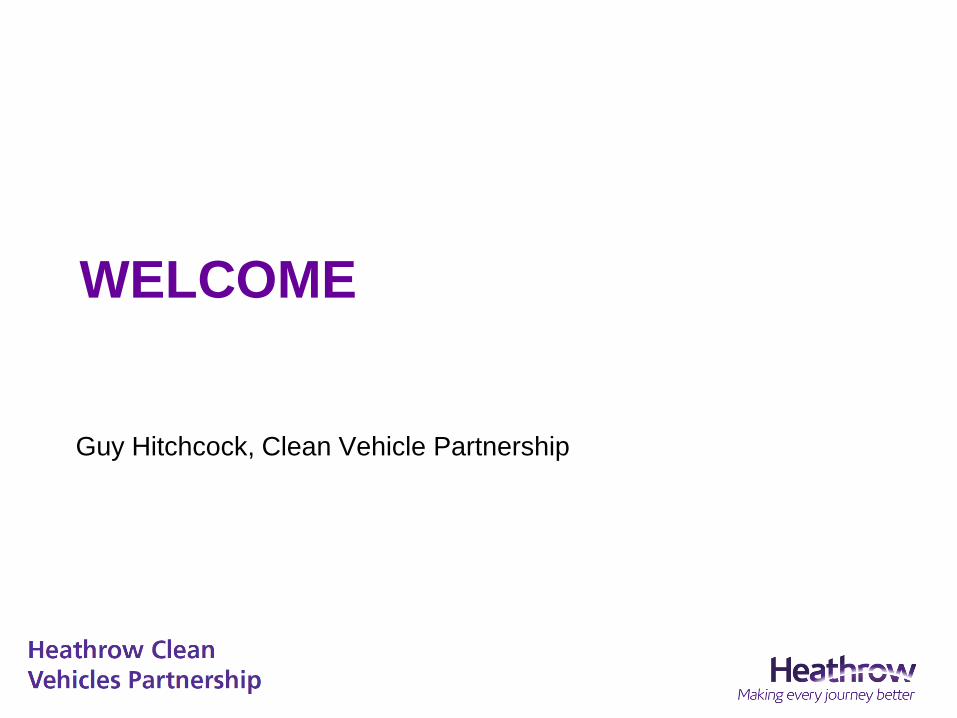
AgendaSession 1 – Update on low emission vehicle policy
10.00 ULEZ and Low Emission Vehicle policy in London
Simon Roberts, Policy Advisor, TfL
10.20 Incentives for Low Emission Vehicles
Alex Hanson, Office of Low Emission Vehicles
10.40 Real world performance of diesel vehicles, lessons for fleets
Jane Thomas, Emissions Analytics
11.00 Panel Discussion
11.20 Break
Session 2 – Developing EV infrastructure at Heathrow
11.40 A strategic approach to EV infrastructure at Heathrow
Andrew Chen, Heathrow Airport Limited
11.50 Developing the evidence base for an effective EV infrastructure
Jacob Roberts/Ian Anderson, Energy Saving Trust
12.20 The business case for EV’s at the airport
John Edmunds, Dnata
12.50 Panel Discussion
13.15 Lunch

ULEZ and Low
Emission Vehicle
policy in London

Contents
• Context
• Emission Surcharge (‘T-charge’)
• Emerging proposals for ULEZ
• Wider Electric Vehicle Policy
• Buses and Taxis
• Next Steps
2

Context

1952

Now

Impacts of air pollution
• Long term exposure estimated to
cause the equivalent of 9,400 deaths
in London per year and 29,000
nationally.
• The health impacts associated with
air pollution fall disproportionally on
our most vulnerable communities,
affecting the poorest and those from
minority ethnic groups more acutely.
6

NO2 Road Transport Problem
7
Aviation
8%

Mayor’s Clean Air Action Plan
1) Emission Surcharge (‘T-charge’) in
central London from 2017
2) Policy consultation
– ULEZ in Central London in 2019
instead of 2020
– Expanding the ULEZ Londonwide
for heavy vehicles only
– Expanding the ULEZ up to the
North and South Circular Roads for
all vehicles
3) Buses and Taxis
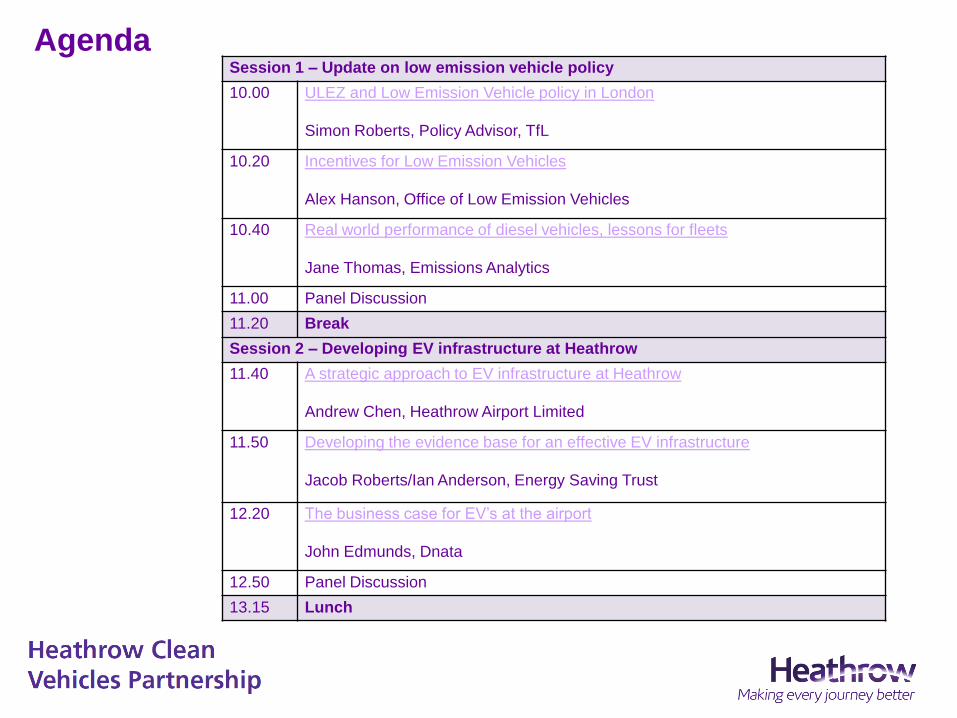
3 Stage Consultation
9
Stage 1 (5–29 July 2016): A consultation hosted
on the Talk London website on initial ideas to
tackle air quality.COMPLETE
Stage 2 (10 October–18 December 2016): A
statutory consultation to introduce the Emissions
Surcharge and a non-statutory consultation on
ideas for how the ULEZ could be improved.
THIS
CONSULTATION
Stage 3: A more detailed statutory consultation
on proposed alterations to the ULEZ, developed
after taking into consideration feedback from the
stage 2 consultation.
EXPECTED IN
2017
Emissions
Surcharge

What is the Emissions Surcharge ?
11
• Same boundary and times as Congestion Charge
• £10 surcharge (on top of the Congestion Charge)
• Charge will apply to all eligible pre-Euro 4 vehicles
(broadly equivalent to vehicles from 2005 and older)
• 90% Residents discount will apply to the surcharge
• Same discounts and exemptions as Congestion
Charge, plus historic vehicles and showman’s vehicles
• 9+seater vehicles will be eligible for the charge
• Scheme will come in to force on 23 Oct 2017
• An online compliance checker will be available

Emissions surcharge
impacts
12
Vehicle type Affected vehicles per day
Cars 7,000
Vans 2,000
HGV 400
Non-TfL bus and coach 600Potential NOx emission reduction
in central London

Emerging
proposals for
ULEZ

The Ultra Low Emission Zone - As it stands
14
Euro 4 petrol (c.2006)
Euro 6 diesel (c.2015)
...or £12.50 a day
Euro VI (c.2014)
...or £100 a day
Exempt but
new licencing rules
Euro 3 (c.2007)
...or £12.50 a day
Additional hybrid or
electric standard
Starts Sept 202024/7

15
ULEZ
standards
• Petrol:
Euro 4
• Diesel:
Euro 6
• Motorcycle
and L-Cat:
Euro 3
Emerging proposals for ULEZ

Bringing ULEZ forward to 2019
16

17
Non-compliant levels (average day)
HGV Coach
2019 31% 49%
2020 24% 40%
2021 20% 29%
2022 16% 21%
2023 13% 13%
• Euro VI standard for heavy vehicles out to the
current Low Emission Zone (London-wide) boundary
• Estimated 30 per cent road transport NOx reduction
London wide ULEZ for heavy vehicles

ULEZ expansion up to N/S circular
for all vehicles
18
Central Up to N/S Circular
Area 21 sq. km 381 sq. km (18 times larger)
Population 136k 3.8m (28 times larger)
Vehicles ~150,000 ~660,000 (4.5 times as many)

Extending ULEZ up to N/S Circular
19
Petrol car Diesel car Van HGV Coach
2019 15% 57% 55% 29% 45%
2020 10% 37% 43% 19% 33%
2021 8% 32% 35% 15% 24%
2022 6% 27% 28% 12% 16%
2023 4% 22% 22% 9% 11%
Projected non-compliance with ULEZ standards
• Affects the same vehicles as central London ULEZ
• Could consider a lower charge
• Approximately 40 per cent reduction in road transport
NOx inside the zone

Expanding ULEZ – Key issues to resolve
20
• Boundary
• Date of
implementation
• Exemptions/discounts/
sunset period
• Charge level

Low Emission
Vehicle Policy

ULEV Delivery Plan• The Ultra Low Emission Vehicle Delivery Plan
(2015) sets out London’s specific challenges to
unlocking widespread ULEV uptake and 15 new
actions to overcome them.
• The actions are based upon three pillars needed
to support the conversion of diesel and petrol
vehicles to ULEVs. These are:
• Infrastructure: Confidence for drivers that they
can charge up or refuel when they need to
• Vehicles on the roads: Increasing visibility
including through our own fleets
• Marketing and incentives: Incentives and policy
mechanisms
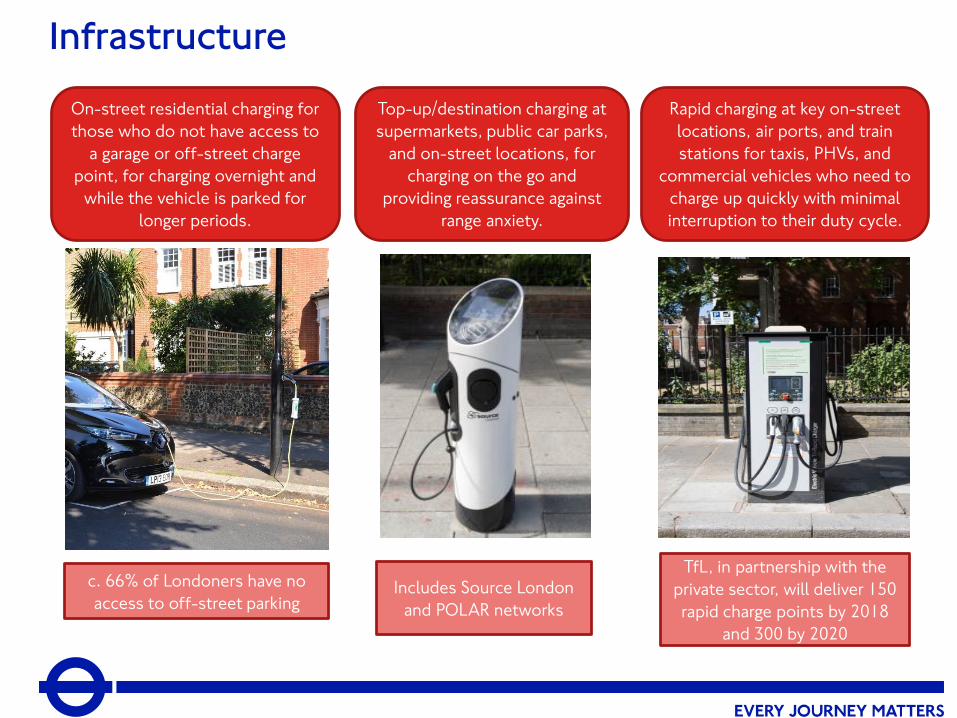
Infrastructure
On-street residential charging for
those who do not have access to
a garage or off-street charge
point, for charging overnight and
while the vehicle is parked for
longer periods.
Top-up/destination charging at
supermarkets, public car parks,
and on-street locations, for
charging on the go and
providing reassurance against
range anxiety.
Rapid charging at key on-street
locations, air ports, and train
stations for taxis, PHVs, and
commercial vehicles who need to
charge up quickly with minimal
interruption to their duty cycle.
c. 66% of Londoners have no
access to off-street parkingIncludes Source London
and POLAR networks
TfL, in partnership with the
private sector, will deliver 150
rapid charge points by 2018
and 300 by 2020

24
London has been awarded £13m from the government to
become a ‘Go Ultra Low’ City by 2020
~1,200 electric vehicle charge points to support residents
without off-street parking (approximately two thirds of
Londoners)
Charging infrastructure for car clubs to help industry
achieve target of 50 per cent of car club fleet to be ULEVs
by 2025
Helping deliver 300 rapid charge points by 2020 for
commercial fleets
Neighbourhoods of the Future - New local schemes
promote innovative charging infrastructure, policies and
initiatives to support the uptake of EVs across different
fleets.

• Industry led, with involvement from cities
across the UK (Manchester, Leeds and
Coventry)
• Economic benefits and health benefits
linked to improved air quality
• Helping fleets prepare for Ultra Low
Emission Zone (ULEZ)
• Already engaging with 700 organisations via
LoCITY
• LoCITY supports the roll-out of
infrastructure for alternatively fuelled
vehicles
LoCITY aims to increase the uptake and
availability of low emission commercial
vehicles as part of the Mayor’s Ultra Low
Emission Vehicle Delivery Plan
LoCITY Programme

LoCITY progress since launch Jan 2016
• Stakeholder engagement including annual
conference, interactive website and social
media
• Industry led working groups:
o vans under 3.5t
o construction and waste HGVs
o HGVs over 3.5t
o Policy, Planning, Procurement and Practice (4Ps)
• Research into:
o operator awareness and knowledge of ultra low emission
vehicles (ULEV)
o technical barriers preventing wider uptake of ULEVs
• Case study videos (electric van and process
evaluation)
• Refuelling and recharging infrastructure map
• Vehicle finder online tool
• Fleet Advice Programme (in progress)

Buses and
Taxis

Mayoral Announcements
• Introducing the ULEZ standards a year
early for double deck buses (2019)
• Single decker buses would meet
minimum Euro VI standard in 2019 and
be all electric or hydrogen in 2020
• Implementing up to 12 Low Emission
Bus Zones – tackling the worst
pollution hotspots by concentrating
cleaner buses on the dirtiest routes
• Only only procuring hybrid or zero emission double deck buses
from 2018
• Expanding the Euro V retrofit programme from 800 to over
4,000 buses and to 5,200 by 2021

• The Mayor wants to deliver the greenest taxi fleet in the world by:• Not licensing any more new diesel taxis and
only licensing new ‘zero emission capable’ taxis from 2018;
• Providing a £3,000 grant towards the first 9,000 ZEC taxis, in addition to the Government’s plug-in car grant;
• Delivering a rapid charging network from 2017;
• Introducing a scrappage scheme for the oldest taxis from 2017;
• Exploring options to convert to a cleaner fuel;
• Rewarding drivers who pioneer green technology, such as zero emission ranks.
29
Taxi Licensing

Private Hire Vehicles
30
• From 2018 all PHVs presented for licensing for the first time must meet either:
– Euro 6 (diesel/petrol) standards.
– At least Euro 4 (petrol-hybrids) emissions standards.
• From 2020:
– All newly manufactured PHVs (less than 18 months old) presented for licensing for the first time must be ZEC.
• From 2023:
– All PHVs presented for licensing for the first time must be ZEC.

Next Steps

Next steps
• Consultation closes on 18 December: tfl.gov.uk/airquality-
consultation or email [email protected].
• Mayoral decision on Emissions Surcharge expected in early
2017
• The Mayor will review the consultation results and decide
whether or not to proceed with further work to develop ULEZ
proposals
• Possible statutory consultation on specific proposals for ULEZ
in 2017
• TfL welcome the opportunity to meet stakeholders who wish
to have more in depth conversations.
• Revision of Mayor’s Transport Strategy and London
Environment Strategy32

Alex Hanson, Consumer IncentivesHeathrow Fleets Conference December 2016
Incentives for ultra-low emission vehicles

Stretching Government goals and funding since 2011 …
R&D Incentives Energy Issues Comms Infrastructure Supply Chain
SPENDING REVIEW
NOVEMBER 2015
The government will spend more
than £600m between 2015-16 and
2020-21 to support uptake and
manufacturing of ultra-low emission
vehicles (ULEVs) …and keep the
UK on track for all new cars to be
effectively zero emission by 2040.
‘Our aim is for almost every car an
van to be a zero emission vehicle
by 2050 ... and we will invest
£500m over the next five years to
achieve it.’
MANIFESTO
MAY 2015
2

Joint ministers
3
Greg Clark - BEIS Chris Grayling- DfT
Nick Hurd - BEIS John Hayes - DfT

Zero emission vehicles? FOUR key UK policy drivers.
Inward Investment
Air Quality
Carbon
Energy Security
4
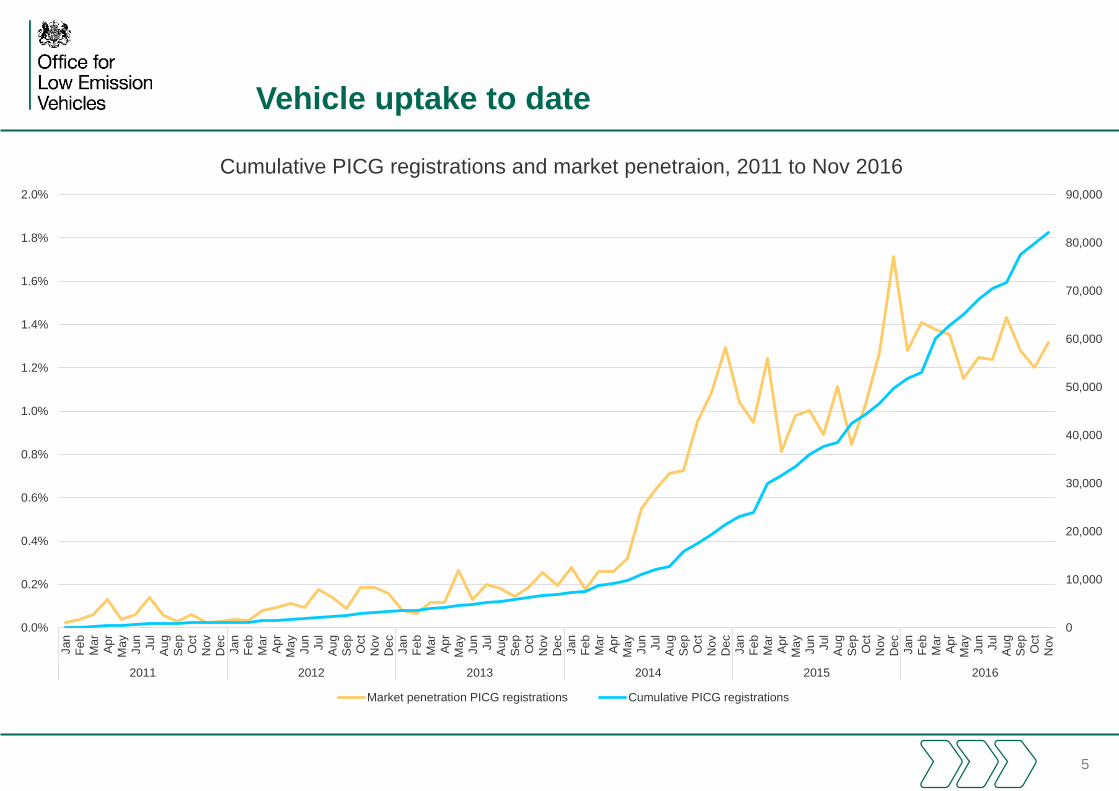
Vehicle uptake to date
5
0
10,000
20,000
30,000
40,000
50,000
60,000
70,000
80,000
90,000
0.0%
0.2%
0.4%
0.6%
0.8%
1.0%
1.2%
1.4%
1.6%
1.8%
2.0%
Jan
Fe
b
Ma
r
Ap
rM
ay
Jun
Jul
Au
g
Se
p
Oct
Nov
Dec
Jan
Fe
b
Ma
r
Ap
rM
ay
Jun
Jul
Au
g
Se
p
Oct
Nov
Dec
Jan
Fe
b
Ma
r
Ap
rM
ay
Jun
Jul
Au
g
Se
p
Oct
Nov
Dec
Jan
Fe
b
Ma
r
Ap
rM
ay
Jun
Jul
Au
g
Se
p
Oct
Nov
Dec
Jan
Fe
b
Ma
r
Ap
rM
ay
Jun
Jul
Au
g
Se
p
Oct
Nov
Dec
Jan
Fe
b
Ma
r
Ap
rM
ay
Jun
Jul
Au
g
Se
p
Oct
Nov
2011 2012 2013 2014 2015 2016
Cumulative PICG registrations and market penetraion, 2011 to Nov 2016
Market penetration PICG registrations Cumulative PICG registrations

UK charging network
UK has largest rapid
network in Europe.
96% of motorway rest
areas have 1 – 6 rapids
Over 11,000 publicly
available chargepoints
3, 7 and 22kw
6 major network
operators, 3 UK SMEs
8 regional networks
60,000 residential
chargepoints installed
• Ensure drivers ‘never
more than 20 miles from
a chargepoint on the
strategic road network’
900 43/50kw
chargepoints

Most comprehensive policy programme in the world?
£10m Battery prize
£10m+ Hydrogen
£125m+ Research and development
£30m+ Chargepoint infrastructure
£40m Go Ultra Low Cities
£20m Taxis
£30m Buses
£20m+ Other vehicles
£400m+ Plug-in Car Grant
£15m Highways England chargepoints
£35m London
£2m+ Go Ultra Low comms campaign
+£290m Autumn Statement funding

8
OLEV incentive
schemes
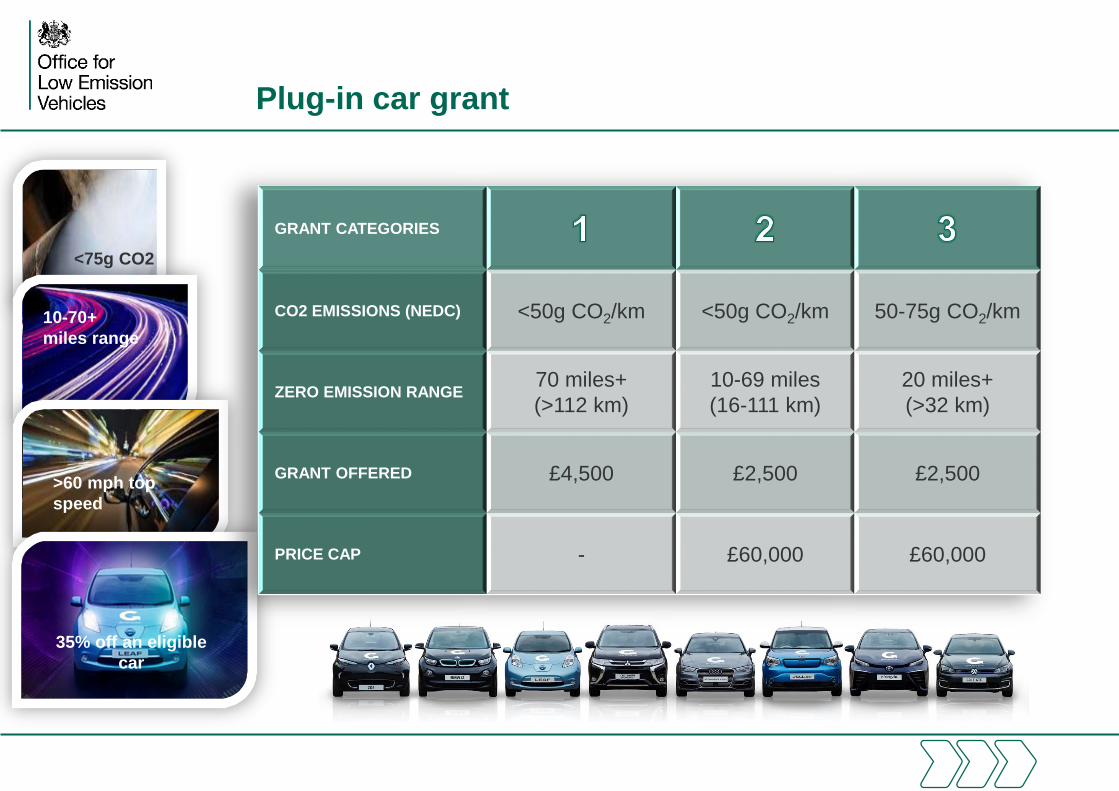
Plug-in car grant
12 D
ecem
ber
2016
12 D
ecem
ber
2016
<75g CO2
10-70+
miles range
>60 mph top
speed
35% off an eligible
car
GRANT CATEGORIES
CO2 EMISSIONS (NEDC) <50g CO2/km <50g CO2/km 50-75g CO2/km
ZERO EMISSION RANGE70 miles+
(>112 km)
10-69 miles
(16-111 km)
20 miles+
(>32 km)
GRANT OFFERED £4,500 £2,500 £2,500
PRICE CAP - £60,000 £60,000
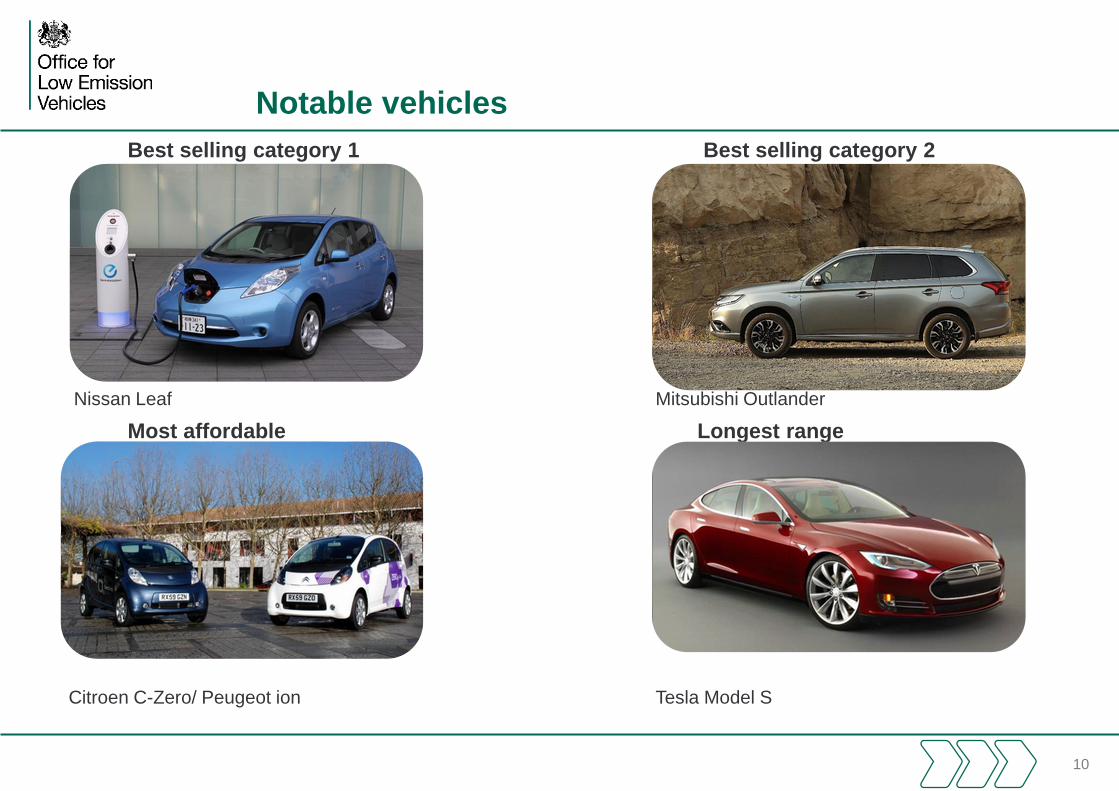
Notable vehicles
Best selling category 1 Best selling category 2
Nissan Leaf Mitsubishi Outlander
Most affordable Longest range
Citroen C-Zero/ Peugeot ion Tesla Model S
10
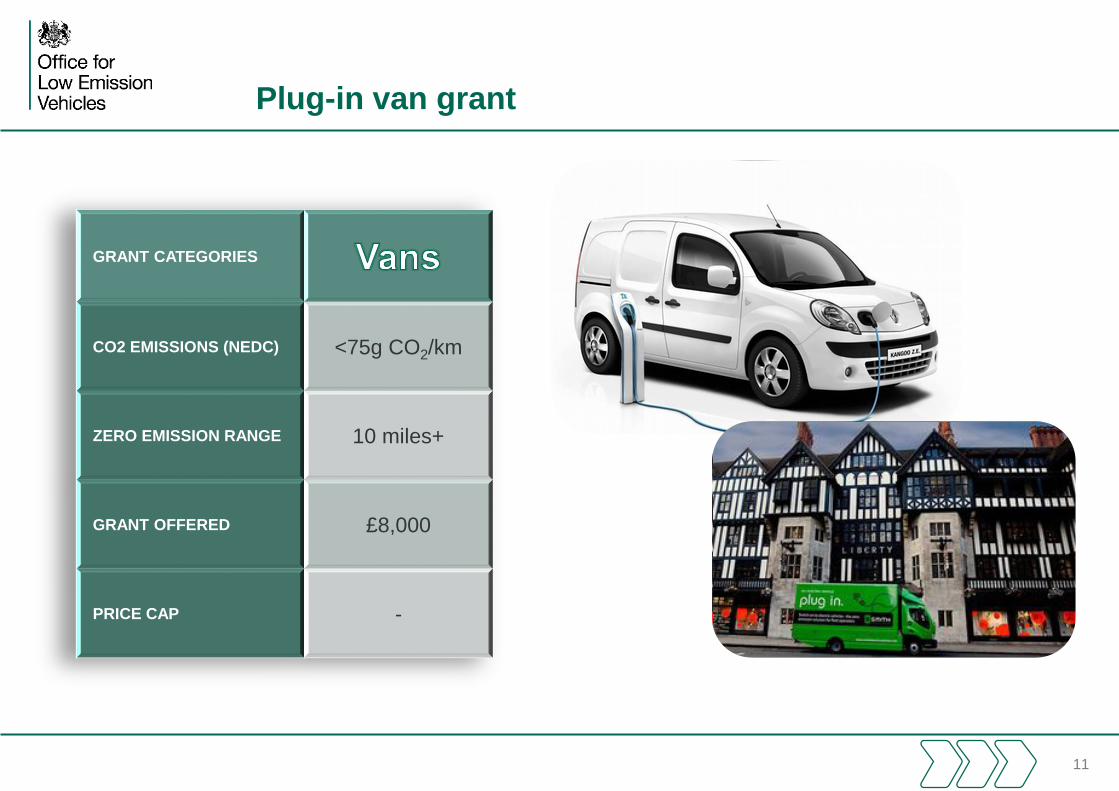
Plug-in van grant
11
GRANT CATEGORIES
CO2 EMISSIONS (NEDC) <75g CO2/km
ZERO EMISSION RANGE 10 miles+
GRANT OFFERED £8,000
PRICE CAP -

Plug-in motorcycle grant
12
GRANT CATEGORIES
CO2 EMISSIONS (NEDC) 0g CO2/km
ZERO EMISSION RANGE 30/50km
GRANT OFFERED £1,500
PRICE CAP -

Workplace charging
13
• Workplace charging
scheme
• 100% first year allowances
to companies investing in
charge points to end of
March 2019

Other infrastructure schemes
On street residential - £2.5m funding committed, details to be confirmed
Electric vehicle homecharge scheme - £500 per vehicle, up to charge points per household
14

Tax
15

Vehicle excise duty
16
VED rates to March 2017 VED rates from 1 April 2017
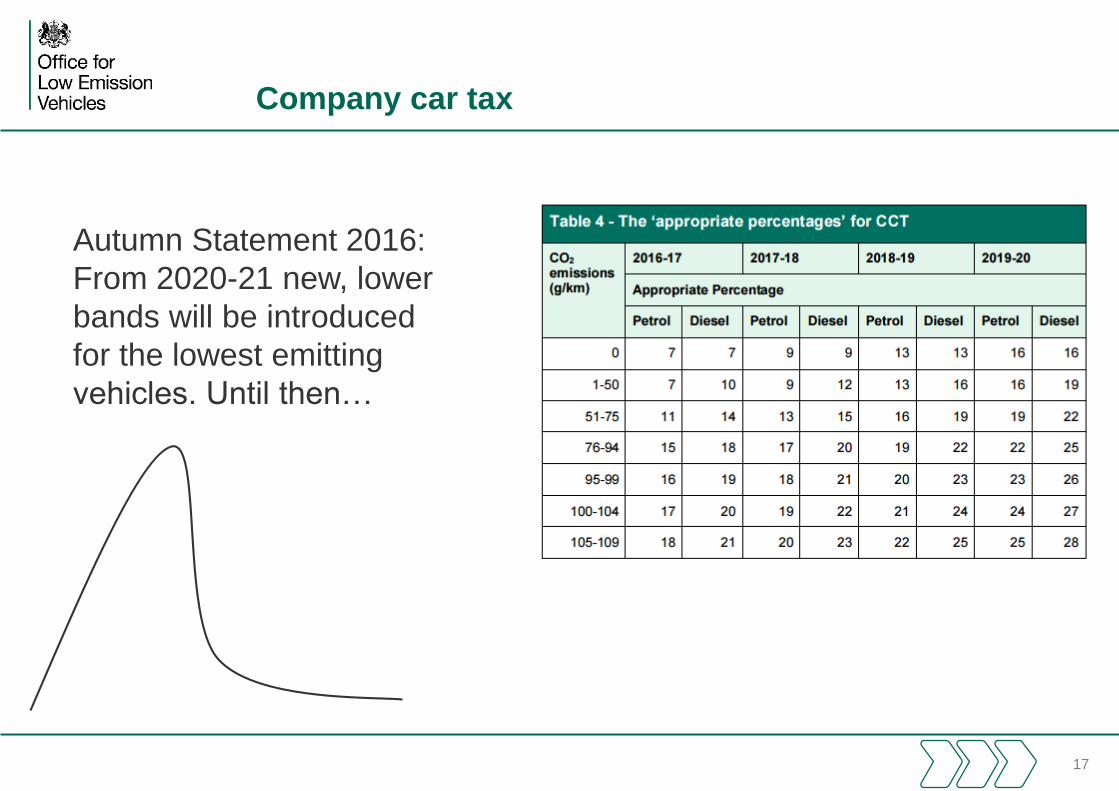
Company car tax
17
Autumn Statement 2016:
From 2020-21 new, lower
bands will be introduced
for the lowest emitting
vehicles. Until then…

Challenges: price and range …

OLEV also does…
19

Real-world performance of diesel vehiclesand lessons for fleets
Jane Thomas
7 December 2016
2
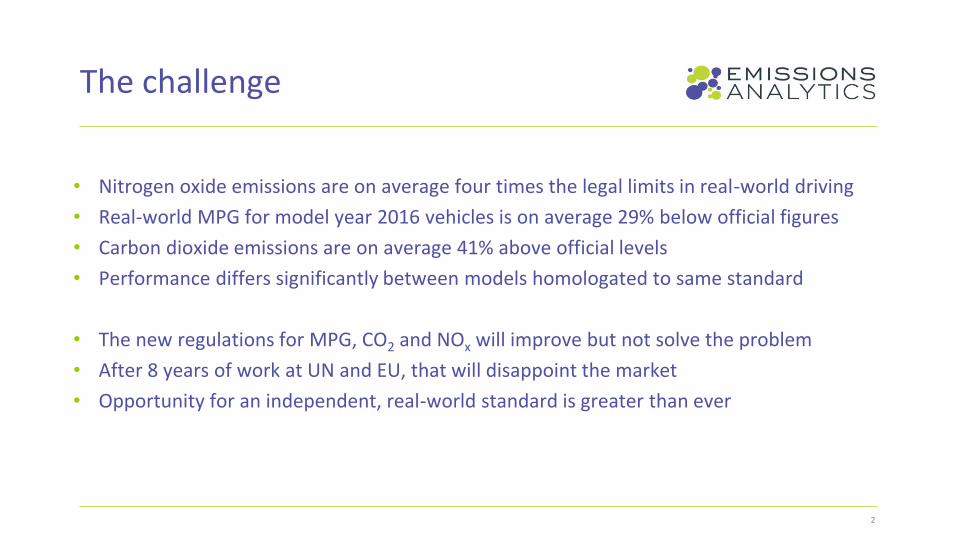
• Nitrogen oxide emissions are on average four times the legal limits in real-world driving
• Real-world MPG for model year 2016 vehicles is on average 29% below official figures
• Carbon dioxide emissions are on average 41% above official levels
• Performance differs significantly between models homologated to same standard
• The new regulations for MPG, CO2 and NOx will improve but not solve the problem
• After 8 years of work at UN and EU, that will disappoint the market
• Opportunity for an independent, real-world standard is greater than ever
The challenge
EMISSIONS ANALYTICS’ PROGRAMME
3
4
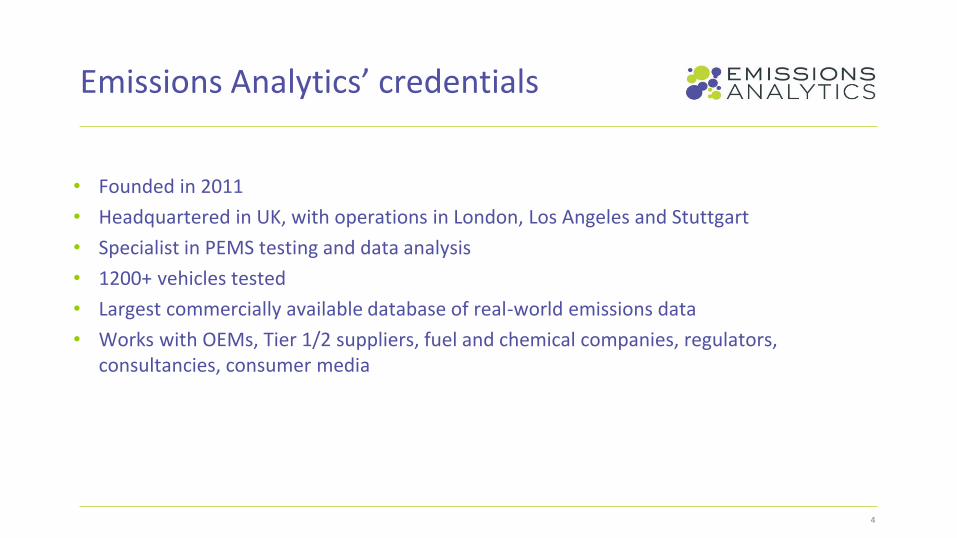
• Founded in 2011
• Headquartered in UK, with operations in London, Los Angeles and Stuttgart
• Specialist in PEMS testing and data analysis
• 1200+ vehicles tested
• Largest commercially available database of real-world emissions data
• Works with OEMs, Tier 1/2 suppliers, fuel and chemical companies, regulators, consultancies, consumer media
Emissions Analytics’ credentials

5
Equipment
• SEMTECH-DS and -LDV
• Portable Emissions Measurement System connects to tailpipe
• Captures emissions for CO2, CO, NO, NO2, total hydrocarbons
• At 1 Hertz
• Air temperature, pressure, humidity
• GPS for speed and altitude
• Engine data via CANBUS
• Fuel economy derived via carbon balance
• Weight addition 100kg

6
• Reproducibility must be weighed against authenticity
• Aim to drive same cycle identically each time
• Control what you can – driver, vehicle conditioning, driving style
• Careful QA of data
• Normalize out as much of remaining variability as possible
Approximate to laboratory
Use better economics of testing to test more cars
Trading slight deterioration in precision for greater sample size
Greater overall confidence
Emissions Analytics concept

7

VEHICLE PERFORMANCE TRENDS
8

9
• Rolling 12-month average of exceedance factor in blue
• Step-change technology launched Q2 to Q3 2014
• No further reduction in Conformity Factor since then
• Average CF dipped to 2.7 in 2014, but risen to 3.5 since then
NOx Conformity Factor
0.00
5.00
10.00
15.00
20.00
25.00
02/1
1/20
11
02/0
1/20
12
02/0
3/20
12
02/0
5/20
12
02/0
7/20
12
02/0
9/20
12
02/1
1/20
12
02/0
1/20
13
02/0
3/20
13
02/0
5/20
13
02/0
7/20
13
02/0
9/20
13
02/1
1/20
13
02/0
1/20
14
02/0
3/20
14
02/0
5/20
14
02/0
7/20
14
02/0
9/20
14
02/1
1/20
14
02/0
1/20
15
02/0
3/20
15
02/0
5/20
15
02/0
7/20
15
02/0
9/20
15
02/1
1/20
15
02/0
1/20
16
Co
nfo
rmit
y Fa
cto
r
Test date
Euro 5/6 NOx diesel Conformity Factor over time

EU REGULATORY CHANGES
10

11
Changes to EU regulations
• Type approval framework changes
• Initiated since dieselgate to tighten legal framework
• WLTC for fuel economy and CO2 regulation
• Multi-stage transition from NEDC
• Real Driving Emissions for NOx regulation, in four “packages”
• #1 – establishing PEMS as a viable technology, preferred to random cycles
• #2 – regulated limits for NOx, and Conformity Factors – published
• #3 – cold start and PEMS-PN (particulate number) regulation – almost complete
• #4 – in-service surveillance – discussions to start late 2016/early 2017
• Monitoring phase currently underway – sharing data but not in force

12
Test cycles
New European Driving Cycle (NEDC)
World Light Duty Transient Cycle (WLTC)
Real Driving Emissions (RDE)
Emissions Analytics
Measurements MPG, CO2, CO, NOx MPG, CO2, CO, NOx NOx
MPG, CO2, CO, NOx, NO, NO2
Cycle Defined speed trace Defined speed traceUndefined with
aggregate and dynamic constraints
Defined route
Test location Laboratory Laboratory On road with PEMS On road with PEMS
Conduct By OEM By OEM By OEM Independent
Normalisation None NoneCO2 windows or power
binningBased on dynamic
characteristics
Average speed (mph) 21 29 Varies 28
Average acceleration (mph/s) 1.1 1.0 Varies 1.5
Average gradient (m/s) 0.0 0.0 Varies 0.8

13
Issues with Real Driving Emissions
• Conformity Factors
• 1.5 does not come fully into force until January 2021
• Initial 2.1 factor set to be achieved by all OEMs with just software changes
• No further reductions guaranteed
• Normalization tools
• Competitive tools: EMROAD and CLEAR, using different principles
• Transfer function: to increase number of valid points through modelled transformation
• PEMS-PN
• Unproven test equipment, industry push-back
• Structural
• Asymmetry of expertise between European Commission and OEMs
• Lack of appetite to create powerful, central EU regulator

14
• Conformity factor initially 2.1 – 168 mg/km
• Further increased by exclusions due to boundary conditions
• PEMS test-to-test variability of 30%, so OEMs will need to target ~129 mg/km to avoid getting caught by in-service surveillance
• 1 in 5 vehicles already meet this
Will Real Driving Emissions help?
0.00
2.00
4.00
6.00
8.00
10.00
12.00
14.00
14/09/2011 01/04/2012 18/10/2012 06/05/2013 22/11/2013 10/06/2014 27/12/2014 15/07/2015 31/01/2016
Con
form
ity
Fact
or
Test date
Euro 5 Euro 6

INDEPENDENT RATINGS FOR FLEETS
15

16
• Vehicle rating scheme based on their real-world NOx emissions, launched in April 2016
• Non-statutory complement to new Real Driving Emissions regulations
• But will also
• Discriminate between high and low emitters, rather than just pass/fail
• Be updated for each model year to keep up with new calibrations
• Ratings are published and into the public domain for free
• Manufacturers and consumer media can adopt as independent, voluntary standard
• Similar to New Car Assessment Programme (Euro NCAP, Global NCAP)
Robust, independent standard needed to measure and incentivize actions to bring about air quality improvements
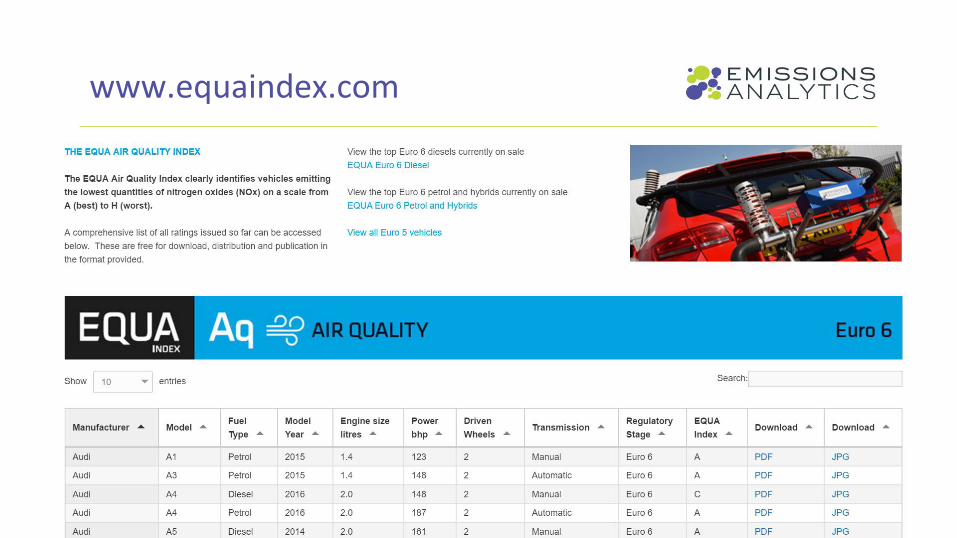
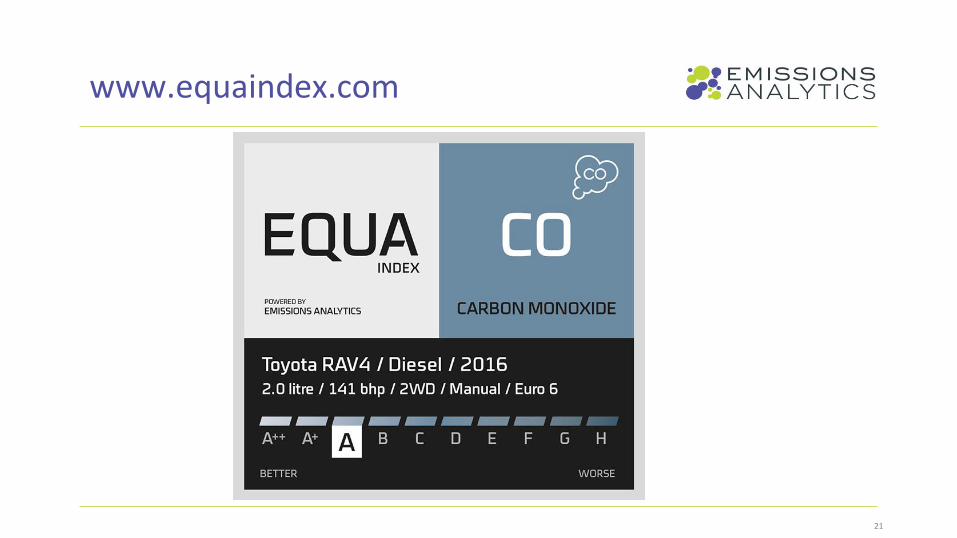
EQUA Air Quality Index

17
www.equaindex.com
18
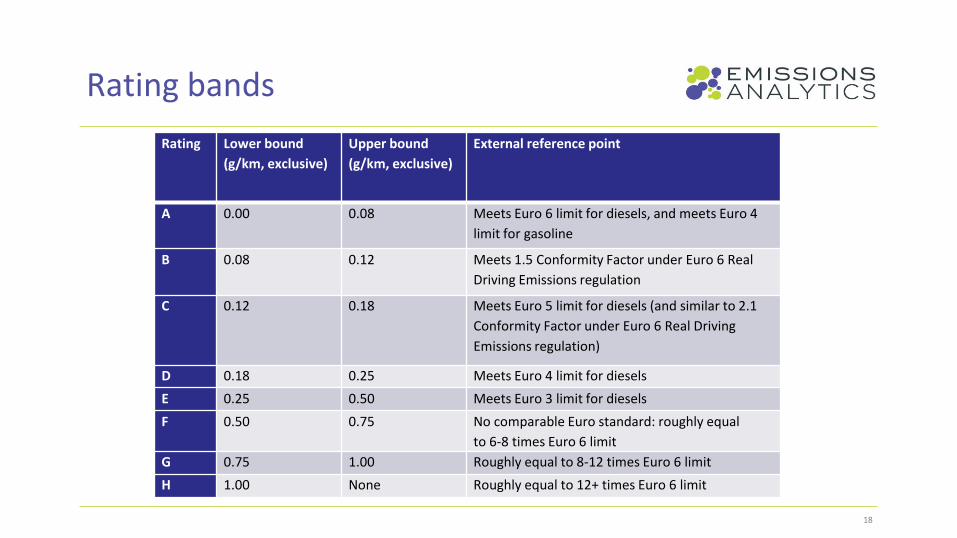
Rating bands
Rating Lower bound
(g/km, exclusive)
Upper bound
(g/km, exclusive)
External reference point
A 0.00 0.08 Meets Euro 6 limit for diesels, and meets Euro 4
limit for gasoline
B 0.08 0.12 Meets 1.5 Conformity Factor under Euro 6 Real
Driving Emissions regulation
C 0.12 0.18 Meets Euro 5 limit for diesels (and similar to 2.1
Conformity Factor under Euro 6 Real Driving
Emissions regulation)
D 0.18 0.25 Meets Euro 4 limit for diesels
E 0.25 0.50 Meets Euro 3 limit for diesels
F 0.50 0.75 No comparable Euro standard: roughly equal
to 6-8 times Euro 6 limit
G 0.75 1.00 Roughly equal to 8-12 times Euro 6 limit
H 1.00 None Roughly equal to 12+ times Euro 6 limit

19
Diesels with A ratings
20
www.equaindex.com
21
www.equaindex.com

22
www.equaindex.com
• MPG values for almost all vehicles on sale in last five years
• Over 66,000 model variants
• Around 5,000 test values
• Remainder extrapolated using new proprietary model of real-world MPG, based on technical characteristics of vehicles
Comprehensive alternative to official system

23
EQUA CO2
• “A1” to “H5”
• A to H for absolute emissions
• 1 to 5 for proximity to official –“honesty”
• 39% average CO2 excess – 189 g/km
• 16% higher emissions from petrol compared to diesel
• 1.5 litre engines better than most highly down-sized
• 2.0-3.0 litre engines most honest
IMPLICATIONS FOR FLEETS
24

25
EU fuel economy trends
30.0
35.0
40.0
45.0
50.0
55.0
60.0
65.0
2011 2012 2013 2014 2015
Fu
el
eco
no
my
(M
PG
)
Model Year of vehicle tested
Diesel - EQUA Mpg Diesel - official Petrol - EQUA Mpg Petrol - official
• Real-world average diesel MPG declining since 2012
• Official MPG kept rising until 2014, but even that now declining
• Gasoline still showing gently improving trend
• No mix correction

26
EU fuel economy gap
• Diesel gap sharply increasing
• Weaker trend for gasoline
• (Low sample size in 2011)
-32.0
-30.0
-28.0
-26.0
-24.0
-22.0
-20.0
2011 2012 2013 2014 2015 2016
EQU
A M
pg
vari
ance
to
off
icia
l MP
G
Model Year of vehicle tested
Diesel Petrol

27
Perils of downsizing
-45.0
-40.0
-35.0
-30.0
-25.0
-20.0
-15.0
-10.0
-5.0
0.0
0.5 1 1.5 2 2.5 3 3.5 4 4.5 5
EQ
UA
Mp
g v
ari
an
ce t
o o
ffic
ial M
PG
Engine size class (litres)
Diesel Petrol
• The smaller the engine, the bigger the gap between real-world and official MPG
• Sub-1.5 litre gasoline engines have particularly large deficits
• NEDC rewards downsizing, but 1.5-2.0 litre optimal for mixed driving in reality

28
Opportunities
• Provide EQUA Index data on fleet websites and in documentation to enable consumers to make better informed decisions
• Construct vehicle lists in knowledge of real-world emissions
• Better match consumers to their usage, and increase satisfaction
• Incorporate EQUA Mpg into total cost of ownership models
• Corporate Social Responsibility reporting

29
Issues?
• WLTC will be the real-world solution for MPG and CO2 – it won’t
• Manufacturers won’t like it – they are using EQUA already
• Is PEMS valid for measuring MPG – PSA are doing it
• Will it confuse consumers? It is the solution to the confusing transition from NEDC to WLTC
• Hiding behind official figures has been proven to be dangerous – NEDC
Opportunity in a consistent, independent, real-world performance currency

A Strategic Approach
to EV Infrastructure at
Heathrow Clean Vehicles Partnership
7 Dec 2016
Andrew Chen- Emissions Strategy Manager,
Heathrow

Heathrow first published an Air Quality Strategy & Action Plan in 2000
and in 2014 published an additional target to reduce ground-based
NOx emissions through Responsible Heathrow

LEVEL 1 LEVEL 2 LEVEL 3 LEVEL 4 LEVEL 5
AVOIDING RISKBEING SEEN
TO BE GOOD
‘DOING’
SUSTAINABILITY
LIVING
SUSTAINABILITY
LEADING
SUSTAINABILITY
Avoid Risk
PR for Reputation
Take Action
Integrate into Core Business
Leverage Value Through Business ModelsA
CT
IVIT
Y
From Responsible Heathrow
to Level 5 leadership
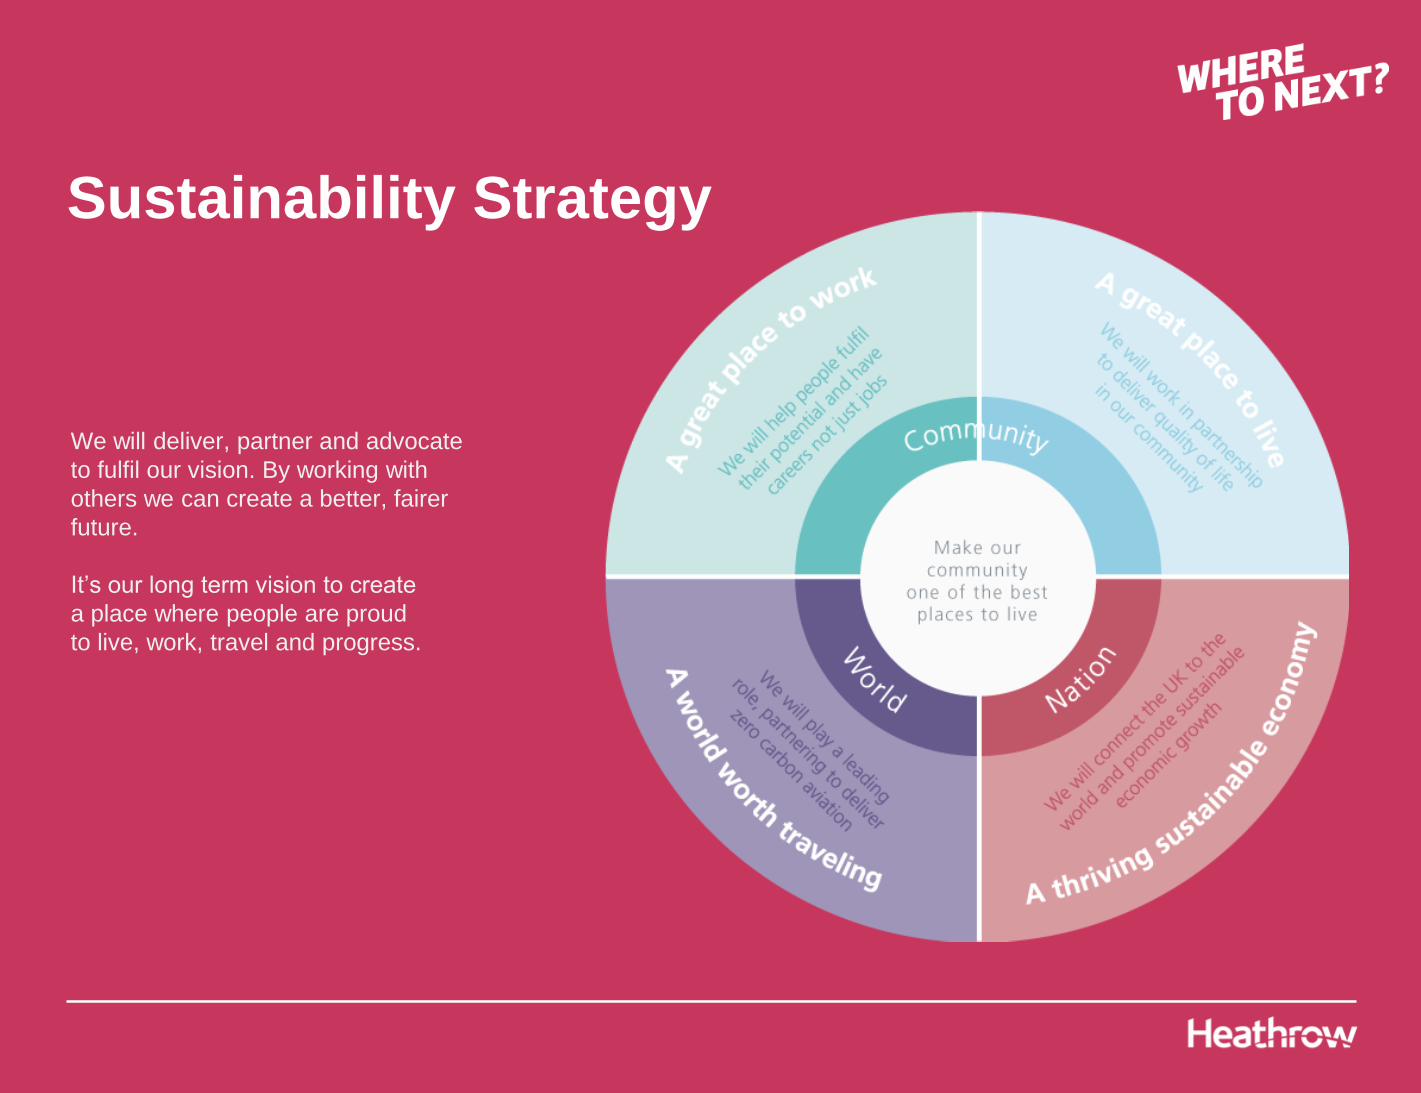
Sustainability Strategy
We will deliver, partner and advocate
to fulfil our vision. By working with
others we can create a better, fairer
future.
It’s our long term vision to create
a place where people are proud
to live, work, travel and progress.

Aircraft activity
1) Reduce emissions from aircraft at the gate
2) Phase out oldest and dirtiest aircraft
3) Improve taxiing efficiency
Airport traffic
4) Provide more and better EV charging points
5) Incentivise low-emission vehicles
6) Work with partners to set up emission zones and
standards
Vehicles airside
7) Reduce emissions from our own fleet
8) Pool vehicles to reduce numbers and emissions
9) Lead the move to electric vehicles airside
Energy
10) Modernise our heating supply
In 2015 we also published a “Blueprint for reducing
emissions” to set out a clear narrative and commit to ten
tangible actions to reduce emissions by the end of 2015

In 2016 we published our second “Blueprint
for reducing emissions” with ten tangible
actions to reduce emissions in 2016
Aircraft activity• Bring in the newest and cleanest aircraft
• Continue to drive down emissions from aircraft at the gate
• Improve taxiing efficiency
Airport traffic • Charge forward with electric cars and buses
• Heathrow Cycles
• Drive sustainable freight operations
Airside vehicles• Plug in more electric airside vehicles
• Provide a pool of low emission vehicles
• Efficient driver training and education

Vehicle emissions
programmeHeathrow is committed to improving local air quality by working collaboratively with the airport community
to reduce emissions. By increasing vehicle efficiency, reducing vehicle journeys and improving charging
infrastructure; The Vehicle Emissions Programme will work with all stakeholders to support Heathrow’s
commitment to reduce ground-based NOx emissions.
Vehicles Leadership Group (VLG)Role: Provide leadership, steer, challenge and decisions to ensure alignment between strategy, programme outputs and operations
whilst meeting the emissions target
WS1: HAL, Supplier & 3rd party (Airside) Fleet Efficiency
Vehicles Working Group (VWG)Role: Share work stream plans, progress, risks & issues to ensure
collaboration, coordinated delivery and management of dependencies
WS2: Surface Access Fleet
Efficiency
WS4: Strategy and Engagement
WS3: Vehicle Charging
Infrastructure
Progress to date
• To date, 30 new charging points have been approved at
a cost of £610k, 8 are up and running
• 27 chargepoint installations are in the pipeline –
Estimated capex over £1m
• The number of charging sessions and energy
consumption (kwh) for operational vehicles doubled in
October, mainly due to the CLC chargers being installed
and used by Wilson James
• There were nearly 100 charging sessions in T2 short
stay. Once T3, T4 and T5 chargers are upgraded (PO
raised), we will be able to monitor their usage

Electric Vehicle Infrastructure at Heathrow Airport
Evidencing Demand
Heathrow Airport CVP Seminar
7th December 2016
Jacob Roberts, Technical Project Manager
Ian Featherstone, Fleet Knowledge Manager

Intro to Energy Saving Trust’s Transport Team

The Energy Saving Trust
Set up to support
Government
Independent and impartial
Long history supporting
organisations
Not for profit
Wide range of EV work
(OLEV, DfT, TfL, Commercial)
Unique expertise in EV
infrastructure mapping
Saving energy and reducing
emissions at our core
Wide network of partners
Experts from across industry
and public sector

Background

The Challenge: Air Quality
Poor air quality is thought to cause 9,500 premature
mortalities in London every year
The Ultra-Low Emission Zone (ULEZ) is central to Transport
for London’s plans to decrease NOx concentrations in
Greater London – especially in Central London
Outside of Central London,
Heathrow Airport is the most
visible area of poor air quality

Ultra-Low Emission Vehicles (ULEVs)
ULEVs emit no tailpipe emissions and therefore do not
contribute to local air pollution
This makes ULEVs a significant part of how we can improve
urban air quality
They do not necessarily need to be electric or plug-in hybrid
vehicles, but these are the most readily available at present

Electric Vehicles at Heathrow Airport
17.6% of air pollution at Heathrow Airport is caused by
ground vehicles, airside and landside
Increasing the amount of ULEVs at Heathrow is central to
how HAL plan to improve air quality
To make plug-in vehicles feasible… you need somewhere to
plug them in!
Evidencing Demand for Charging Infrastructure

Our Project
Heathrow have commissioned EST to produce a report to
answer some key questions.
How many electric vehicles could realistically operate at Heathrow?
Where, how much and what type of charging infrastructure would be
required to meet demand?
What will the air quality benefits of the electric vehicle adoption be?
What can Heathrow do to encourage electric vehicle use, besides provide
infrastructure?
How many vehicles?
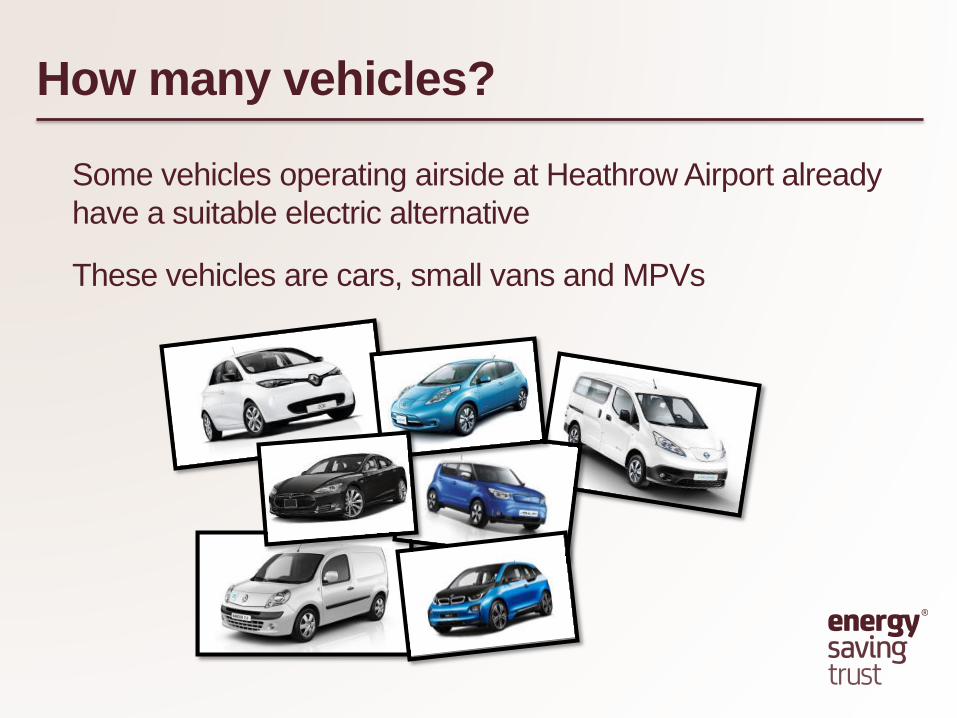
Some vehicles operating airside at Heathrow Airport already
have a suitable electric alternative
These vehicles are cars, small vans and MPVs

How many vehicles?
As the electric vehicle market develops, electric alternatives
to many other vehicles types will become available
Large electric vans are beginning to come onto the market
and will likely be widely available in 3-5 years
Manufacturers are currently developing and trialling electric
HGVs
How many vehicles?
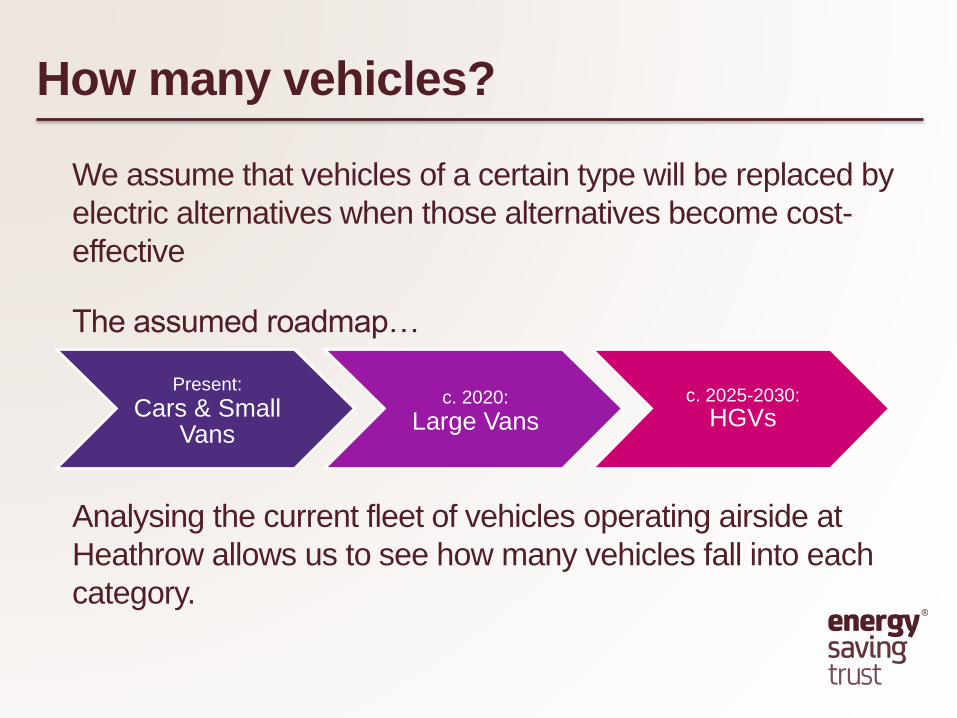
We assume that vehicles of a certain type will be replaced by
electric alternatives when those alternatives become cost-
effective
The assumed roadmap…
Analysing the current fleet of vehicles operating airside at
Heathrow allows us to see how many vehicles fall into each
category.
Present:
Cars & Small Vans
c. 2020:
Large Vansc. 2025-2030:
HGVs

Charging infrastructure?
Through telematics data, we determine three key factors
required to recommend location, type and quantity of electric
vehicle charging points
Combining this with what we know about the existing
vehicles, we can calculate how much electricity will be
required and how quickly > the chargepoint type
Typical daily mileage
Where vehicles stop
How long they stop for

For example…
Take a Ford Fiesta…
If this vehicle were electric, we at least know where the
chargepoint needs to go
45 miles per
day
Stops at the
canteen for an
hour at lunch
time

For example…
Take a suitable electric alternative…
You know where the vehicle stops, how long it stops for and
how much electricity needs to be delivered in that time
45 miles per
day
Stops at the
canteen for an
hour at lunch
time
Roughly
0.3kWh per
mile

How many chargepoints?
Using telematics to understand how many vehicles are
stopped at that location at the same time allows you to infer
how many chargepoints will be required.
The process of analysing the vehicles stopping at a location
and determining the number of vehicles stopped at the same
time is repeated across all locations where vehicles
commonly stop.
Summary

Summary: What evidence is needed?
Vehicle registration
number
Make Model
Telematics
Daily mileage
Where the
vehicle stops
How long the vehicle stops
for

Thank you for listening
Any questions?
Ian FeatherstoneFleet Knowledge Manager
T: 020 7227 0312
M: 07769 742930
Jacob RobertsTechnical Project Manager
T: 020 7654 2613
M: 07447 947353

ELECTRIC VEHICLES
John Edmunds
Business manager
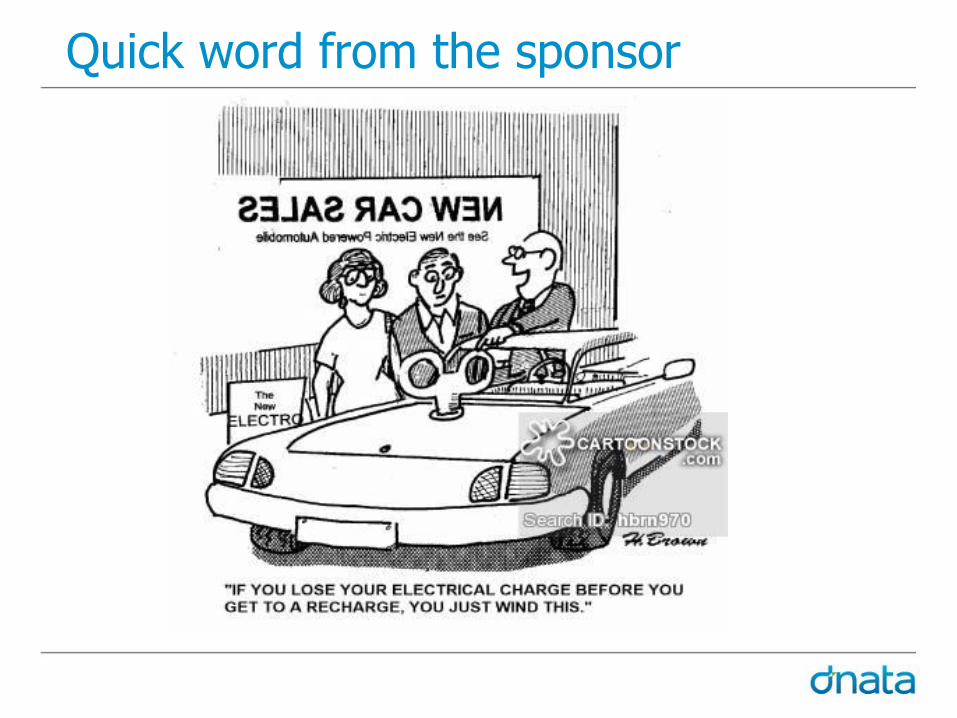
Quick word from the sponsor

Introduction
• Dnata’s interest in EV
• Cost potential savings
• What have we used and why
• The road a head

Dnata’s interest in EV
• Government commitment – global warming
• CVP working group – (this forum)
• Other Airport/handler Experience
• Airport authority
• Reduction in emissions
• Potential savings - benefits

Costs - Benefits
• Purchase EV More expensive than our normal purchase
EV more expensive to lease
• MaintenanceNo oils, filters etc
3 x cheaper to run electric car
No issues with diesel particulate filters or catalysts
Fewer running parts
Support at dealerships needs to be better

Cost - Benefits
• Fuel• EV far cheaper to run particularly in an airport environment
• 6th of the cost
• Infrastructure is better but still needs improvement

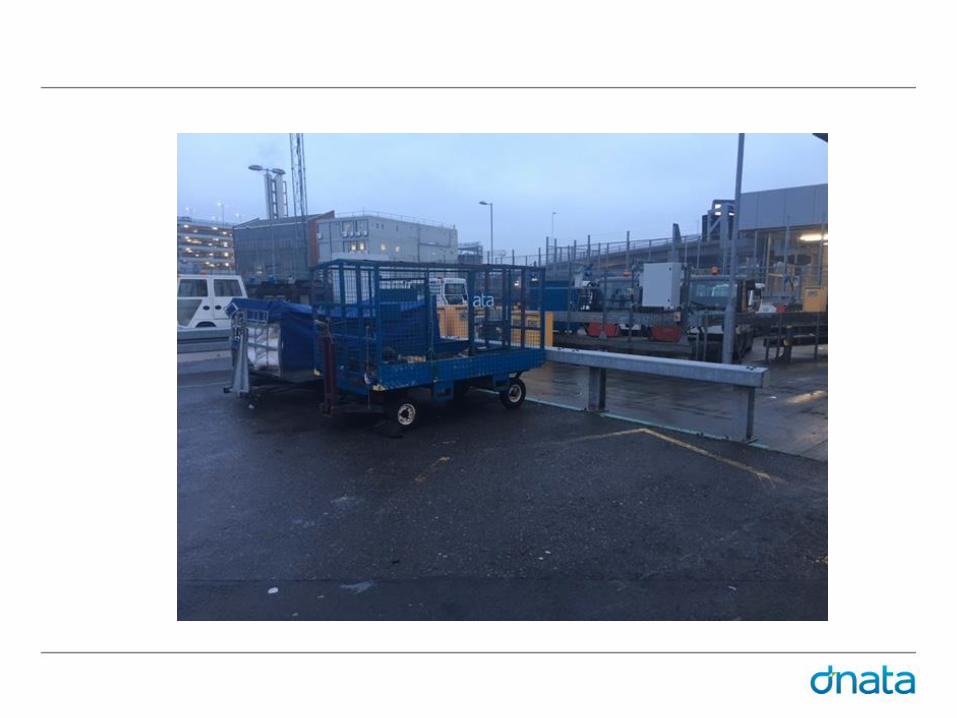
What we have used -
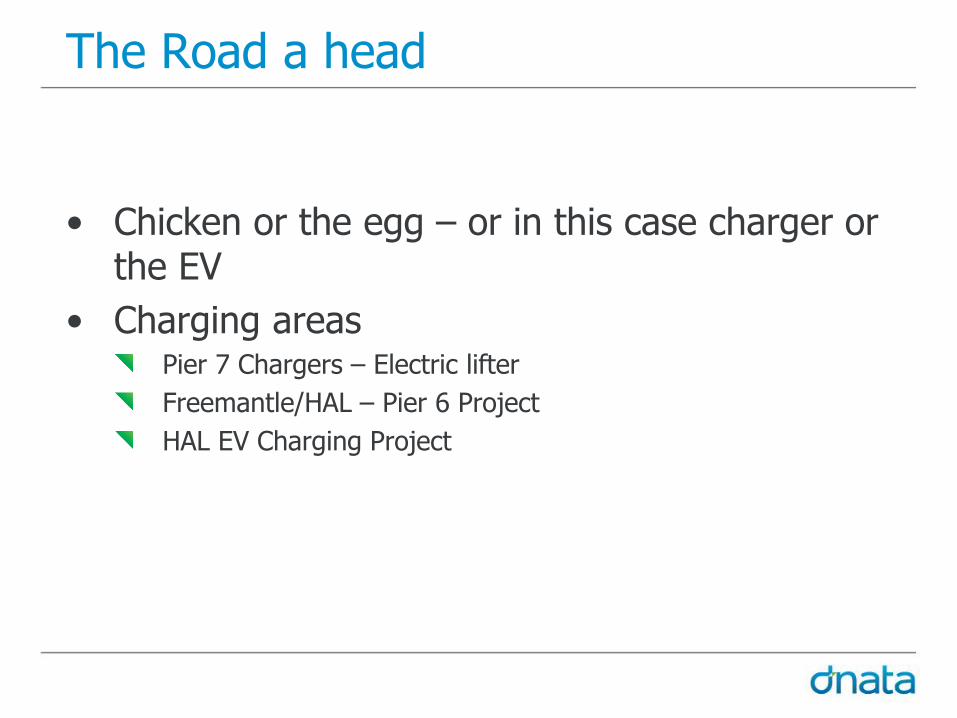
The Road a head
• Chicken or the egg – or in this case charger or the EV
• Charging areasPier 7 Chargers – Electric lifter
Freemantle/HAL – Pier 6 Project
HAL EV Charging Project

Questions