Embed Size (px)
Citation preview
CWIQ
Core Welfare Indicators Questionnaire Survey
A Pilot Study in
St. Lucia
Main Report
November 2004
MAIN REPORT CONTENTS
MAIN REPORT CONTENTS ..................................................................................................................................i PREFACE 1 ..............................................................................................................................................................i PREFACE 2 ............................................................................................................................................................ii EXECUTIVE SUMMARY .....................................................................................................................................iii
Core Welfare Indicators Definitions...................................................................................................................vii 1. SURVEY DESIGN ..............................................................................................................................................1 2. SURVEY RESULTS............................................................................................................................................7
2.1 Welfare Classification ....................................................................................................................................7 2.2 Poverty Predictors ..........................................................................................................................................8 2.3 Household Characteristics ..............................................................................................................................9 2.4 Assets and Amenities ...................................................................................................................................10 2.5 Amenities......................................................................................................................................................12 2.6 Education......................................................................................................................................................13 2.7 Health and Child Care ..................................................................................................................................16 2.8 Employment .................................................................................................................................................18
3. CONCLUSIONS ................................................................................................................................................21 Appendix 1 Welfare Scoring System ....................................................................................................................22
TABLES AND FIGURES Table 1 Core Welfare Indicators by Urban/Rural and Poor .....................................................................................v Table 2 Core Welfare Indicators by Region ............................................................................................................vi Table 3 CWIQ Sample Enumeration Districts by Urban - Rural Classification.......................................................2 Table 4 Survey Results by Location and District and Level of Replacements .........................................................5 Figure 1 CWIQ Interviews Completed Rate ............................................................................................................5 Figure 2 No. of Interviews by Time of Day .............................................................................................................5 Figure 3 Duration of CWIQ Interviews...................................................................................................................6 Figure 4 No of Households with given Welfare Scores ...........................................................................................7 Figure 5 Mean Values of the Indicators used for Welfare Classification.................................................................7 Figure 6 Responses to 10 Piloted Poverty Predictors ...............................................................................................8 Figure 7 Household Head Characteristics by Gender, Location and Marital Status.................................................9 Figure 9 Distribution of Households by the Number of Persons Per Room...........................................................12 Figure 10 Distribution of Households by Source of ...............................................................................................13 Drinking Water.......................................................................................................................................................13 Figure 11 Distribution of Households by Type of Toilet Facilities .......................................................................13 Figure 12 CWIQ Education Indicators (Primary Level).........................................................................................14 Figure 13 CWIQ Education Indicators (Secondary Level).....................................................................................14 Figure 14. A comparison between need for and access to Health Facility .............................................................16 Figure 15 Percentage of Persons who were Dissatisfied with the services received ..............................................17 Figure 16. Youth and Total Unemployment Rates by Urban/Rural Poverty Group and Gender ...........................19 Figure 17. Youth and Total Unemployment Rates by District ...............................................................................20
VOLUME II I. Statistical Tables II. Survey Questionnaire
i
PREFACE 1
The St Lucia pilot started in the first week of October, 2004 and the report was ready seven weeks after. The successful release of this report is a further proof of the capability of the CWIQ to provide data for monitoring poverty at very short notice. The CWIQ is an instrument for providing regular monitoring of welfare and social trends for different population groups, especially the poor. The survey gives a quicker and less resource intensive method for monitoring poverty than the Survey of Living Conditions, containing extensive expenditure and income modules which was conducted by the department in 1995. The indicators available through the CWIQ survey are of two types: i. Indicators of living standards for the households and household members - these indicators include land assets, home ownership, type of home construction, fuel for cooking, ownership of selected household goods, literacy level, employment, health and nutrition. ii. Indicators of access, utilization and satisfaction - these include access to clean water, primary and secondary school services, utilization of facilities by way of enrolment rates by gender, satisfaction with school and medical services. While the development of CWIQ has been in the hands of the World Bank, principally in Africa, this is the first application of the survey in the Caribbean region. Funding has been provided by the European Commission and UNDP. Mr. Elbert Ellis of UNDP has been instrumental in administering the pilot exercise. Two UNDP consultants, Dr. Nick Chapman and Mr. James Otto, worked with the staff of the Department of Statistics to implement the pilot survey. I wish to commend their efforts and contributions in the realisation of this project. I also wish to commend the staff of the Department of Statistics, our enumerators and supervisors in the field who made a very special effort to ensure that the schedules and deadlines we set for enumeration and report preparation were kept. This report will be useful to the St Lucian Government, the key local, regional and international agencies concerned with poverty alleviation and monitoring, in particular, the Ministries of Social Transformation, Education, Health and the Poverty Reduction Fund. Director Department of Statistics Castries, St. Lucia December 6th, 2004
i
PREFACE 2
The Core Welfare Indicator Questionnaire survey has been piloted in the Caribbean Region for the first time, with the intention of testing its suitability as a light, low cost instrument for poverty monitoring. The instrument was developed for and extensively used in African countries, and has proved a valuable tool for complementing other periodic surveys such as surveys of living conditions. The survey is designed to collect the minimum amount of information needed to identify and classify target groups and to provide basic welfare indicators for monitoring poverty alleviation programmes. The generic CWIQ questionnaire was adapted during the pilot exercise to the requirements of St. Lucia. It is purposefully concise and was designed to collect in addition to household characteristics, information which measured access, utilization and satisfaction with social services; Water, Sanitation, and Environment; Education; Unemployment / Underemployment; Medical Services; Reproductive Health and Child Delivery. The CWIQ survey contains details on a representative, randomly drawn sample of 1306 St. Lucian households. It therefore provides estimates for welfare indicators at national, urban / rural and District levels for planning and policy formulation. 56% of the sampled households surveyed in St. Lucia lived in urban areas, and 54% in the north (Castries and Gros Islet). The mean household size was 3.4 with urban and rural household sizes of 3.3 and 3.5 respectively. The overall dependency ratio was the same in rural and urban areas at 0.6, although for the poorest quintile this ratio was substantially higher at 1. Just over one third of the households, or 37%, felt that their economic situation was worse than a year ago while only 17% of the population felt it was getting better. I thank the group of donors and host institutions, including the European Commission and the St. Lucian Ministry of Finance and Economic Affairs for supporting the piloting of this new survey method, which used the technique of optical character reading that permitted the fast processing of the data and the timely release of the result. Finally I commend the Department of Statistics (DOS) for their effective execution of the CWIQ survey and trust that regional partners and states will benefit from this experience.
UNDP Resident Representative Barbados
December 2004
ii
iii
EXECUTIVE SUMMARY
The Core Welfare Indicator Questionnaire (CWIQ) was designed as an instrument for monitoring poverty and household welfare. The survey covered a representative sample of households for St. Lucia which was also large enough to provide reliable welfare indicators for planning and policy formulation purposes in most of the Districts. For comparison purposes, results from the 2001 Census where available are given in italics. Household Characteristics Just over half of the population live in the urban areas and two-thirds live in the north (Castries Urban, Castries Rural and Gros Islet). 57% of household heads were male. The mean household size was 3.4 with urban and rural household sizes of 3.3 and 3.5 respectively. The overall dependency ratio for the state was 0.6, indicating that less than one person aged under 15 or over 64 yrs is dependent on one person aged 15-64. The dependency ratio was the same in rural and urban areas, but those falling in the poorest quintile had a higher ratio of 1.0. Only 17% of households said that their present economic situation was better than a year ago while over one-third said that their situation had worsened. 6% reported being a victim of crime in the past year, an increase since 2001, when a 4% level of crime was reported in the Census. Just over a quarter of household heads were legally married, while a fifth were in common law unions and a tenth in visiting partnerships. The proportion of children living without one or both of their parents is high at 62%. Water, Sanitation & Environment Access was defined as households with a water source less than 15 minutes away. Almost all households had access to a water supply with slightly better access in urban than rural areas (99% and 97% respectively), and 92% had safe water, defined as households using pipe-borne water (2001: 89%). 95% percent of urban households had safe water compared with 88% of rural households. Two-thirds of the households had a safe means of sanitation, defined as households with flush to sewage system or septic tank (2001: 53%). 95% use improved
waste disposal methods, defined as government-collected or in skip (2001: 88%). 92% of the households used non-wood fuel for cooking (2001: 88%) while 90% used electricity for lighting (2001: 87%). Household Assets The survey shows that three-quarters of households interviewed owned their house, and a quarter owned a vehicle (2001: 28%). The majority (88%) live in a separate private house and two-thirds own the land on which the house is built, either with title or through the family. Only 44% of the urban poor own their house plot however. 92% of households reported owning a stove, 85% a television (2001: 79%), 61% a mobile phone (a major increase from 2001 when the level was 14%) and 50% a washing machine. Few households own a computer (18%) (2001: 13%) or internet connection (10%) (2001: 8%). Education The adult literacy rate stood at 89%, higher for females (90%) than males (87%). The urban adult population were slightly more literate compared to those in rural areas (92% versus 84%). Youth literacy (15-24 yrs) was almost universal and in line with MDG expectations. Access was defined as households with a primary or secondary school less than 15 minutes away. Two- thirds of households had good access to primary education while just over a third had good access to secondary education. Accessibility was significantly higher in urban than rural areas. Poorest access was reported in Laborie, Choiseul and Soufriere Districts. Enrolment is defined as net enrolment of children currently in primary schools aged 6-11 and in secondary schools aged 12-17. The primary school enrolment rate was 93% while secondary school enrolment was 79%. Females were more likely to be in school. Primary school enrolment rates were 91% males and 94% females. Secondary school enrolment rates were 72% males and 86% females, a significant gender gap. Enrolment rates were similar for urban and rural areas, but secondary school enrolment was lower for the poorest households especially in rural areas (67%).
St. Lucia Core Welfare Indicators Questionnaire (CWIQ) Survey 2004 iv
Drop out rates were low except for boys aged 12-16, where an 8% rate was recorded. These findings show that St Lucia is close to achieving the MDG indicator targets for primary but has more to do with regard to secondary. Satisfaction was defined as children currently in primary and secondary schools who reported no problems with their school. Satisfaction levels were high for both levels at around 90%. Medical Services Access was defined for persons with a health facility less than 15 minutes away. Over half of the population had good access to a health facility. There was a notable difference between urban and rural households (60% good access versus 50%). Households in Choiseul and Laborie Districts reported the poorest access. Eleven percent of the population studied reported a sickness or injury in the 4-week period preceding the survey, which is taken as an indicator of need for medical services. Need was higher in rural compared to urban areas (12% and 9% respectively). Overall 15% of the population consulted a health practitioner in the 4 weeks preceding the survey, an indicator of use. Only one fifth of those who were sick were dissatisfied with the medical service received. Half of those who were dissatisfied gave slow service as the major reason (particularly for pharmacists), and 44% gave high cost (particularly for private medical services). Reproductive Health & Child Care St. Lucia’s record is general positive in terms of with MDG targets in the area of reproductive health & child delivery. Nearly all (96%) of women who had a live birth in the year preceding the survey had pre-natal care. Of all babies borne in the last five years, only 2% were not delivered at a hospital/maternity home and with professional care. Teenage pregnancy was low at just 3% of all live births in the past year; however, for the urban poor this proportion was higher at 9%, indicating a disproportionate number of young females coming to urban areas. Most under-five children (95%) participated in the three standard 6 week and 8 month development assessment programmes. Vaccination rates were high at over 90% for DPT1, 2 and 3, BCG and Polio 1, 2 and 3. 7.5% of children under 5 were reported as having had no vaccinations.
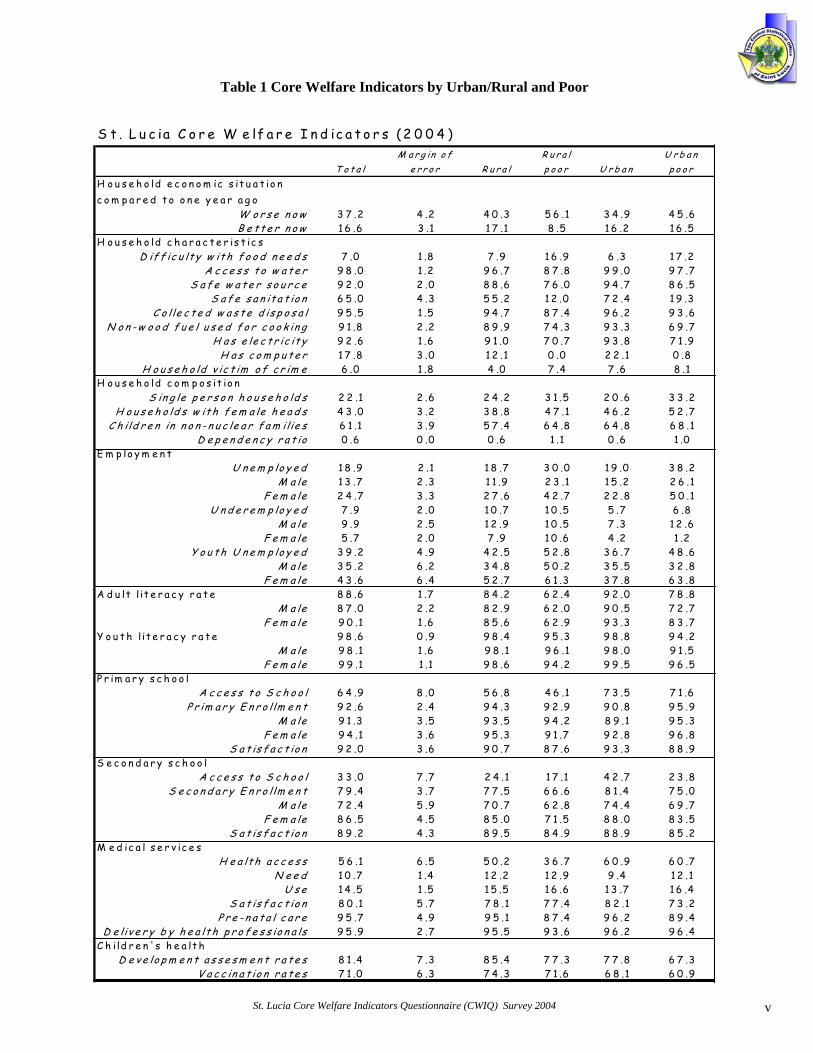
Gender The results on gender indicate that female-headed households exist often in less favourable circumstances. 25% of all female-headed households fall into the poorest quintile, compared to 18% of male-headed households. Half of female heads of households are reported as unemployed. Female headed households are less likely to own assets such as land, housing or vehicles (61% compared to 65% of male-headed, 76% compared to 80% and 14% compared to 34%). Nevertheless, in terms of education, females have higher attendance rates, lower drop out rates and higher literacy rates than males. Employment Unemployment was defined as persons aged 15 and above available for work but who did not work during the reference period of 2 months preceding the survey. The unemployment rate was 18.8% (compared to 17% in 2001). There was a significant gender difference with a 14% unemployment level for males yet a 25% level for females. Youth unemployment is markedly higher at 39%, and female youth especially high at 44%. These levels are of concern in terms of meeting MDG goals. Underemployment was defined as those persons aged 15 and above who sought to increase their earnings in the seven days preceding the survey. The underemployment rate was 8%; 6% and 11% in urban and rural areas respectively. Disaggregated by gender the underemployment rates were 10% males and 6% females. Core Indicators The summary results for the CWIQ Survey are presented in Table 1 and Table 2.
St. Lucia Core Welfare Indicators Questionnaire (CWIQ) Survey 2004 v
Table 1 Core Welfare Indicators by Urban/Rural and Poor
S t . L u c ia C o r e W e lf a r e I n d ic a t o r s (2 0 0 4 )
T o t a lM a r g in o f
e r r o r R u r a lR u r a l p o o r U r b a n
U r b a n p o o r
H o u s e h o ld e c o n o m ic s it u a t io n c o m p a r e d t o o n e y e a r a g o
W o r s e n o w 3 7 .2 4 .2 4 0 .3 5 6 .1 3 4 .9 4 5 .6B e t t e r n o w 1 6 .6 3 .1 1 7 .1 8 .5 1 6 .2 1 6 .5
H o u s e h o ld c h a r a c t e r is t ic sD if f ic u lt y w it h f o o d n e e d s 7 .0 1 .8 7 .9 1 6 .9 6 .3 1 7 .2
A c c e s s t o w a t e r 9 8 .0 1 .2 9 6 .7 8 7 .8 9 9 .0 9 7 .7S a f e w a t e r s o u r c e 9 2 .0 2 .0 8 8 .6 7 6 .0 9 4 .7 8 6 .5
S a f e s a n it a t io n 6 5 .0 4 .3 5 5 .2 1 2 .0 7 2 .4 1 9 .3C o l le c t e d w a s t e d is p o s a l 9 5 .5 1 .5 9 4 .7 8 7 .4 9 6 .2 9 3 .6
N o n - w o o d f u e l u s e d f o r c o o k in g 9 1 .8 2 .2 8 9 .9 7 4 .3 9 3 .3 6 9 .7H a s e le c t r ic it y 9 2 .6 1 .6 9 1 .0 7 0 .7 9 3 .8 7 1 .9
H a s c o m p u t e r 1 7 .8 3 .0 1 2 .1 0 .0 2 2 .1 0 .8H o u s e h o ld v ic t im o f c r im e 6 .0 1 .8 4 .0 7 .4 7 .6 8 .1
H o u s e h o ld c o m p o s it io nS in g le p e r s o n h o u s e h o ld s 2 2 .1 2 .6 2 4 .2 3 1 .5 2 0 .6 3 3 .2
H o u s e h o ld s w it h f e m a le h e a d s 4 3 .0 3 .2 3 8 .8 4 7 .1 4 6 .2 5 2 .7C h i ld r e n in n o n - n u c le a r f a m i l ie s 6 1 .1 3 .9 5 7 .4 6 4 .8 6 4 .8 6 8 .1
D e p e n d e n c y r a t io 0 .6 0 .0 0 .6 1 .1 0 .6 1 .0E m p lo y m e n t
U n e m p lo y e d 1 8 .9 2 .1 1 8 .7 3 0 .0 1 9 .0 3 8 .2M a le 1 3 .7 2 .3 1 1 .9 2 3 .1 1 5 .2 2 6 .1
F e m a le 2 4 .7 3 .3 2 7 .6 4 2 .7 2 2 .8 5 0 .1U n d e r e m p lo y e d 7 .9 2 .0 1 0 .7 1 0 .5 5 .7 6 .8
M a le 9 .9 2 .5 1 2 .9 1 0 .5 7 .3 1 2 .6F e m a le 5 .7 2 .0 7 .9 1 0 .6 4 .2 1 .2
Y o u t h U n e m p lo y e d 3 9 .2 4 .9 4 2 .5 5 2 .8 3 6 .7 4 8 .6M a le 3 5 .2 6 .2 3 4 .8 5 0 .2 3 5 .5 3 2 .8
F e m a le 4 3 .6 6 .4 5 2 .7 6 1 .3 3 7 .8 6 3 .8A d u lt l it e r a c y r a t e 8 8 .6 1 .7 8 4 .2 6 2 .4 9 2 .0 7 8 .8
M a le 8 7 .0 2 .2 8 2 .9 6 2 .0 9 0 .5 7 2 .7F e m a le 9 0 .1 1 .6 8 5 .6 6 2 .9 9 3 .3 8 3 .7
Y o u t h l it e r a c y r a t e 9 8 .6 0 .9 9 8 .4 9 5 .3 9 8 .8 9 4 .2M a le 9 8 .1 1 .6 9 8 .1 9 6 .1 9 8 .0 9 1 .5
F e m a le 9 9 .1 1 .1 9 8 .6 9 4 .2 9 9 .5 9 6 .5P r im a r y s c h o o l
A c c e s s t o S c h o o l 6 4 .9 8 .0 5 6 .8 4 6 .1 7 3 .5 7 1 .6P r im a r y E n r o l lm e n t 9 2 .6 2 .4 9 4 .3 9 2 .9 9 0 .8 9 5 .9
M a le 9 1 .3 3 .5 9 3 .5 9 4 .2 8 9 .1 9 5 .3F e m a le 9 4 .1 3 .6 9 5 .3 9 1 .7 9 2 .8 9 6 .8
S a t is f a c t io n 9 2 .0 3 .6 9 0 .7 8 7 .6 9 3 .3 8 8 .9S e c o n d a r y s c h o o l
A c c e s s t o S c h o o l 3 3 .0 7 .7 2 4 .1 1 7 .1 4 2 .7 2 3 .8S e c o n d a r y E n r o l lm e n t 7 9 .4 3 .7 7 7 .5 6 6 .6 8 1 .4 7 5 .0
M a le 7 2 .4 5 .9 7 0 .7 6 2 .8 7 4 .4 6 9 .7F e m a le 8 6 .5 4 .5 8 5 .0 7 1 .5 8 8 .0 8 3 .5
S a t is f a c t io n 8 9 .2 4 .3 8 9 .5 8 4 .9 8 8 .9 8 5 .2M e d ic a l s e r v ic e s
H e a lt h a c c e s s 5 6 .1 6 .5 5 0 .2 3 6 .7 6 0 .9 6 0 .7N e e d 1 0 .7 1 .4 1 2 .2 1 2 .9 9 .4 1 2 .1
U s e 1 4 .5 1 .5 1 5 .5 1 6 .6 1 3 .7 1 6 .4S a t is f a c t io n 8 0 .1 5 .7 7 8 .1 7 7 .4 8 2 .1 7 3 .2
P r e - n a t a l c a r e 9 5 .7 4 .9 9 5 .1 8 7 .4 9 6 .2 8 9 .4D e l iv e r y b y h e a lt h p r o f e s s io n a ls 9 5 .9 2 .7 9 5 .5 9 3 .6 9 6 .2 9 6 .4
C h i ld r e n ' s h e a lt hD e v e lo p m e n t a s s e s m e n t r a t e s 8 1 .4 7 .3 8 5 .4 7 7 .3 7 7 .8 6 7 .3
V a c c in a t io n r a t e s 7 1 .0 6 .3 7 4 .3 7 1 .6 6 8 .1 6 0 .9
St. Lucia Core Welfare Indicators Questionnaire (CWIQ) Survey 2004 vi
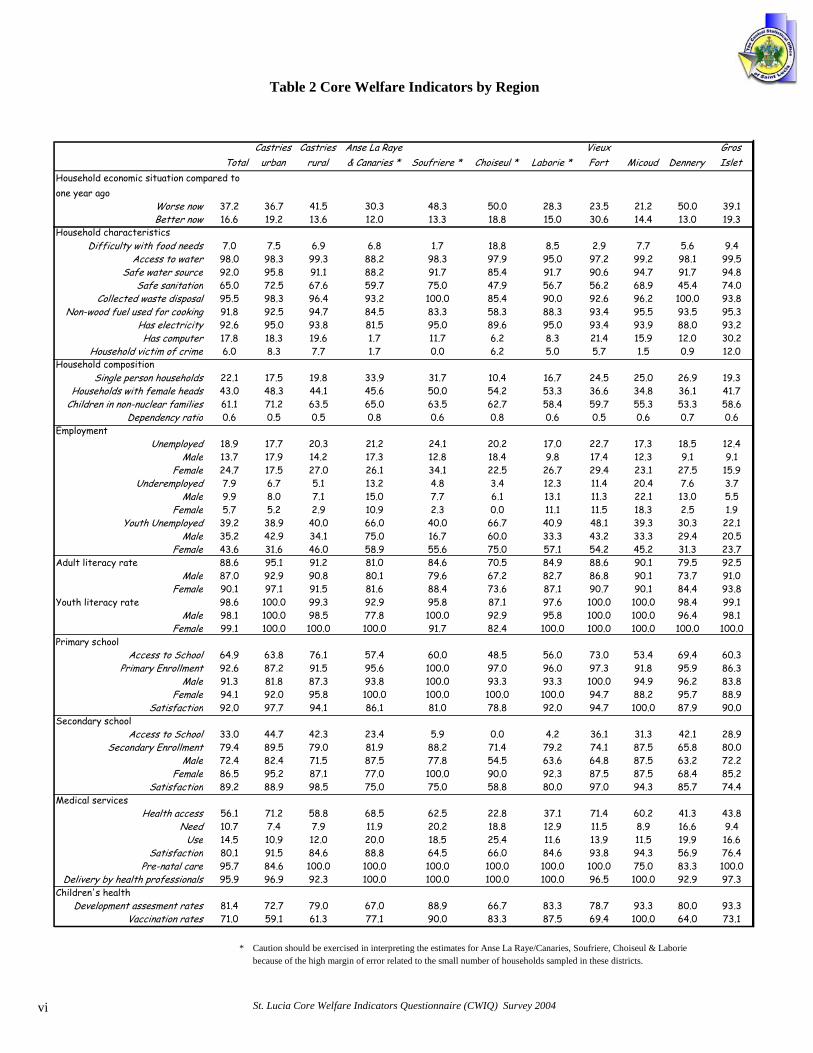
Table 2 Core Welfare Indicators by Region
TotalCastries
urbanCastries
ruralAnse La Raye & Canaries * Soufriere * Choiseul * Laborie *
Vieux Fort Micoud Dennery
Gros Islet
Worse now 37.2 36.7 41.5 30.3 48.3 50.0 28.3 23.5 21.2 50.0 39.1Better now 16.6 19.2 13.6 12.0 13.3 18.8 15.0 30.6 14.4 13.0 19.3
Household characteristicsDifficulty with food needs 7.0 7.5 6.9 6.8 1.7 18.8 8.5 2.9 7.7 5.6 9.4
Access to water 98.0 98.3 99.3 88.2 98.3 97.9 95.0 97.2 99.2 98.1 99.5Safe water source 92.0 95.8 91.1 88.2 91.7 85.4 91.7 90.6 94.7 91.7 94.8
Safe sanitation 65.0 72.5 67.6 59.7 75.0 47.9 56.7 56.2 68.9 45.4 74.0Collected waste disposal 95.5 98.3 96.4 93.2 100.0 85.4 90.0 92.6 96.2 100.0 93.8
Non-wood fuel used for cooking 91.8 92.5 94.7 84.5 83.3 58.3 88.3 93.4 95.5 93.5 95.3Has electricity 92.6 95.0 93.8 81.5 95.0 89.6 95.0 93.4 93.9 88.0 93.2Has computer 17.8 18.3 19.6 1.7 11.7 6.2 8.3 21.4 15.9 12.0 30.2
Household victim of crime 6.0 8.3 7.7 1.7 0.0 6.2 5.0 5.7 1.5 0.9 12.0Household composition
Single person households 22.1 17.5 19.8 33.9 31.7 10.4 16.7 24.5 25.0 26.9 19.3Households with female heads 43.0 48.3 44.1 45.6 50.0 54.2 53.3 36.6 34.8 36.1 41.7
Children in non-nuclear families 61.1 71.2 63.5 65.0 63.5 62.7 58.4 59.7 55.3 53.3 58.6Dependency ratio 0.6 0.5 0.5 0.8 0.6 0.8 0.6 0.5 0.6 0.7 0.6
EmploymentUnemployed 18.9 17.7 20.3 21.2 24.1 20.2 17.0 22.7 17.3 18.5 12.4
Male 13.7 17.9 14.2 17.3 12.8 18.4 9.8 17.4 12.3 9.1 9.1Female 24.7 17.5 27.0 26.1 34.1 22.5 26.7 29.4 23.1 27.5 15.9
Underemployed 7.9 6.7 5.1 13.2 4.8 3.4 12.3 11.4 20.4 7.6 3.7Male 9.9 8.0 7.1 15.0 7.7 6.1 13.1 11.3 22.1 13.0 5.5
Female 5.7 5.2 2.9 10.9 2.3 0.0 11.1 11.5 18.3 2.5 1.9 Youth Unemployed 39.2 38.9 40.0 66.0 40.0 66.7 40.9 48.1 39.3 30.3 22.1
Male 35.2 42.9 34.1 75.0 16.7 60.0 33.3 43.2 33.3 29.4 20.5Female 43.6 31.6 46.0 58.9 55.6 75.0 57.1 54.2 45.2 31.3 23.7
Adult literacy rate 88.6 95.1 91.2 81.0 84.6 70.5 84.9 88.6 90.1 79.5 92.5Male 87.0 92.9 90.8 80.1 79.6 67.2 82.7 86.8 90.1 73.7 91.0
Female 90.1 97.1 91.5 81.6 88.4 73.6 87.1 90.7 90.1 84.4 93.8Youth literacy rate 98.6 100.0 99.3 92.9 95.8 87.1 97.6 100.0 100.0 98.4 99.1
Male 98.1 100.0 98.5 77.8 100.0 92.9 95.8 100.0 100.0 96.4 98.1Female 99.1 100.0 100.0 100.0 91.7 82.4 100.0 100.0 100.0 100.0 100.0
Primary schoolAccess to School 64.9 63.8 76.1 57.4 60.0 48.5 56.0 73.0 53.4 69.4 60.3
Primary Enrollment 92.6 87.2 91.5 95.6 100.0 97.0 96.0 97.3 91.8 95.9 86.3Male 91.3 81.8 87.3 93.8 100.0 93.3 93.3 100.0 94.9 96.2 83.8
Female 94.1 92.0 95.8 100.0 100.0 100.0 100.0 94.7 88.2 95.7 88.9Satisfaction 92.0 97.7 94.1 86.1 81.0 78.8 92.0 94.7 100.0 87.9 90.0
Secondary schoolAccess to School 33.0 44.7 42.3 23.4 5.9 0.0 4.2 36.1 31.3 42.1 28.9
Secondary Enrollment 79.4 89.5 79.0 81.9 88.2 71.4 79.2 74.1 87.5 65.8 80.0Male 72.4 82.4 71.5 87.5 77.8 54.5 63.6 64.8 87.5 63.2 72.2
Female 86.5 95.2 87.1 77.0 100.0 90.0 92.3 87.5 87.5 68.4 85.2Satisfaction 89.2 88.9 98.5 75.0 75.0 58.8 80.0 97.0 94.3 85.7 74.4
Medical servicesHealth access 56.1 71.2 58.8 68.5 62.5 22.8 37.1 71.4 60.2 41.3 43.8
Need 10.7 7.4 7.9 11.9 20.2 18.8 12.9 11.5 8.9 16.6 9.4Use 14.5 10.9 12.0 20.0 18.5 25.4 11.6 13.9 11.5 19.9 16.6
Satisfaction 80.1 91.5 84.6 88.8 64.5 66.0 84.6 93.8 94.3 56.9 76.4Pre-natal care 95.7 84.6 100.0 100.0 100.0 100.0 100.0 100.0 75.0 83.3 100.0
Delivery by health professionals 95.9 96.9 92.3 100.0 100.0 100.0 100.0 96.5 100.0 92.9 97.3Children's health
Development assesment rates 81.4 72.7 79.0 67.0 88.9 66.7 83.3 78.7 93.3 80.0 93.3Vaccination rates 71.0 59.1 61.3 77.1 90.0 83.3 87.5 69.4 100.0 64.0 73.1
* Caution should be exercised in interpreting the estimates for Anse La Raye/Canaries, Soufriere, Choiseul & Laboriebecause of the high margin of error related to the small number of households sampled in these districts.
Household economic situation compared to one year ago
St. Lucia Core Welfare Indicators Questionnaire (CWIQ) Survey 2004 vii
Core Welfare Indicators Definitions
The indicators have been derived from the 2004 St. Lucia CWIQ survey and are based on a sample of 1,305 households. Margin of error expresses the error attributed to sampling. It is expressed as an absolute percentage and indicates the range of a 95% confidence interval for the estimate. Poor households: are households classified in the lowest quintile as measured using a set of indicators designed to estimate the households well-being. Details are presented under survey methodology and Appendix 1. Household economic situation compared to one year ago: worse is defined for households that replied much worse now or a little worse now; better is defined for households that replied a little better now or much better now. Difficulty meeting food needs: is defined for households that reported difficulty meeting food needs often or always. Access to water is defined for households with a water source less than 15 minutes away. Safe water source is defined for households having a public piped water source (into dwelling, into yard or public standpipe). Safe sanitation is defined for households using a flush toilet or ventilated improved pit latrine. Has electricity is defined for households using electricity for cooking or lighting or generator/shared electricity for lighting. Non-wood fuel used for cooking: is defined for households using a fuel other than firewood or charcoal for cooking. Collected waste disposal: is defined for households using government collected or a government skip for waste disposal. Household victim of a crime: is defined for households where any member was a victim of a crime in the 12 month period preceding the survey. Children living in non-nuclear households: is defined for children under age 18 who are not living with both parents. Dependency ratio: is the ratio of the number of household members ages 0-14 and 65 and above to the number of household members age 15-64. Unemployed is defined for age 15 and above. It includes persons who did not work in the seven day period preceding the survey and who looked for work in the four week period preceding the survey. The base for the unemployment rate is the active population. Underemployed is defined for age 15 and above. It includes persons who sought to increase earnings in the seven day period preceding the survey. The base for the underemployment rate is the active population.
Youth unemployment is defined for ages 15-24. It includes persons who did not work in the seven day period preceding the survey and who looked for work in the four week period preceding the survey. The base for the unemployment rate is the active population. Adult literacy rates are defined for persons age 15 and above and are based on the judgement of the respondent. Youth literacy rates are defined for persons age 15 to 24. Primary school estimates are defined for children aged 6-11. • Access is defined for children living in households with a
primary school less than 15 minutes away. • Enrollment (net) is defined for children currently in primary
school (grades 1 to 6). • Satisfaction is defined for all children currently in primary
school who cited no problems. Secondary school estimates are defined for children aged 12-16. • Access is defined for children living in households with a
secondary school less than 15 minutes away. • Enrollment (net) is defined for children currently in
secondary school (grades 7 to 11). • Satisfaction is defined for all children currently in secondary
school who cited no problems. Health access is defined for persons living in households with a health facility less than 15 minutes away. Health need is defined for persons who were sick or injured in the four week period preceding the survey. Health use is defined for persons who consulted a health practitioner in the four week period preceding the survey. Note that need is not taken into account. Health satisfaction is defined for persons who consulted a health practitioner in the four week period preceding the survey and who cited no problems. Prenatal care is defined for women age 15-49 who had a live birth in the 12 months preceding the survey and who received pre-natal care during the pregnancy. Delivery by health professionals is defined for children born in the last 5 years who were delivered by a doctor, nurse or midwife. Development assessment rate: is defined for children age 3 and above who have had all 3 development assessments (3 and 8 months and 3 years). Measles/MMR vaccination rate: is defined for children age 1 and above who have had a measles and/or MMR vaccination.
1. SURVEY DESIGN 1.1 Introduction The Core Welfare Indicator Questionnaires (CWIQ) survey was introduced in 1996, and has been mainly deployed in African countries as an attempt to improve the timeliness and reliability of poverty monitoring data. The survey was designed to collect information needed to identify and classify target groups and provide basic welfare indicators. It was, in addition, meant to collect information to measure access, utilisation and satisfaction with social services. The survey was developed by a group of donors and institutions including the World Bank, DFID, the ILO, UNICEF and UNDP. It adapted the technique of optical reading which permits fast processing of the data and thus timely release of the results. 1.2 Objective The St. Lucia CWIQ pilot survey objectives were as follows: • To introduce the survey to the Caribbean Region as an improved and affordable poverty monitoring tool. • To test the suitability of the poverty predictors for the Caribbean. • To provide welfare indicators for monitoring poverty and welfare programmes in St. Lucia 1.3 Sample Design The CWIQ sample was based on a two stage systematic random sample, the first stage being the Enumeration District (ED), and the second the household. A full list of EDs is available from the 2001 Population Census arranged by 10 Administrative Districts with household numbers and details of the percentage of households belonging to professional / office based workers as well as the percentage engaged in agriculture. St Lucia comprises around 47,275 households and the average ED consists of 118 households. The CWIQ sample of EDs was drawn from a list of all 401 EDs arranged (i) by District and then (ii) by percent of office employees. This ensured a broad geographical coverage and a balance of urban and rural households. The sample of EDs was drawn using probability proportional to size by accumulating household populations and selecting a fixed sampling interval with a random start point. The objective of the sample was to obtain a nationally representative result with minimum cost and in the available time frame of 14 days for fieldwork. A work rate of 3-4 per day per enumerator was considered feasible. To enable rapid completion, the number of EDs was set at 109 and the number of households per cluster to 12, giving a total sample of 1308 (around 3% of the national population of households). This was expected to be large enough to generate statistically reliable results for the main reporting disaggregations (poverty quintile, urban-rural, age categories, etc.). Only for District tabulations, where in the smaller Districts1 the sample drawn was quite small, is there a possibility of rather high margins of error due to small samples. The resulting sample contains 62 urban and 47 rural EDs. Further details are given in Table 3 below.
1 The sample drawn for Anse Le Raye/Canaries, Soufriere and Laborie is 60 households each, while for Choiseul it is 48.
St. Lucia Core Welfare Indicators Questionnaire (CWIQ) Survey 2004 1
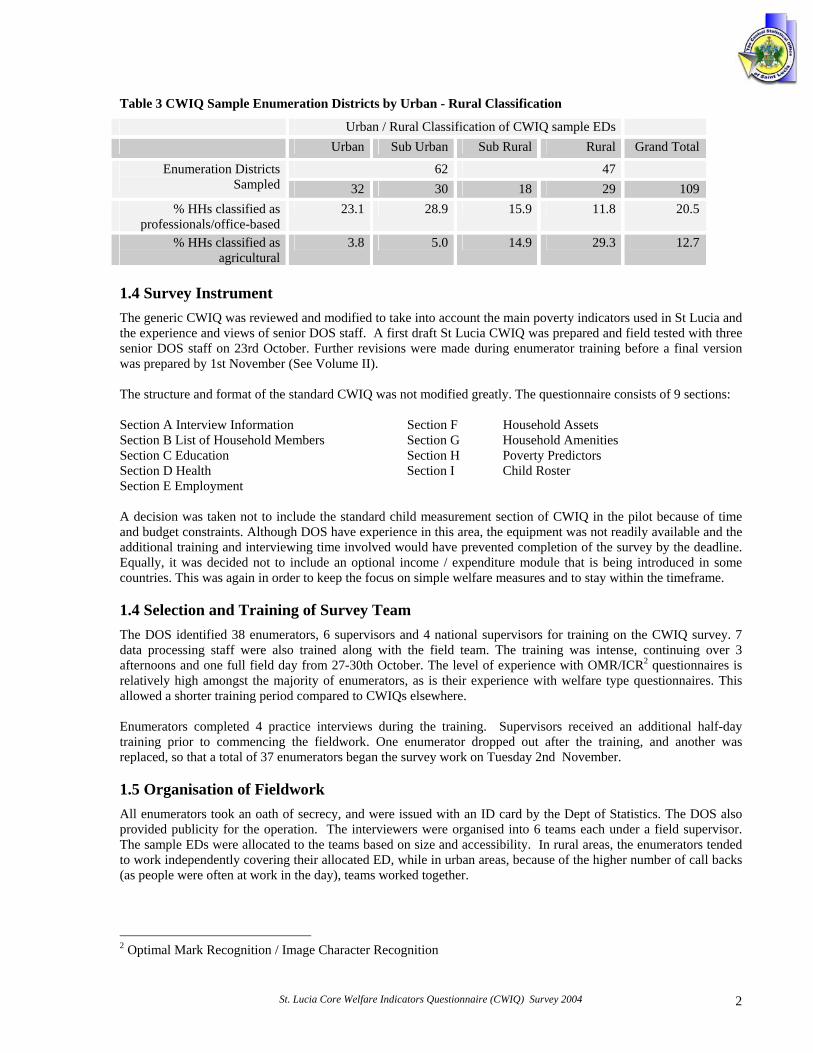
Table 3 CWIQ Sample Enumeration Districts by Urban - Rural Classification
Urban / Rural Classification of CWIQ sample EDs Urban Sub Urban Sub Rural Rural Grand Total
62 47 Enumeration Districts Sampled 32 30 18 29 109
% HHs classified as professionals/office-based
23.1 28.9 15.9 11.8 20.5
% HHs classified as agricultural
3.8 5.0 14.9 29.3 12.7
1.4 Survey Instrument The generic CWIQ was reviewed and modified to take into account the main poverty indicators used in St Lucia and the experience and views of senior DOS staff. A first draft St Lucia CWIQ was prepared and field tested with three senior DOS staff on 23rd October. Further revisions were made during enumerator training before a final version was prepared by 1st November (See Volume II). The structure and format of the standard CWIQ was not modified greatly. The questionnaire consists of 9 sections: Section A Interview Information Section F Household Assets Section B List of Household Members Section G Household Amenities Section C Education Section H Poverty Predictors Section D Health Section I Child Roster Section E Employment A decision was taken not to include the standard child measurement section of CWIQ in the pilot because of time and budget constraints. Although DOS have experience in this area, the equipment was not readily available and the additional training and interviewing time involved would have prevented completion of the survey by the deadline. Equally, it was decided not to include an optional income / expenditure module that is being introduced in some countries. This was again in order to keep the focus on simple welfare measures and to stay within the timeframe. 1.4 Selection and Training of Survey Team The DOS identified 38 enumerators, 6 supervisors and 4 national supervisors for training on the CWIQ survey. 7 data processing staff were also trained along with the field team. The training was intense, continuing over 3 afternoons and one full field day from 27-30th October. The level of experience with OMR/ICR2 questionnaires is relatively high amongst the majority of enumerators, as is their experience with welfare type questionnaires. This allowed a shorter training period compared to CWIQs elsewhere. Enumerators completed 4 practice interviews during the training. Supervisors received an additional half-day training prior to commencing the fieldwork. One enumerator dropped out after the training, and another was replaced, so that a total of 37 enumerators began the survey work on Tuesday 2nd November. 1.5 Organisation of Fieldwork All enumerators took an oath of secrecy, and were issued with an ID card by the Dept of Statistics. The DOS also provided publicity for the operation. The interviewers were organised into 6 teams each under a field supervisor. The sample EDs were allocated to the teams based on size and accessibility. In rural areas, the enumerators tended to work independently covering their allocated ED, while in urban areas, because of the higher number of call backs (as people were often at work in the day), teams worked together.
2 Optimal Mark Recognition / Image Character Recognition
St. Lucia Core Welfare Indicators Questionnaire (CWIQ) Survey 2004 2
Due to the high number of replacements and call backs, the target of 3-4 interviews proved difficult. In addition, survey fatigue is common in St. Lucia, leading to slower interviews and some refusals. 1.6 Quality Control Several control measures were organised to ensure the quality of the information collected. First, the supervisors were instructed to perform on spot interviews and to complete a review of all filled questionnaires. In the supervisors’ manual, a special section with detailed instructions on verification and editing of questionnaire was added to serve as a guide for quality control. Second, the co-ordinators were also instructed to verify 10% of the filled questionnaires although in practice they verified most of them. In addition, the DOS senior staff carried out further checks on the completed questionnaires before they were sent for data processing. A full meeting with all co-ordinators, monitors and data processing team was held at the end of the first week to review the survey progress. Necessary instructions and recommendations made during the meeting were conveyed to the field staff for implementation. 1.8 Data Processing The data processing system for CWIQ surveys is tightly integrated with all survey development and implementation activities. This is necessary to achieve the objective of producing reliable survey results as quickly as possible. The specific objectives of the CWIQ data processing system for the St. Lucia survey were to:
Produce a survey database that was complete, consistent and has all known anomalies documented.
Produce survey results (data summaries, cross-tabulations, core indicators and sampling errors) within a week of the end of field work.
Facilitate the preparation of the survey report within three weeks of the end of field work.
Create a survey archive with all data, documentation and reports for dissemination to data users as soon as
the survey report was available. The CWIQ data processing system has four principal functions: (1) data entry, (2) data validation and correction, (3) preparation of survey results, and (4) creation of the survey archive. Data entry consists of converting the information in the survey questions to a machine readable form for processing in the subsequent phases. The CWIQ data processing system is designed to process the generic CWIQ questionnaire. Like the generic questionnaire, the generic system is never used for a real survey, but is modified to fit the specific needs of each survey. As the generic questionnaire is adapted to local requirements, the data processing system is adapted for changes to the questionnaire and survey outputs. For the St. Lucia survey the questionnaire was modified in three iterations. Likewise, the data entry and validation parts of the system were modified for each version of the questionnaire. The first modifications were tested with questionnaires completed during the field pre-test of the questionnaire. As a result of these changes, the questionnaires modified for interviewer training. The final changes were made after interviewer training and field practice. Data processing for the St. Lucia CWIQ survey was organised to process questionnaires while the fieldwork was underway and to produce the survey results a short time after the end of the fieldwork. The survey data processing office was set up in a room provided at the Department of Statistics. Scanning of questionnaires and image verification was done by DOS staff using the optical scanners and software (TELEform Enterprise edition) which had been used for the 2001 population census. A desktop computer equipped with a printer was used for survey database maintenance, data validation, error correction and tabulation. Questionnaires were sent to the DOS office when the fieldwork for an enumeration district (ED) was complete. On arrival at the office, the ED identifier and name were confirmed using a master list of all enumeration districts in the sample. The questionnaires and households for the ED were then counted to confirm that all households in the ED
St. Lucia Core Welfare Indicators Questionnaire (CWIQ) Survey 2004 3
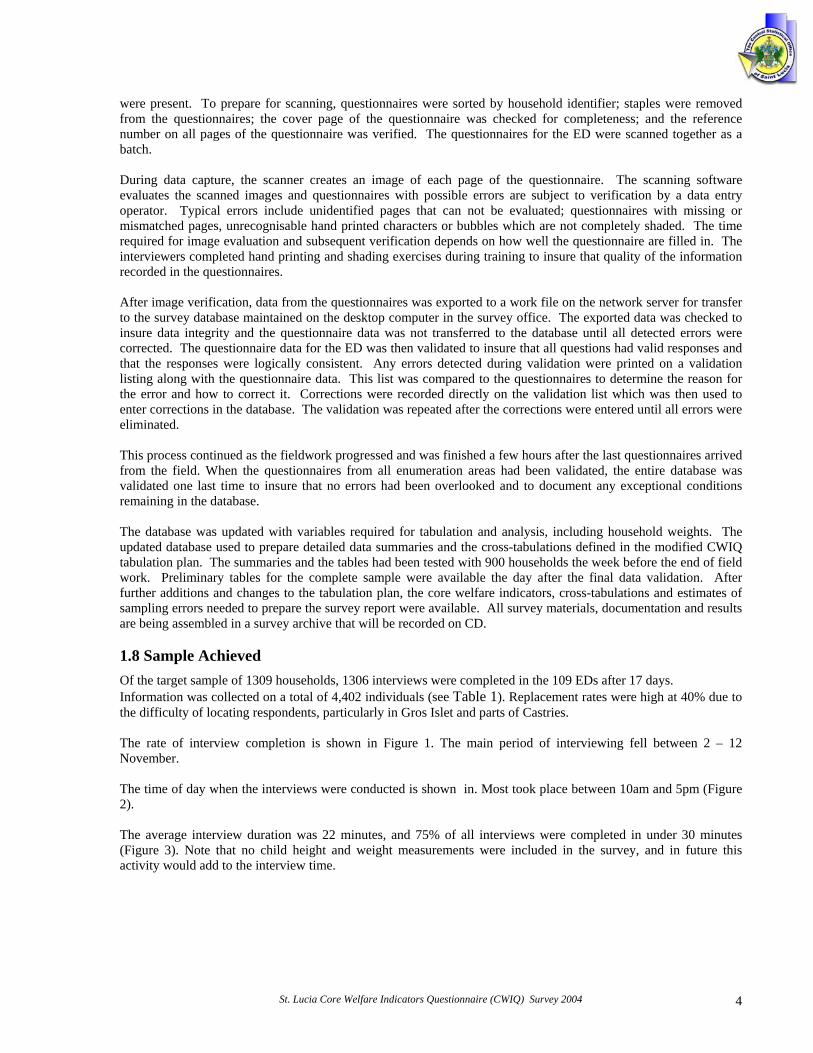
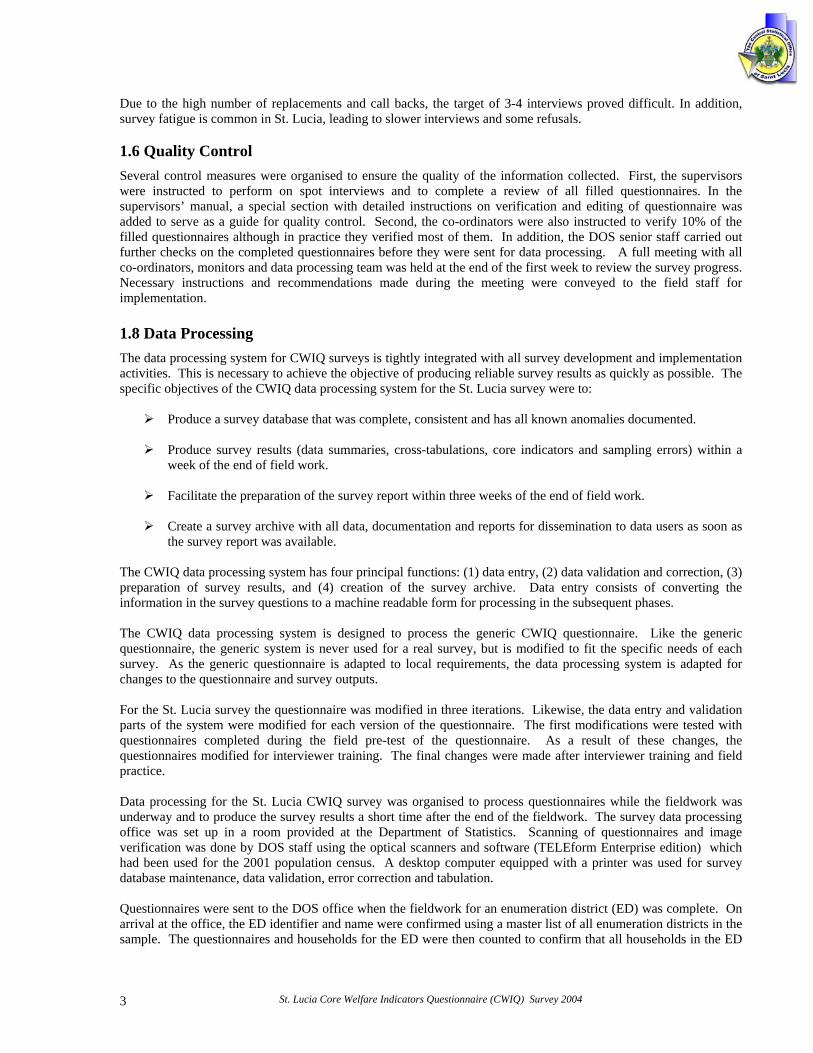
were present. To prepare for scanning, questionnaires were sorted by household identifier; staples were removed from the questionnaires; the cover page of the questionnaire was checked for completeness; and the reference number on all pages of the questionnaire was verified. The questionnaires for the ED were scanned together as a batch. During data capture, the scanner creates an image of each page of the questionnaire. The scanning software evaluates the scanned images and questionnaires with possible errors are subject to verification by a data entry operator. Typical errors include unidentified pages that can not be evaluated; questionnaires with missing or mismatched pages, unrecognisable hand printed characters or bubbles which are not completely shaded. The time required for image evaluation and subsequent verification depends on how well the questionnaire are filled in. The interviewers completed hand printing and shading exercises during training to insure that quality of the information recorded in the questionnaires. After image verification, data from the questionnaires was exported to a work file on the network server for transfer to the survey database maintained on the desktop computer in the survey office. The exported data was checked to insure data integrity and the questionnaire data was not transferred to the database until all detected errors were corrected. The questionnaire data for the ED was then validated to insure that all questions had valid responses and that the responses were logically consistent. Any errors detected during validation were printed on a validation listing along with the questionnaire data. This list was compared to the questionnaires to determine the reason for the error and how to correct it. Corrections were recorded directly on the validation list which was then used to enter corrections in the database. The validation was repeated after the corrections were entered until all errors were eliminated. This process continued as the fieldwork progressed and was finished a few hours after the last questionnaires arrived from the field. When the questionnaires from all enumeration areas had been validated, the entire database was validated one last time to insure that no errors had been overlooked and to document any exceptional conditions remaining in the database. The database was updated with variables required for tabulation and analysis, including household weights. The updated database used to prepare detailed data summaries and the cross-tabulations defined in the modified CWIQ tabulation plan. The summaries and the tables had been tested with 900 households the week before the end of field work. Preliminary tables for the complete sample were available the day after the final data validation. After further additions and changes to the tabulation plan, the core welfare indicators, cross-tabulations and estimates of sampling errors needed to prepare the survey report were available. All survey materials, documentation and results are being assembled in a survey archive that will be recorded on CD. 1.8 Sample Achieved Of the target sample of 1309 households, 1306 interviews were completed in the 109 EDs after 17 days. Information was collected on a total of 4,402 individuals (see Table 1). Replacement rates were high at 40% due to the difficulty of locating respondents, particularly in Gros Islet and parts of Castries. The rate of interview completion is shown in Figure 1. The main period of interviewing fell between 2 – 12 November. The time of day when the interviews were conducted is shown in. Most took place between 10am and 5pm (Figure 2). The average interview duration was 22 minutes, and 75% of all interviews were completed in under 30 minutes (Figure 3). Note that no child height and weight measurements were included in the survey, and in future this activity would add to the interview time.
St. Lucia Core Welfare Indicators Questionnaire (CWIQ) Survey 2004 4
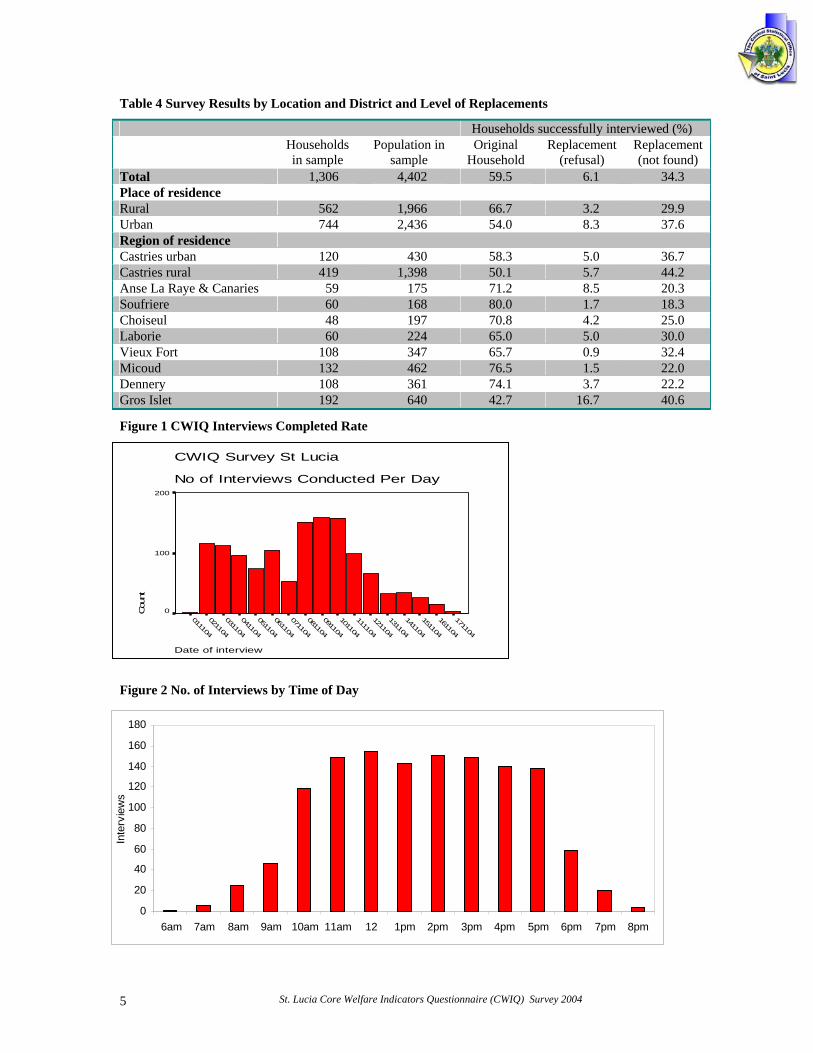
Table 4 Survey Results by Location and District and Level of Replacements
Households successfully interviewed (%) Households
in sample Population in
sample Original
Household Replacement
(refusal) Replacement (not found)
Total 1,306 4,402 59.5 6.1 34.3 Place of residence Rural 562 1,966 66.7 3.2 29.9 Urban 744 2,436 54.0 8.3 37.6 Region of residence Castries urban 120 430 58.3 5.0 36.7 Castries rural 419 1,398 50.1 5.7 44.2 Anse La Raye & Canaries 59 175 71.2 8.5 20.3 Soufriere 60 168 80.0 1.7 18.3 Choiseul 48 197 70.8 4.2 25.0 Laborie 60 224 65.0 5.0 30.0 Vieux Fort 108 347 65.7 0.9 32.4 Micoud 132 462 76.5 1.5 22.0 Dennery 108 361 74.1 3.7 22.2 Gros Islet 192 640 42.7 16.7 40.6
Figure 1 CWIQ Interviews Completed Rate
CWIQ Survey St Lucia
No of Interviews Conducted Per Day
Date of interview
171104
161104
151104
141104
131104
121104
111104
101104
091104
081104
071104
061104
051104
041104
031104
021104
011104
Cou
nt
200
100
0
Figure 2 No. of Interviews by Time of Day
0
20
40
60
80
100
120
140
160
180
6am 7am 8am 9am 10am 11am 12 1pm 2pm 3pm 4pm 5pm 6pm 7pm 8pm
Inte
rvie
ws
St. Lucia Core Welfare Indicators Questionnaire (CWIQ) Survey 2004 5
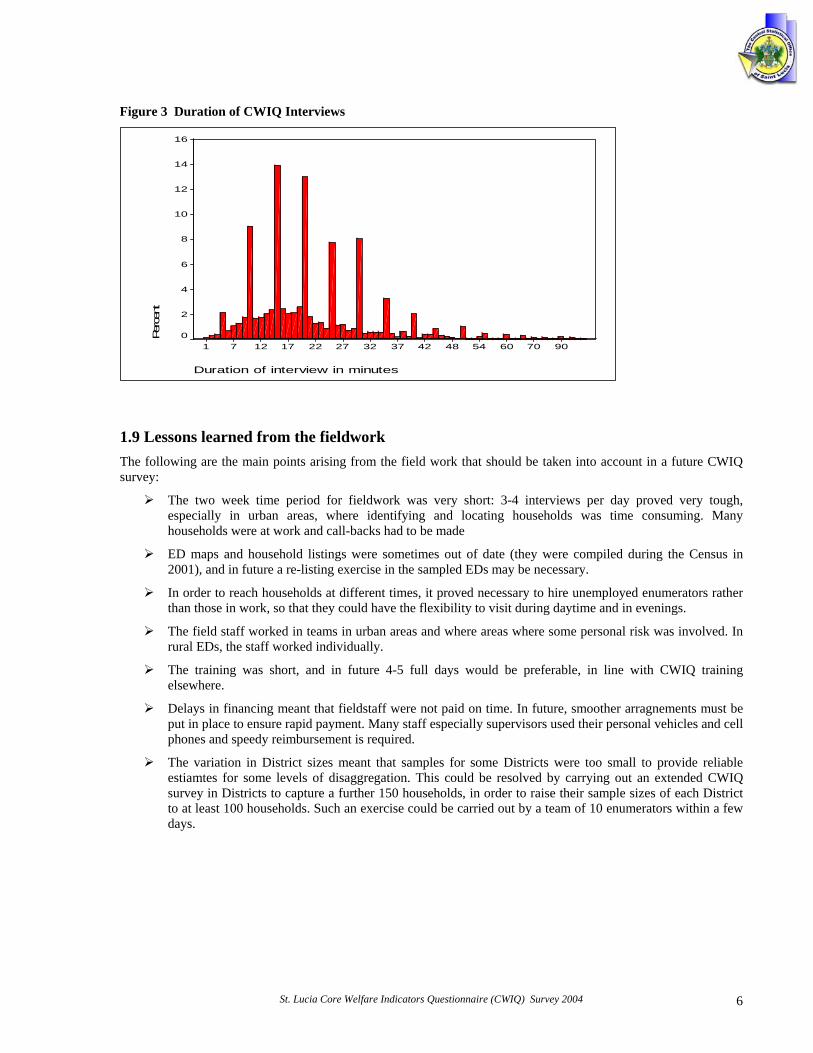
Figure 3 Duration of CWIQ Interviews
Duration of interview in minutes
90706054484237322722171271
Percen
t
16
14
12
10
8
6
4
2
0
1.9 Lessons learned from the fieldwork The following are the main points arising from the field work that should be taken into account in a future CWIQ survey:
The two week time period for fieldwork was very short: 3-4 interviews per day proved very tough, especially in urban areas, where identifying and locating households was time consuming. Many households were at work and call-backs had to be made
ED maps and household listings were sometimes out of date (they were compiled during the Census in 2001), and in future a re-listing exercise in the sampled EDs may be necessary.
In order to reach households at different times, it proved necessary to hire unemployed enumerators rather than those in work, so that they could have the flexibility to visit during daytime and in evenings.
The field staff worked in teams in urban areas and where areas where some personal risk was involved. In rural EDs, the staff worked individually.
The training was short, and in future 4-5 full days would be preferable, in line with CWIQ training elsewhere.
Delays in financing meant that fieldstaff were not paid on time. In future, smoother arragnements must be put in place to ensure rapid payment. Many staff especially supervisors used their personal vehicles and cell phones and speedy reimbursement is required.
The variation in District sizes meant that samples for some Districts were too small to provide reliable estiamtes for some levels of disaggregation. This could be resolved by carrying out an extended CWIQ survey in Districts to capture a further 150 households, in order to raise their sample sizes of each District to at least 100 households. Such an exercise could be carried out by a team of 10 enumerators within a few days.
St. Lucia Core Welfare Indicators Questionnaire (CWIQ) Survey 2004 6
2. SURVEY RESULTS
2.1 Welfare Classification
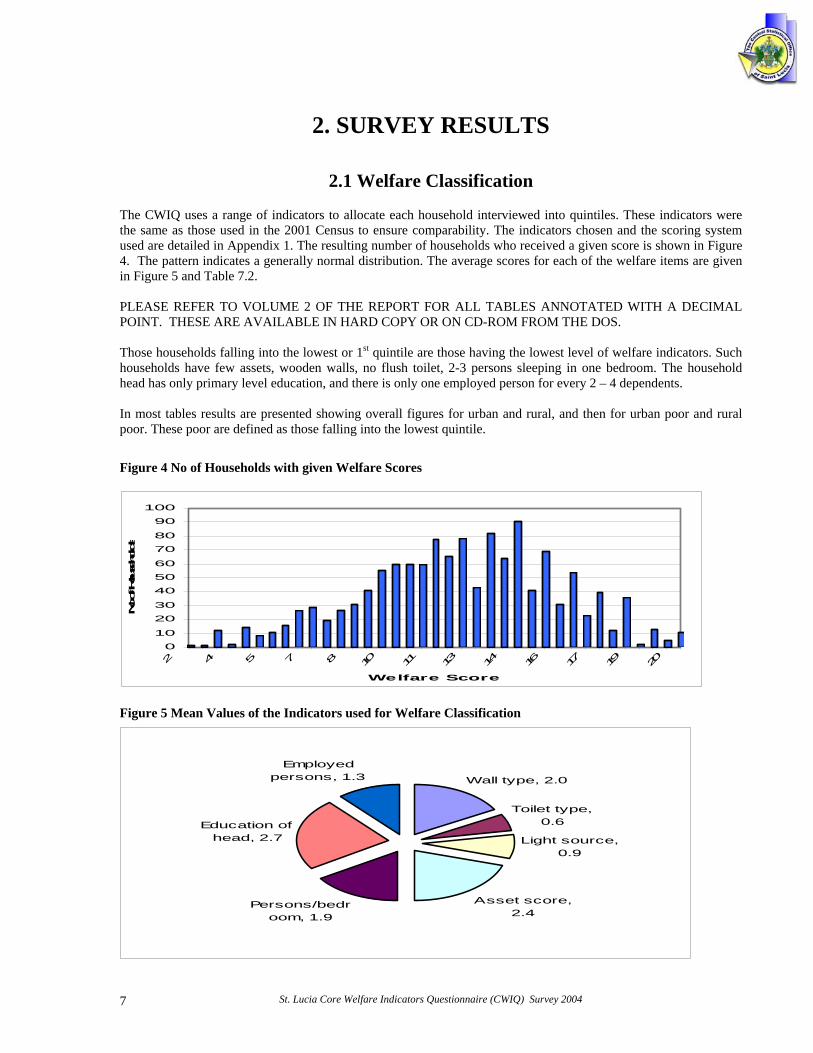
The CWIQ uses a range of indicators to allocate each household interviewed into quintiles. These indicators were the same as those used in the 2001 Census to ensure comparability. The indicators chosen and the scoring system used are detailed in Appendix 1. The resulting number of households who received a given score is shown in Figure 4. The pattern indicates a generally normal distribution. The average scores for each of the welfare items are given in Figure 5 and Table 7.2. PLEASE REFER TO VOLUME 2 OF THE REPORT FOR ALL TABLES ANNOTATED WITH A DECIMAL POINT. THESE ARE AVAILABLE IN HARD COPY OR ON CD-ROM FROM THE DOS. Those households falling into the lowest or 1st quintile are those having the lowest level of welfare indicators. Such households have few assets, wooden walls, no flush toilet, 2-3 persons sleeping in one bedroom. The household head has only primary level education, and there is only one employed person for every 2 – 4 dependents. In most tables results are presented showing overall figures for urban and rural, and then for urban poor and rural poor. These poor are defined as those falling into the lowest quintile.
Figure 4 No of Households with given Welfare Scores
010
2030
405060
7080
90100
2 4 5 7 8 10 11 13 14 16 17 19 20
Welfare Score
No of Hou
seho
lds
Figure 5 Mean Values of the Indicators used for Welfare Classification
Wall type, 2.0
Toilet type, 0.6
Light source, 0.9
Asset score, 2.4
Persons/bedroom, 1.9
Education of head, 2.7
Employed persons, 1.3
St. Lucia Core Welfare Indicators Questionnaire (CWIQ) Survey 2004 7
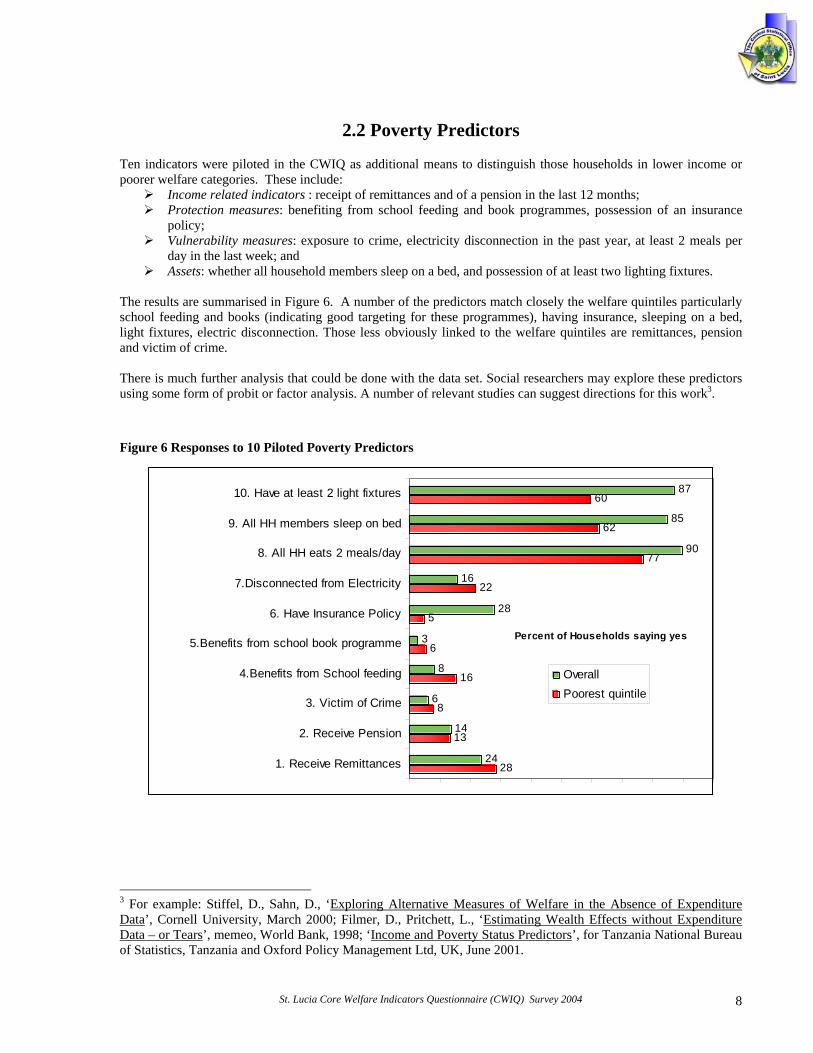
2.2 Poverty Predictors
Ten indicators were piloted in the CWIQ as additional means to distinguish those households in lower income or poorer welfare categories. These include:
Income related indicators : receipt of remittances and of a pension in the last 12 months; Protection measures: benefiting from school feeding and book programmes, possession of an insurance
policy; Vulnerability measures: exposure to crime, electricity disconnection in the past year, at least 2 meals per
day in the last week; and Assets: whether all household members sleep on a bed, and possession of at least two lighting fixtures.
The results are summarised in Figure 6. A number of the predictors match closely the welfare quintiles particularly school feeding and books (indicating good targeting for these programmes), having insurance, sleeping on a bed, light fixtures, electric disconnection. Those less obviously linked to the welfare quintiles are remittances, pension and victim of crime. There is much further analysis that could be done with the data set. Social researchers may explore these predictors using some form of probit or factor analysis. A number of relevant studies can suggest directions for this work3.
Figure 6 Responses to 10 Piloted Poverty Predictors
28
13
8
16
6
5
22
77
62
60
24
14
6
8
3
28
16
90
85
87
1. Receive Remittances
2. Receive Pension
3. Victim of Crime
4.Benefits from School feeding
5.Benefits from school book programme
6. Have Insurance Policy
7.Disconnected from Electricity
8. All HH eats 2 meals/day
9. All HH members sleep on bed
10. Have at least 2 light fixtures
Percent of Households saying yes
OverallPoorest quintile
3 For example: Stiffel, D., Sahn, D., ‘Exploring Alternative Measures of Welfare in the Absence of Expenditure Data’, Cornell University, March 2000; Filmer, D., Pritchett, L., ‘Estimating Wealth Effects without Expenditure Data – or Tears’, memeo, World Bank, 1998; ‘Income and Poverty Status Predictors’, for Tanzania National Bureau of Statistics, Tanzania and Oxford Policy Management Ltd, UK, June 2001.
St. Lucia Core Welfare Indicators Questionnaire (CWIQ) Survey 2004 8
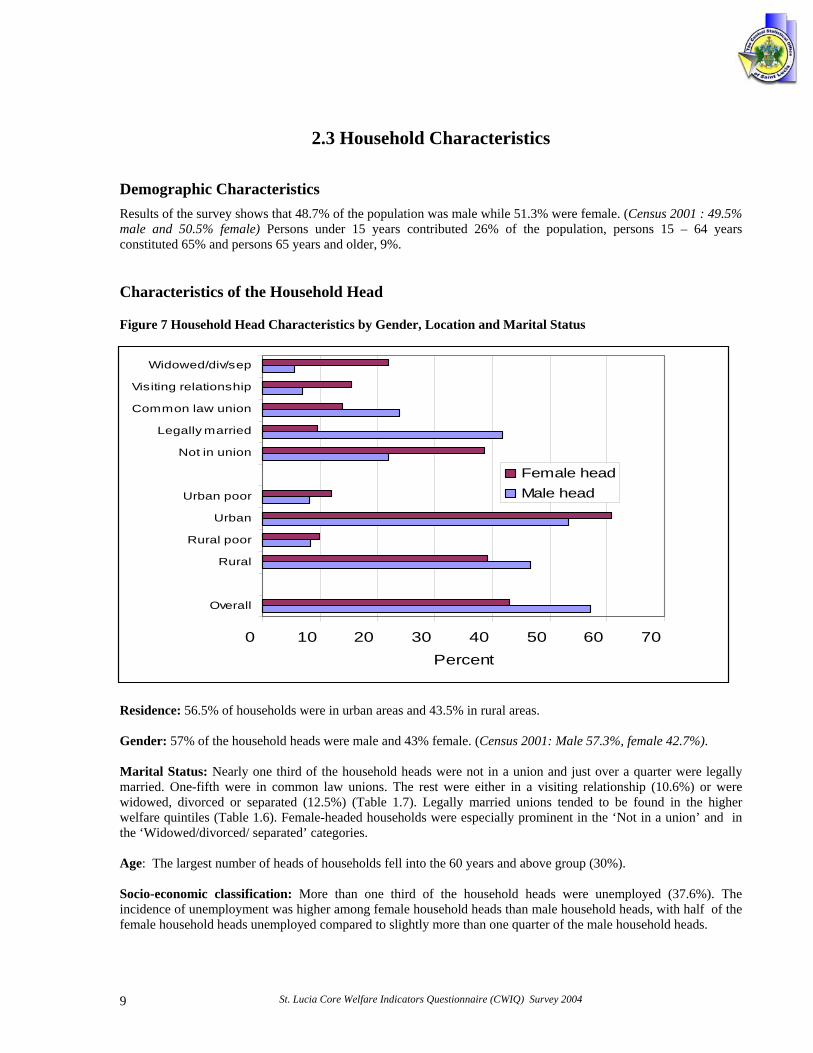
2.3 Household Characteristics
Demographic Characteristics Results of the survey shows that 48.7% of the population was male while 51.3% were female. (Census 2001 : 49.5% male and 50.5% female) Persons under 15 years contributed 26% of the population, persons 15 – 64 years constituted 65% and persons 65 years and older, 9%. Characteristics of the Household Head
Figure 7 Household Head Characteristics by Gender, Location and Marital Status
0 10 20 30 40 50 60 70
Overall
Rural
Rural poor
Urban
Urban poor
Not in union
Legally married
Common law union
Visiting relationship
Widowed/div/sep
Percent
Female headMale head
Residence: 56.5% of households were in urban areas and 43.5% in rural areas. Gender: 57% of the household heads were male and 43% female. (Census 2001: Male 57.3%, female 42.7%). Marital Status: Nearly one third of the household heads were not in a union and just over a quarter were legally married. One-fifth were in common law unions. The rest were either in a visiting relationship (10.6%) or were widowed, divorced or separated (12.5%) (Table 1.7). Legally married unions tended to be found in the higher welfare quintiles (Table 1.6). Female-headed households were especially prominent in the ‘Not in a union’ and in the ‘Widowed/divorced/ separated’ categories. Age: The largest number of heads of households fell into the 60 years and above group (30%). Socio-economic classification: More than one third of the household heads were unemployed (37.6%). The incidence of unemployment was higher among female household heads than male household heads, with half of the female household heads unemployed compared to slightly more than one quarter of the male household heads.
St. Lucia Core Welfare Indicators Questionnaire (CWIQ) Survey 2004 9
Size: Average size of household is an important indicator in determining the welfare of households. The average household size was 3.4 persons (Table 1.11). (Census 2001: Average size of household was 3.2 persons) There was no significant difference between the average size of rural and urban households (3.4 and 3.3). The rural poor have a higher average size of 3.9. Single person households comprised one-fifth of the sample, and one third of the poorer households. Children in non-nuclear families: Households containing children where either one or both parents were non-resident is high at 61% of all children surveyed under 18 years (Table 1.17). Most of these lived with just the mother (42% of cases). The urban poor has a very high incidence of this children in non-nuclear households, estimated at 68%. Castries urban was 71%. Dependency The overall dependency ratio is 0.6, indicating that less than one person is dependent on each economically active person. (The Dependency ratio for the census 2001 was also 0.6) There was no significant difference in the dependency ratio for rural and urban areas however the poorest quintile had a higher dependency ratio of 1.0. The districts of Anse la Raye, Choiseul and Dennery had dependency ratios above the national ratio (0.8, 0.7, and 0.7). Households containing 7 or more persons and persons in the unemployed socio – economic group also had slightly higher dependency ratios (0.7 and 0.8 respectively). Perception of Economic Situation 11% of the households interviewed felt that the economic situation in their community was better or much better than a year ago, 40% of households perceived the situation to be the same whilst 41% felt that it was worse or much worse (Table 2.1). Households saw the change in their own economic situation to be better than that of their community one year ago (Table 2.2). 17% of the households indicated that their economic situation was better now, 45% felt it was the same while 37% felt that their economic situation was worse. The rural poor were more pessimistic with over half of this group feeling that their situation was growing worse. Difficulty in Satisfying Food Needs
Over half of the population (56.5%) said they never had a problem in satisfying food needs of the household in the year to the survey (Table 2.4). Around 7.1% said they often or always had a problem and 19.3% had difficulty sometimes. Larger households had more difficulty satisfying food need. The poorest households also show a higher level of difficulty in meeting food needs (16-17% having often or always a problem). Education of the household head also shows a relationship with food need, with increasing level of education ties with reducing difficulty over food needs. Apparent regional differences may not be significant due to higher sampling errors for smaller sample sizes.
2.4 Assets and Amenities
The number and variety of the assets that a household possesses provides a good indication of that household’s general standard of living. Also, household assets assist in meeting both the current and future needs and desires of the household, by providing easier access to credit and the eventual opportunity to improve living standards and conditions.
St. Lucia Core Welfare Indicators Questionnaire (CWIQ) Survey 2004 10
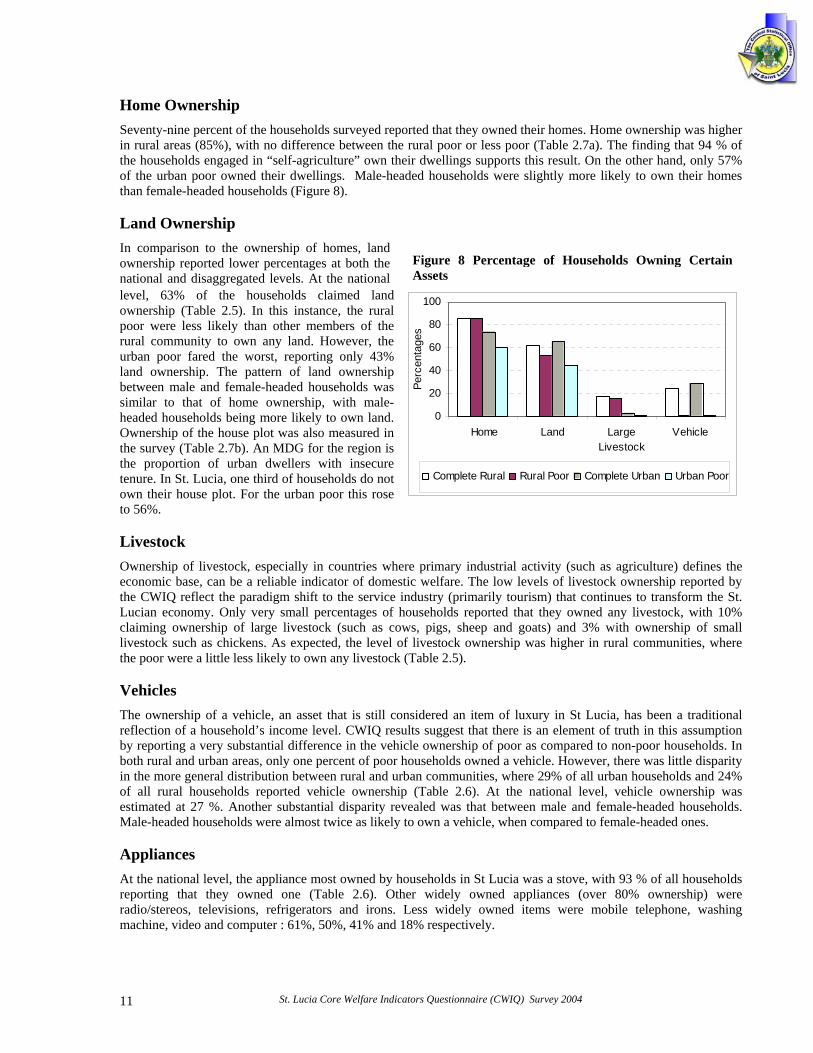
Home Ownership Seventy-nine percent of the households surveyed reported that they owned their homes. Home ownership was higher in rural areas (85%), with no difference between the rural poor or less poor (Table 2.7a). The finding that 94 % of the households engaged in “self-agriculture” own their dwellings supports this result. On the other hand, only 57% of the urban poor owned their dwellings. Male-headed households were slightly more likely to own their homes than female-headed households (Figure 8). Land Ownership In comparison to the ownership of homes, land ownership reported lower percentages at both the national and disaggregated levels. At the national level, 63% of the households claimed land ownership (Table 2.5). In this instance, the rural poor were less likely than other members of the rural community to own any land. However, the urban poor fared the worst, reporting only 43% land ownership. The pattern of land ownership between male and female-headed households was similar to that of home ownership, with male-headed households being more likely to own land. Ownership of the house plot was also measured in the survey (Table 2.7b). An MDG for the region is the proportion of urban dwellers with insecure tenure. In St. Lucia, one third of households do not own their house plot. For the urban poor this rose to 56%. Livestock Ownership of livestock, especially in countries whereconomic base, can be a reliable indicator of domestthe CWIQ reflect the paradigm shift to the service inLucian economy. Only very small percentages of hclaiming ownership of large livestock (such as cowlivestock such as chickens. As expected, the level ofthe poor were a little less likely to own any livestock ( Vehicles The ownership of a vehicle, an asset that is still conreflection of a household’s income level. CWIQ resuby reporting a very substantial difference in the vehicboth rural and urban areas, only one percent of poor hin the more general distribution between rural and urbof all rural households reported vehicle ownershipestimated at 27 %. Another substantial disparity revMale-headed households were almost twice as likely t Appliances At the national level, the appliance most owned by horeporting that they owned one (Table 2.6). Othradio/stereos, televisions, refrigerators and irons. Lmachine, video and computer : 61%, 50%, 41% and 1
St. Lucia Core Welfare Indica11
Figure 8 Percentage of Households Owning Certain Assets
0
20
40
60
80
100
Home Land LargeLivestock
VehiclePe
rcen
tage
s
Complete Rural Rural Poor Complete Urban Urban Poor
e primary industrial activity (such as agriculture) defines the ic welfare. The low levels of livestock ownership reported by dustry (primarily tourism) that continues to transform the St.
ouseholds reported that they owned any livestock, with 10% s, pigs, sheep and goats) and 3% with ownership of small livestock ownership was higher in rural communities, where Table 2.5).
sidered an item of luxury in St Lucia, has been a traditional lts suggest that there is an element of truth in this assumption le ownership of poor as compared to non-poor households. In ouseholds owned a vehicle. However, there was little disparity an communities, where 29% of all urban households and 24% (Table 2.6). At the national level, vehicle ownership was ealed was that between male and female-headed households. o own a vehicle, when compared to female-headed ones.
useholds in St Lucia was a stove, with 93 % of all households er widely owned appliances (over 80% ownership) were ess widely owned items were mobile telephone, washing
8% respectively.
tors Questionnaire (CWIQ) Survey 2004
In general, urban communities owned more appliances than rural ones. Inevitably, the poor households did not own as many appliances as the other households in their respective communities. However, they followed the same pattern of consumption of the non-poor, giving priority to the same appliances, including stoves, radios and television sets. There was little disparity in the appliance consumption pattern between male and female-headed households.
2.5 Amenities
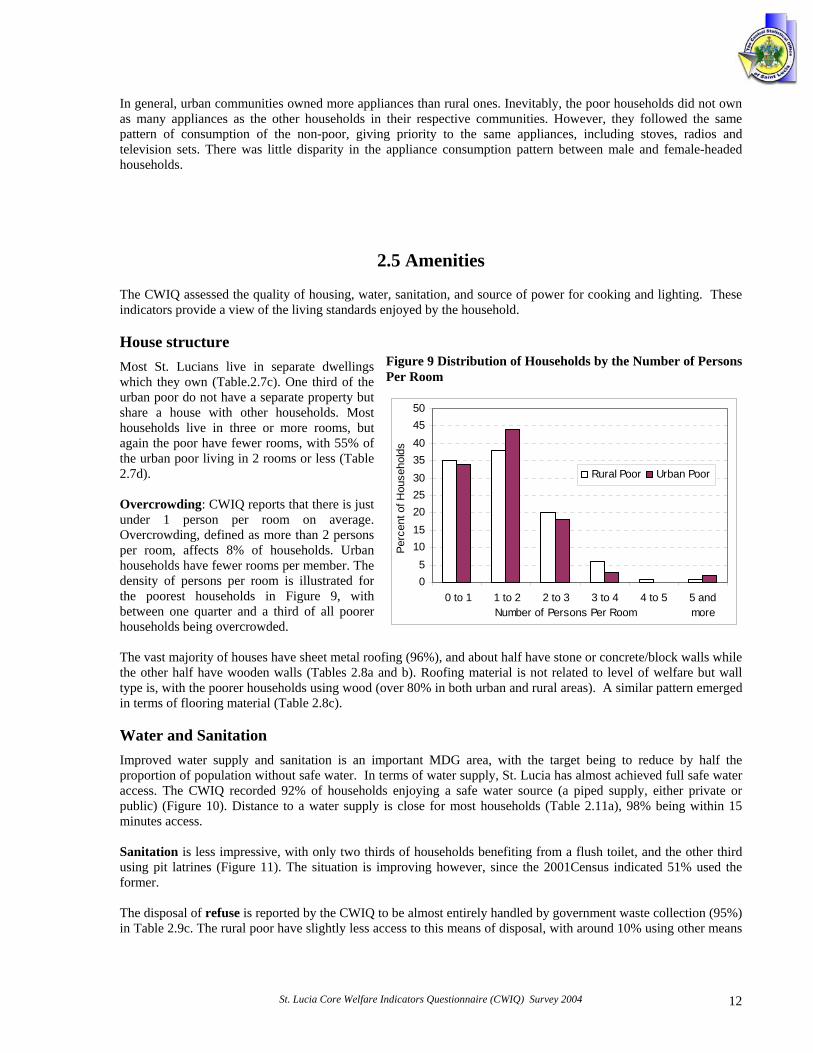
The CWIQ assessed the quality of housing, water, sanitation, and source of power for cooking and lighting. These indicators provide a view of the living standards enjoyed by the household. House structure
Figure 9 Distribution of Households by the Number of Persons Per Room
Most St. Lucians live in separate dwellings which they own (Table.2.7c). One third of the urban poor do not have a separate property but share a house with other households. Most households live in three or more rooms, but again the poor have fewer rooms, with 55% of the urban poor living in 2 rooms or less (Table 2.7d).
05
101520253035404550
0 to 1 1 to 2 2 to 3 3 to 4 4 to 5 5 andmoreNumber of Persons Per Room
Perc
ent o
f Hou
seho
lds
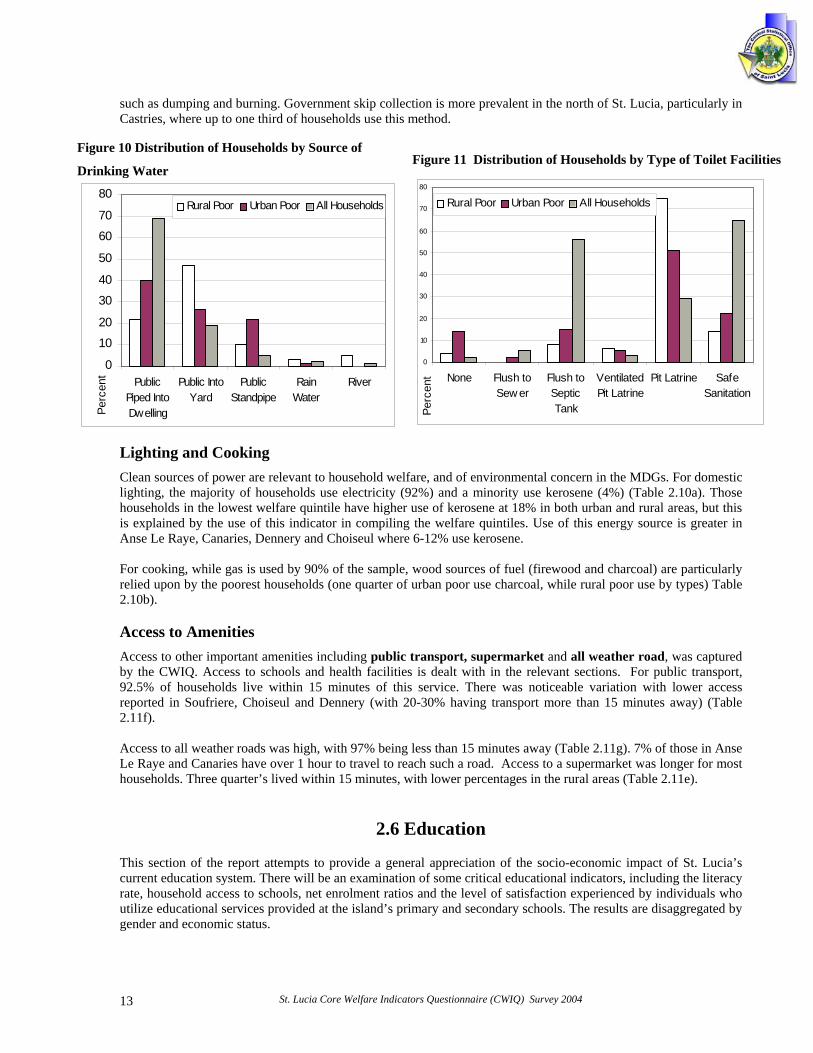
Rural Poor Urban Poor Overcrowding: CWIQ reports that there is just under 1 person per room on average. Overcrowding, defined as more than 2 persons per room, affects 8% of households. Urban households have fewer rooms per member. The density of persons per room is illustrated for the poorest households in Figure 9, with between one quarter and a third of all poorer households being overcrowded. The vast majority of houses have sheet metal roofing (96%), and about half have stone or concrete/block walls while the other half have wooden walls (Tables 2.8a and b). Roofing material is not related to level of welfare but wall type is, with the poorer households using wood (over 80% in both urban and rural areas). A similar pattern emerged in terms of flooring material (Table 2.8c). Water and Sanitation Improved water supply and sanitation is an important MDG area, with the target being to reduce by half the proportion of population without safe water. In terms of water supply, St. Lucia has almost achieved full safe water access. The CWIQ recorded 92% of households enjoying a safe water source (a piped supply, either private or public) (Figure 10). Distance to a water supply is close for most households (Table 2.11a), 98% being within 15 minutes access. Sanitation is less impressive, with only two thirds of households benefiting from a flush toilet, and the other third using pit latrines (Figure 11). The situation is improving however, since the 2001Census indicated 51% used the former. The disposal of refuse is reported by the CWIQ to be almost entirely handled by government waste collection (95%) in Table 2.9c. The rural poor have slightly less access to this means of disposal, with around 10% using other means
St. Lucia Core Welfare Indicators Questionnaire (CWIQ) Survey 2004 12
such as dumping and burning. Government skip collection is more prevalent in the north of St. Lucia, particularly in Castries, where up to one third of households use this method.
Figure 10 Distribution of Households by Source of
Drinking Water
0
10
20
30
40
50
60
70
80
PublicPiped IntoDwelling
Public IntoYard
PublicStandpipe
RainWater
River
Perc
ent
Rural Poor Urban Poor All Households
Figure 11 Distribution of Households by Type of Toilet Facilities
0
10
20
30
40
50
60
70
80
None Flush toSew er
Flush toSepticTank
VentilatedPit Latrine
Pit Latrine SafeSanitation
Perc
ent
Rural Poor Urban Poor All Households
Lighting and Cooking Clean sources of power are relevant to household welfare, and of environmental concern in the MDGs. For domestic lighting, the majority of households use electricity (92%) and a minority use kerosene (4%) (Table 2.10a). Those households in the lowest welfare quintile have higher use of kerosene at 18% in both urban and rural areas, but this is explained by the use of this indicator in compiling the welfare quintiles. Use of this energy source is greater in Anse Le Raye, Canaries, Dennery and Choiseul where 6-12% use kerosene. For cooking, while gas is used by 90% of the sample, wood sources of fuel (firewood and charcoal) are particularly relied upon by the poorest households (one quarter of urban poor use charcoal, while rural poor use by types) Table 2.10b). Access to Amenities Access to other important amenities including public transport, supermarket and all weather road, was captured by the CWIQ. Access to schools and health facilities is dealt with in the relevant sections. For public transport, 92.5% of households live within 15 minutes of this service. There was noticeable variation with lower access reported in Soufriere, Choiseul and Dennery (with 20-30% having transport more than 15 minutes away) (Table 2.11f). Access to all weather roads was high, with 97% being less than 15 minutes away (Table 2.11g). 7% of those in Anse Le Raye and Canaries have over 1 hour to travel to reach such a road. Access to a supermarket was longer for most households. Three quarter’s lived within 15 minutes, with lower percentages in the rural areas (Table 2.11e).
2.6 Education
This section of the report attempts to provide a general appreciation of the socio-economic impact of St. Lucia’s current education system. There will be an examination of some critical educational indicators, including the literacy rate, household access to schools, net enrolment ratios and the level of satisfaction experienced by individuals who utilize educational services provided at the island’s primary and secondary schools. The results are disaggregated by gender and economic status.
St. Lucia Core Welfare Indicators Questionnaire (CWIQ) Survey 2004 13
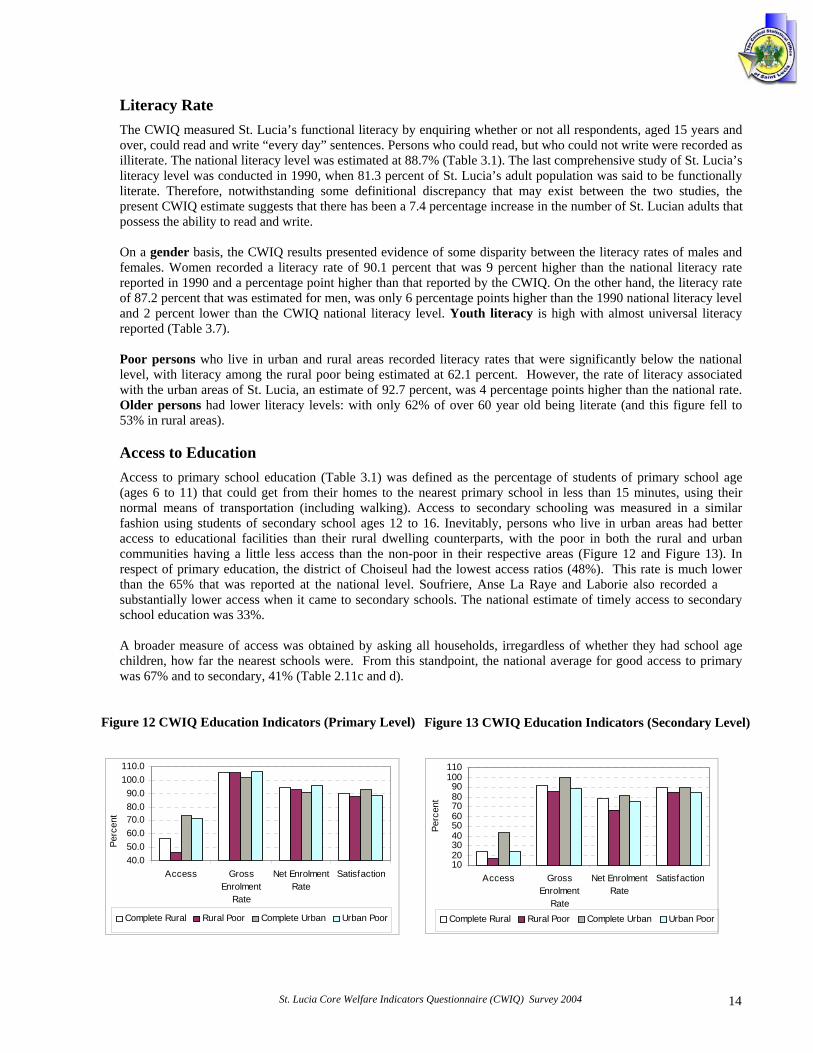
Literacy Rate The CWIQ measured St. Lucia’s functional literacy by enquiring whether or not all respondents, aged 15 years and over, could read and write “every day” sentences. Persons who could read, but who could not write were recorded as illiterate. The national literacy level was estimated at 88.7% (Table 3.1). The last comprehensive study of St. Lucia’s literacy level was conducted in 1990, when 81.3 percent of St. Lucia’s adult population was said to be functionally literate. Therefore, notwithstanding some definitional discrepancy that may exist between the two studies, the present CWIQ estimate suggests that there has been a 7.4 percentage increase in the number of St. Lucian adults that possess the ability to read and write. On a gender basis, the CWIQ results presented evidence of some disparity between the literacy rates of males and females. Women recorded a literacy rate of 90.1 percent that was 9 percent higher than the national literacy rate reported in 1990 and a percentage point higher than that reported by the CWIQ. On the other hand, the literacy rate of 87.2 percent that was estimated for men, was only 6 percentage points higher than the 1990 national literacy level and 2 percent lower than the CWIQ national literacy level. Youth literacy is high with almost universal literacy reported (Table 3.7). Poor persons who live in urban and rural areas recorded literacy rates that were significantly below the national level, with literacy among the rural poor being estimated at 62.1 percent. However, the rate of literacy associated with the urban areas of St. Lucia, an estimate of 92.7 percent, was 4 percentage points higher than the national rate. Older persons had lower literacy levels: with only 62% of over 60 year old being literate (and this figure fell to 53% in rural areas). Access to Education Access to primary school education (Table 3.1) was defined as the percentage of students of primary school age (ages 6 to 11) that could get from their homes to the nearest primary school in less than 15 minutes, using their normal means of transportation (including walking). Access to secondary schooling was measured in a similar fashion using students of secondary school ages 12 to 16. Inevitably, persons who live in urban areas had better access to educational facilities than their rural dwelling counterparts, with the poor in both the rural and urban communities having a little less access than the non-poor in their respective areas (Figure 12 and Figure 13). In respect of primary education, the district of Choiseul had the lowest access ratios (48%). This rate is much lower than the 65% that was reported at the national level. Soufriere, Anse La Raye and Laborie also recorded a substantially lower access when it came to secondary schools. The national estimate of timely access to secondary school education was 33%. A broader measure of access was obtained by asking all households, irregardless of whether they had school age children, how far the nearest schools were. From this standpoint, the national average for good access to primary was 67% and to secondary, 41% (Table 2.11c and d).
Figure 12 CWIQ Education Indicators (Primary Level) Figure 13 CWIQ Education Indicators (Secondary Level)
40.050.060.070.080.090.0
100.0110.0
Access GrossEnrolment
Rate
Net EnrolmentRate
Satisfaction
Perc
ent
Complete Rural Rural Poor Complete Urban Urban Poor
102030405060708090
100110
Access GrossEnrolment
Rate
Net EnrolmentRate
Satisfaction
Perc
ent
Complete Rural Rural Poor Complete Urban Urban Poor
St. Lucia Core Welfare Indicators Questionnaire (CWIQ) Survey 2004 14
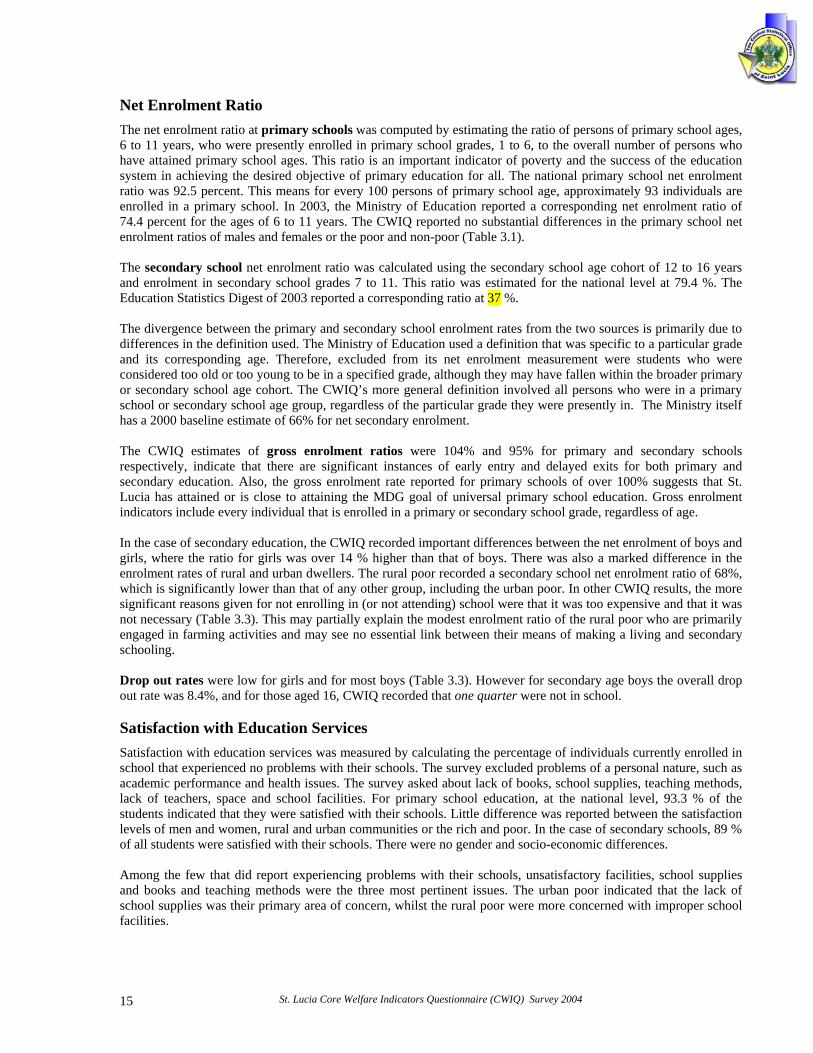
Net Enrolment Ratio The net enrolment ratio at primary schools was computed by estimating the ratio of persons of primary school ages, 6 to 11 years, who were presently enrolled in primary school grades, 1 to 6, to the overall number of persons who have attained primary school ages. This ratio is an important indicator of poverty and the success of the education system in achieving the desired objective of primary education for all. The national primary school net enrolment ratio was 92.5 percent. This means for every 100 persons of primary school age, approximately 93 individuals are enrolled in a primary school. In 2003, the Ministry of Education reported a corresponding net enrolment ratio of 74.4 percent for the ages of 6 to 11 years. The CWIQ reported no substantial differences in the primary school net enrolment ratios of males and females or the poor and non-poor (Table 3.1). The secondary school net enrolment ratio was calculated using the secondary school age cohort of 12 to 16 years and enrolment in secondary school grades 7 to 11. This ratio was estimated for the national level at 79.4 %. The Education Statistics Digest of 2003 reported a corresponding ratio at 37 %. The divergence between the primary and secondary school enrolment rates from the two sources is primarily due to differences in the definition used. The Ministry of Education used a definition that was specific to a particular grade and its corresponding age. Therefore, excluded from its net enrolment measurement were students who were considered too old or too young to be in a specified grade, although they may have fallen within the broader primary or secondary school age cohort. The CWIQ’s more general definition involved all persons who were in a primary school or secondary school age group, regardless of the particular grade they were presently in. The Ministry itself has a 2000 baseline estimate of 66% for net secondary enrolment. The CWIQ estimates of gross enrolment ratios were 104% and 95% for primary and secondary schools respectively, indicate that there are significant instances of early entry and delayed exits for both primary and secondary education. Also, the gross enrolment rate reported for primary schools of over 100% suggests that St. Lucia has attained or is close to attaining the MDG goal of universal primary school education. Gross enrolment indicators include every individual that is enrolled in a primary or secondary school grade, regardless of age. In the case of secondary education, the CWIQ recorded important differences between the net enrolment of boys and girls, where the ratio for girls was over 14 % higher than that of boys. There was also a marked difference in the enrolment rates of rural and urban dwellers. The rural poor recorded a secondary school net enrolment ratio of 68%, which is significantly lower than that of any other group, including the urban poor. In other CWIQ results, the more significant reasons given for not enrolling in (or not attending) school were that it was too expensive and that it was not necessary (Table 3.3). This may partially explain the modest enrolment ratio of the rural poor who are primarily engaged in farming activities and may see no essential link between their means of making a living and secondary schooling. Drop out rates were low for girls and for most boys (Table 3.3). However for secondary age boys the overall drop out rate was 8.4%, and for those aged 16, CWIQ recorded that one quarter were not in school. Satisfaction with Education Services Satisfaction with education services was measured by calculating the percentage of individuals currently enrolled in school that experienced no problems with their schools. The survey excluded problems of a personal nature, such as academic performance and health issues. The survey asked about lack of books, school supplies, teaching methods, lack of teachers, space and school facilities. For primary school education, at the national level, 93.3 % of the students indicated that they were satisfied with their schools. Little difference was reported between the satisfaction levels of men and women, rural and urban communities or the rich and poor. In the case of secondary schools, 89 % of all students were satisfied with their schools. There were no gender and socio-economic differences. Among the few that did report experiencing problems with their schools, unsatisfactory facilities, school supplies and books and teaching methods were the three most pertinent issues. The urban poor indicated that the lack of school supplies was their primary area of concern, whilst the rural poor were more concerned with improper school facilities.
St. Lucia Core Welfare Indicators Questionnaire (CWIQ) Survey 2004 15
2.7 Health and Child Care
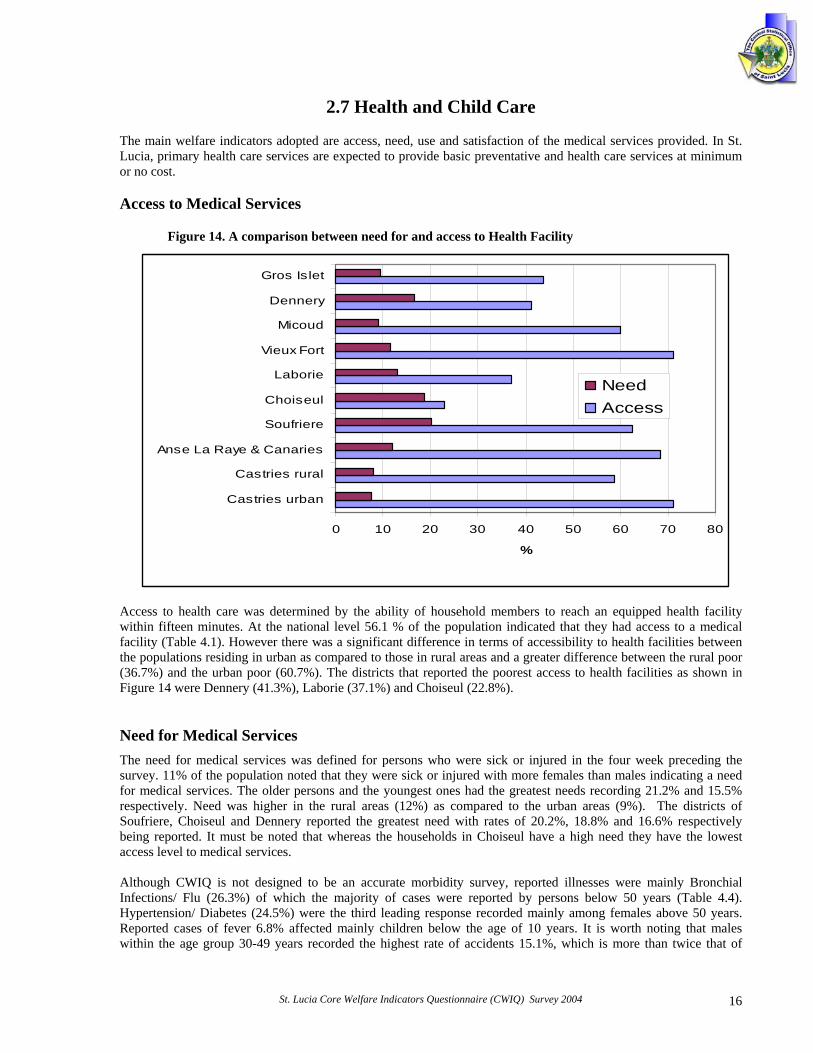
The main welfare indicators adopted are access, need, use and satisfaction of the medical services provided. In St. Lucia, primary health care services are expected to provide basic preventative and health care services at minimum or no cost. Access to Medical Services
Figure 14. A comparison between need for and access to Health Facility
0 10 20 30 40 50 60 70 80
Castries urban
Castries rural
Anse La Raye & Canaries
Soufriere
Choiseul
Laborie
Vieux Fort
Micoud
Dennery
Gros Islet
%
NeedAccess
Access to health care was determined by the ability of household members to reach an equipped health facility within fifteen minutes. At the national level 56.1 % of the population indicated that they had access to a medical facility (Table 4.1). However there was a significant difference in terms of accessibility to health facilities between the populations residing in urban as compared to those in rural areas and a greater difference between the rural poor (36.7%) and the urban poor (60.7%). The districts that reported the poorest access to health facilities as shown in Figure 14 were Dennery (41.3%), Laborie (37.1%) and Choiseul (22.8%). Need for Medical Services The need for medical services was defined for persons who were sick or injured in the four week preceding the survey. 11% of the population noted that they were sick or injured with more females than males indicating a need for medical services. The older persons and the youngest ones had the greatest needs recording 21.2% and 15.5% respectively. Need was higher in the rural areas (12%) as compared to the urban areas (9%). The districts of Soufriere, Choiseul and Dennery reported the greatest need with rates of 20.2%, 18.8% and 16.6% respectively being reported. It must be noted that whereas the households in Choiseul have a high need they have the lowest access level to medical services. Although CWIQ is not designed to be an accurate morbidity survey, reported illnesses were mainly Bronchial Infections/ Flu (26.3%) of which the majority of cases were reported by persons below 50 years (Table 4.4). Hypertension/ Diabetes (24.5%) were the third leading response recorded mainly among females above 50 years. Reported cases of fever 6.8% affected mainly children below the age of 10 years. It is worth noting that males within the age group 30-49 years recorded the highest rate of accidents 15.1%, which is more than twice that of
St. Lucia Core Welfare Indicators Questionnaire (CWIQ) Survey 2004 16

female (6.4%) for the same age group. This can be compared to information from the Chief Medical Officer’s Report which revealed that during the period 1998- 2002, 68% of all deaths by accidents were among males below 45 years of age of which 35% was within the 25-44 age group. The report also stated that Diabetes Mellitus ranked number one amongst the top ten causes of death for the years 2000, 2001 and 2002. Use of Medical Services In the survey, use was defined for persons who consulted a health provider in the four weeks preceding the survey. At the national level, 15% of the population consulted a health provider. The poor both in the rural and urban areas reported greater use of the facilities than the non poor in the reference period. Analysis by socio-economic group revealed that the unemployed recorded the greatest use (20.2 %). When comparing need and use a similar trend emerged, children below the age of ten (31.3%) and adults sixty years and above (29.7%) reported the greatest use of the facility. The leading health provider was the public hospital with 37.5% of the population reporting using it (Table 4.5). However 69% of the population of Anse La Raye/ Canaries and 54% of those in Choiseul reported using the health centres for their main health needs. Three-quarters of the persons who used the hospital did so as a result of accidental injury. Satisfaction with Medical Services Satisfaction was defined for persons who consulted a health provider during the four week period and who had no problems with the service. Generally there was a high level of satisfaction (80%) among users of health services with slight variation by gender (Table 4.1). The highest level of satisfaction was recorded in the districts of Micoud (94.3%),Vieux Fort (93.8%) and Castries urban (91.5%). The lowest level of satisfaction was reported by the district of Dennery (56.9%) and Soufriere (64.5%). The unemployed reported the highest level of satisfaction (84.2%.) Dissatisfaction with Medical Services Out of the small percentage of the population that expressed dissatisfaction with the service, the majority cited long wait (54.0%) and cost (43.6%) as their major dissatisfactions as shown in Table 4.2 and Figure 15. The longer waiting periods were recorded by persons in the districts of Micoud, Choiseul and Soufriere. The Anse La Raye/Canaries populations were mainly dissatisfied with lack of trained professionals.
Figure 15 Percentage of Persons who were Dissatisfied with the services received
From the Health Providers
Facilities not cleanLong waitNo trained professionals CostNo drugs availableTreatment unsuccessful Other
Reproductive Health Care and Child Delivery Pre- natal care is one of the primary health care services available to all females of childbearing age. 96% of all the women who had a live birth during the year preceding the survey reported that they had pre-natal care (Table 4.6). The survey also revealed that most births were of females within the age group of 25-29years and to a lesser extent
St. Lucia Core Welfare Indicators Questionnaire (CWIQ) Survey 2004 17
20-24 years. It is worth noting that whereas teenage pregnancy at the national level was 3% of all live births in the past year, the urban poor recorded a rate three times higher. Reported cases of delivery at a hospital showed no discrimination between rural and urban and those who are poor (Table 4.7). Overall 97% of the females reported that their delivery took place at a hospital in the past five years. The districts of Anse La Raye /Canaries recorded the largest percentage of the females (6.2%) using the health centre for delivery. This may be one of the reasons why some of the population may be dissatisfied with the inadequacy of trained professionals. Generally nurses/midwives are responsible for delivery of the majority of the nations ‘babies. (Table 4.8) 82% of deliveries done in the past five years were assisted by nurses/midwives. The two districts where a notable percentage of deliveries were done by other individual were Dennery (4%) and Rural Castries (3%). Child Vaccination Most children under the age of five (95%) participated in the first two development assessments programmes at 6 weeks and 3 months (Table 5.1). Vaccination rates were over 71% for DPT, BCG and Polio 1,2 and 3 (Table 5.2). The vaccination rates may be higher since some respondents were unable to verify the vaccines received due to the unavailability of some health cards. In summary, St. Lucia’s Health performance through the CWIQ is in line with the MDG target for vaccinations
2.8 Employment
Economically Active Population Work status was examined in relation to the adult population age 15 and above. Table 6.1 shows that three quarter’s of St.Lucia’s adult population is currently economically active (as compared to 67% in the 2004 Labour Force Survey). The highest level of the economically active population lies within the age range 30-49 years for both sexes and the lowest in the over 65 years age group. Economically Inactive Population The economically inactive constituted one third of the adult population (33.3%) (Table 6.1). Persons of old age were one third of this group, followed by students currently in school (22%) and persons attending to household family duties (16%) (Table 6.12). There was a significant gender difference with a 25.9% inactive level for males yet a 40% level for females (Table 6.1). Employment Status The two main employment status categories were paid employees (65.7%) and self-employed (29.1%) (Table 6.2). Above one half of paid employees live in rural areas as oppose to three-quarters in urban. In relation to self-employed, one third of those lived in rural areas as oppose to one-quarter in the urban, reflecting the agricultural work force.
The employment distribution level for paid employee in females is higher than that of males (70.4% and 62.1% respectively). Conversely the employment distribution level for self-employed males is higher than that of females (32.5% and 24.6% respectively). Employers About one half of the working population in St Lucia (47%) were engaged in private business, 28% were self-employed and the government employed 14.2% (Table 6.3). Fifty percent of the persons employed in private business live in urban areas as opposed to a little above a third in the rural.
St. Lucia Core Welfare Indicators Questionnaire (CWIQ) Survey 2004 18
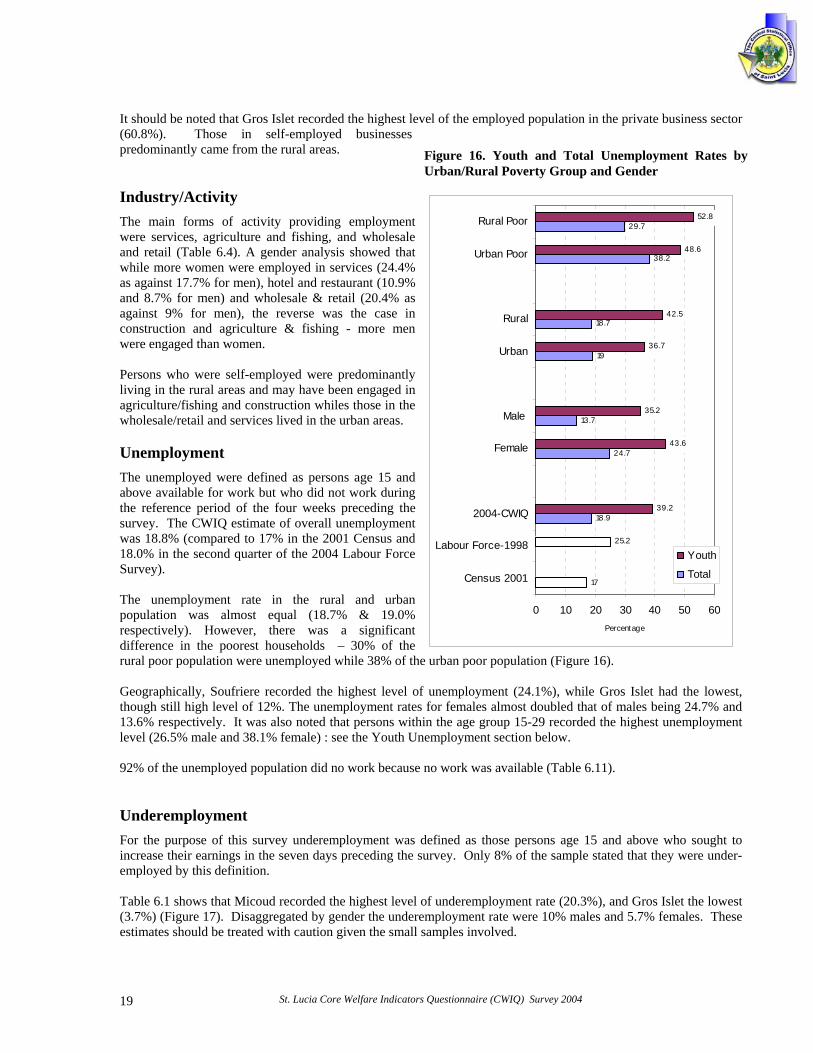
It should be noted that Gros Islet recorded the highest level of the employed population in the private business sector (60.8%). Those in self-employed businesses predominantly came from the rural areas. Figure 16. Youth and Total Unemployment Rates by
Urban/Rural Poverty Group and Gender Industry/Activity
17
18.9
24.7
13.7
19
18.7
38.2
29.7
25.2
39.2
43.6
35.2
36.7
42.5
48.6
52.8
0 10 20 30 40 50 60
Census 2001
Labour Force-1998
2004-CWIQ
Female
Male
Urban
Rural
Urban Poor
Rural Poor
Percentage
Youth
Total
The main forms of activity providing employment were services, agriculture and fishing, and wholesale and retail (Table 6.4). A gender analysis showed that while more women were employed in services (24.4% as against 17.7% for men), hotel and restaurant (10.9% and 8.7% for men) and wholesale & retail (20.4% as against 9% for men), the reverse was the case in construction and agriculture & fishing - more men were engaged than women. Persons who were self-employed were predominantly living in the rural areas and may have been engaged in agriculture/fishing and construction whiles those in the wholesale/retail and services lived in the urban areas. Unemployment The unemployed were defined as persons age 15 and above available for work but who did not work during the reference period of the four weeks preceding the survey. The CWIQ estimate of overall unemployment was 18.8% (compared to 17% in the 2001 Census and 18.0% in the second quarter of the 2004 Labour Force Survey). The unemployment rate in the rural and urban population was almost equal (18.7% & 19.0% respectively). However, there was a significant difference in the poorest households – 30% of the rural poor population were unemployed while 38% of the urban poor population (Figure 16). Geographically, Soufriere recorded the highest level of unemployment (24.1%), while Gros Islet had the lowest, though still high level of 12%. The unemployment rates for females almost doubled that of males being 24.7% and 13.6% respectively. It was also noted that persons within the age group 15-29 recorded the highest unemployment level (26.5% male and 38.1% female) : see the Youth Unemployment section below. 92% of the unemployed population did no work because no work was available (Table 6.11). Underemployment For the purpose of this survey underemployment was defined as those persons age 15 and above who sought to increase their earnings in the seven days preceding the survey. Only 8% of the sample stated that they were under-employed by this definition. Table 6.1 shows that Micoud recorded the highest level of underemployment rate (20.3%), and Gros Islet the lowest (3.7%) (Figure 17). Disaggregated by gender the underemployment rate were 10% males and 5.7% females. These estimates should be treated with caution given the small samples involved.
St. Lucia Core Welfare Indicators Questionnaire (CWIQ) Survey 2004 19
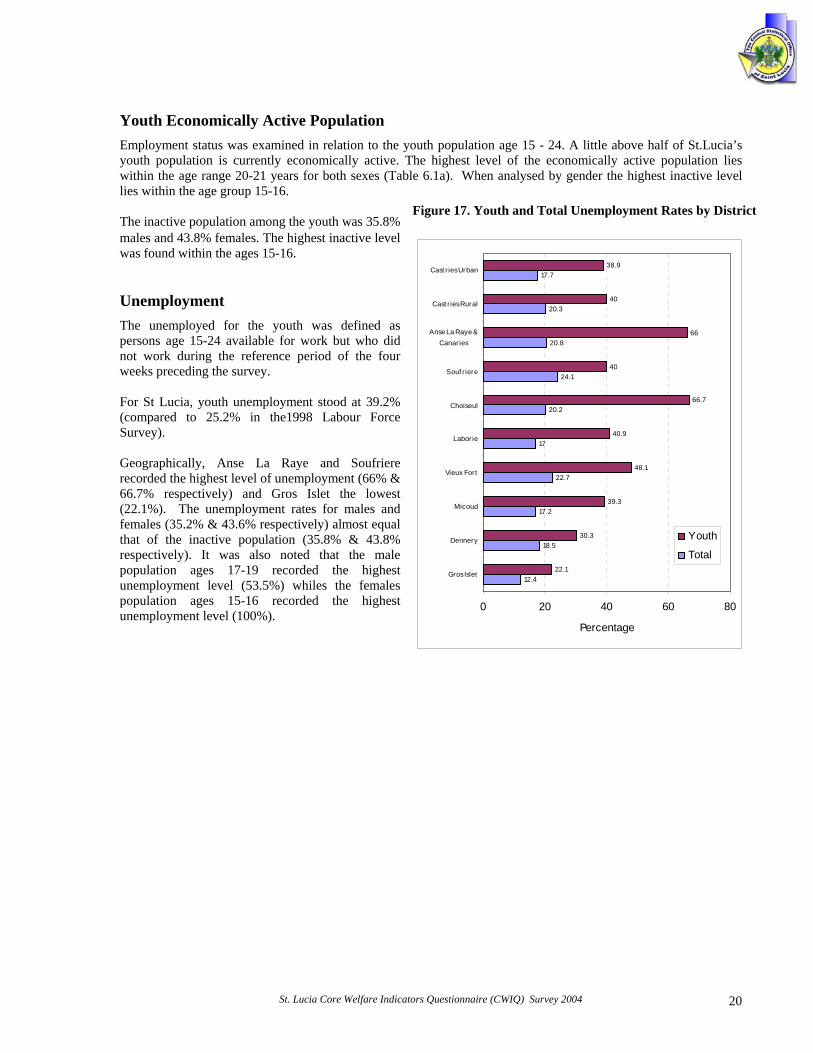
Youth Economically Active Population Employment status was examined in relation to the youth population age 15 - 24. A little above half of St.Lucia’s youth population is currently economically active. The highest level of the economically active population lies within the age range 20-21 years for both sexes (Table 6.1a). When analysed by gender the highest inactive level lies within the age group 15-16. Figure 17. Youth and Total Unemployment Rates by District The inactive population among the youth was 35.8% males and 43.8% females. The highest inactive level was found within the ages 15-16.
12.4
18.5
17.2
22.7
17
20.2
24.1
20.8
20.3
17.7
22.1
30.3
39.3
48.1
40.9
66.7
40
66
40
38.9
0 20 40 60 8
Gros Islet
Dennery
Micoud
Vieux Fort
Labor ie
Choiseul
Souf r iere
Anse La Raye &Canar ies
Cast r ies Rural
Cast r ies Urban
Percentage
0
Youth
Total
Unemployment The unemployed for the youth was defined as persons age 15-24 available for work but who did not work during the reference period of the four weeks preceding the survey. For St Lucia, youth unemployment stood at 39.2% (compared to 25.2% in the1998 Labour Force Survey). Geographically, Anse La Raye and Soufriere recorded the highest level of unemployment (66% & 66.7% respectively) and Gros Islet the lowest (22.1%). The unemployment rates for males and females (35.2% & 43.6% respectively) almost equal that of the inactive population (35.8% & 43.8% respectively). It was also noted that the male population ages 17-19 recorded the highest unemployment level (53.5%) whiles the females population ages 15-16 recorded the highest unemployment level (100%).
St. Lucia Core Welfare Indicators Questionnaire (CWIQ) Survey 2004 20
3. CONCLUSIONS The CWIQ Pilot for Eastern Caribbean has been successfully undertaken in St Lucia. The objective of the exercise was to adapt and test the survey in the Caribbean region to see if it could offer a potentially useful tool for poverty monitoring and tracking of St Lucia’s Poverty Reduction Strategy. A national sample survey of 1306 households has been undertaken and the results processed and published within 7 weeks. A set of core welfare indicators are released in this main report, while over 70 detailed tables on household and population characteristics are available in a separate volume. Many of the indicators reported match those required under the MDG goals. Where possible, sample estimates obtained last month are compared with previous estimates, principally the 2001 Census. In general, there is a discernible trend between the two surveys, and many indicators show improvements for the better, especially in housing, water, health and education. In contrast, some employment estimates are showing a declining trend. What is the role of CWIQ in the future ? Currently, St. Lucia’s Interim PRS Action Plan is awaiting further formulation in 2005 to reach a full PRSP. Nevertheless, it is evident that St Lucia, in common with its OECS neighbours, must increase efforts and deploy resources to improve the coverage and frequency of its monitoring if it is to adequately follow the achievement of its poverty reduction targets. Based upon an analysis of MDG goals and indicators, as adapted by ECLAC to the region, a range of instruments and internal reporting systems will be required to meet the monitoring needs. These include routine service delivery data, income and expenditure surveys, surveys of welfare and assets, access, use and satisfaction services. 1. Routine data systems can provide a number of the measures in the areas of education, gender equality, child mortality, maternal health, disease surveillance and control. In St Lucia, these are being collated within ministries such as Health, Education, Finance and Social Transformation. 2. Surveys of Living Conditions are needed to capture the economic aspects of poverty, such as poverty gap. These are the focus of the mini-MECOVI project, which is strengthening OECS members in order to equip them to conduct SLCs in 2005. SLCs have tended to be relatively expensive exercises, especially where repeat visits are required to collect accurate expenditure data. 3. The CWIQ can offer a complementary tool as a less demanding, more rapid and cheaper solution to capturing measures of access, use and satisfaction to services as well independent measures of household and population welfare as estimated in terms of assets, amenities, education, health. CWIQ has been extended in various countries with the use of various additional modules to capture other locally relevant information. Thus, the CWIQ child measurement module can be included if levels of malnutrition have to be estimated. A CWIQ income and expenditure module has been developed for use during a single visit interview. Indicative expenditures show that the pilot CWIQ in St. Lucia cost around EC$57 per questionnaire4. This is in line with other CWIQ surveys. At less than 30 minutes per interview, a nationally representative sample can be completed in 2 weeks, and a larger sample to provide reliable sub-national estimates in 3 weeks (between 1500-2000 interviews).
4 Including local costs for training, field allowances, stationery, data processing.
St. Lucia Core Welfare Indicators Questionnaire (CWIQ) Survey 2004 21
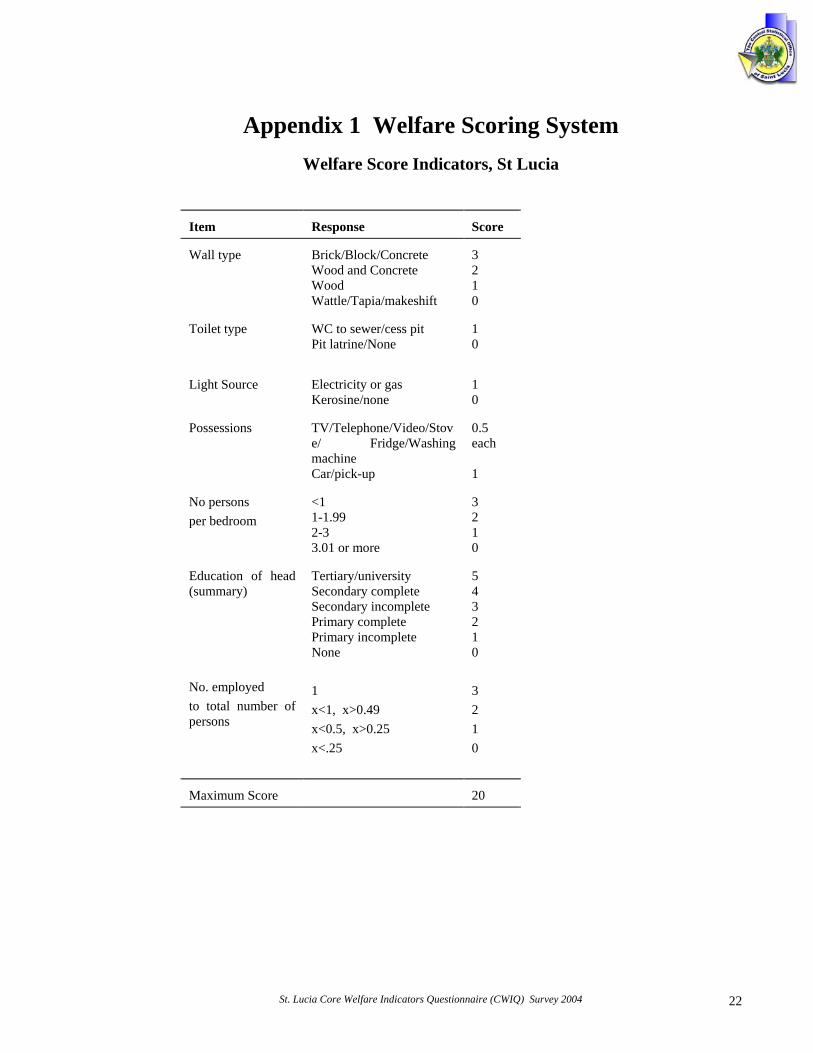
Appendix 1 Welfare Scoring System
Welfare Score Indicators, St Lucia
Item
Response Score
Wall type
Brick/Block/Concrete Wood and Concrete Wood Wattle/Tapia/makeshift
3 2 1 0
Toilet type
WC to sewer/cess pit Pit latrine/None
1 0
Light Source Electricity or gas
Kerosine/none 1 0
Possessions
TV/Telephone/Video/Stove/ Fridge/Washing machine Car/pick-up
0.5 each 1
No persons per bedroom
<1 1-1.99 2-3 3.01 or more
3 2 1 0
Education of head (summary) No. employed to total number of persons
Tertiary/university Secondary complete Secondary incomplete Primary complete Primary incomplete None 1 x<1, x>0.49 x<0.5, x>0.25 x<.25
5 4 3 2 1 0 3 2 1 0
Maximum Score
20
St. Lucia Core Welfare Indicators Questionnaire (CWIQ) Survey 2004 22


![Too.wonå Hi] End West End Taringa StžLÒèia …...Title Queensland Statistical Areas, Level 2 (SA2), 2016 - St Lucia Author Queensland Government Statistician's Office, Queensland](https://img.pdfslide.net/doc/110x75/5f05311f7e708231d411bbb7/toowon-hi-end-west-end-taringa-stlia-title-queensland-statistical.jpg)