Embed Size (px)
Citation preview
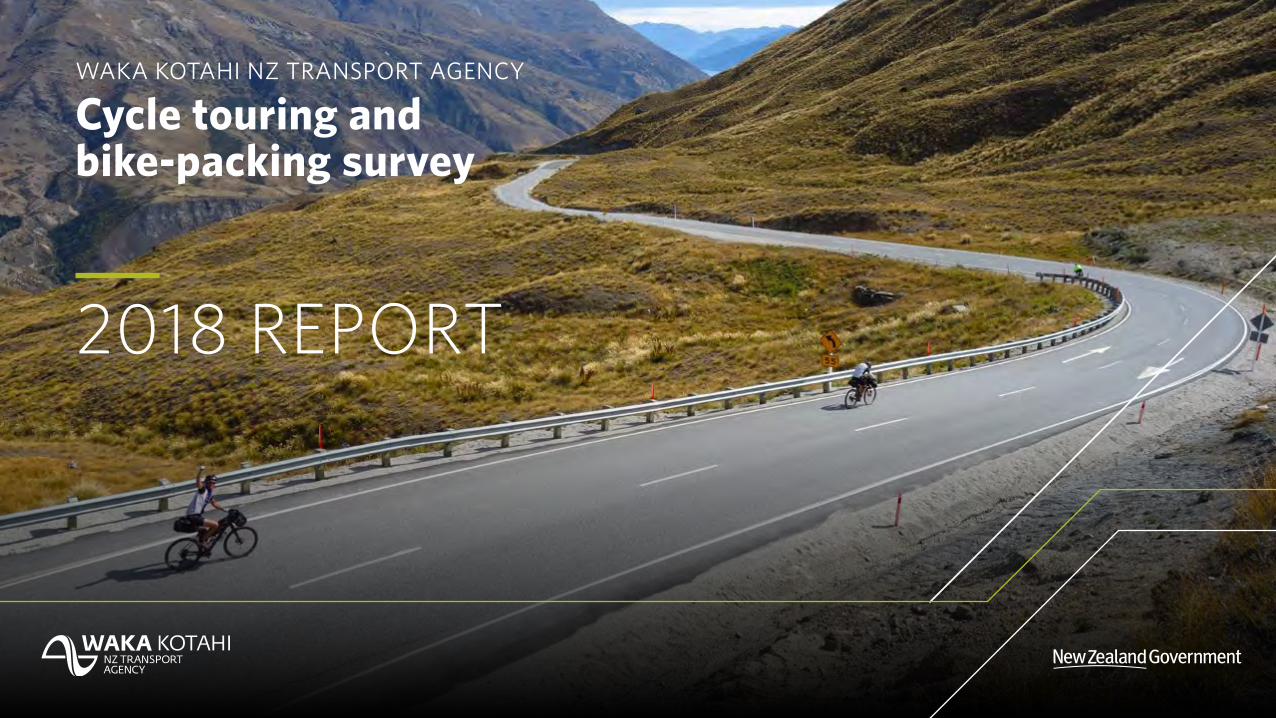
WAKA KOTAHI NZ TRANSPORT AGENCY
Cycle touring and bike-packing survey
2018 REPORT
2
PURPOSE
Waka Kotahi NZ Transport Agency sought to understand and quantify the experiences of people cycling touring/bike-packing on New Zealand’s roads.
This information is intended to target and build the case for improvements to the road network to improve experiences for people exploring New Zealand by bike.
Waka Kotahi NZ Transport Agency cycle touring and bike-packing survey: 2018 report
ISBN 978-1-98-856155-4 (electronic)
This publication is also available on NZ Transport Agency’s website at www.nzta.govt.nz/cycletouring
Copyright ©. This copyright work is licensed under the Creative Commons Attribution 4.0 International licence. In essence, you are free to copy, distribute and adapt the work, as long as you attribute the work to the NZ Transport Agency and abide by the other licence terms. To view a copy of this licence, visit http://creativecommons.org/licenses/by/4.0/
If you have further queries, call our contact centre on 0800 699 000 or write to us:
Waka Kotahi NZ Transport AgencyPrivate Bag 6995Wellington 6141
3
CONTENTS
Background ����������������������������������������������������������������������������� 4
Methodology �������������������������������������������������������������������������� 5
How representative is the sample? ������������������������������������� 6
RESULTS
ABOUT CYCLE TOURISTS ��������������������������������������� 7
Where do cycle tourists come from? ���������������������������� 8
What is the gender split of respondents? ��������������������� 9
How old are our cycle tourists? ������������������������������������ 10
What types of bike are used? ���������������������������������������� 11
Are people bike-packers or cycle tourists? �����������������12
How long do people cycle tour for? ������������������������������13
When do people cycle tour? ����������������������������������������� 14
Where are people getting information from? ��������������15
What maps do people use? �������������������������������������������16
EXPLORING WHERE PEOPLE RODE AND THEIR EXPERIENCES ����������������������������������������������� 17
Where do cycle tourists ride? ���������������������������������������18
Analysing favourite and least favourite on-road routes ����������������������������������������������������������������20
Map of most enjoyed routes ������������������������������������������21
Favourite rides – by volume ������������������������������������������ 22
Favourite rides – by customer satisfaction ����������������� 23
Map of least enjoyed routes �����������������������������������������24
Least favourite rides – by volume ��������������������������������� 25
Least favourite rides – by customer satisfaction ��������26
Where love and hate collide ����������������������������������������� 27
Routes that split opinion �����������������������������������������������28
UNDERSTANDING PEOPLE’S EXPERIENCES ��� 29
What makes a route memorable as a good experience? �����������������������������������������������������������30
What makes a route memorable as a bad experience? ��������������������������������������������������������������31
Words commonly used to describe bad experiences �������������������������������������������������������������� 32
CRASHES AND NEAR MISSES ������������������������������33
Crashes ����������������������������������������������������������������������������34
Near misses �������������������������������������������������������������������� 35
What caused the near misses? �����������������������������������36
How do near misses align with the least favourite roads? ������������������������������������������������������������������������������ 37
RATING TOURING EXPERIENCES IN NEW ZEALAND ������������������������������������������������������� 38
How did people rate their experience? �����������������������39
Would people recommend cycling touring in NZ? ��� 40
CONCLUSIONS
BRINGING IT ALL TOGETHER ������������������������������ 41
What are people’s bad experiences telling us? ����������42
Behaviour and infrastructure ��������������������������������������� 44
Bringing it all together ���������������������������������������������������45
NEXT STEPS ������������������������������������������������������������� 46
What are we doing in response? ����������������������������������47
Work the Transport Agency is currently doing on the network �����������������������������������������������������48
4
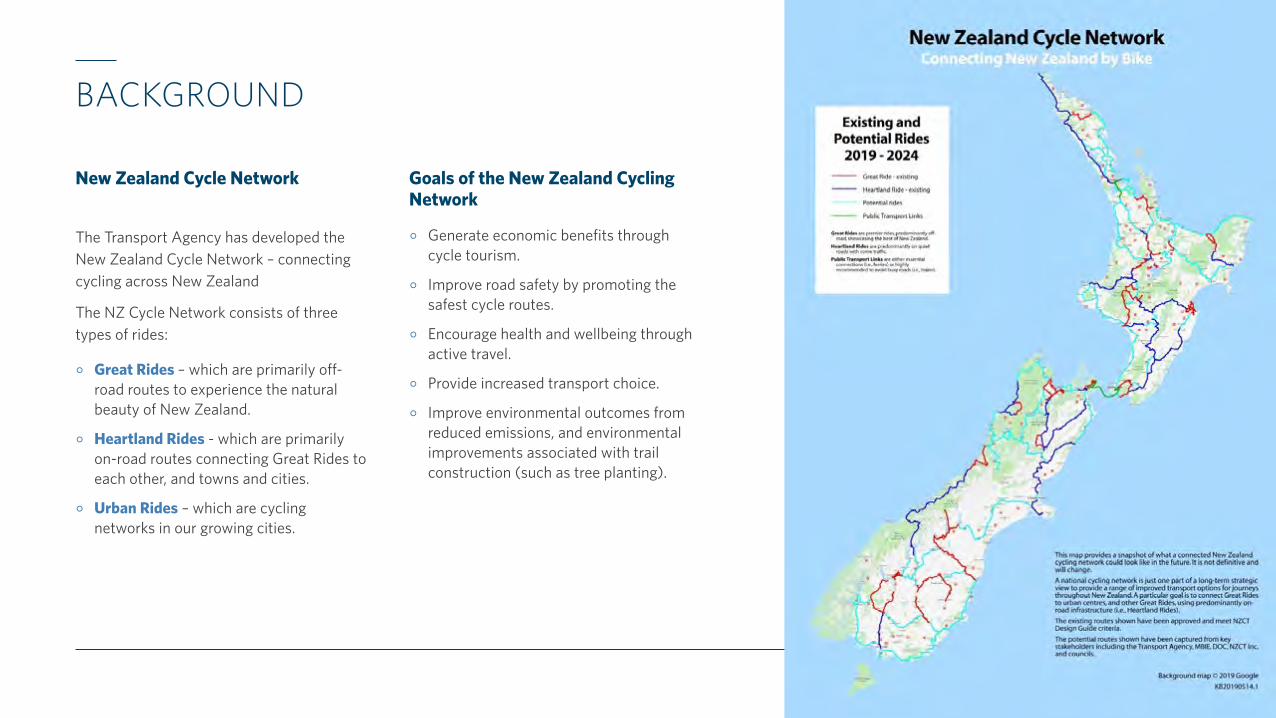
BACKGROUND
New Zealand Cycle Network
The Transport Agency has developed the New Zealand Cycle Network – connecting cycling across New Zealand
The NZ Cycle Network consists of three types of rides:
◦ Great Rides – which are primarily off-road routes to experience the natural beauty of New Zealand.
◦ Heartland Rides - which are primarily on-road routes connecting Great Rides to each other, and towns and cities.
◦ Urban Rides – which are cycling networks in our growing cities.
Goals of the New Zealand Cycling Network
◦ Generate economic benefits through cycle tourism.
◦ Improve road safety by promoting the safest cycle routes.
◦ Encourage health and wellbeing through active travel.
◦ Provide increased transport choice.
◦ Improve environmental outcomes from reduced emissions, and environmental improvements associated with trail construction (such as tree planting).
5
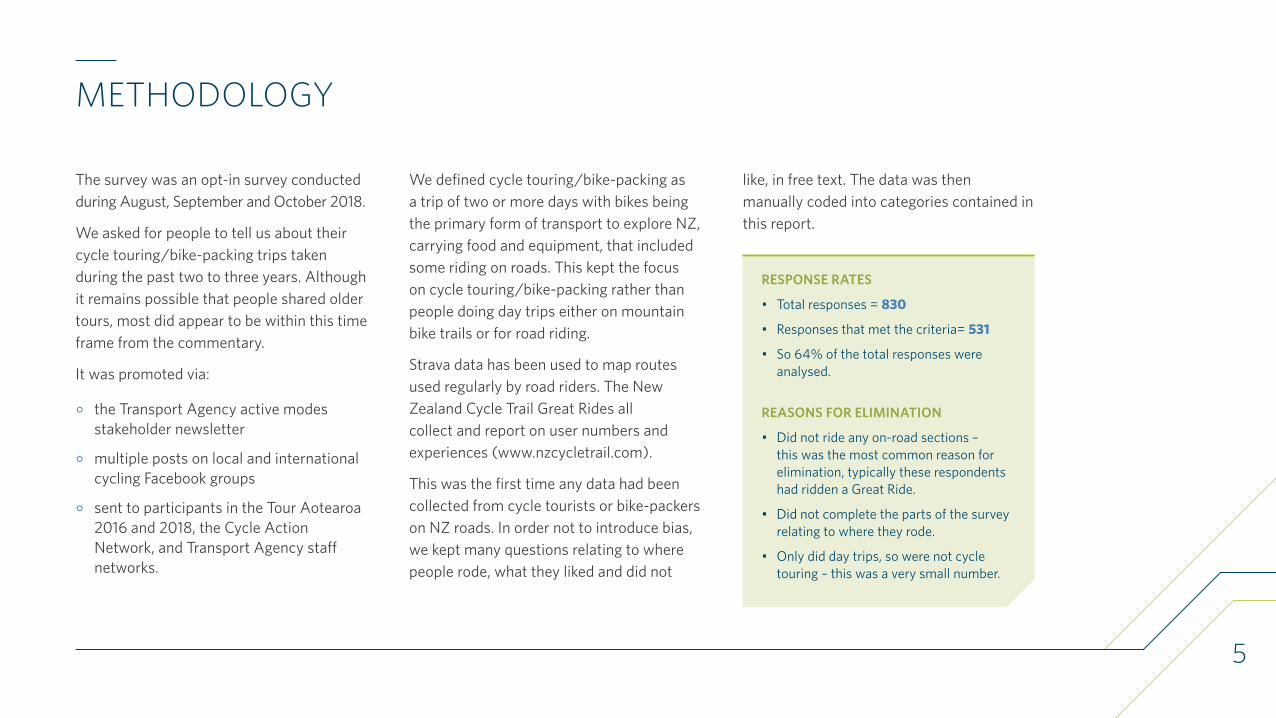
METHODOLOGY
The survey was an opt-in survey conducted during August, September and October 2018.
We asked for people to tell us about their cycle touring/bike-packing trips taken during the past two to three years. Although it remains possible that people shared older tours, most did appear to be within this time frame from the commentary.
It was promoted via:
◦ the Transport Agency active modes stakeholder newsletter
◦ multiple posts on local and international cycling Facebook groups
◦ sent to participants in the Tour Aotearoa 2016 and 2018, the Cycle Action Network, and Transport Agency staff networks.
We defined cycle touring/bike-packing as a trip of two or more days with bikes being the primary form of transport to explore NZ, carrying food and equipment, that included some riding on roads. This kept the focus on cycle touring/bike-packing rather than people doing day trips either on mountain bike trails or for road riding.
Strava data has been used to map routes used regularly by road riders. The New Zealand Cycle Trail Great Rides all collect and report on user numbers and experiences (www.nzcycletrail.com).
This was the first time any data had been collected from cycle tourists or bike-packers on NZ roads. In order not to introduce bias, we kept many questions relating to where people rode, what they liked and did not
like, in free text. The data was then manually coded into categories contained in this report.
RESPONSE RATES
• Total responses = 830
• Responses that met the criteria= 531
• So 64% of the total responses were analysed.
REASONS FOR ELIMINATION
• Did not ride any on-road sections – this was the most common reason for elimination, typically these respondents had ridden a Great Ride.
• Did not complete the parts of the survey relating to where they rode.
• Only did day trips, so were not cycle touring – this was a very small number.
6
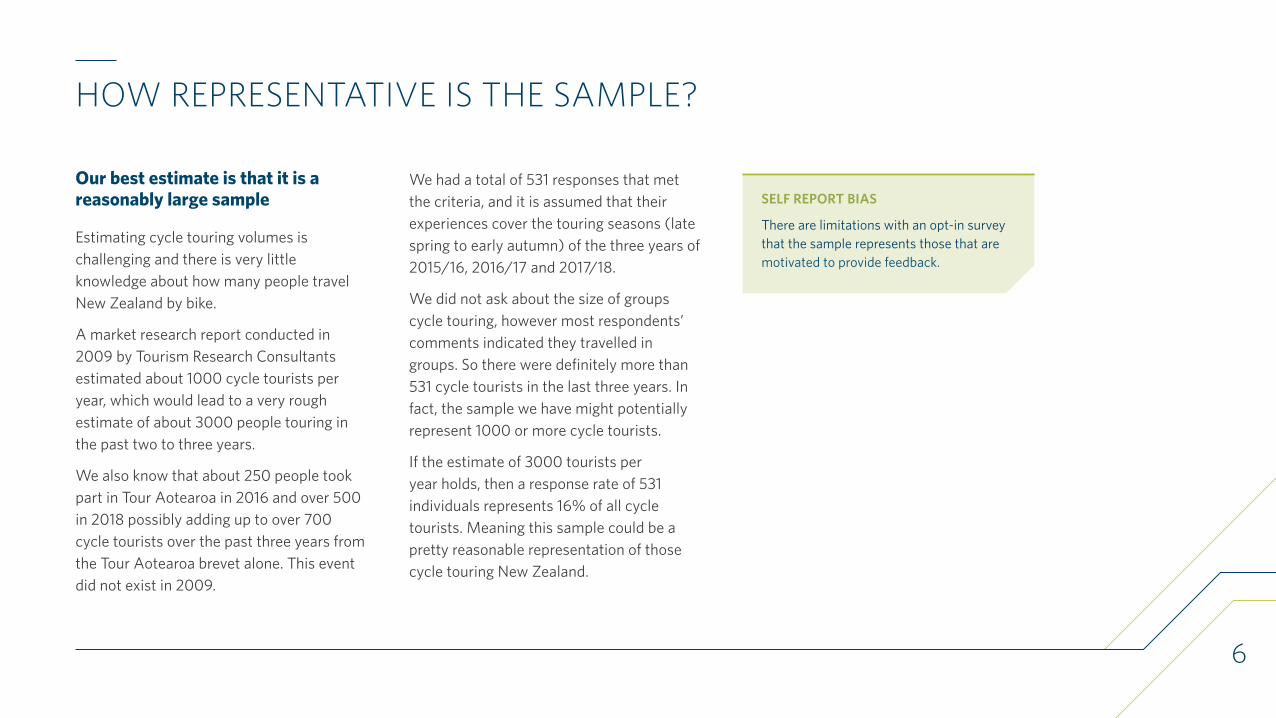
HOW REPRESENTATIVE IS THE SAMPLE?
Our best estimate is that it is a reasonably large sample
Estimating cycle touring volumes is challenging and there is very little knowledge about how many people travel New Zealand by bike.
A market research report conducted in 2009 by Tourism Research Consultants estimated about 1000 cycle tourists per year, which would lead to a very rough estimate of about 3000 people touring in the past two to three years.
We also know that about 250 people took part in Tour Aotearoa in 2016 and over 500 in 2018 possibly adding up to over 700 cycle tourists over the past three years from the Tour Aotearoa brevet alone. This event did not exist in 2009.
We had a total of 531 responses that met the criteria, and it is assumed that their experiences cover the touring seasons (late spring to early autumn) of the three years of 2015/16, 2016/17 and 2017/18.
We did not ask about the size of groups cycle touring, however most respondents’ comments indicated they travelled in groups. So there were definitely more than 531 cycle tourists in the last three years. In fact, the sample we have might potentially represent 1000 or more cycle tourists.
If the estimate of 3000 tourists per year holds, then a response rate of 531 individuals represents 16% of all cycle tourists. Meaning this sample could be a pretty reasonable representation of those cycle touring New Zealand.
SELF REPORT BIAS
There are limitations with an opt-in survey that the sample represents those that are motivated to provide feedback.
7
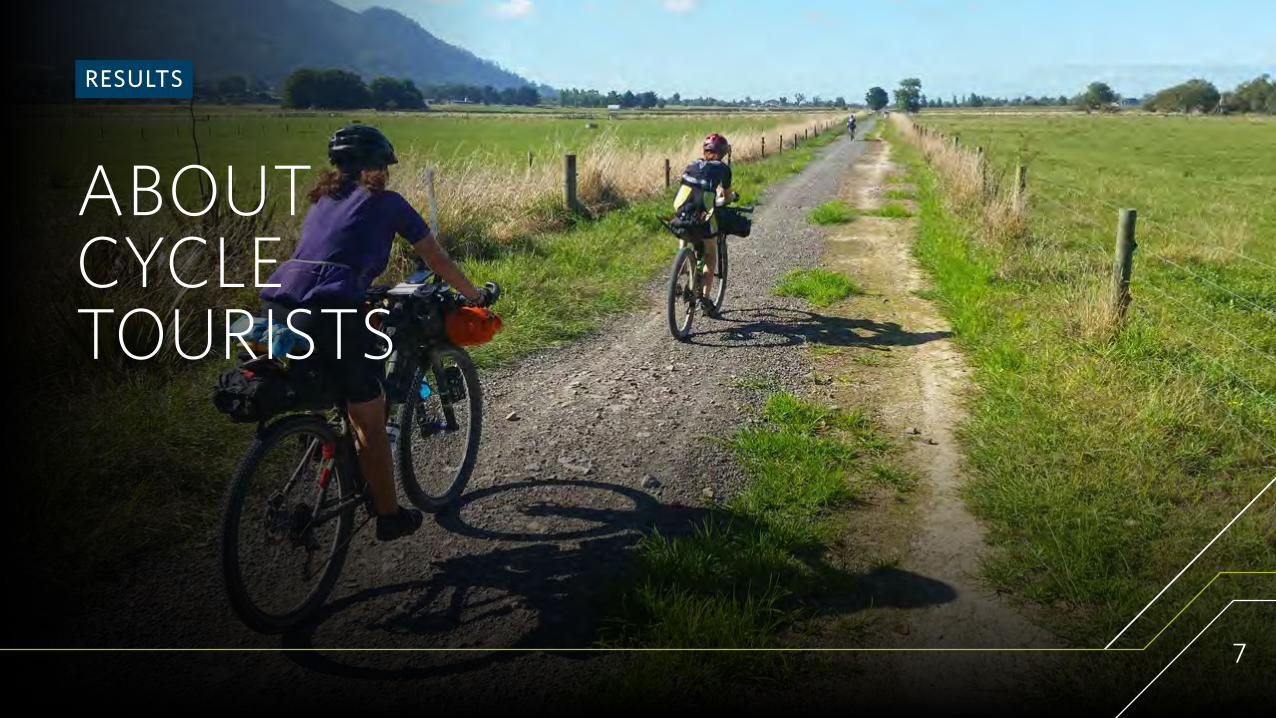
RESULTS
ABOUT CYCLE TOURISTS
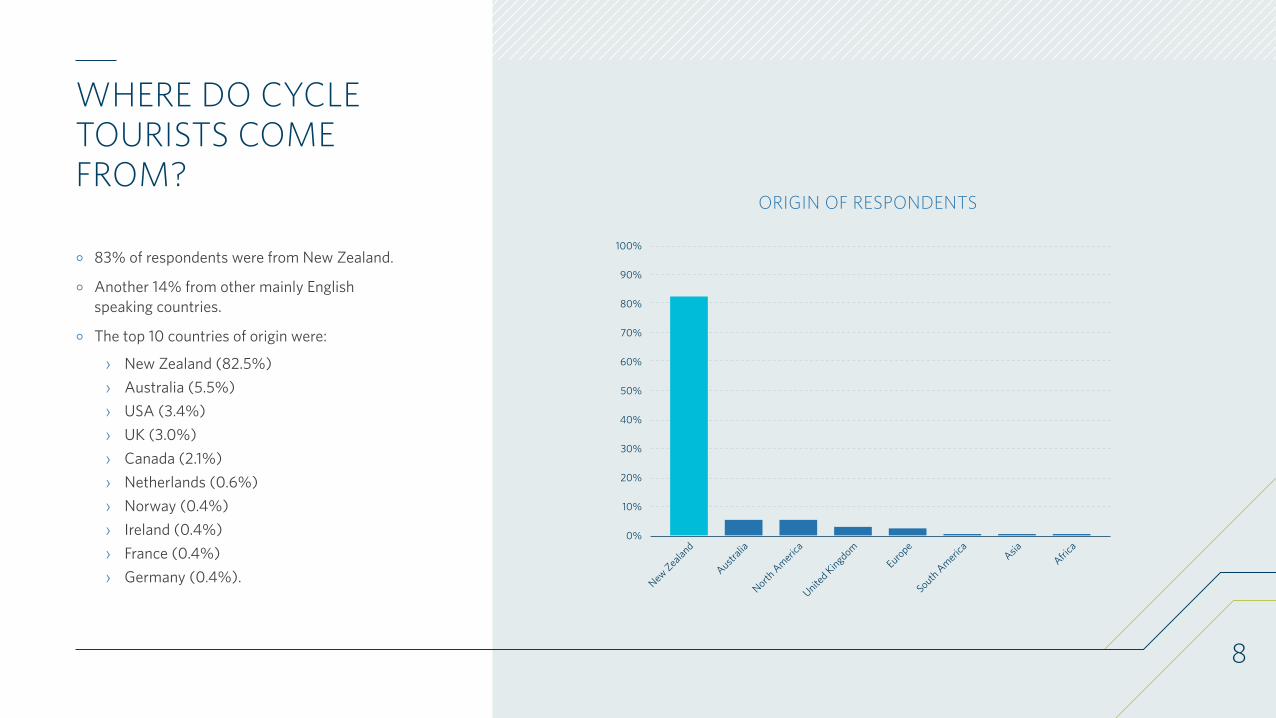
WHERE DO CYCLE TOURISTS COME FROM?
◦ 83% of respondents were from New Zealand.
◦ Another 14% from other mainly English speaking countries.
◦ The top 10 countries of origin were:
› New Zealand (82.5%) › Australia (5.5%) › USA (3.4%) › UK (3.0%) › Canada (2.1%) › Netherlands (0.6%) › Norway (0.4%) › Ireland (0.4%) › France (0.4%) › Germany (0.4%).
8
ORIGIN OF RESPONDENTS
0%
10%
20%
30%
40%
50%
60%
70%
80%
90%
100%
New Zealand
Australia
North A
merica
United Kingdom
Europe
South Americ
aAsia
Africa
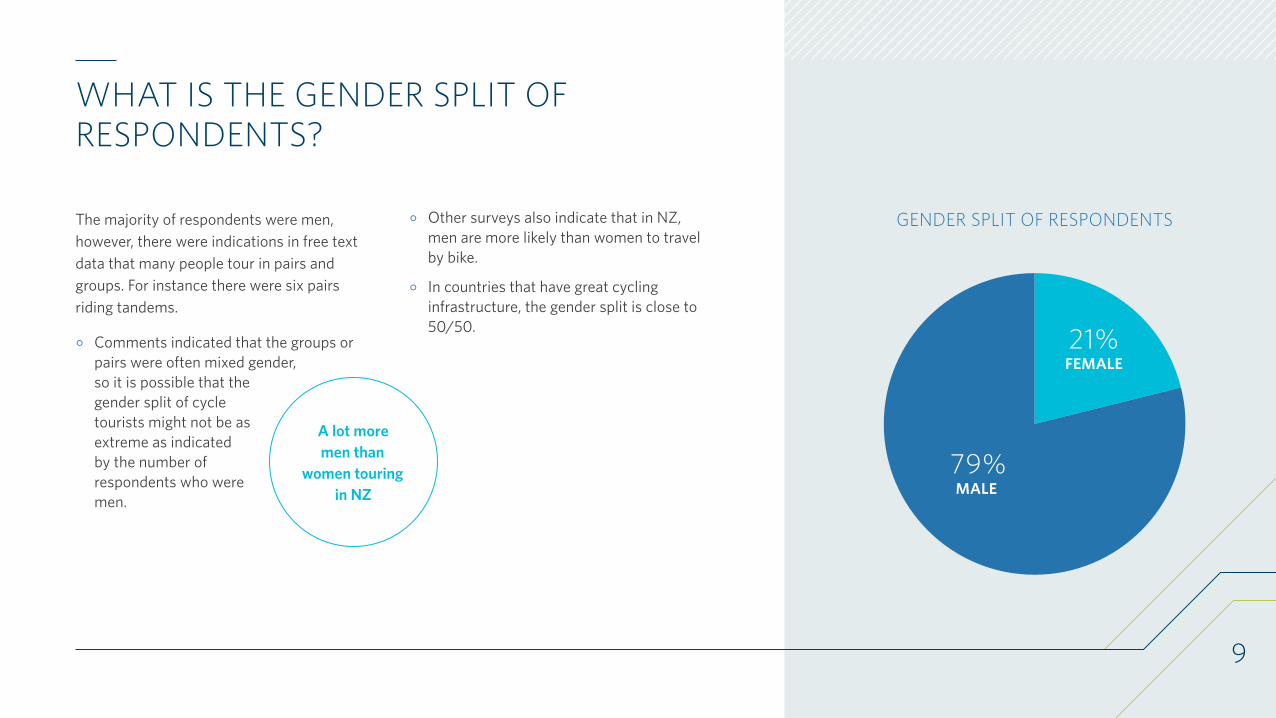
WHAT IS THE GENDER SPLIT OF RESPONDENTS?
The majority of respondents were men, however, there were indications in free text data that many people tour in pairs and groups. For instance there were six pairs riding tandems.
◦ Comments indicated that the groups or pairs were often mixed gender, so it is possible that the gender split of cycle tourists might not be as extreme as indicated by the number of respondents who were men.
◦ Other surveys also indicate that in NZ, men are more likely than women to travel by bike.
◦ In countries that have great cycling infrastructure, the gender split is close to 50/50.
A lot more men than
women touring in NZ
9
GENDER SPLIT OF RESPONDENTS
FEMALE
MALE
21%
79%
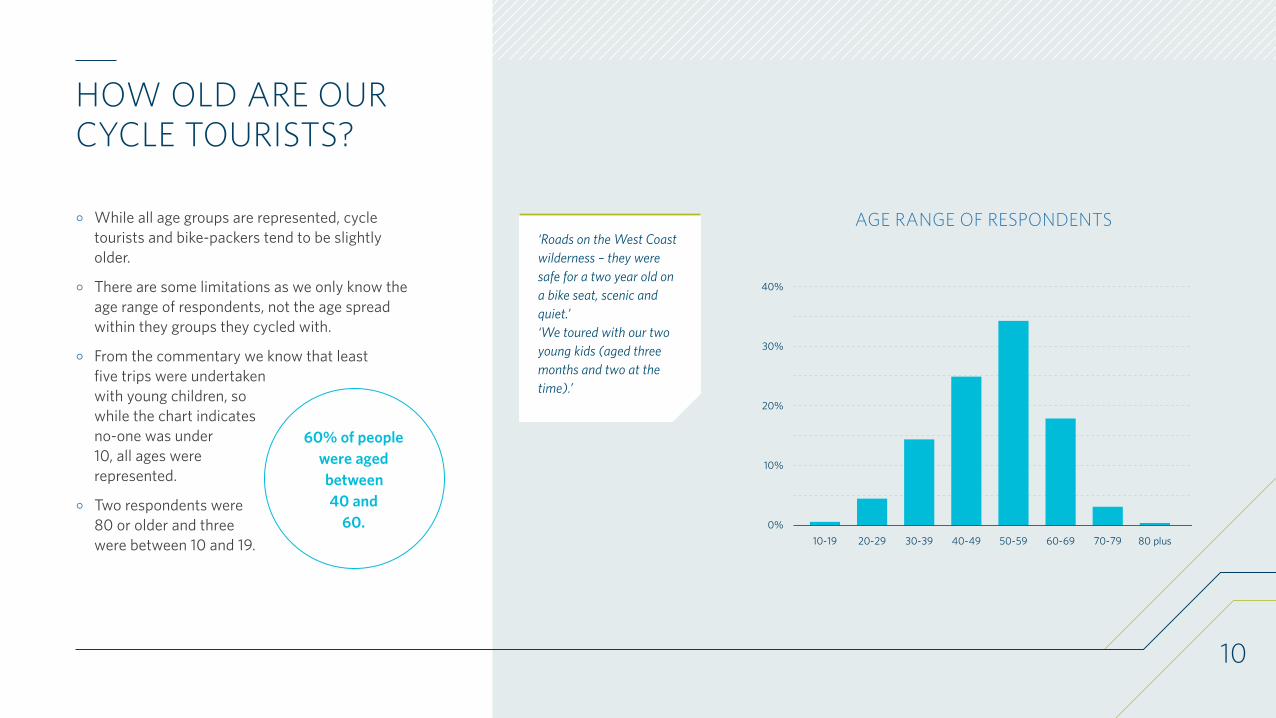
HOW OLD ARE OUR CYCLE TOURISTS?
◦ While all age groups are represented, cycle tourists and bike-packers tend to be slightly older.
◦ There are some limitations as we only know the age range of respondents, not the age spread within they groups they cycled with.
◦ From the commentary we know that least five trips were undertaken with young children, so while the chart indicates no-one was under 10, all ages were represented.
◦ Two respondents were 80 or older and three were between 10 and 19.
60% of people were aged between 40 and
60.
10
AGE RANGE OF RESPONDENTS
0%
10%
20%
30%
40%
10-19 20-29 30-39 40-49 50-59 60-69 70-79 80 plus
‘Roads on the West Coast wilderness – they were safe for a two year old on a bike seat, scenic and quiet.’ ‘We toured with our two young kids (aged three months and two at the time).’
11
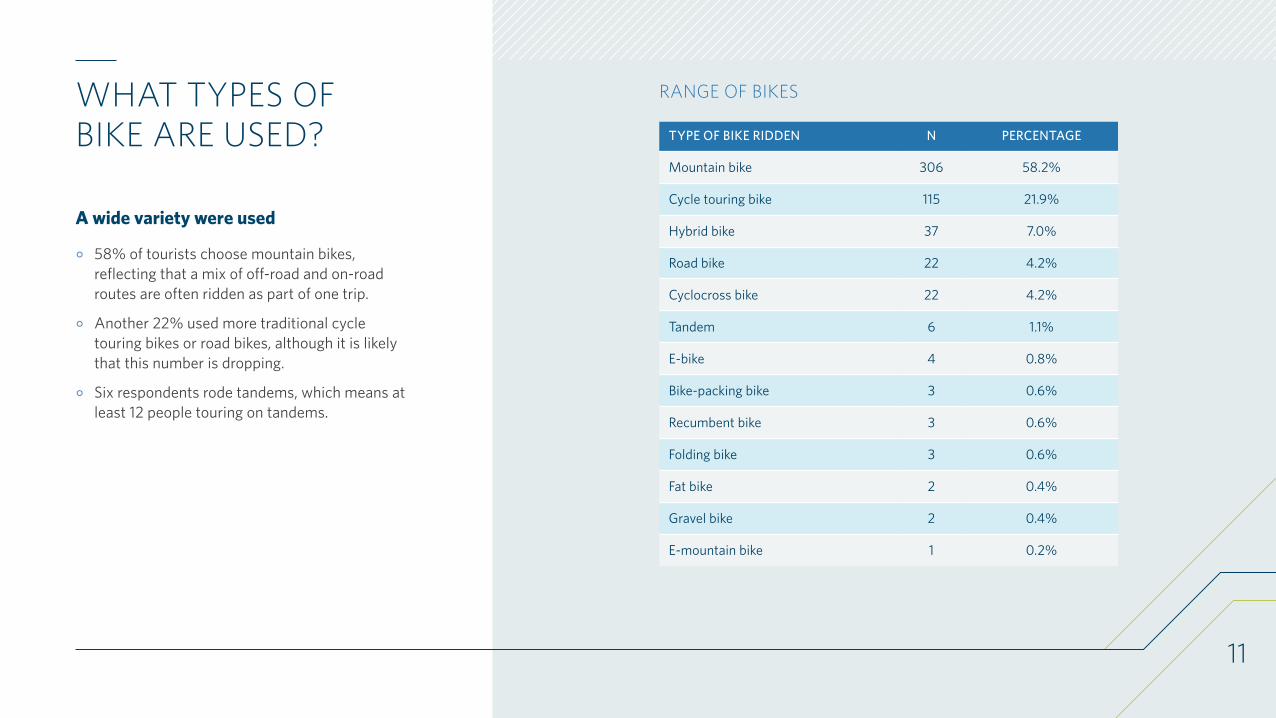
WHAT TYPES OF BIKE ARE USED?
A wide variety were used
◦ 58% of tourists choose mountain bikes, reflecting that a mix of off-road and on-road routes are often ridden as part of one trip.
◦ Another 22% used more traditional cycle touring bikes or road bikes, although it is likely that this number is dropping.
◦ Six respondents rode tandems, which means at least 12 people touring on tandems.
RANGE OF BIKES
TYPE OF BIKE RIDDEN N PERCENTAGE
Mountain bike 306 58.2%
Cycle touring bike 115 21.9%
Hybrid bike 37 7.0%
Road bike 22 4.2%
Cyclocross bike 22 4.2%
Tandem 6 1.1%
E-bike 4 0.8%
Bike-packing bike 3 0.6%
Recumbent bike 3 0.6%
Folding bike 3 0.6%
Fat bike 2 0.4%
Gravel bike 2 0.4%
E-mountain bike 1 0.2%
12
MORE SUITABLE FOR SEALED ROADS
MORE SUITABLE FOR
MIXED TOURING
36%
64%
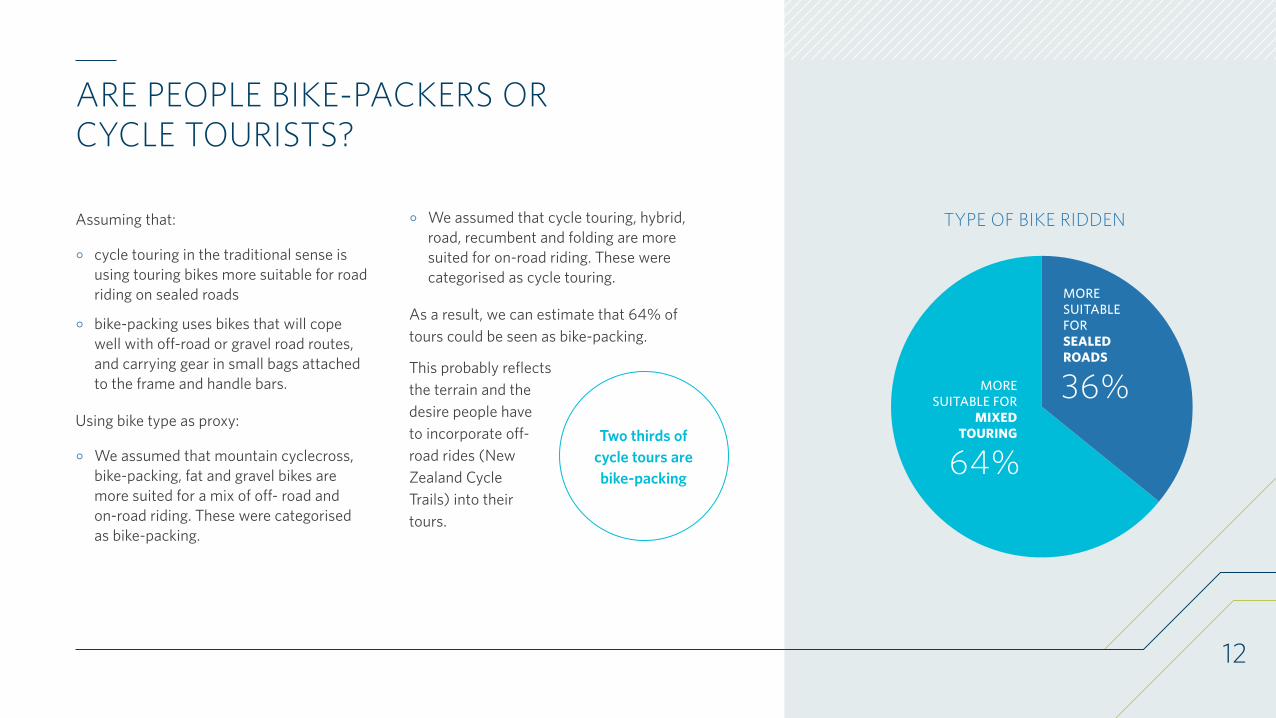
ARE PEOPLE BIKE-PACKERS OR CYCLE TOURISTS?
Assuming that:
◦ cycle touring in the traditional sense is using touring bikes more suitable for road riding on sealed roads
◦ bike-packing uses bikes that will cope well with off-road or gravel road routes, and carrying gear in small bags attached to the frame and handle bars.
Using bike type as proxy:
◦ We assumed that mountain cyclecross, bike-packing, fat and gravel bikes are more suited for a mix of off- road and on-road riding. These were categorised as bike-packing.
◦ We assumed that cycle touring, hybrid, road, recumbent and folding are more suited for on-road riding. These were categorised as cycle touring.
As a result, we can estimate that 64% of tours could be seen as bike-packing.
This probably reflects the terrain and the desire people have to incorporate off-road rides (New Zealand Cycle Trails) into their tours.
Two thirds of cycle tours are bike-packing
TYPE OF BIKE RIDDEN
13
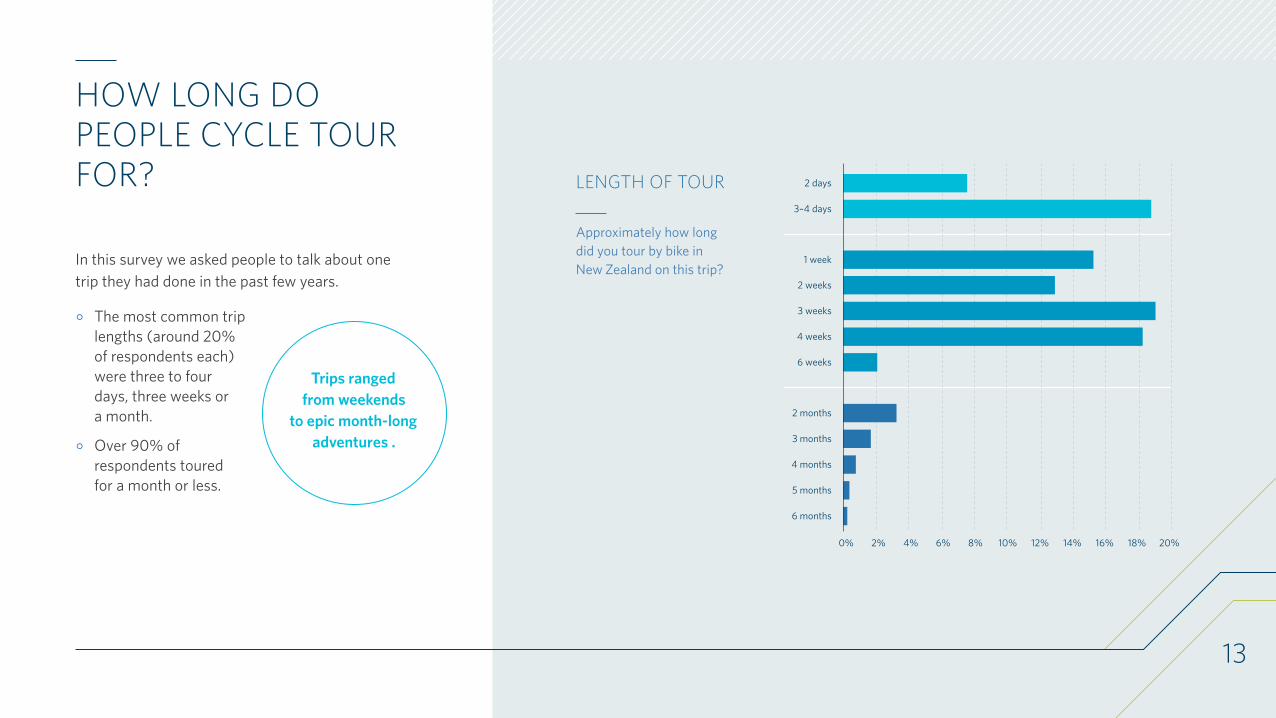
HOW LONG DO PEOPLE CYCLE TOUR FOR?
In this survey we asked people to talk about one trip they had done in the past few years.
◦ The most common trip lengths (around 20% of respondents each) were three to four days, three weeks or a month.
◦ Over 90% of respondents toured for a month or less.
Trips ranged from weekends
to epic month-long adventures .
LENGTH OF TOUR
Approximately how long did you tour by bike in New Zealand on this trip?
0% 10% 12%8%6%4%2% 14% 16% 18% 20%
2 days
3–4 days
1 week
2 weeks
3 weeks
4 weeks
6 weeks
2 months
3 months
4 months
5 months
6 months
14
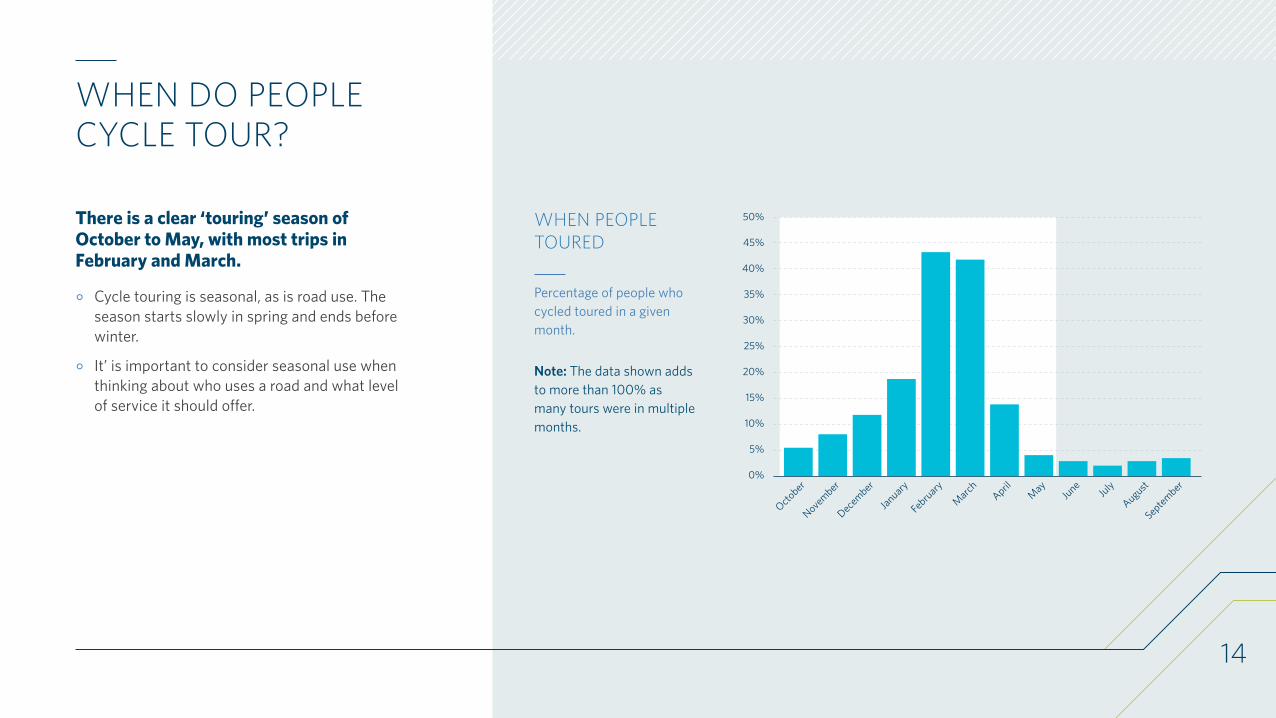
WHEN DO PEOPLE CYCLE TOUR?
There is a clear ‘touring’ season of October to May, with most trips in February and March.
◦ Cycle touring is seasonal, as is road use. The season starts slowly in spring and ends before winter.
◦ It’ is important to consider seasonal use when thinking about who uses a road and what level of service it should offer.
WHEN PEOPLE TOURED
Percentage of people who cycled toured in a given month.
Note: The data shown adds to more than 100% as many tours were in multiple months.
0%
5%
10%
15%
20%
25%
30%
35%
40%
45%
50%
January
February
March April
May
JuneJuly
August
September
October
November
December
15
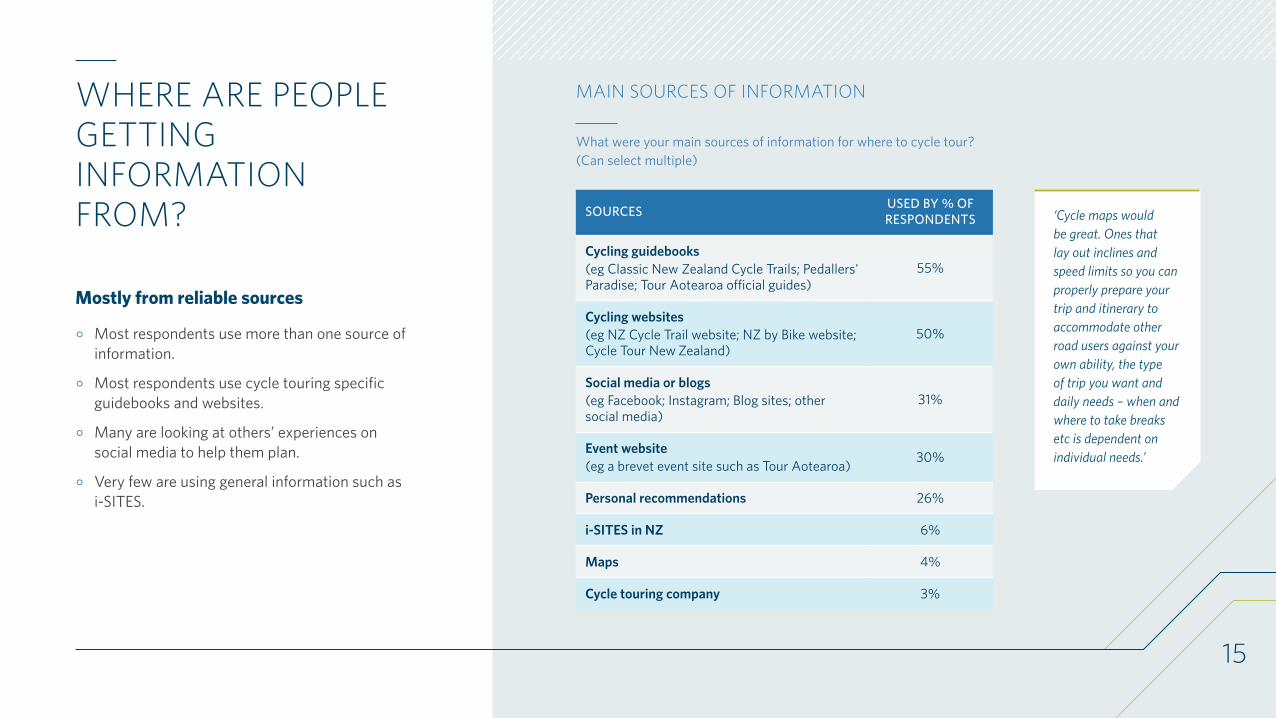
WHERE ARE PEOPLE GETTING INFORMATION FROM?
Mostly from reliable sources
◦ Most respondents use more than one source of information.
◦ Most respondents use cycle touring specific guidebooks and websites.
◦ Many are looking at others’ experiences on social media to help them plan.
◦ Very few are using general information such as i-SITES.
SOURCES USED BY % OF RESPONDENTS
Cycling guidebooks (eg Classic New Zealand Cycle Trails; Pedallers' Paradise; Tour Aotearoa official guides)
55%
Cycling websites (eg NZ Cycle Trail website; NZ by Bike website; Cycle Tour New Zealand)
50%
Social media or blogs (eg Facebook; Instagram; Blog sites; other social media)
31%
Event website (eg a brevet event site such as Tour Aotearoa) 30%
Personal recommendations 26%
i-SITES in NZ 6%
Maps 4%
Cycle touring company 3%
MAIN SOURCES OF INFORMATION
What were your main sources of information for where to cycle tour? (Can select multiple)
‘Cycle maps would be great. Ones that lay out inclines and speed limits so you can properly prepare your trip and itinerary to accommodate other road users against your own ability, the type of trip you want and daily needs – when and where to take breaks etc is dependent on individual needs.’
16
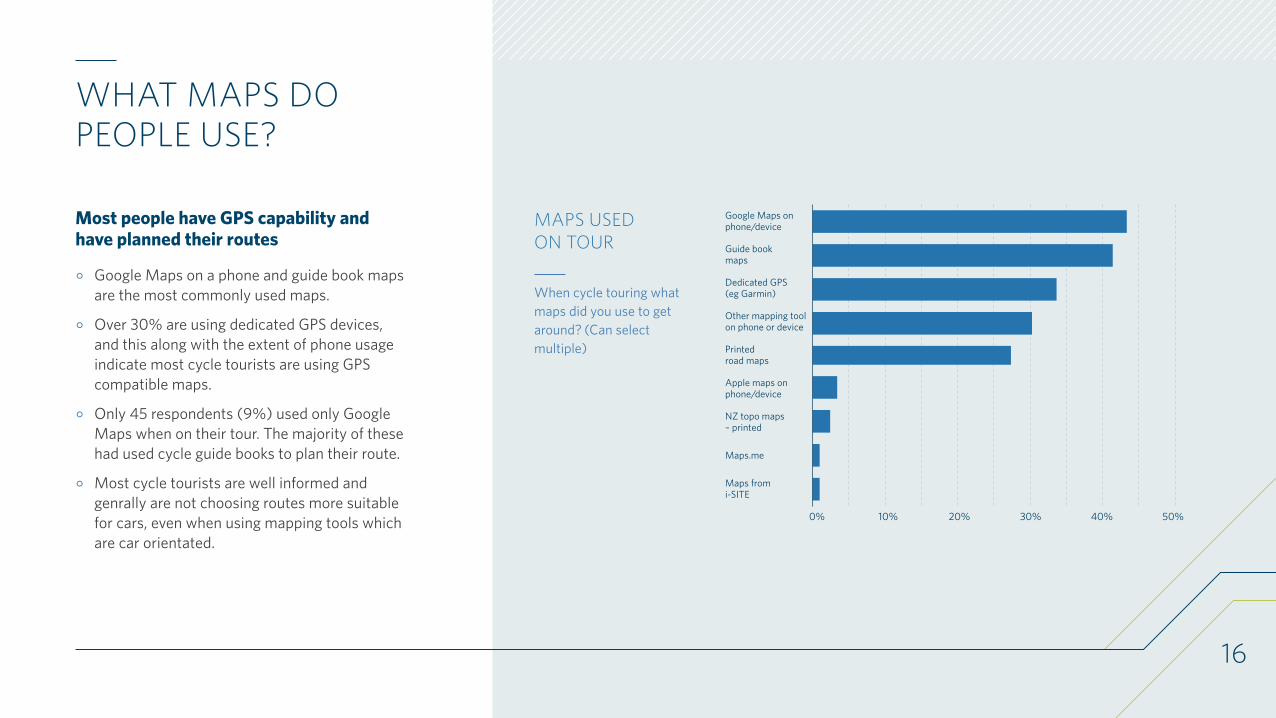
WHAT MAPS DO PEOPLE USE?
Most people have GPS capability and have planned their routes
◦ Google Maps on a phone and guide book maps are the most commonly used maps.
◦ Over 30% are using dedicated GPS devices, and this along with the extent of phone usage indicate most cycle tourists are using GPS compatible maps.
◦ Only 45 respondents (9%) used only Google Maps when on their tour. The majority of these had used cycle guide books to plan their route.
◦ Most cycle tourists are well informed and genrally are not choosing routes more suitable for cars, even when using mapping tools which are car orientated.
MAPS USED ON TOUR
When cycle touring what maps did you use to get around? (Can select multiple)
0% 10% 20% 30% 40% 50%
Maps fromi-SITE
Maps.me
NZ topo maps – printed
Apple maps onphone/device
Printedroad maps
Other mapping tool on phone or device
Dedicated GPS(eg Garmin)
Guide bookmaps
Google Maps on phone/device

17
RESULTS
EXPLORING WHERE PEOPLE RODE AND THEIR EXPERIENCES
18
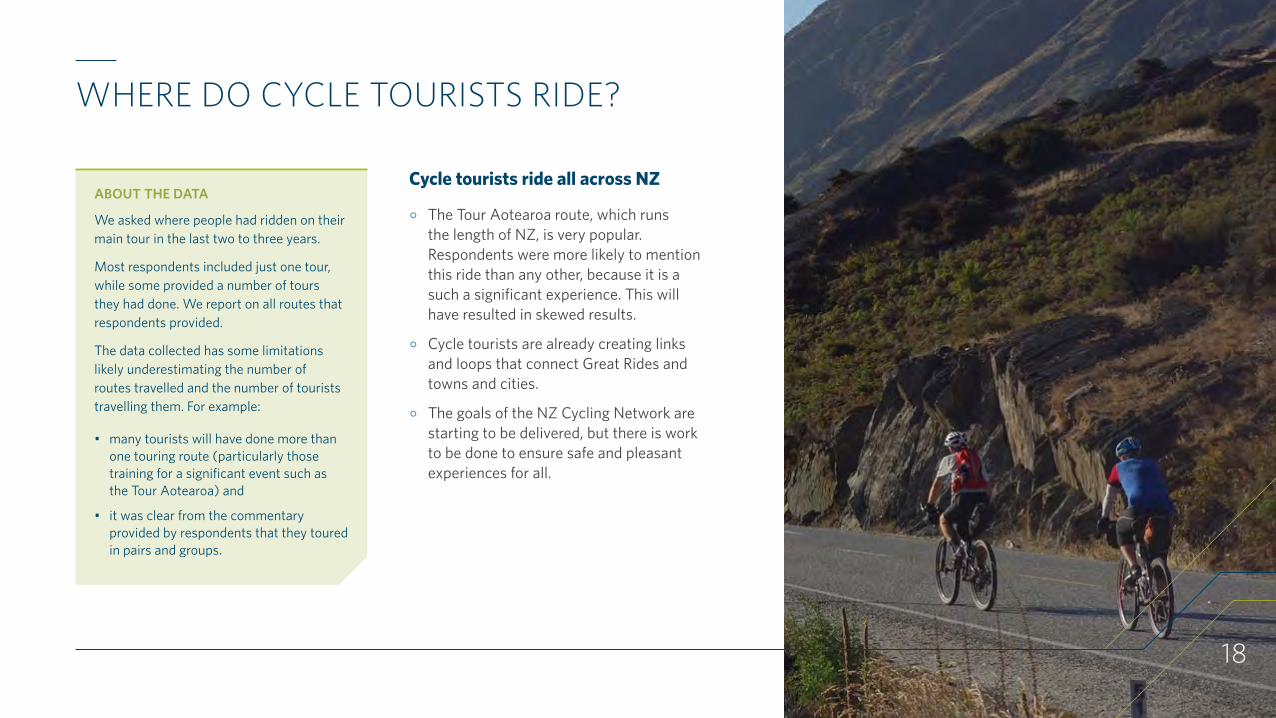
WHERE DO CYCLE TOURISTS RIDE?
ABOUT THE DATA
We asked where people had ridden on their main tour in the last two to three years.
Most respondents included just one tour, while some provided a number of tours they had done. We report on all routes that respondents provided.
The data collected has some limitations likely underestimating the number of routes travelled and the number of tourists travelling them. For example:
• many tourists will have done more than one touring route (particularly those training for a significant event such as the Tour Aotearoa) and
• it was clear from the commentary provided by respondents that they toured in pairs and groups.
Cycle tourists ride all across NZ
◦ The Tour Aotearoa route, which runs the length of NZ, is very popular. Respondents were more likely to mention this ride than any other, because it is a such a significant experience. This will have resulted in skewed results.
◦ Cycle tourists are already creating links and loops that connect Great Rides and towns and cities.
◦ The goals of the NZ Cycling Network are starting to be delivered, but there is work to be done to ensure safe and pleasant experiences for all.
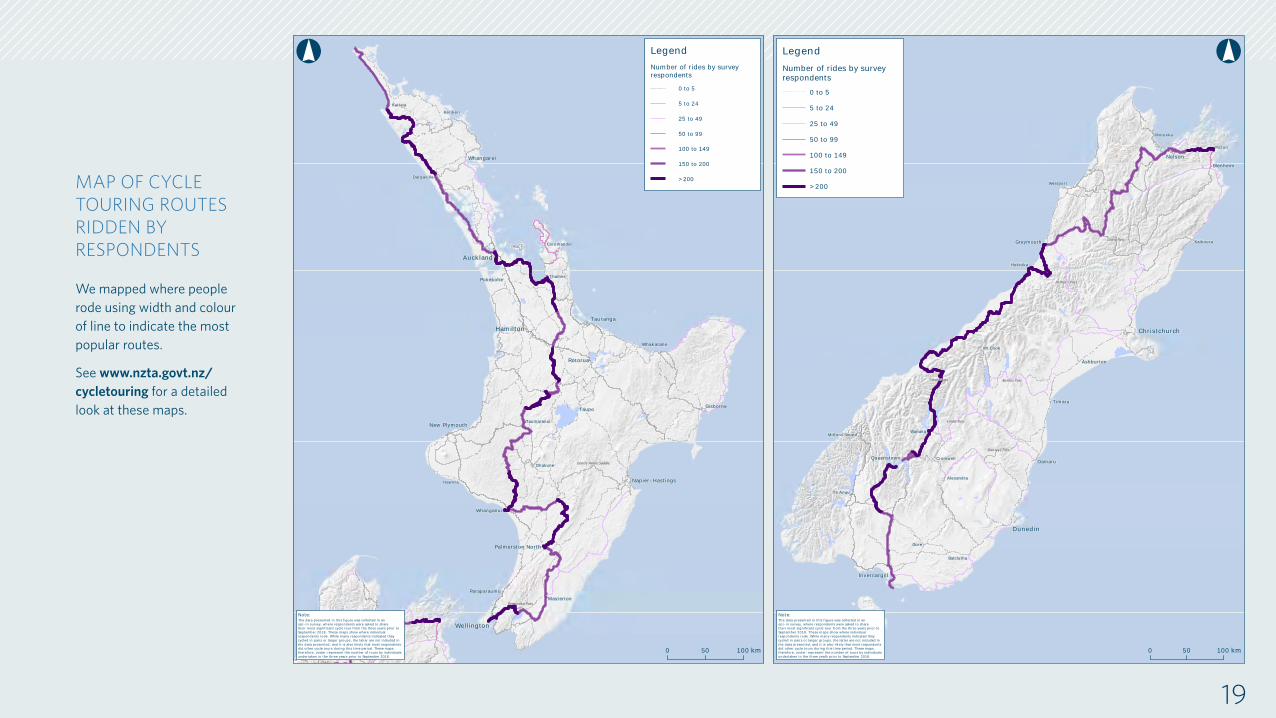
MAP OF CYCLE TOURING ROUTES RIDDEN BY RESPONDENTS
We mapped where people rode using width and colour of line to indicate the most popular routes.
See www.nzta.govt.nz/cycletouring for a detailed look at these maps.
19
0 50 100 km
°
Auckland
Wellington
Pukekohe
Palmerston North
Whanganui
Whakatane
Dargaville
Kerikeri
Kaitaia
Coromandel
Masterton
Taupo
Taumaranui
Thames
May 2019Document Path: \\wlggeordbms\PROJECT\PROJECTS\CYCLING\MXD\LoveHate Survey\LoveHateSurvey.mxd
Cycle Touring Routes RiddenNumber of 2018 cycle touring survey respondentswho rode different on-road routes in the North Island
Hamilton
Napier-Hastings
New Plymouth
Tauranga
Whangarei
Rotorua
Gisborne
Ohakune
LegendNumber of rides by surveyrespondents
0 to 5
5 to 24
25 to 49
50 to 99
100 to 149
150 to 200
>200
Remutaka Pass
Gentle Annie Saddle
Paraparaumu
Hawera
The data presented in this figure was collected in anopt-in survey, where respondents were asked to sharetheir most significant cycle tour from the three years prior toSeptember 2018. These maps show where individualrespondents rode. While many respondents indicated theycycled in pairs or larger groups, the latter are not included inthe data presented, and it is also likely that most respondentsdid other cycle tours during this time period. These maps,therefore, under-represent the number of tours by individualsundertaken in the three years prior to September 2018.
Note:
0 50 100 km
°LegendNumber of rides by surveyrespondents
0 to 5
5 to 24
25 to 49
50 to 99
100 to 149
150 to 200
>200
Christchurch
Dunedin
NelsonBlenheim
Greymouth
Invercargill
Queenstown
Timaru
Kaikoura
Westport
Mt Cook
Milford Sound
Oamaru
Balclutha
Wanaka
Motueka
May 2019Document Path: \\wlggeordbms\PROJECT\PROJECTS\CYCLING\MXD\LoveHate Survey\SouthIsland_LoveHateSurvey.mxd
Cycle Touring Routes RiddenNumber of 2018 cycle touring survey respondents who rode different on-road routes in the South Island
Ashburton
Danseys Psss
Lindis Pass
Burkes PassHaast Pass
Arthur's Pass
Lewis Pass
Alexandra
Cromwell
Gore
Te Anau
Picton
Hokitika
Note:The data presented in this figure was collected in an opt-in survey, where respondents were asked to share their most significant cycle tour from the three years prior to September 2018. These maps show where individual respondents rode. While many respondents indicated they cycled in pairs or larger groups, the latter are not included in the data presented, and it is also likely that most respondents did other cycle tours during this time period. These maps, therefore, under-represent the number of tours by individuals undertaken in the three years prior to September 2018.
20
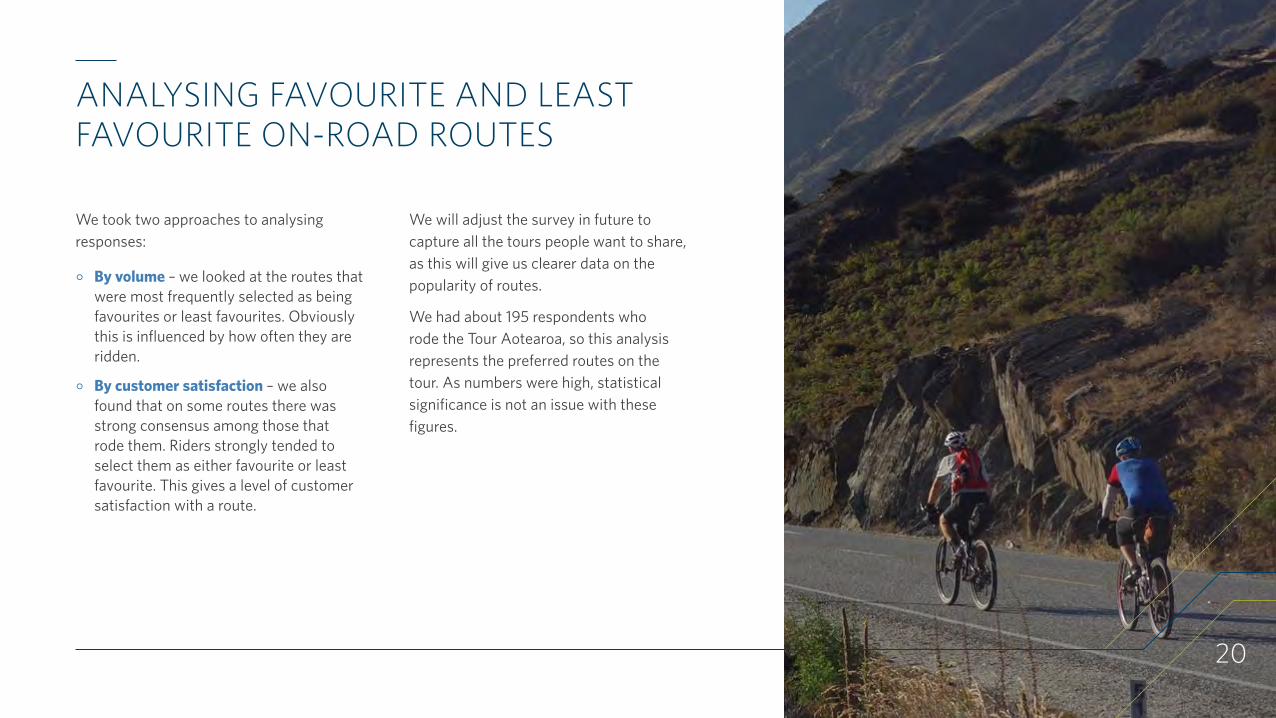
ANALYSING FAVOURITE AND LEAST FAVOURITE ON-ROAD ROUTES
We took two approaches to analysing responses:
◦ By volume – we looked at the routes that were most frequently selected as being favourites or least favourites. Obviously this is influenced by how often they are ridden.
◦ By customer satisfaction – we also found that on some routes there was strong consensus among those that rode them. Riders strongly tended to select them as either favourite or least favourite. This gives a level of customer satisfaction with a route.
We will adjust the survey in future to capture all the tours people want to share, as this will give us clearer data on the popularity of routes.
We had about 195 respondents who rode the Tour Aotearoa, so this analysis represents the preferred routes on the tour. As numbers were high, statistical significance is not an issue with these figures.
21
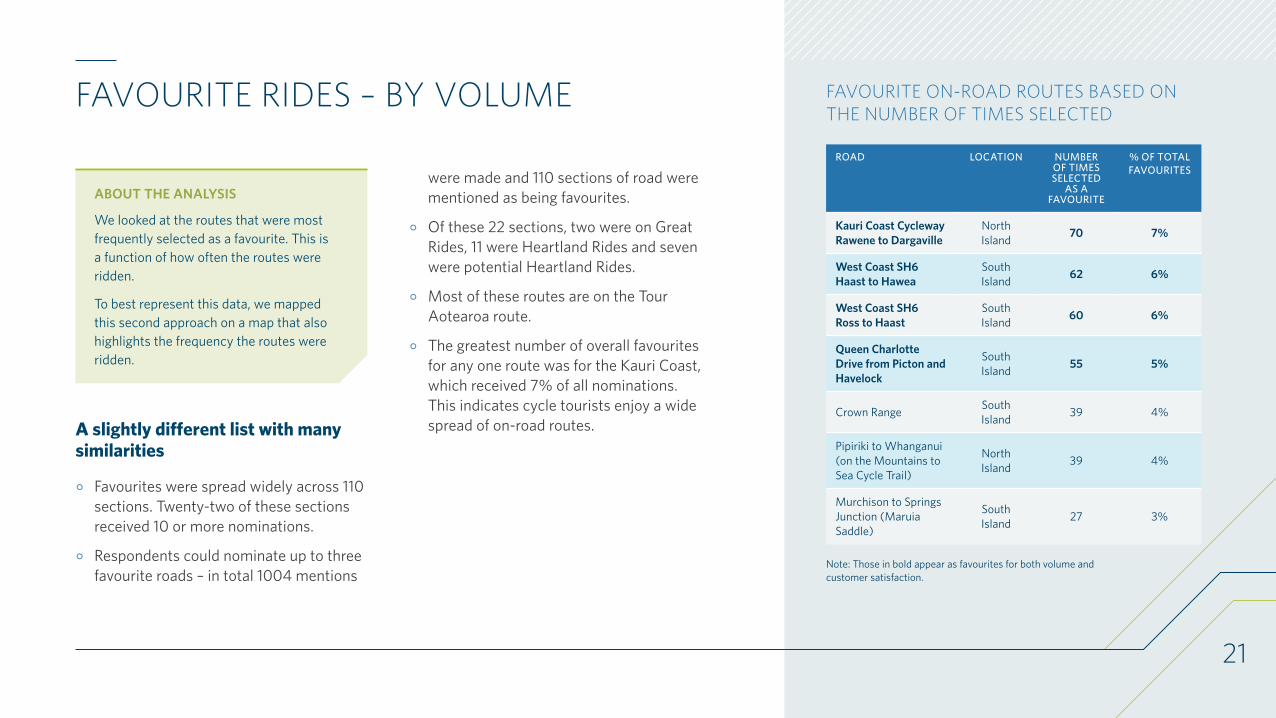
FAVOURITE RIDES – BY VOLUME
ABOUT THE ANALYSIS
We looked at the routes that were most frequently selected as a favourite. This is a function of how often the routes were ridden.
To best represent this data, we mapped this second approach on a map that also highlights the frequency the routes were ridden.
A slightly different list with many similarities
◦ Favourites were spread widely across 110 sections. Twenty-two of these sections received 10 or more nominations.
◦ Respondents could nominate up to three favourite roads – in total 1004 mentions
were made and 110 sections of road were mentioned as being favourites.
◦ Of these 22 sections, two were on Great Rides, 11 were Heartland Rides and seven were potential Heartland Rides.
◦ Most of these routes are on the Tour Aotearoa route.
◦ The greatest number of overall favourites for any one route was for the Kauri Coast, which received 7% of all nominations. This indicates cycle tourists enjoy a wide spread of on-road routes.
FAVOURITE ON-ROAD ROUTES BASED ON THE NUMBER OF TIMES SELECTED
ROAD LOCATION NUMBER OF TIMES SELECTED
AS A FAVOURITE
% OF TOTAL FAVOURITES
Kauri Coast Cycleway Rawene to Dargaville
North Island 70 7%
West Coast SH6 Haast to Hawea
South Island 62 6%
West Coast SH6 Ross to Haast
South Island 60 6%
Queen Charlotte Drive from Picton and Havelock
South Island 55 5%
Crown Range South Island 39 4%
Pipiriki to Whanganui (on the Mountains to Sea Cycle Trail)
North Island 39 4%
Murchison to Springs Junction (Maruia Saddle)
South Island 27 3%
Note: Those in bold appear as favourites for both volume and customer satisfaction.

22
FAVOURITE RIDES – BY CUSTOMER SATISFACTION
ABOUT THE ANALYSIS
We looked at the percentage of respondents who rode any one route that selected it as a favourite. This gives a measure of customer satisfaction on a route and is the stronger measure of a good route.
On routes that were only ridden by a few riders, the statistical significance is not great. We have not reported on those routes that were ridden fewer than 10 times.
Heartland Rides rate highly
◦ Lots of Heartland Rides and potential Heartland Rides are very memorable, providing cycling tourists with great experiences.
◦ There is a lot of potential for Heartland Rides to grow and bring low-impact tourism into a region.
Some routes were well loved, if infrequently ridden
Routes that were selected as a favourite route by all those who rode them had low numbers of riders and so are not included in the table. These were:
◦ Motu Road on the Motu trail (nine riders)
◦ Rotomahana to Wairoa via Lake Waikaremoana (seven riders)
◦ Westport to Punakaiki via Charleston (four riders).
FAVOURITE ON-ROAD ROUTES AS A PERCENTAGE OF HOW OFTEN THEY WERE RIDDEN
ROAD LOCATION NUMBER OF TIMES RIDDEN
% OF TIMES SELECTED AS A FAVOURITE
The Forgotten World Highway – Taumarunui to New Plymouth North Island 14 93%
Rainbow Valley South Island 10 70%
Danseys Pass South Island 10 50%
Taihape to Napier North Island 21 43%
Route 52 – Waipukurau to Masterton North Island 38 42%
East Cape Loop – Ōpōtiki to Gisborne North Island 32 41%
Kauri Coast Cycleway – Rawene to Dargaville North Island 70 35%
Molesworth South Island 19 32%
Catlins Coast, Balclutha to Invercargill South Island 44 27%
West Coast – Ross to Hawea South Island 254 24%
West Coast – Haast to Hawea South Island 257 24%
Queen Charlotte Drive – Picton to Havelock South Island 236 23%
Arthur’s Pass Christchurch to Greymouth South Island 37 22%
23
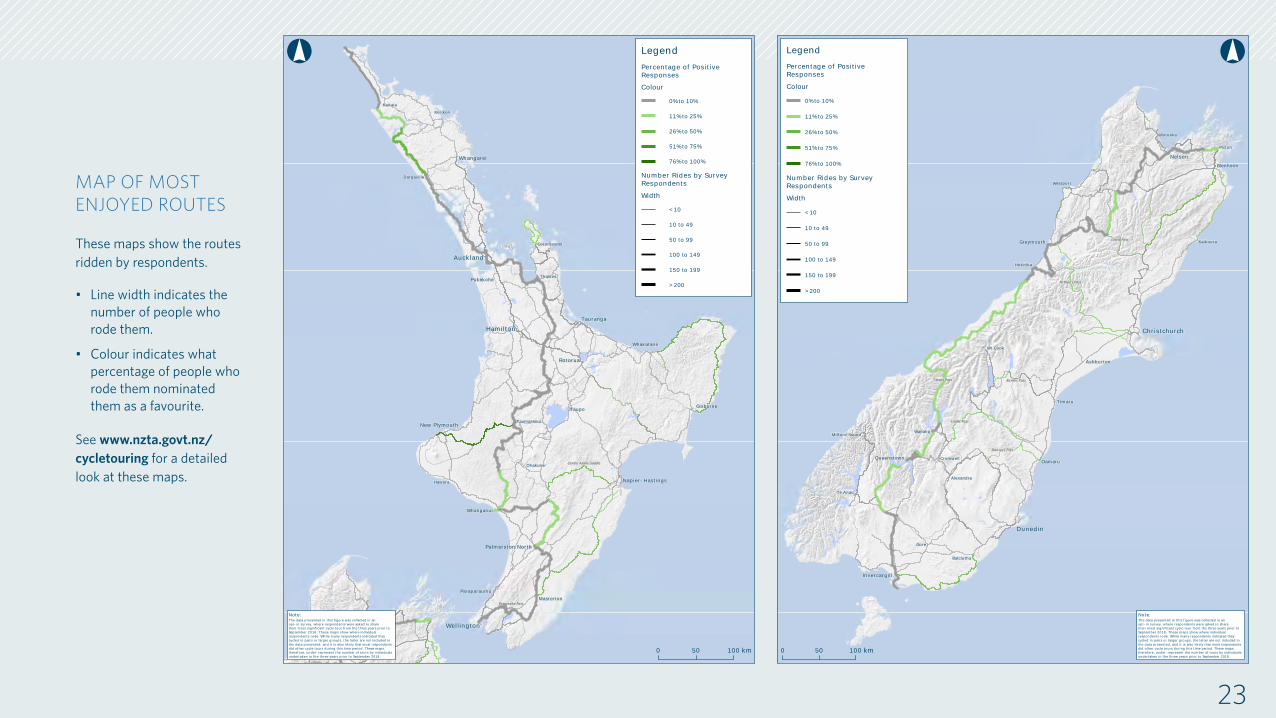
MAP OF MOST ENJOYED ROUTES
These maps show the routes ridden by respondents.
• Line width indicates the number of people who rode them.
• Colour indicates what percentage of people who rode them nominated them as a favourite.
See www.nzta.govt.nz/cycletouring for a detailed look at these maps.
0 50 100 km
°
Auckland
Wellington
Pukekohe
Palmerston North
Whanganui
Whakatane
Dargaville
Kerikeri
Kaitaia
Coromandel
Masterton
Taupo
Taumaranui
Thames
May 2019Document Path: \\wlggeordbms\PROJECT\PROJECTS\CYCLING\MXD\LoveHate Survey\NorthIsland_LoveHateSurvey.mxd
Most-Enjoyed MapPercentage of 2018 cycle touring survey respondents who said an on-road route was one of their ‘favourites’
Hamilton
Napier-Hastings
New Plymouth
Tauranga
Whangarei
Rotorua
Gisborne
Ohakune
LegendPercentage of PositiveResponsesColour
0% to 10%
11% to 25%
26% to 50%
51% to 75%
76% to 100%
Number Rides by SurveyRespondentsWidth
<10
10 to 49
50 to 99
100 to 149
150 to 199
>200
Remutaka Pass
Gentle Annie Saddle
Paraparaumu
Hawera
The data presented in this figure was collected in an opt-in survey, where respondents were asked to share their most significant cycle tour from the three years prior to September 2018. These maps show where individual respondents rode. While many respondents indicated they cycled in pairs or larger groups, the latter are not included in the data presented, and it is also likely that most respondents did other cycle tours during this time period. These maps, therefore, under-represent the number of tours by individuals undertaken in the three years prior to September 2018.
Note:
0 50 100 km
°LegendPercentage of PositiveResponsesColour
0% to 10%
11% to 25%
26% to 50%
51% to 75%
76% to 100%
Number Rides by SurveyRespondentsWidth
<10
10 to 49
50 to 99
100 to 149
150 to 199
>200
Christchurch
Dunedin
NelsonBlenheim
Greymouth
Invercargill
Queenstown
Timaru
Kaikoura
Westport
Mt Cook
Milford Sound
Oamaru
Balclutha
Wanaka
Motueka
May 2019Document Path: \\wlggeordbms\PROJECT\PROJECTS\CYCLING\MXD\LoveHate Survey\SouthIsland_LoveHateSurvey.mxd
Most-Enjoyed MapPercentage of 2018 cycle touring survey respondents who said an on-road route was one of their ‘favourites’
Ashburton
Danseys Psss
Lindis Pass
Burkes PassHaast Pass
Arthur's Pass
Lewis Pass
Alexandra
Cromwell
Gore
Te Anau
Picton
Hokitika
The data presented in this figure was collected in an opt-in survey, where respondents were asked to share their most significant cycle tour from the three years prior to September 2018. These maps show where individual respondents rode. While many respondents indicated they cycled in pairs or larger groups, the latter are not included in the data presented, and it is also likely that most respondents did other cycle tours during this time period. These maps, therefore, under-represent the number of tours by individuals undertaken in the three years prior to September 2018.
Note:
24
LEAST FAVOURITE RIDES – BY VOLUME
◦ There were 11 roads that were nominated as least favourite 10 or more times. This compares with 22 sections that were nominated as favourites 10 or more times.
◦ This list is very similar to the previous one apart from two routes that now appear. They are:
› Crown Range
› Glenhope to Gowan on SH6.
◦ Glenhope to Gowan is a small section of an on-road route on SH6 that is causing a significant proportion of bad experiences.
LEAST FAVOURITE ON-ROAD ROUTES BASED ON NUMBER OF TIMES SELECTED
ROAD LOCATION NUMBER OF TIMES NOMINATED
% OF ALL DISLIKES
Invercargill to Bluff on SH1 South Island 82 11%
Onehunga to Ardmore Airport North Island 58 8%
Pouto Point into Auckland on Tour Aotearoa route North Island 51 7%
West Coast SH6 – Ross to Haast South Island 45 6%
Havelock to Pelorus Bridge South Island 38 5%
Pahiatua Track North Island 29 4%
Glenhope to Gowan on SH6 South Island 23 3%
Crown Range South Island 23 3%
SH6 past Maruia Springs South Island 22 3%
West Coast SH6 – Haast to Hawea South Island 16 2%
Nelson to Pelorus Bridge South Island 10 1%
25
LEAST FAVOURITE RIDES – BY CUSTOMER SATISFACTION
◦ A smaller range of roads are selected as least favourite, compared with the wide range of routes as favourites.
◦ But consensus is not as clear with only Waihi to Tauranga chosen as least favourite by over 50% of those who rode it.
◦ A lot of the routes, which about 200 respondents rode, were in the top 10 least favourite routes – quite a different pattern to routes that were well liked.
Perception of lack of safety was the
main reason routes were disliked
LEAST FAVOURITE ON-ROAD ROUTES AS A PERCENTAGE OF HOW OFTEN THEY WERE RIDDEN
ROAD LOCATION NUMBER TIMES OF RIDDEN
% OF TIMES SELECTED AS A LEAST
FAVOURITE
Waihi to Tauranga North Island 12 58%
Invercargill to Bluff on SH1 South Island 179 46%
Helensville to Auckland on the Tour Aotearoa route North Island 194 30%
Onehunga to Ardmore Airport North Island 200 29%
Nelson to Pelorus Bridge South Island 47 21%
West Coast SH6 – Ross to Haast South Island 254 18%
Lindis Valley (Maori Point Road, Omarama) to Tarras South Island 41 17%
Havelock to Pelorus Bridge South Island 233 16%
Pahiatua Track North Island 198 15%
Blenheim to St Arnaud South Island 42 14%
SH6 past Maruia Springs South Island 198 14%
26
0 50 100 km
°
Auckland
Wellington
Pukekohe
Palmerston North
Whanganui
Whakatane
Dargaville
Kerikeri
Kaitaia
Coromandel
Masterton
Taupo
Taumaranui
Thames
May 2019Document Path: \\wlggeordbms\PROJECT\PROJECTS\CYCLING\MXD\LoveHate Survey\NorthIsland_LoveHateSurvey.mxd
Least-Enjoyed MapPercentage of 2018 cycle touring survey respondents who said an on-road route was one of their ‘least favourites’
Hamilton
Napier-Hastings
New Plymouth
Tauranga
Whangarei
Rotorua
Gisborne
Ohakune
LegendPercentage of NegativeResponsesColour
0% to 10%
11% to 25%
26% to 50%
51% to 75%
76% to 100%
Number Rides by SurveyRespondentsWidth
<10
10 to 49
50 to 99
100 to 149
150 to 199
>200
Remutaka Pass
Gentle Annie Saddle
Paraparaumu
Hawera
The data presented in this figure was collected in an opt-in survey, where respondents were asked to share their most significant cycle tour from the three years prior to September 2018. These maps show where individual respondents rode. While many respondents indicated they cycled in pairs or larger groups, the latter are not included in the data presented, and it is also likely that most respondents did other cycle tours during this time period. These maps, therefore, under-represent the number of tours by individuals undertaken in the three years prior to September 2018.
Note:
0 50 100 km
°LegendPercentage of NegativeResponsesColour
0% to 10%
11% to 25%
26% to 50%
51% to 75%
76% to 100%
Number Rides by SurveyRespondentsWidth
<10
10 to 49
50 to 99
100 to 149
150 to 199
>200
Christchurch
Dunedin
NelsonBlenheim
Greymouth
Invercargill
Queenstown
Timaru
Kaikoura
Westport
Mt Cook
Milford Sound
Oamaru
Balclutha
Wanaka
Motueka
May 2019Document Path: \\wlggeordbms\PROJECT\PROJECTS\CYCLING\MXD\LoveHate Survey\SouthIsland_LoveHateSurvey.mxd
Least-Enjoyed MapPercentage of 2018 cycle touring survey respondents who said an on-road route was one of their ‘least favourites’
Ashburton
Danseys Psss
Lindis Pass
Burkes PassHaast Pass
Arthur's Pass
Lewis Pass
Alexandra
Cromwell
Gore
Te Anau
Picton
Hokitika
The data presented in this figure was collected in an opt-in survey, where respondents were asked to share their most significant cycle tour from the three years prior to September 2018. These maps show where individual respondents rode. While many respondents indicated they cycled in pairs or larger groups, the latter are not included in the data presented, and it is also likely that most respondents did other cycle tours during this time period. These maps, therefore, under-represent the number of tours by individuals undertaken in the three years prior to September 2018.
Note:
MAP OF LEAST ENJOYED ROUTES
These maps show the routes ridden by respondents.
◦ Line width indicates the number of people who rode them.
◦ Colour indicates what percentage of people who rode them nominated them as a favourite.
See www.nzta.govt.nz/cycletouring for a detailed look at these maps.
Invercargill to Bluff stands out
27
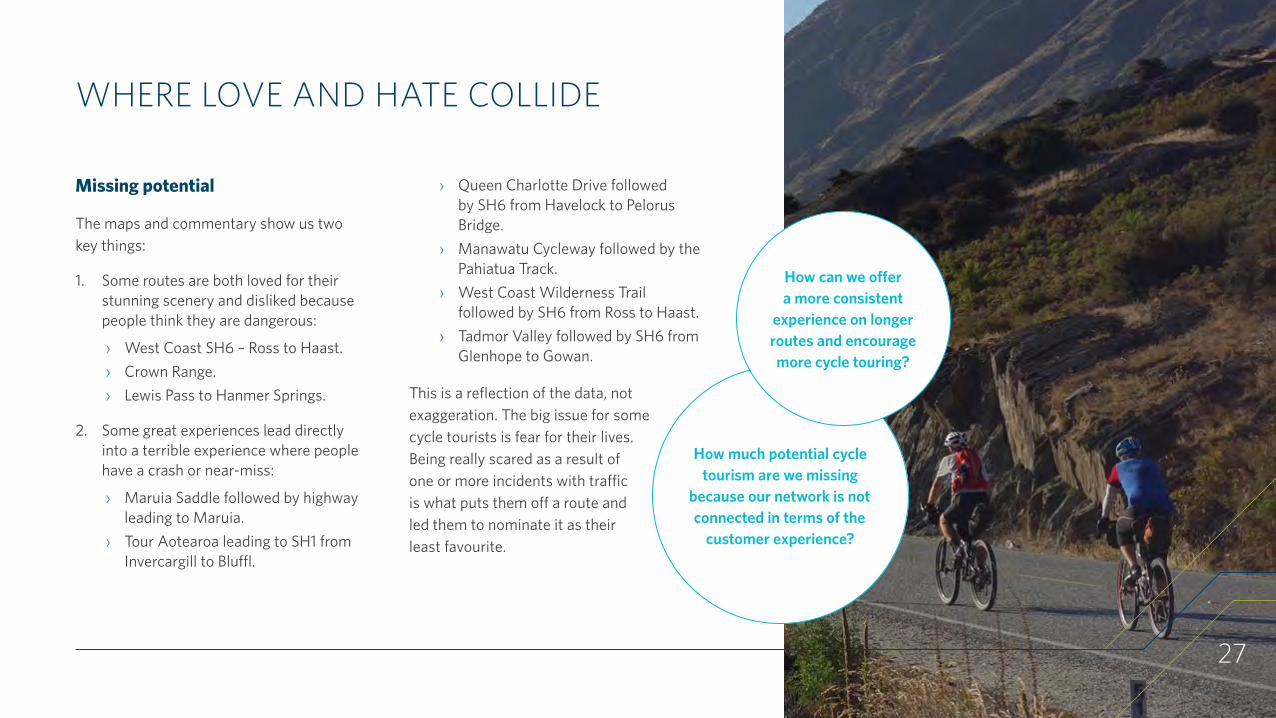
WHERE LOVE AND HATE COLLIDE
Missing potential
The maps and commentary show us two key things:
1. Some routes are both loved for their stunning scenery and disliked because people think they are dangerous:
› West Coast SH6 – Ross to Haast. › Crown Range. › Lewis Pass to Hanmer Springs.
2. Some great experiences lead directly into a terrible experience where people have a crash or near-miss:
› Maruia Saddle followed by highway leading to Maruia.
› Tour Aotearoa leading to SH1 from Invercargill to Bluffl.
› Queen Charlotte Drive followed by SH6 from Havelock to Pelorus Bridge.
› Manawatu Cycleway followed by the Pahiatua Track.
› West Coast Wilderness Trail followed by SH6 from Ross to Haast.
› Tadmor Valley followed by SH6 from Glenhope to Gowan.
This is a reflection of the data, not exaggeration. The big issue for some cycle tourists is fear for their lives. Being really scared as a result of one or more incidents with traffic is what puts them off a route and led them to nominate it as their least favourite.
How much potential cycle tourism are we missing
because our network is not connected in terms of the
customer experience?
How can we offer a more consistent
experience on longer routes and encourage more cycle touring?
0% 20% 40% 60% 80% 100%
ROSS TO HAAST
HAAST TO HAWEA
CROWN RANGE
Least favouriteFavourite Neither
28
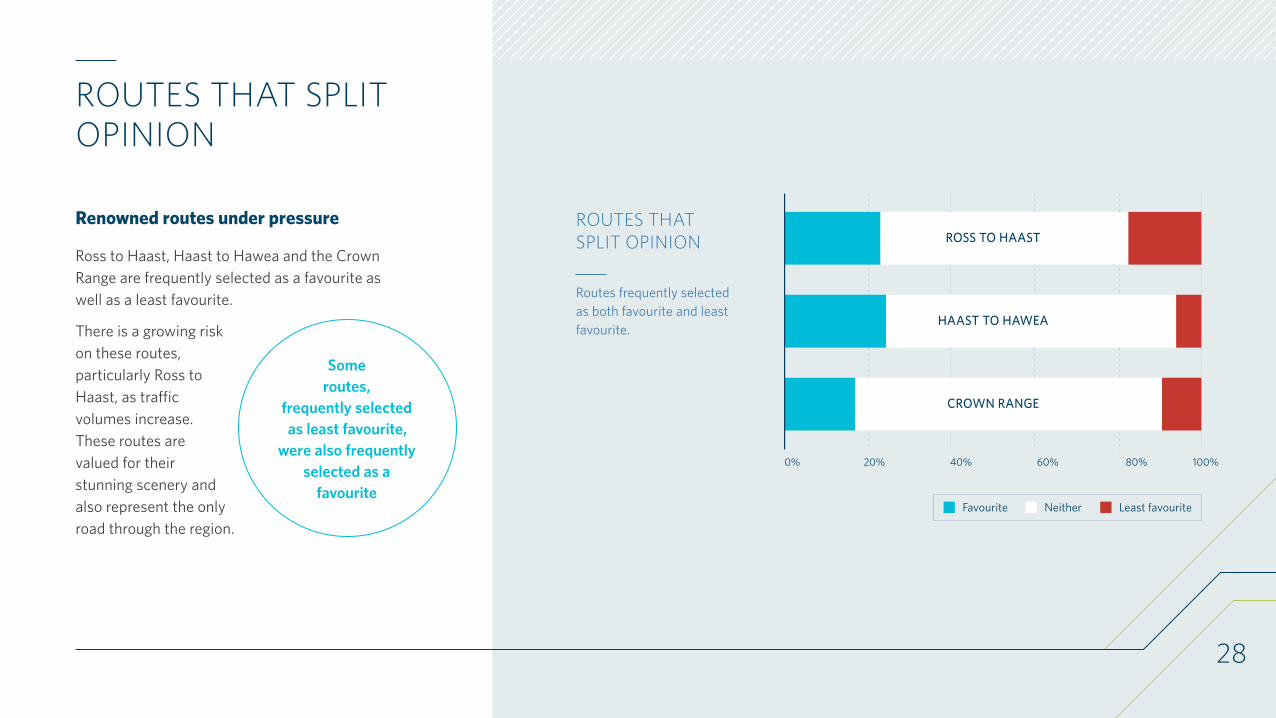
ROUTES THAT SPLIT OPINION
Renowned routes under pressure
Ross to Haast, Haast to Hawea and the Crown Range are frequently selected as a favourite as well as a least favourite.
There is a growing risk on these routes, particularly Ross to Haast, as traffic volumes increase. These routes are valued for their stunning scenery and also represent the only road through the region.
Some routes,
frequently selected as least favourite,
were also frequently selected as a
favourite
ROUTES THAT SPLIT OPINION
Routes frequently selected as both favourite and least favourite.
29
RESULTS
UNDERSTANDINGPEOPLE’S EXPERIENCES
30
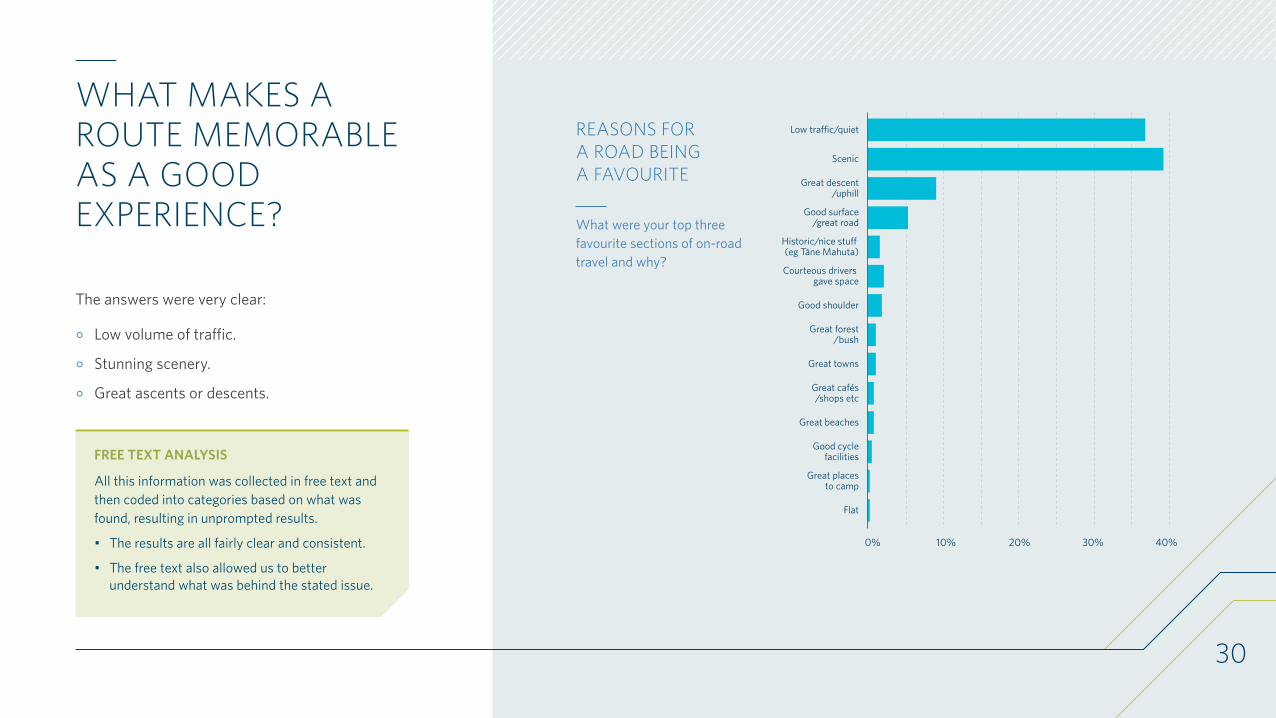
WHAT MAKES A ROUTE MEMORABLE AS A GOOD EXPERIENCE?
The answers were very clear:
◦ Low volume of traffic.
◦ Stunning scenery.
◦ Great ascents or descents.
FREE TEXT ANALYSIS
All this information was collected in free text and then coded into categories based on what was found, resulting in unprompted results.
• The results are all fairly clear and consistent.
• The free text also allowed us to better understand what was behind the stated issue.
REASONS FOR A ROAD BEING A FAVOURITE
What were your top three favourite sections of on-road travel and why?
0% 10% 20% 30% 40%
Low tra�c/quiet
Scenic
Great descent/uphill
Good surface/great road
Historic/nice stu� (eg Tāne Mahuta)
Courteous drivers gave space
Good shoulder
Great forest/bush
Great towns
Great cafés/shops etc
Great beaches
Good cyclefacilities
Great placesto camp
Flat
31
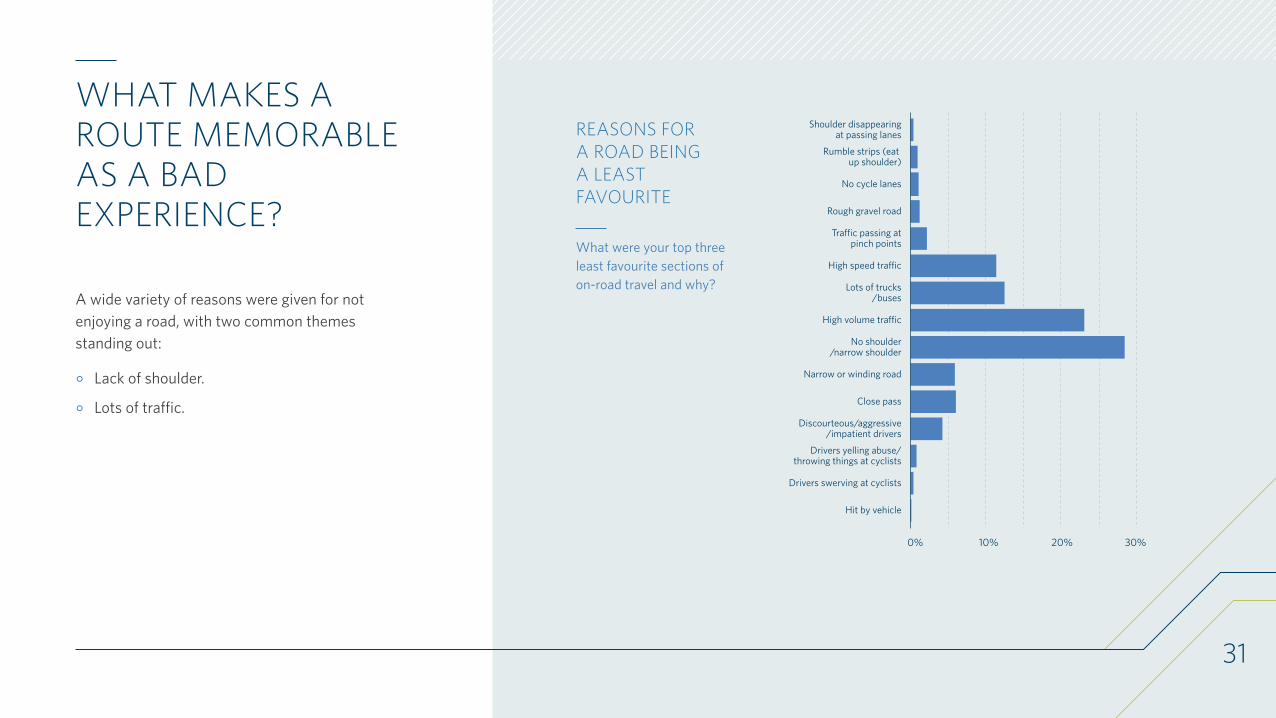
WHAT MAKES A ROUTE MEMORABLE AS A BAD EXPERIENCE?
A wide variety of reasons were given for not enjoying a road, with two common themes standing out:
◦ Lack of shoulder.
◦ Lots of traffic.
0% 10% 20% 30%
Hit by vehicle
Drivers swerving at cyclists
Drivers yelling abuse/throwing things at cyclists
Discourteous/aggressive/impatient drivers
Close pass
Narrow or winding road
No shoulder/narrow shoulder
High volume tra�c
Lots of trucks/buses
High speed tra�c
Tra�c passing atpinch points
Rough gravel road
No cycle lanes
Rumble strips (eat up shoulder)
Shoulder disappearingat passing lanesREASONS FOR
A ROAD BEING A LEAST FAVOURITE
What were your top three least favourite sections of on-road travel and why?
32
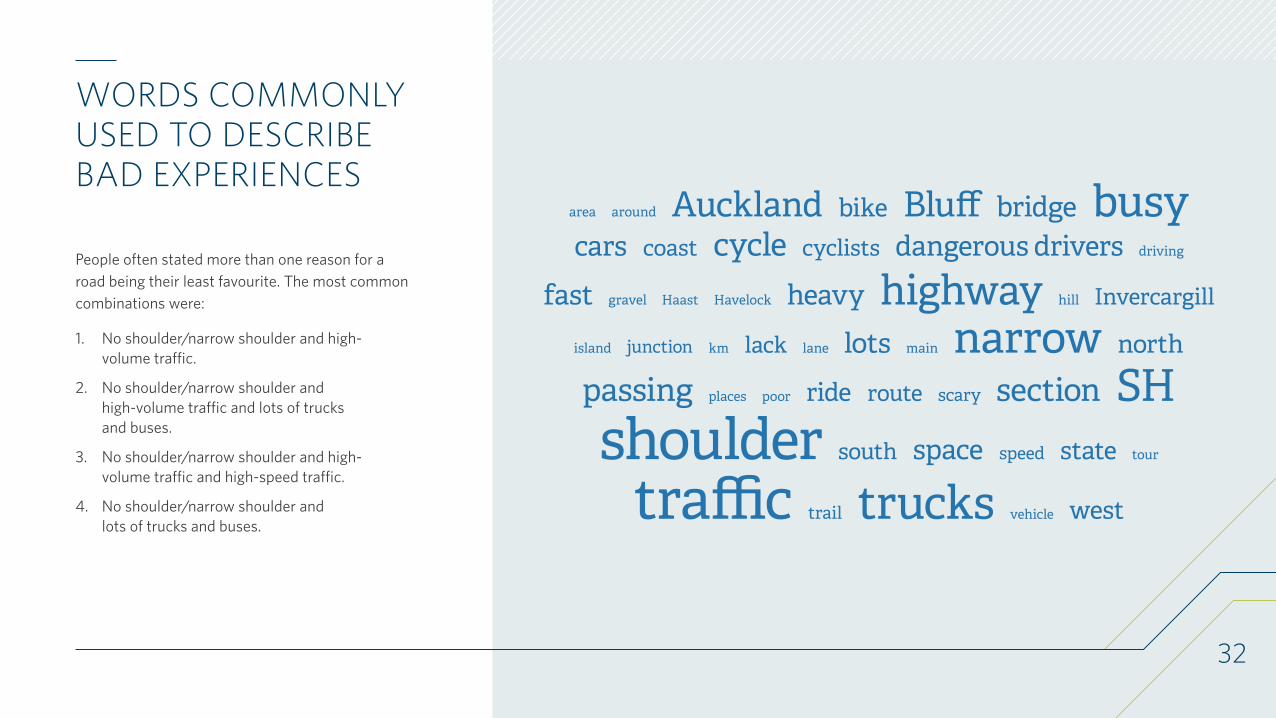
WORDS COMMONLY USED TO DESCRIBE BAD EXPERIENCES
People often stated more than one reason for a road being their least favourite. The most common combinations were:
1. No shoulder/narrow shoulder and high-volume traffic.
2. No shoulder/narrow shoulder and high-volume traffic and lots of trucks and buses.
3. No shoulder/narrow shoulder and high-volume traffic and high-speed traffic.
4. No shoulder/narrow shoulder and lots of trucks and buses.
33
RESULTS
CRASHES AND NEAR MISSES
34
CRASHES
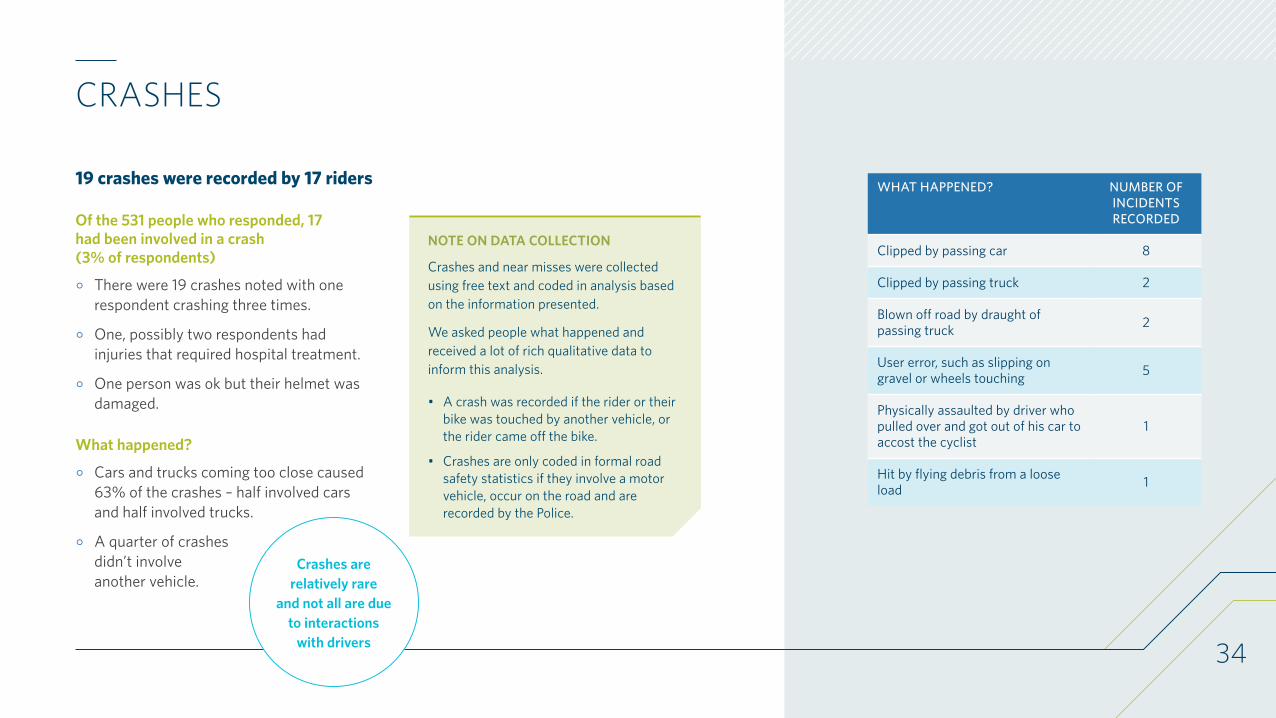
19 crashes were recorded by 17 riders
Of the 531 people who responded, 17 had been involved in a crash (3% of respondents)
◦ There were 19 crashes noted with one respondent crashing three times.
◦ One, possibly two respondents had injuries that required hospital treatment.
◦ One person was ok but their helmet was damaged.
What happened?
◦ Cars and trucks coming too close caused 63% of the crashes – half involved cars and half involved trucks.
◦ A quarter of crashes didn’t involve another vehicle.
NOTE ON DATA COLLECTION
Crashes and near misses were collected using free text and coded in analysis based on the information presented.
We asked people what happened and received a lot of rich qualitative data to inform this analysis.
• A crash was recorded if the rider or their bike was touched by another vehicle, or the rider came off the bike.
• Crashes are only coded in formal road safety statistics if they involve a motor vehicle, occur on the road and are recorded by the Police.
Crashes are relatively rare
and not all are due to interactions
with drivers
WHAT HAPPENED? NUMBER OF INCIDENTS RECORDED
Clipped by passing car 8
Clipped by passing truck 2
Blown off road by draught of passing truck 2
User error, such as slipping on gravel or wheels touching 5
Physically assaulted by driver who pulled over and got out of his car to accost the cyclist
1
Hit by flying debris from a loose load 1
35
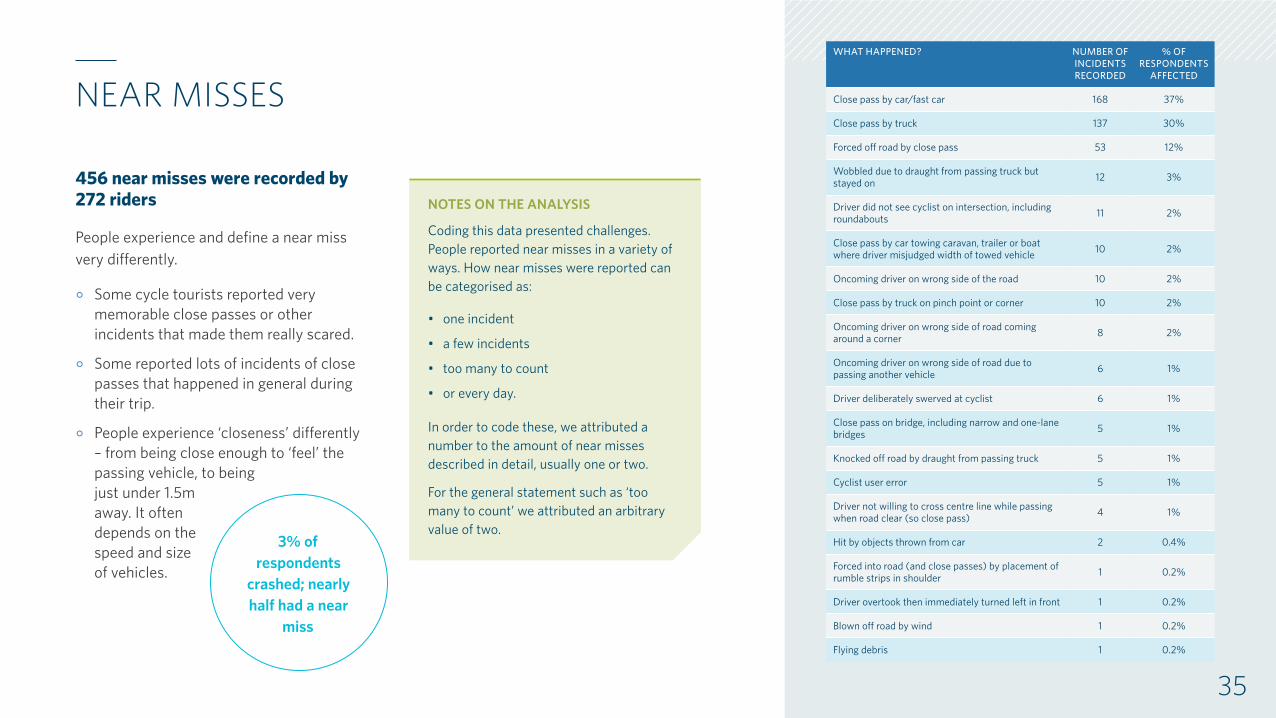
NEAR MISSES
456 near misses were recorded by 272 riders
People experience and define a near miss very differently.
◦ Some cycle tourists reported very memorable close passes or other incidents that made them really scared.
◦ Some reported lots of incidents of close passes that happened in general during their trip.
◦ People experience ‘closeness’ differently – from being close enough to ‘feel’ the passing vehicle, to being just under 1.5m away. It often depends on the speed and size of vehicles.
NOTES ON THE ANALYSIS
Coding this data presented challenges. People reported near misses in a variety of ways. How near misses were reported can be categorised as:
• one incident
• a few incidents
• too many to count
• or every day.
In order to code these, we attributed a number to the amount of near misses described in detail, usually one or two.
For the general statement such as ‘too many to count’ we attributed an arbitrary value of two.
3% of respondents
crashed; nearly half had a near
miss
WHAT HAPPENED? NUMBER OF INCIDENTS RECORDED
% OF RESPONDENTS
AFFECTED
Close pass by car/fast car 168 37%
Close pass by truck 137 30%
Forced off road by close pass 53 12%
Wobbled due to draught from passing truck but stayed on 12 3%
Driver did not see cyclist on intersection, including roundabouts 11 2%
Close pass by car towing caravan, trailer or boat where driver misjudged width of towed vehicle 10 2%
Oncoming driver on wrong side of the road 10 2%
Close pass by truck on pinch point or corner 10 2%
Oncoming driver on wrong side of road coming around a corner 8 2%
Oncoming driver on wrong side of road due to passing another vehicle 6 1%
Driver deliberately swerved at cyclist 6 1%
Close pass on bridge, including narrow and one-lane bridges 5 1%
Knocked off road by draught from passing truck 5 1%
Cyclist user error 5 1%
Driver not willing to cross centre line while passing when road clear (so close pass) 4 1%
Hit by objects thrown from car 2 0.4%
Forced into road (and close passes) by placement of rumble strips in shoulder 1 0.2%
Driver overtook then immediately turned left in front 1 0.2%
Blown off road by wind 1 0.2%
Flying debris 1 0.2%
36
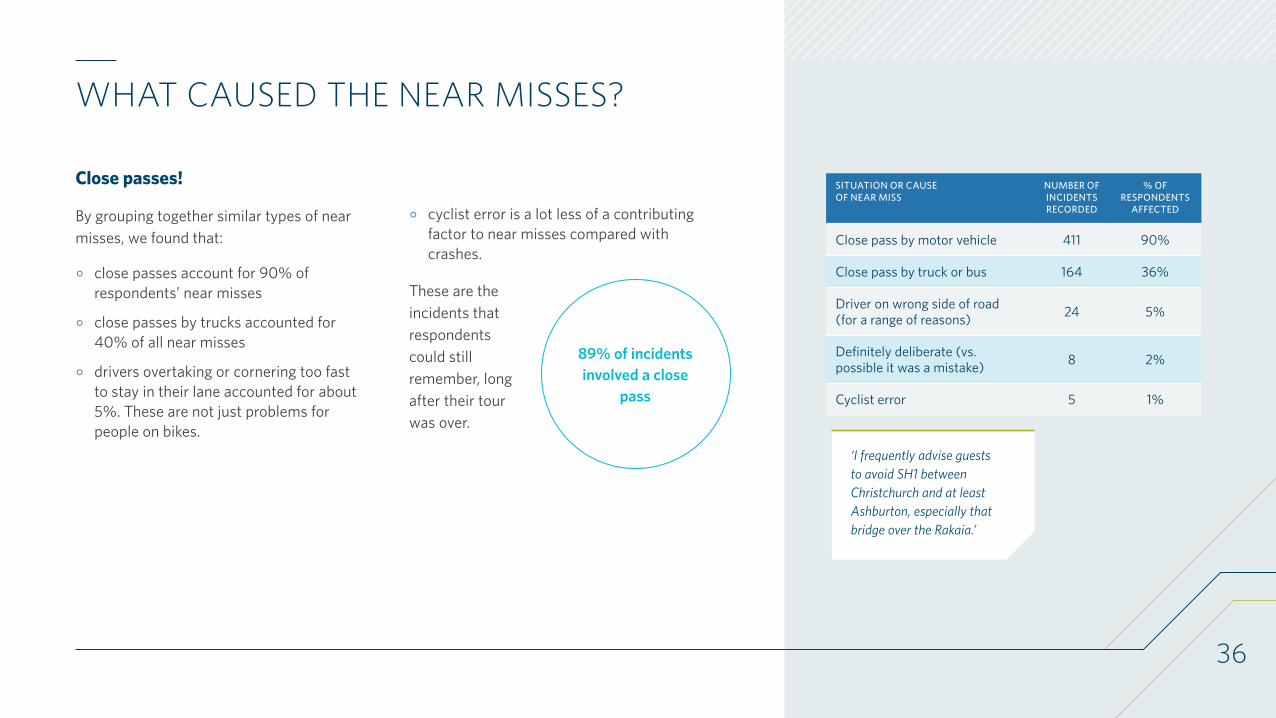
WHAT CAUSED THE NEAR MISSES?
Close passes!
By grouping together similar types of near misses, we found that:
◦ close passes account for 90% of respondents’ near misses
◦ close passes by trucks accounted for 40% of all near misses
◦ drivers overtaking or cornering too fast to stay in their lane accounted for about 5%. These are not just problems for people on bikes.
◦ cyclist error is a lot less of a contributing factor to near misses compared with crashes.
These are the incidents that respondents could still remember, long after their tour was over.
89% of incidents involved a close
pass
SITUATION OR CAUSE OF NEAR MISS
NUMBER OF INCIDENTS RECORDED
% OF RESPONDENTS
AFFECTED
Close pass by motor vehicle 411 90%
Close pass by truck or bus 164 36%
Driver on wrong side of road (for a range of reasons) 24 5%
Definitely deliberate (vs. possible it was a mistake) 8 2%
Cyclist error 5 1%
‘I frequently advise guests to avoid SH1 between Christchurch and at least Ashburton, especially that bridge over the Rakaia.’
37
HOW DO NEAR MISSES ALIGN WITH THE LEAST FAVOURITE ROADS?
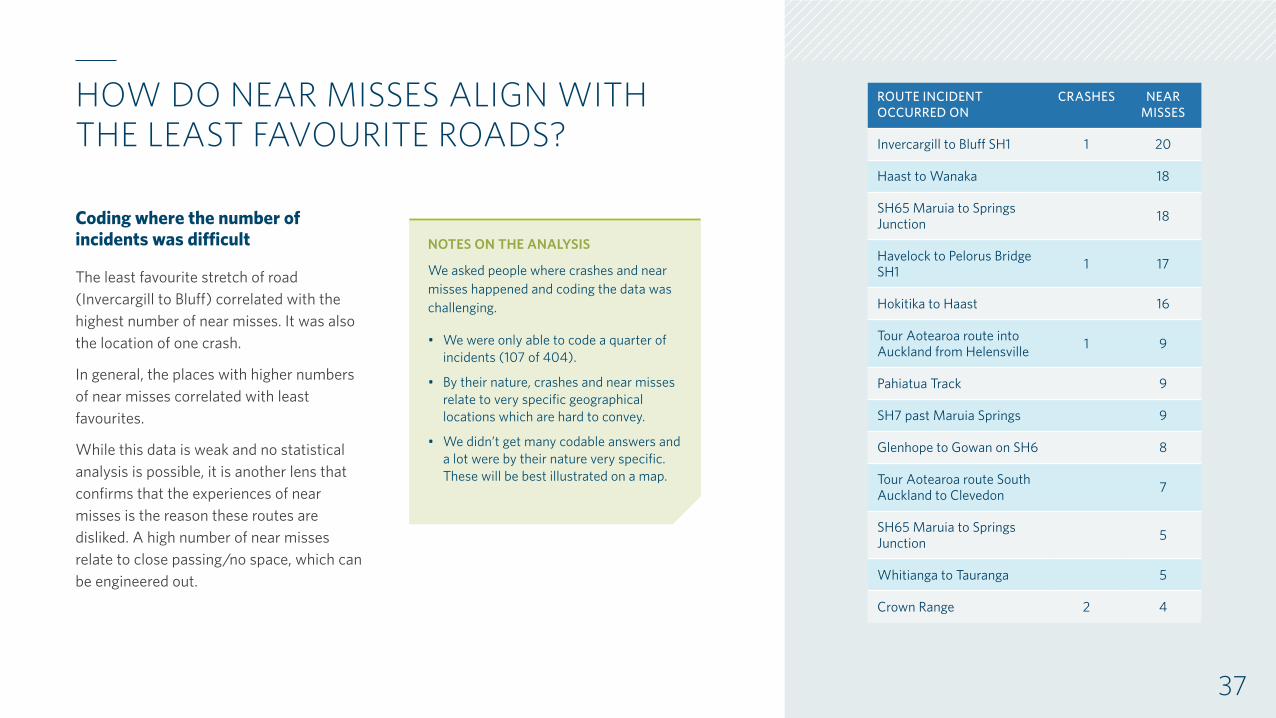
Coding where the number of incidents was difficult
The least favourite stretch of road (Invercargill to Bluff) correlated with the highest number of near misses. It was also the location of one crash.
In general, the places with higher numbers of near misses correlated with least favourites.
While this data is weak and no statistical analysis is possible, it is another lens that confirms that the experiences of near misses is the reason these routes are disliked. A high number of near misses relate to close passing/no space, which can be engineered out.
NOTES ON THE ANALYSIS
We asked people where crashes and near misses happened and coding the data was challenging.
• We were only able to code a quarter of incidents (107 of 404).
• By their nature, crashes and near misses relate to very specific geographical locations which are hard to convey.
• We didn’t get many codable answers and a lot were by their nature very specific. These will be best illustrated on a map.
ROUTE INCIDENT OCCURRED ON
CRASHES NEAR MISSES
Invercargill to Bluff SH1 1 20
Haast to Wanaka 18
SH65 Maruia to Springs Junction 18
Havelock to Pelorus Bridge SH1 1 17
Hokitika to Haast 16
Tour Aotearoa route into Auckland from Helensville 1 9
Pahiatua Track 9
SH7 past Maruia Springs 9
Glenhope to Gowan on SH6 8
Tour Aotearoa route South Auckland to Clevedon 7
SH65 Maruia to Springs Junction 5
Whitianga to Tauranga 5
Crown Range 2 4
38
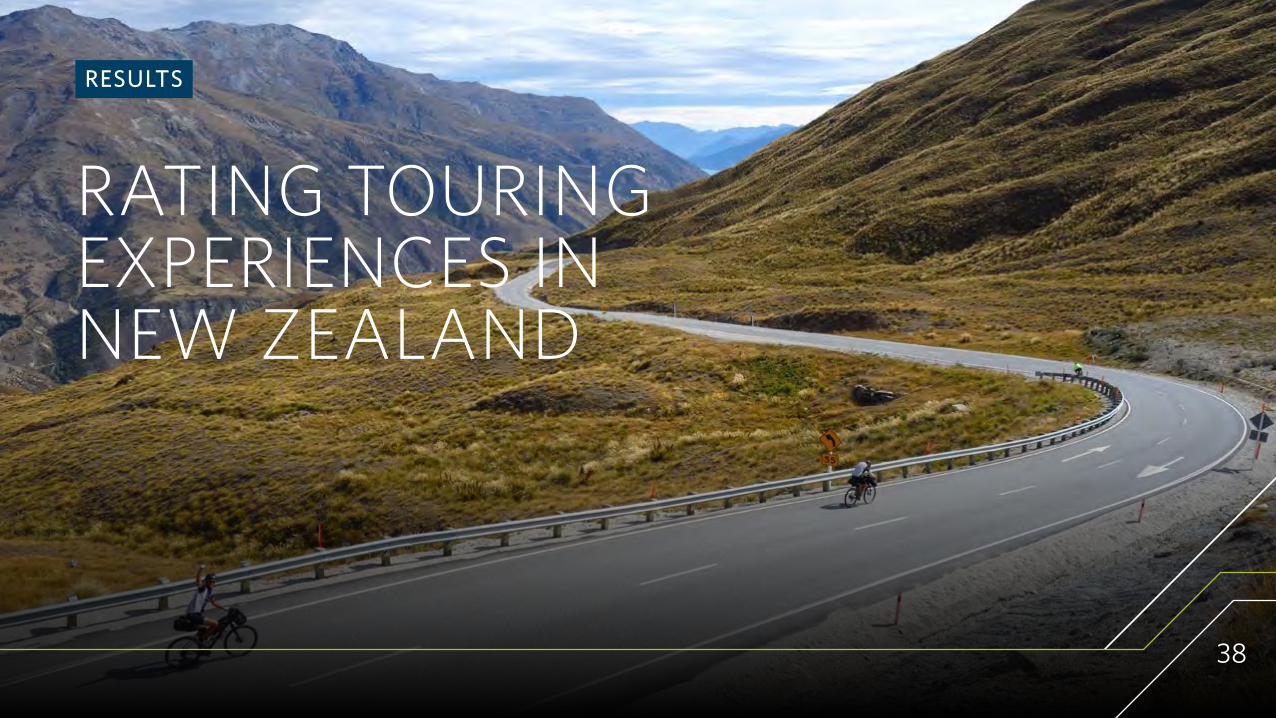
RESULTS
RATING TOURING EXPERIENCES IN NEW ZEALAND
39
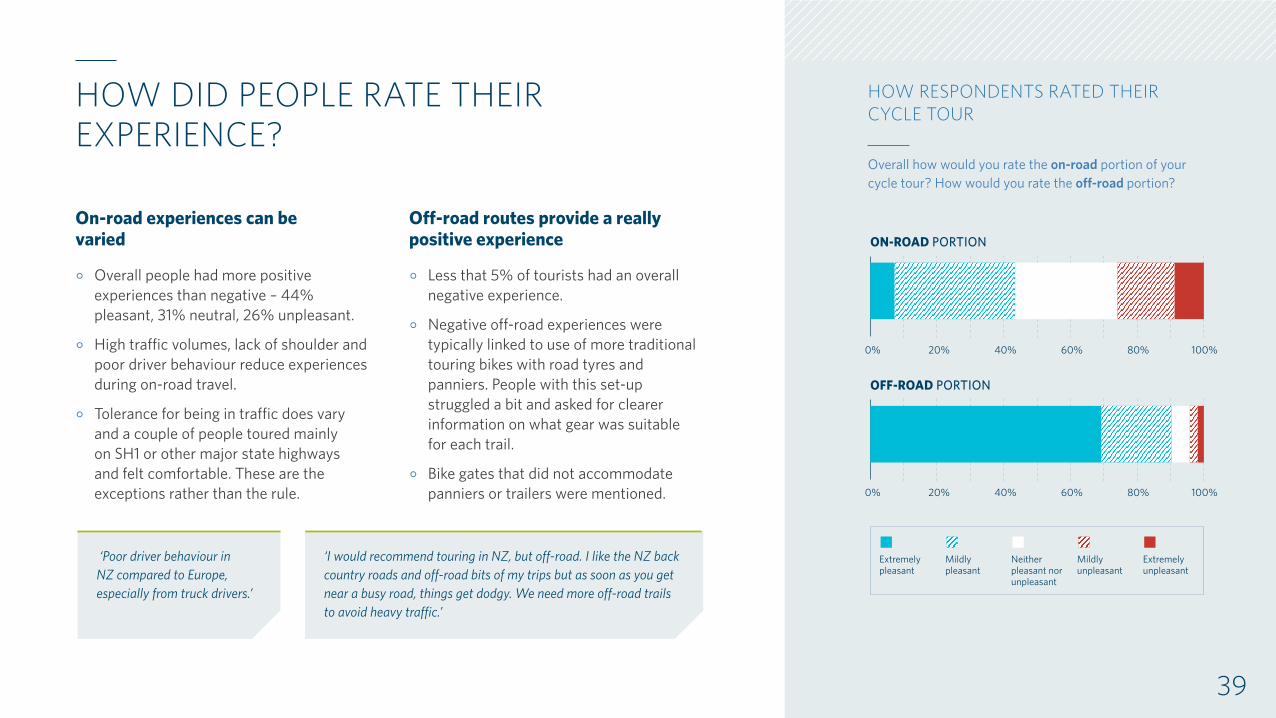
HOW RESPONDENTS RATED THEIR CYCLE TOUR
Overall how would you rate the on-road portion of your cycle tour? How would you rate the off-road portion?
Extremelyunpleasant
Neitherpleasant norunpleasant
Extremelypleasant
Mildly pleasant
0% 20% 40% 60% 80% 100%
0% 20% 40% 60% 80% 100%
ON-ROAD PORTION
OFF-ROAD PORTION
Mildlyunpleasant
HOW DID PEOPLE RATE THEIR EXPERIENCE?
On-road experiences can be varied
◦ Overall people had more positive experiences than negative – 44% pleasant, 31% neutral, 26% unpleasant.
◦ High traffic volumes, lack of shoulder and poor driver behaviour reduce experiences during on-road travel.
◦ Tolerance for being in traffic does vary and a couple of people toured mainly on SH1 or other major state highways and felt comfortable. These are the exceptions rather than the rule.
Off-road routes provide a really positive experience
◦ Less that 5% of tourists had an overall negative experience.
◦ Negative off-road experiences were typically linked to use of more traditional touring bikes with road tyres and panniers. People with this set-up struggled a bit and asked for clearer information on what gear was suitable for each trail.
◦ Bike gates that did not accommodate panniers or trailers were mentioned.
‘Poor driver behaviour in NZ compared to Europe, especially from truck drivers.’
‘I would recommend touring in NZ, but off-road. I like the NZ back country roads and off-road bits of my trips but as soon as you get near a busy road, things get dodgy. We need more off-road trails to avoid heavy traffic.’

40
WOULD PEOPLE RECOMMEND CYCLING TOURING IN NZ?
Most riders are likely to recommend cycle touring in NZ
◦ Many respondents indicated they personally intended to cycle tour more.
◦ People suggested that better information on what the on-road experience would be like would be helpful.
◦ Some talked about timing their riding to avoid the traffic, either by avoiding the holiday season or riding first thing in the morning on busy routes.
◦ Some said they could not recommend it because of New Zealand drivers or would only recommend the quieter roads or off-road routes.
◦ Others mentioned a lack of facilities such as campsites and toilets in some places.
HOW LIKELY ARE YOU TO RECOMMEND CYCLE TOURING IN NZ?
0% 20% 40% 60% 80% 100%
Very likely Likely Neutral
Unlikely
Very unlikely
‘Highlights just being on the road and in small town NZ - talking to the locals. Lowlights only the traffic/poor room for cyclist issues.’ ‘NZ is doing a fabulous job developing cycle trails which take people to parts of the country they wouldn’t otherwise visit which is providing new life for small communities and providing endless opportunities for those prepared to take up the challenge.’
CONCLUSIONS
BRINGING IT ALL TOGETHER
41
42
WHAT ARE PEOPLE’S BAD EXPERIENCES TELLING US?
Infrastructure and traffic volumes
Lack of shoulder/narrow shoulder
‘Lack of shoulder/narrow shoulder’ is the primary reason why people say they did not enjoy cycling on a specific section of road, but what does this mean?
◦ The comments indicated that what respondents mean by this is that lack of shoulder or the narrowness of the road, means there is nowhere for the cyclist to go if the person driving chooses to pass too close to them.
◦ This relates to traffic passing from behind as well as coming towards them. For example, when an oncoming driver crosses the centre line when passing other cars or coming around blind corners.
◦ Narrow or no shoulders leave cyclists feeling unsafe on roads where there is traffic.
◦ In this research, this applied primarily to rural roads.
◦ A few people noted lack of cycle lanes as the issue when referring to urban roads.
The shoulder issue is greatest when combined with high traffic volumes
◦ High traffic volumes increase the risk and frequency of vehicles passing too close. Cycle tourist in these situations are very aware of traffic – some ride ready to dive for the edge of road or the ditch. This makes for a tense experience.
‘There is so much potential on NZ roads – it’s just a shame that many roads have inconsistent hard shoulders. One minute you can be riding along perfectly safely, then suddenly the shoulder disappears.’ ‘Due to lack of shoulders, generally we found on-road riding comfortable when traffic was low, and uncomfortable when there was medium to high traffic. Fortunately it was mostly low!’
43
Or with lots of trucks and buses and high speed environments
◦ Again, increased risk, high-speed traffic means less margin for error and fast trucks and buses create draughts buffeting people on bikes.
Rumble strips and other safety features
The data also revealed a couple of other physical features which effectively narrow the shoulder for cycling, particularly if they are installed unwisely. These were not raised a great deal, but are worth considering as their installation is increasing:
◦ Rumble strips that effectively narrow the shoulder.
◦ Roadside barriers that narrow the shoulder and leave people on bikes with no ditch to dive into if traffic is too close, too big or too fast.
◦ Removal of the shoulder at passing lanes – forcing the person on a bike out into multi-lane traffic where speeds are increased (people have been shown to naturally speed up in passing lanes).
The information provided in this report can help understand where people on bikes are travelling regularly, to avoid installing safety interventions in places that will have a negative impact for people on bikes.
‘New Zealand roads, particularly in rural areas can be narrow, with high speed limits and many corners. With drivers often driving at or above the speed limits in these areas (often with many blind corners), it can be extremely dangerous for a cycle tourist (and makes me plan my trips to avoid on-road sections).’
44
BEHAVIOUR AND INFRASTRUCTURE
These are functions of the road
Driver behaviour is implicit, and at times, a function of infrastructure
The behaviours of people when driving, came up less than the physical environment of the road. There is a relationship between the physical environment and behaviour. Key behavioural issues noted by respondents are:
◦ close pass
◦ discourteous/aggressive/impatient driver
◦ traffic passing at pinch points
◦ driver yelling.
We note that ‘discourteous/aggressive/impatient’ are personality traits that the person on the bike can not know about
the person driving, only infer. We can only presume that the respondents assume the drivers have these personality traits based on their behaviour, which is most likely to be not waiting to pass – putting other drivers at risk when passing, passing too close, occasionally excessive honking and hurling abuse or objects at the people on bikes. These latter behaviours seem to be relatively uncommon in the data.
We will structure the next survey to try and focus more on behaviours and less on attributed personality traits.
Just one terrifying incident can taint an entire stretch of road for a cycling tourist
The comments also made it clear that most of the people passing in cars have little impact on the a cycle tourist riding
on the road, but when road conditions and/or driver behaviour create a scary or dangerous situation, it is very memorable and can taint a whole stretch of road for a person riding a bike on the road.
‘Like most places, most NZ drivers are great. There are some good truckies. There are some truckies and car drivers that don’t realise cyclists are human beings.’ ‘It’s changed considerably since 1989 when I did my first cycle tour in NZ. This time round, in 2017, I felt very vulnerable on the road and would not recommend people touring in the road.’
45
BRINGING IT ALL TOGETHER
Space and speed
◦ The crash, near miss and least favourite responses build a picture that, when the shoulder disappears for whatever reason, cycle tourists feel more unsafe.
◦ When there are lots of vehicles passing regularly, they experience fear and increasing numbers of near misses, with some resulting in evasive action into a ditch or off the road, and a very few resulting in crashes.
◦ Speed, particularly of large vehicles like trucks and buses, create wind effects that destabilise bikes, especially when riding on the very margins of rideable space.
◦ Contrasting this is a picture that most traffic is pretty good, but one scary incident can overshadow their experience of a road and in some cases has caused a cycle tourist to stop their tour.
◦ There is also a sense that very little of this is particularly deliberate.
◦ There was some mention of drivers intentionally swerving at people on bikes, yelling abuse, hurling objects and sometimes even stopping to assault riders. However, this was much less common than close, fast passes that felt aggressive or dangerous.
‘… what is really needed, where available, is the side of these roads need to be upgraded so you are at least a metre away from traffic and not having the cars and trucks go around you. That would make the experience so much better … ‘State Highway 6 between Makarora and Haast – no shoulder, aggressive commercial drivers … Tour buses didn’t move over even when there was room and it was safe to do so.’
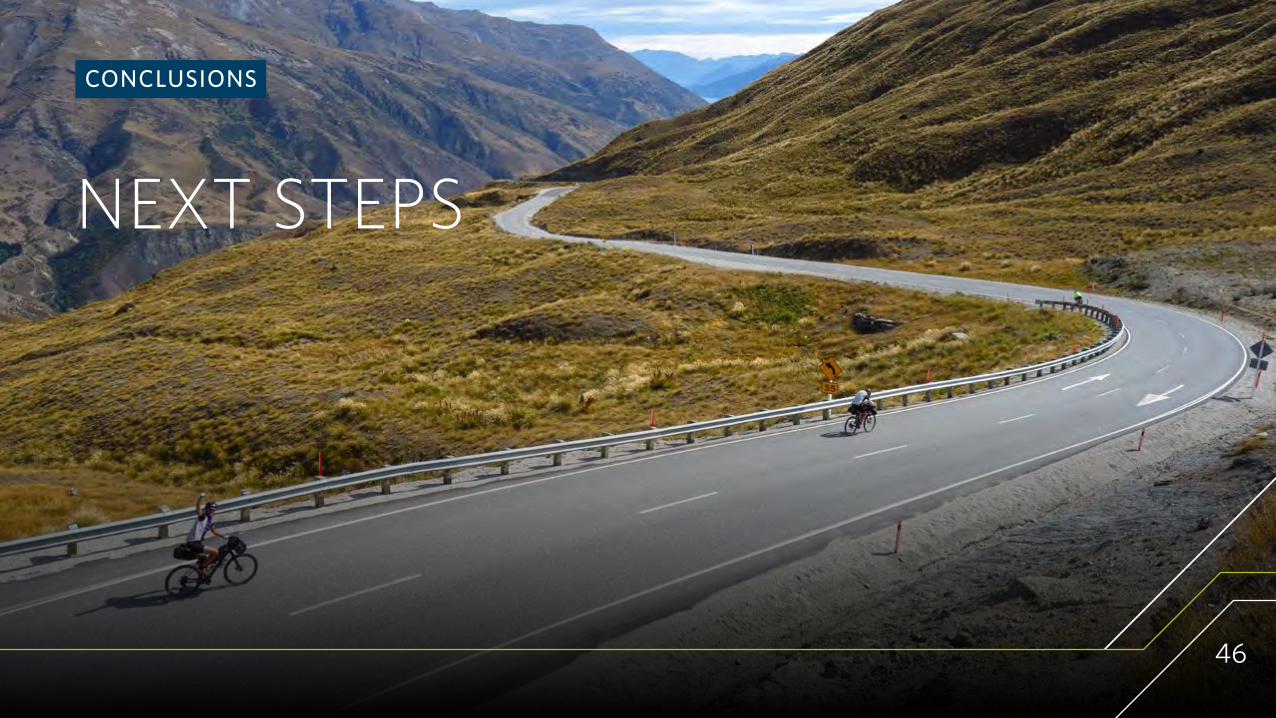
CONCLUSIONS
NEXT STEPS
46
WHAT ARE WE DOING IN RESPONSE?
1. Make improvements where possible
◦ The Transport Agency has developed a map of where cycle tourists go and which routes were most and least enjoyed from the cycle touring data.
◦ The least enjoyed maps have already helped us plan improvements, such as shoulder widening, off-road paths, warning signs and other interventions to improve experience.
2. Provide better information about the on-road experience on common cycle touring routes
◦ Some cycle tourists cycled on unpleasant roads when a quieter option was nearby, and there are some roads with high traffic volumes, high speeds and poor shoulders that we would not recommend.
◦ Many visitors and locals are already connecting towns and great rides together. There is a demand.
◦ There is not currently a resource which shows how cycling touring routes connect across the country and describe what kind of experience might be had.
◦ The Transport Agency will develop content on our website to show how cycle touring networks connect and indicate the experience level required.
3. Continue to collect and share information on cycle touring to monitor change over time as improvements are made
◦ We have launched a survey to collect data from the 2018/19 season of cycle touring and will continue to monitor cycle tourists’ experiences to measure improvements over time.
◦ We have made a number of safety improvements based on what we learnt from our first survey.
◦ We will share this work and future monitoring with our council and community stakeholders.
4. Consider how best to improve passing distances
◦ We will develop a sign plan to have ‘Pass Safely’ signs installed on main cycle touring routes.
47

WORK THE TRANSPORT AGENCY IS CURRENTLY DOING ON THE NETWORK
2018–2021
Pouto Point to Auckland – investigation and signs
Onehunga to Ardmore – design of cycle lanes and paths
Mountains to Sea – shared path from Upokongaro into Whanganui
Pahiatua Track – shoulder widening on uphill
Havelock to Pelorus – shoulder widening in westward direction
Punakaiki – shared path from track ends
West Coast Highway – investigation, safety signs and shoulder widening
SH7 Hurunui – shoulder widening and safety signs complete
Christchurch to Little River Rail Trail – off-road path
Lindis Valley – shoulder widening and signs
Crown Range – safety signs
Queenstown Trails – Nevis Bluff shared path
SH1 Waihola to Dunedin – investigation and design of cycle route
Invercargill to Bluff – off-road path being built
1
2
3
4
5
6
7
8
9
10
11
12
13
14
14
13
12 11
10
9
8
6
7
3
12
5
4
48