Embed Size (px)
Citation preview

Zhiyong MaSchool of Energy, Power and
Mechanical Engineering,
North China Electric Power University,
Beijing 102206, China
Yibing LiuSchool of Energy, Power and
Mechanical Engineering,
North China Electric Power University,
Beijing 102206, China;
Key Laboratory of Condition Monitoring and
Control for Power Plant Equipment
of Ministry of Education,
North China Electric Power University,
Beijing 102206, China
Dameng WangSchool of Energy, Power and
Mechanical Engineering,
North China Electric Power University,
Beijing 102206, China
Wei Teng1
School of Energy, Power and
Mechanical Engineering,
North China Electric Power University,
Beijing 102206, China;
Key Laboratory of Condition Monitoring and
Control for Power Plant Equipment of
Ministry of Education,
North China Electric Power University,
Beijing 102206, China
e-mail: [email protected]
Andrew KusiakMechanical and Industrial Engineering,
3131 Seamans Center,
The University of Iowa,
Iowa City, IA 52242-1527
Cyclostationary Analysisof a Faulty Bearingin the Wind TurbineBearing faults occur frequently in wind turbines, thus resulting in an unplanned down-time and economic loss. Vibration signal collected from a failing bearing exhibits modu-lation phenomenon and “cyclostationarity.” In this paper, the cyclostationary analysis isutilized to the vibration signal from the drive-end of the wind turbine generator. Faultfeatures of the inner and outer race become visible in the frequency–cyclic frequencyplane. Such fault signatures can not be produced by the traditional demodulation meth-ods. Analysis results demonstrate effectiveness of the cyclostatonary analysis. The disas-sembled faulty bearing visualizes the fault. [DOI: 10.1115/1.4035846]
Keywords: bearing fault detection, wind turbine generator, cyclostationarity, faultanalysis
1 Introduction
The rapid expansion of wind energy has elevated the impor-tance of reliability of wind turbines. To guarantee power qualityand reduce maintenance cost, health monitoring systems havebeen introduced for monitoring conditions of critical subassem-blies of wind turbines and diagnosing faults [1–3].
Bearings support revolving shafts in the gearbox and generatorof a wind turbine. The bearing at the drive-end of the generator isthe most fragile [4,5] as it is affected by the alternating loadscaused by the fluctuation of power, shaft corrosion, and the elec-tromagnetic excitation. In addition of these factors, any misalign-ment between the high speed shaft of a gearbox and the generatorshaft may lead to the bearing failure. Shaft misalignment is usu-ally caused by temperature variation or looseness of the founda-tion bolt.
Different approaches have been developed to detect bearingfaults in wind turbines. Watson et al. [6] applied wavelets to
analyze the frequency components of the power series. Theyderived fault characteristics of the generator bearing. Kusiak andVerma [7] used historical temperature measurements to develop aneural network model predicting over-temperature faults of abearing. Yang et al. [8] established a relationship between thebearing temperature and active power, and derived a fitting coeffi-cient describing different fault levels. The cited above resultshave been derived based on the data collected by the supervisorycontrol and data acquisition (SCADA) system, thus, avoidingadditional hardware and software cost associated with the need tocollect vibration data. However, the SCADA data does not sufficeto locate a concrete bearing fault.
To date, vibration analysis remains the primary method to diag-nose bearing faults. The cost of the acquisition system is compen-sated by the ease of fault analysis. Using vibration data, Antoniand Randall [9] determined the optimal demodulation frequencyband of a faulty bearing with spectral kurtosis. Autoregressivemodel and minimum entropy deconvolution can restrain the peri-odic components from the gear mesh and background noise[10,11]. Both were adopted to evidence the impacts of fault bear-ing in a vibration signal. Randall et al. [12] presented cepstrumprewhitening to eliminate the deterministic components in thecepstrum domain, and applied it to diagnose bearing faults undervariable speed conditions [13]. Rai and Mohanty [14] used the
1Corresponding author.Contributed by the Solar Energy Division of ASME for publication in the
JOURNAL OF SOLAR ENERGY ENGINEERING: INCLUDING WIND ENERGY AND BUILDING
ENERGY CONSERVATION. Manuscript received December 11, 2016; final manuscriptreceived January 13, 2017; published online February 8, 2017. Assoc. Editor: YvesGagnon.
Journal of Solar Energy Engineering JUNE 2017, Vol. 139 / 031006-1Copyright VC 2017 by ASME
Downloaded From: http://solarenergyengineering.asmedigitalcollection.asme.org/ on 02/09/2017 Terms of Use: http://www.asme.org/about-asme/terms-of-use

fast Fourier transform (FFT) and the Hilbert–Huang transform(HHT) to demonstrate a bearing fault using the nonstationaryproperties of HHT. Park et al. [15] proposed the minimumvariance-based cepstrum for early fault detection in automotiveball bearings. Teng et al. [16] utilized the complex Morlet waveletto demodulate vibration signals from the direct drive wind turbineand detect roller defects of the rear bearing.
The emerging bearing fault reflects itself in the modulation phe-nomenon known as the second-order cyclostationarity [17,18].Therefore, the second-order cyclostationary analysis is regardedas an effective tool for processing the vibration signal associatedwith a bearing fault. Gardner [19–21] described the foundation ofcyclostationary analysis, and proposed important concepts such asspectral correlation and spectral redundancy. Antoni [22–24]adopted the theory of cyclostationary analysis to fault diagnosis ofmechanical systems, e.g., a diesel engine, a hydraulic pump, and agearbox.
To arrive at pure cyclostationarity, Raad et al. [25] computedhigh order cyclic cumulants, thus, excluding the interference fromlower order statistics. However, computing cyclic cumulants istime-consuming for a long data series. The vibration signals fromfaulty bearing in wind turbine generator represent second-ordercyclostationarity, which was not considered in the past researchon diagnostic of wind turbines [26,27]. The moment-based cyclo-stationary analysis can detect this cyclostationarity caused byfaulty bearing, and it is highly efficient. In this paper, the cyclosta-tionary analysis based on cyclic moment is applied to analyze thevibration signal originated from a faulty bearing located at thedrive-end of a generator. In Sec. 2, the structure of a wind turbinedrive train is described, the offline vibration monitoring system isintroduced, and the fault feature frequencies are discussed. In Sec.3, the theoretical aspects of cyclostationary analysis are referred.An operating 1.5 MW generator with a faulty bearing is tested andanalyzed in Sec. 4. The disassembled bearing visualizes the bear-ing fault. Section 5 concludes the paper.
2 Wind Turbine Generator
2.1 Wind Turbine Drive Train. Wind turbines fall into twocategories: direct-drive turbines (DDT) and turbines with gear-boxes. The direct-drive turbines use full energy conversion pro-duced by synchronous generators. The turbine equipped with agearbox (see Fig. 1) usually uses a double-fed induction generator(DFIG). Such generator calls for partial energy conversion. Thebearing at the drive-end of the generator is prone to failures due toa misalignment between the generator shaft and the high-speedshaft of the gearbox, shaft imbalance, or the distortion due to ther-mal expansion.
Vibration analysis is frequently applied in the detection of gearand bearing faults. There are seven acceleration transducersinstalled at the drive train of the wind turbine in Fig. 1. Transducer1 monitors the blades and the front main bearing. Transducers 2through 7 sense the signal from the rear main bearing, planetarystage, intermediate stage, high speed stage of gearbox, bearing atdrive-end, and bearing at the non-drive-end of the generator,
respectively. In this paper, the vibration signal from transducer 6will be analyzed and discussed.
2.2 Bearing Fault Features. Rolling bearing is a rotatingsubassembly composed of an inner race, outer race, rolling ele-ments, and a cage. Due to the relative rotation between the rollingelements and other parts, a bearing defect generates periodicimpulses. When a fault arises on the inner race of a bearing, thefrequency of the impulses from the balls and the inner race iscalled the ball pass frequency of inner race (BPFI). Similarly, thefrequency of the impulses from the balls and the faulty outer raceis called the ball pass frequency of outer race (BPFO), the fre-quency caused by the faulty ball striking other parts is called ballspin frequency of rolling element (BSF), the frequency of theimpulses from the balls and the faulty cage is called fundamentaltrain frequency (FTF). BPFI, BPFO, BSF, and FTF are computedfrom expressions (1)–(4), respectively [16,24]
BPFI ¼ frNb
21þ d
Dcos u
� �(1)
BPFO ¼ frNb
21� d
Dcos u
� �(2)
BSF ¼ frD
2d1� d
Dcos u
� �2 !
(3)
FTF ¼ fr2
1� d
Dcos u
� �(4)
where fr is the rotational frequency of the shaft assembled withinner race, d is the ball diameter, D is the pitch diameter, Nb is thenumber of the balls, and u is the bearing contact angle; u is theangle between the normal through the contact points and the lineperpendicular to the axis line of the bearing. The structure of ballbearings is shown in Fig. 2.
3 Cyclostationary Analysis
If the statistics of vibration signal x(t) are periodic, x(t) isregarded as cyclostationary. Take the nth-moment Mnxðt; s1;…;sn�1Þ ¼ EfxðtÞxðt� s1Þ…1xðt� sn�1Þg with a cyclic period T
Fig. 1 Structure of wind turbine drive trainFig. 2 Structure of ball bearings: (a) angular contact ball bear-ing and (b) deep groove ball bearing
031006-2 / Vol. 139, JUNE 2017 Transactions of the ASME
Downloaded From: http://solarenergyengineering.asmedigitalcollection.asme.org/ on 02/09/2017 Terms of Use: http://www.asme.org/about-asme/terms-of-use
for an example, it can be expressed in the cyclic frequencydomain as the Fourier series [25] in the below equation
Mnxðt; s1;…; sn�1Þ ¼X
a
Manxðs1;…; sn�1Þ ej2pat (5)
where a is defined as cyclic frequency, s1;…; sn�1 are time lagsand Ma
nxðs1;…; sn�1Þ is nth-order cyclic moments. At differentorders, they are expressed in Eqs. (6)–(9)
Ma1x ¼ lim
T!1
1
T
ðT2
�T2
M1x tð Þe�j2patdt (6)
Ma2x sð Þ ¼ lim
T!1
1
T
ðT2
�T2
M2x t; sð Þe�j2patdt (7)
Ma3x s1; s2ð Þ ¼ lim
T!1
1
T
ðT2
�T2
M3x t; s1; s2ð Þe�j2patdt (8)
Ma4x s1; s2; s3ð Þ ¼ lim
T!1
1
T
ðT2
�T2
M4x t; s1; s2; s3ð Þe�j2patdt (9)
Gears and bearings are symmetric, and therefore, their vibrationsignal exhibits the first-order cyclostationary characteristic. More-over, once a gear or a bearing becomes affected by a fault, thereare inevitable modulation components in the vibration signalwhose second-order moment is periodic [17,18]. Therefore, thesecond-order cyclostationary analysis is useful in the detection ofgear and bearing faults.
The second-order instantaneous moment of the vibration signal,also called the instantaneous auto-correlation function with sym-metry structure is defined in the below equation
M2x t; sð Þ ¼ E x tþ s2
� �x� t� s
2
� �� �(10)
where s is time lag, and x* is the complex conjugate of x. Substi-tuting the expectation operation in expression (10) with the meanvalue during the finite sampling range T, the second-order cyclicmoment in expression (7) can be rewritten as shown in the belowequation
Ma2x sð Þ ¼ lim
T!1
1
T
ðT2
�T2
x tþ s2
� �x� t� s
2
� �e�j2patdt
¼ x tþ s2
� �x� t� s
2
� �e�j2pat
� �t
(11)
where the hit denotes the inner product operation. The second-order cyclic moment above can be transformed to the cyclic spec-trum density using Fourier transform in the frequency domain asshown in the below equation
Sa2xðf Þ ¼
ð1�1
Ma2xðsÞe�j2pf sds (12)
To estimate the cyclic spectrum density using finite time series,the second-order cyclic moment [28] is rewritten according to thebelow equation
Ma2x sð Þ ¼ u tþ s
2
� �v� t� s
2
� �� �t
(13)
where
uðtÞ ¼ xðtÞe�jpat
vðtÞ ¼ xðtÞejpat
�(14)
The relationship between the correlation function and convolution[28] is shown in the below equation
Ma2xðsÞ ¼ uðsÞ � vð�sÞ (15)
where * denotes the convolution operator. Therefore, the cyclicspectrum density can be estimated from the below equation
Sa2x fð Þ ¼ lim
T!1
U fð Þ � V� fð ÞT
(16)
where
U fð Þ ¼ F u tð Þ½ � ¼ X f þ a2
� �
V fð Þ ¼ F v tð Þ½ � ¼ X f � a2
� �8>>><>>>:
(17)
V�ðf Þ is the conjugate of Vðf Þ; F denotes the Fourier transformoperator; and X(f) is the Fourier transform of x(t).
The cyclic coherence function (CCF) that measures the strengthof cyclostationarity at cyclic frequency [23] is defined in thebelow equation
Ca2x fð Þ ¼ U fð Þ � V� fð Þffiffiffiffiffiffiffiffiffiffiffiffiffiffiffiffiffiffiffiffiffiffiffiffiffiffiffiffi
U2 fð Þ � V2 fð Þp (18)
The structure of the second-order cyclic moment in expression(11) is similar to the short time Fourier transform (STFT) if theauto-correlation function is substituted by a windowed signal, andcyclic frequency a is substituted by frequency f. The STFT [29] isdefined in the below equation
STFTðs; f Þ ¼ð1�1
xðtÞh�ðt� sÞe�j2pftdt (19)
As a variant of Fourier transform, STFT is invented to analyzenonstationary signal whose frequency varies in a short time. It istroublesome for STFT to reveal the fault information because thefault frequency is usually convoluted by carrier frequency. More-over, the frequency resolution in STFT is rough due to the handfulof data in a windowed signal. By contrast, the second-order cyclicmoment in expression (11) can obtain the cyclostationarity offaulty bearing directly through computing the Fourier transformof auto-correlation function in cyclic domain.
4 Case Study
4.1 Testing Conditions. The rated power of the wind turbinestudied in this research is 1.5 MW. The corresponding rotationalfrequency of the generator is of about 30 Hz. The offline vibrationanalysis was performed twice a year on the turbine. Two differenttesting conditions were adopted. At condition C1, the rotationalfrequency of the generator was 28.13 Hz, and the frequency was24.84 Hz at C2 when the test was carried on 6 months earlier. Thesampling frequency was 25,600 Hz. The damaged bearing at thedrive-end of the generator was 6330 C3 SKF. According to
Table 1 Bearing feature frequencies at the drive-end of thegenerator
fr FTF BSF BPFO BPFI
Ratio to fr 1 0.399 2.37 3.59 5.41Feature frequency at C1 28.13 11.22 66.67 100.98 152.18Feature frequency at C2(6 months earlier)
24.84 9.91 58.87 89.17 134.38
Journal of Solar Energy Engineering JUNE 2017, Vol. 139 / 031006-3
Downloaded From: http://solarenergyengineering.asmedigitalcollection.asme.org/ on 02/09/2017 Terms of Use: http://www.asme.org/about-asme/terms-of-use

Fig. 3 Time signal at the drive-end of a generator: (a) time signal, (b) power spectrum,(c) envelope spectrum in the band 1000–3000 Hz, and (d) envelope spectrum in the band5000–6500 Hz
Fig. 4 Cyclic coherence function of the vibration signal
031006-4 / Vol. 139, JUNE 2017 Transactions of the ASME
Downloaded From: http://solarenergyengineering.asmedigitalcollection.asme.org/ on 02/09/2017 Terms of Use: http://www.asme.org/about-asme/terms-of-use

expression (1)–(4), the feature frequencies under the two condi-tions are listed in Table 1.
4.2 Test Results. A routine inspection has determined thatthe vibration level at the drive-end of the generator exceeded theVDI 3834 standard [30] value, as shown in Fig. 3(a). Figure 3(b)represents the corresponding power spectrum with the vibrationenergy concentrated in frequency bands from 1000 to 3000 Hz,
and from 5000 Hz to 6500 Hz. A conventional approach fordetecting bearing fault is to filter resonance frequency bands thatmay hide fault information, and get an envelope signal fromdemodulation analysis, e.g., Hilbert transform. The fault informa-tion can be evidenced by the analysis of the envelope spectrum(the Fourier transform of the envelope signal). Here fourth-orderButterworth band pass filters are designed to filter the originalvibration signal at the above two frequency bands, and the enve-lope spectra of the filtered signal are shown as in Figs. 3(c)
Fig. 5 Slice of CCF of the vibration signal at f 5 9000 Hz
Fig. 6 Slice of CCF of the vibration signal at f 5 3500 Hz
Journal of Solar Energy Engineering JUNE 2017, Vol. 139 / 031006-5
Downloaded From: http://solarenergyengineering.asmedigitalcollection.asme.org/ on 02/09/2017 Terms of Use: http://www.asme.org/about-asme/terms-of-use

and 3(d). The rotational frequency 28.13 Hz of the generator isevident. This may indicate an imbalance or a misalignmentbetween generator’s shaft and the high-speed shaft of the gearbox.In Figs. 3(c) and 3(d), there are components of 101.6 Hz (the sec-ond harmonic 203 Hz, the third harmonic 305 Hz) and 151.2 Hz(the second harmonic 302 Hz) present that are close to BPFO andBPFI in the third row of Table 1. These components may point toa fault on the inner or outer race of the bearing at the drive-end ofgenerator. However, compared with the vibration amplitude of therotational frequency (28.13 Hz) of the shaft, those of the BPFO(101.6 Hz) and BPFI (151.2 Hz) are weaker and can easily beignored.
To explore possible faults of the bearing, the second-ordercyclostationary analysis is adopted to process the original signaland the cyclic coherence function shown in Fig. 4. Besides of therotational frequency of 28.13 Hz, there are regular intervals of100.6 Hz and 152.6 Hz along the direction of the cyclic frequencyaxis in Fig. 4.
To improve computational efficiency of the cyclostationaryanalysis, the frequency resolution is low, and the resolution ofcyclic frequency is high. All fault information is reflected in thecyclic frequency. Cyclic coherence function provides a three-dimensional representation in f–a plane for the vibration signal.The prominent components in CCF indicate their cyclostationar-ity, and therefore, each of them needs to be considered. By
directly scanning the CCF, the fault modulation information alonga axis can be detected. To find an optimal frequency that can slicethe CCF to make an excellent exhibition of the fault feature, aratio Cðf Þ between the amplitude (CaF
2xðf Þ) of the BPFI (or BPFO,denoted by aF) and the one (Car
2xðf Þ) of the rotational frequencydenoted by ar is defined as Cðf Þ ¼ CaF
2xðf Þ=Car2xðf Þ. The frequency
corresponding to the maximal Cðf Þ is regarded as the optimal slicefrequency.
From Fig. 4, BPFO (100.6 Hz) and its harmonics are concen-trated at the frequency range from 8000 Hz to 10,000 Hz. AndBPFI (152.6 Hz) and its harmonics are in the range from 2200 Hzto 4000 Hz. Figure 5 shows the optimal silce of CCF atf¼ 9000 Hz pointing to the BPFO feature frequency. At the sametime, the silce of CCF at f¼ 3500 Hz in Fig. 6 indicates the featurefrequency of BPFI. The above phenomena point to a fault at theinner and outer race of the bearing. The disassembled bearingfrom the drive-end of the generator in Fig. 7 confirms the diagno-sis result.
The test data collected 6 months earlier from the same genera-tor were used to validate the capability of cyclostationary analysisin detection of a faulty bearing. The original signal collected ear-lier is shown in Fig. 8(a) with the rotational frequency of the gen-erator shaft of 24.84 Hz. The corresponding power spectrum isshown in Fig. 8(b). Similar to Fig. 3(b), the vibration energy con-centrates in frequency band from 1000 to 3000 Hz, and from5000 Hz to 6500 Hz. Figures 8(c) and 8(d) show the envelopespectra of the filtered signal at different frequency bands. Besidesthe rotational frequency (25 Hz and its harmonic) of the shaft,269.5 Hz is evident, which is about twice the BPFI (134.38 Hzunder condition C2). These phenomena illustrate that certaindefects arose on the inner race of the bearing at that time. How-ever, the BPFI itself is weak, and the BPFO does not appear inFigs. 8(c) and 8(d) comparing with Figs. 3(c) and 3(d), whichdemonstrate the enveloping demodulation analysis could not beeffective.
The vibration signal in Fig. 8(a) collected 6 months earlier isprocessed by cyclostationary analysis. Its cyclic coherence func-tion is shown in Fig. 9 where the BPFO intervals 89.8 Hz andBPFI 134.5 Hz are evident, coinciding with the feature frequencyin the last row of Table 1. The slices at f¼ 9000 Hz andf¼ 10,000 Hz in Figs. 10 and 11 illustrate the fault features. TheCCF from Figs. 9–11 illustrate that the bearing fault has emerged6 months ago. Actually, this diagnosis was drawn at that time.However, since the fault hazard was not adequately assessed, thegenerator continued to operate, the faulty bearing had not beenreplaced until the later test at condition C1.
4.3 Comparison With Other Methods. To demonstrate thecyclostationarity of a faulty bearing in wind turbine generator,three methods of signal processing have been applied to comparethe results from Figs. 9–11.
4.3.1 The Empirical Wavelet Transform. The empirical wave-let transform [31] is proposed to overcome the lack of theory ofempirical mode decomposition. It can adaptively decompose sig-nals into different modes by constructing multiple band-pass fil-ters with parameters originating from the maxima in thefrequency spectrum. Chen et al. [26] applied the empirical wave-let transform to detect a bearing fault of a wind turbine generator.Here, empirical wavelet transform is implemented based on thevibration signal in Fig. 8(a). The maximum number of frequencybands is set to three because three frequency bands can make acompromise between redundant detection and a good separationin power spectrum in this context. The result is shown in Fig. 12where the left column illustrates the decomposed temporal modes,and the right column shows the corresponding envelope spectra.In mode 1, 89.84 Hz representing the BPFO is evident. The domi-nant frequency is 25 Hz in mode 2 and 3, which denotes the rota-tional frequency of shaft of the generator. In mode 3, there are134.4 Hz and its second harmonic denoting the BPFI. Although
Fig. 7 Disassembled bearing at the drive-end of the generator
031006-6 / Vol. 139, JUNE 2017 Transactions of the ASME
Downloaded From: http://solarenergyengineering.asmedigitalcollection.asme.org/ on 02/09/2017 Terms of Use: http://www.asme.org/about-asme/terms-of-use

Fig. 8 Time signal 6 months earlier: (a) time signal, (b) power spectrum, (c) envelopespectrum in the band 1000–3000 Hz, and (d) envelope spectrum in the band 5000–6500 Hz
Fig. 9 Cyclic coherence function of the vibration signal 6 months earlier
Journal of Solar Energy Engineering JUNE 2017, Vol. 139 / 031006-7
Downloaded From: http://solarenergyengineering.asmedigitalcollection.asme.org/ on 02/09/2017 Terms of Use: http://www.asme.org/about-asme/terms-of-use

the BPFO is detected in mode 1 and the BPFI is detected in mode3, they are less obvious than the slice of CCF in Fig. 10.
4.3.2 Morlet Wavelet Transform and Wigner–Ville Distribu-tion. Tang et al. [27] adopted Morlet wavelet transform to denoisevibration signals and combined Wigner–Ville distribution to get afault feature in time-frequency domain. The approach was verifiedin a wind turbine test-bed. Here, we used this approach to
compare its performance with the second-order cyclostationaryanalysis.
First, the vibration signal 6 months earlier (see Fig. 8(a)) isprocessed based on the continuous Morlet wavelet transformshown in Fig. 13. The result illustrates that the effective frequen-cies are concentrated at the range from scale 6 to 11. Then, scale 9is selected as the optimal parameter to filter the vibration signal.Using the smoothed pseudo Wigner–Ville distribution for the
Fig. 10 Slice of CCF of the vibration signal 6 months earlier at f 5 9000 Hz
Fig. 11 Slice of CCF of the vibration signal 6 months earlier at f 5 10,000 Hz
031006-8 / Vol. 139, JUNE 2017 Transactions of the ASME
Downloaded From: http://solarenergyengineering.asmedigitalcollection.asme.org/ on 02/09/2017 Terms of Use: http://www.asme.org/about-asme/terms-of-use

filtered signal, the time-frequency representation is shown in Fig.14 where only 0.04 s (25 Hz) denoting the rotational frequency ofthe shaft of the generator is distinct. The BPFI and BPFO do notappear. Performance of the second-order cyclostationary analysisis superior to the wavelet transform combined with Wigner–Villedistribution in detecting the bearing fault in wind turbinegenerator.
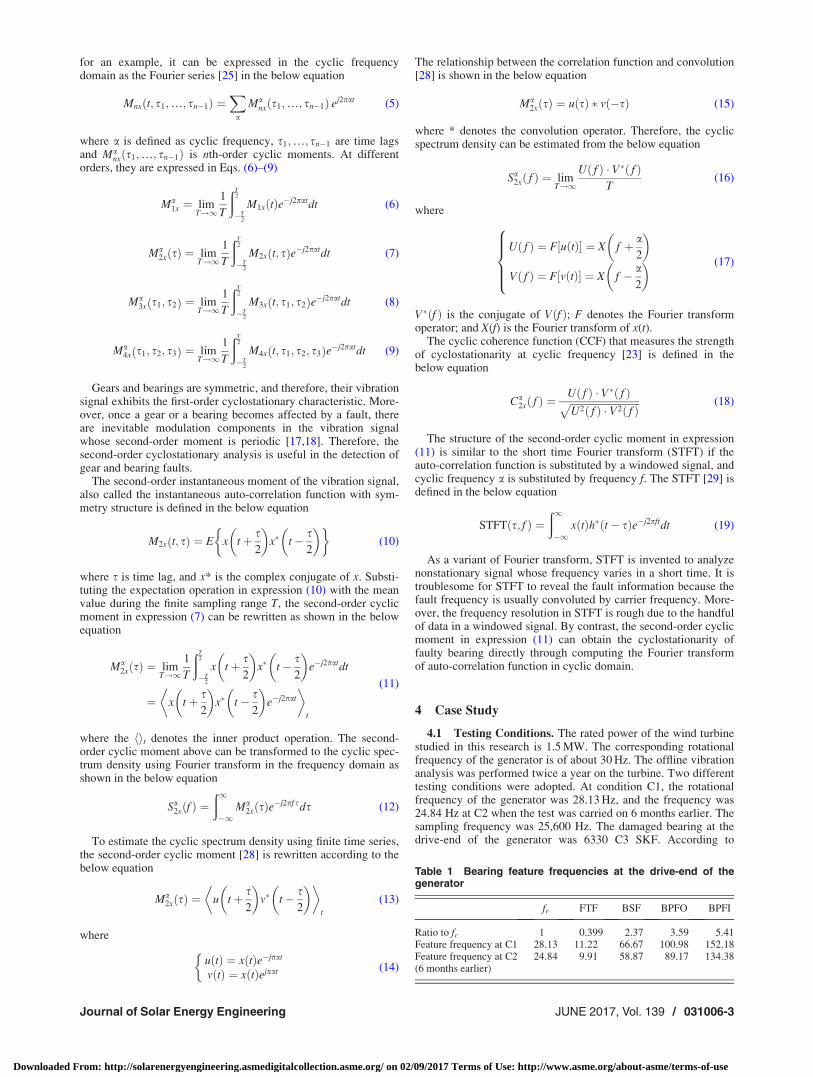
4.3.3 Short Time Fourier Transform. Short time Fouriertransform is a time-frequency tool [29] to find the varying
frequency in nonstationary signal. Window functions are used toseparate the original signal into several parts, and the correspond-ing Fourier transforms are calculated. All the results from Fouriertransforms are combined to form the time-frequency representa-tion. Here, the length of window is 16,384 to make a compromisebetween the calculating efficiency and frequency resolution.Figure 15 is the STFT of the original signal 6 months earlier.
In Fig. 15, we can see the frequency components keep consist-ent, which demonstrates the wind turbine generator operatedunder a constant speed during the test. The vibration energy
Fig. 12 Decomposed modes of empirical wavelet transform using the vibration signal 6months earlier
Fig. 13 The result produced by the continuous Morlet wavelet transform for thevibration signal 6 months earlier
Journal of Solar Energy Engineering JUNE 2017, Vol. 139 / 031006-9
Downloaded From: http://solarenergyengineering.asmedigitalcollection.asme.org/ on 02/09/2017 Terms of Use: http://www.asme.org/about-asme/terms-of-use

concentrates on about 2300 Hz in time-frequency plane. The slicebetween 2000 Hz and 2800 Hz at t¼ 1 s is shown in Fig. 16. Wecan evidently see the frequency components 2068 Hz, 2158 Hz,2248 Hz, 2338 Hz, and 2428 Hz with an interval 90 Hz denotingthe BPFO. Also 2266 Hz, 2291 Hz, and 2316 Hz are manifested,with an interval 25 Hz denoting the rotational frequency of theshaft of the generator. Although the feature of the faulty bearing isdetected using STFT, it still need an individual to identify the
modulated sideband, thus is less direct than the cyclostationaryanalysis in Fig. 9.
4.4 Discussion. Observing the faulty bearing in Fig. 7, thereare obvious traces of the current corrosion on the inner racecaused by electric discharge of rotating parts. This is rather com-mon phenomenon that may originate from the asymmetric
Fig. 14 Smoothed pseudo Wigner–Ville distribution of the filtered signal
Fig. 15 Short time Fourier transform of the original signal 6 months earlier
031006-10 / Vol. 139, JUNE 2017 Transactions of the ASME
Downloaded From: http://solarenergyengineering.asmedigitalcollection.asme.org/ on 02/09/2017 Terms of Use: http://www.asme.org/about-asme/terms-of-use
magnetic flux leakage, shaft eccentricity, or distorted grid current.Ground connection and proper lubrication of bearings are used tominimize discharge.
5 Conclusion
The research reported in the paper has demonstrated that cyclo-stationarity is a valuable characteristic in the analysis of bearingfaults in the generator of a wind turbine. The second-order cyclo-stationary analysis was applied to the vibration signal from anindustrial 1.5 MW wind turbine generator. The distinct fault fre-quency of the inner and outer race of a bearing was extracted.
The same analysis performed on the data collected 6 monthsearlier indicated emergence of the bearing fault at that time, whichshowed the ability of cyclostationary analysis to detect an incipi-ent bearing fault. The diagnosis results were visualized with thedisassembled bearing of a generator.
Acknowledgment
The research presented in this paper was supported by NationalNatural Science Foundation of China (Grant No. 51305135), Sci-ence and Technology Plan Projects of Hebei (Grant No.15214307D), the Fundamental Research Funds for the CentralUniversities of China (Grant No. 2015ZD15), and the NationalHigh Technology Research and Development Program of China(863 Program) (Grant No. 2015AA043702).
References[1] Amirat, Y., Benbouzid, M. E. H., Al-Ahmar, E., Bensaker, B., and Turri, S.,
2009, “A Brief Status on Condition Monitoring and Fault Diagnosis in WindEnergy Conversion Systems,” Renewable Sustainable Energy Rev., 13(9),pp. 2629–2636.
[2] Marquez, F. P. G., Tobias, A. M., Perez, J. M. P., and Papaelias, M., 2012,“Condition Monitoring of Wind Turbines: Techniques and Methods,” Renew-able Energy, 48, pp. 110–116.
[3] Wymore, M. L., Dam, J. E. V., Ceylan, H., and Qiao, D., 2015, “A Survey ofHealth Monitoring Systems for Wind Turbines,” Renewable Sustainable EnergyRev., 52, pp. 976–990.
[4] Alewine, K., and Chen, W., 2012, “A Review of Electrical Winding Failures inWind Turbine Generators,” IEEE Electr. Insul. Mag., 28(4), pp. 8–13.
[5] Tavner, P. J., 2008, “Review of Condition Monitoring of Rotating ElectricalMachines,” IET Electr. Power Appl., 2(4), pp. 215–247.
[6] Watson, S. J., Xiang, B. J., Yang, W. X., Tavner, P. J., and Crabtree, C. J.,2010, “Condition Monitoring of the Power Output of Wind Turbine GeneratorsUsing Wavelets,” IEEE Trans. Energy Convers., 25(3), pp. 715–721.
[7] Kusiak, A., and Verma, A., 2012, “Analyzing Bearing Faults in Wind Turbines:A Data-Mining Approach,” Renewable Energy, 48(6), pp. 110–116.
[8] Yang, W. X., Court, R., and Jiang, J. S., 2013, “Wind Turbine Condition Moni-toring by the Approach of SCADA Data Analysis,” Renewable Energy, 53(9),pp. 365–376.
[9] Antoni, J., and Randall, R. B., 2006, “The Spectral Kurtosis: Application to theVibratory Surveillance and Diagnostics of Rotating Machines,” Mech. Syst.Signal Process., 20(2), pp. 308–331.
[10] Li, R., Sopon, P., and He, D., 2012, “Fault Features Extraction for BearingPrognostics,” J. Intell. Manuf., 23(2), pp. 313–321.
[11] Sawalhi, N., Randall, R. B., and Endo, H., 2007, “The Enhancement of FaultDetection and Diagnosis in Rolling Element Bearings Using Minimum EntropyCombined With Spectral Kurtosis,” Mech. Syst. Signal Process., 21(6),pp. 2616–2633.
[12] Randall, R. B., Sawalhi, N., and Coats, M., 2011, “A Comparison of Methodsfor Separation of Deterministic and Random Signals,” Int. J. Cond. Monit.,1(1), pp. 11–19.
[13] Borghesani, P., Pennacchi, P., Randall, R. B., Sawalhi, N., and Ricci, R., 2013,“Application of Cepstrum Pre-Whitening for the Diagnosis of Bearing FaultsUnder Variable Speed Conditions,” Mech. Syst. Signal Process., 36(2),pp. 370–384.
[14] Rai, V. K., and Mohanty, A. R., 2007, “Bearing Fault Diagnosis Using FFT ofIntrinsic Mode Functions in Hilbert–Huang Transform,” Mech. Syst. SignalProcess., 21(6), pp. 2607–2615.
[15] Park, C. S., Choi, Y. C., and Kim, Y. H., 2013, “Early Fault Detection in Auto-motive Ball Bearings Using the Minimum Variance Cepstrum,” Mech. Syst.Signal Process., 38(2), pp. 534–548.
[16] Teng, W., Jiang, R., Ding, X., Liu, Y. B., and Ma, Z. Y., 2016, “Detection andQuantization of Bearing Fault in Direct Drive Wind Turbine Via ComparativeAnalysis,” Shock Vib., 2016(2), pp. 1–12.
[17] Dandawate, A. V., and Giannakis, B. G., 1994, “Statistical Tests for Presenceof Cyclostationary,” IEEE Trans. Signal Process., 42(9), pp. 2355–2368.
[18] He, Z. J., Zi, Y. Y., and Zhang, X. N., 2007, Modern Signal Processing and ItsApplication in Engineering, Xi’an Jiaotong University Press, Xi’an, China.
[19] Gardner, W. A., 1991, “Exploitation of Spectral Redundancy in CyclostationarySignals,” IEEE Signal Process. Mag., 8(2), pp. 14–36.
[20] Gardner, W. A., 1986, “Measurement of Spectral Correlation,” IEEE Trans.Acoust., Speech, Signal Process., 34(5), pp. 1111–1123.
[21] Gardner, W. A., 1986, “The Spectral Correlation Theory of CyclostationaryTime-Series,” Signal Process., 11(1), pp. 13–36.
[22] Antoni, J., Bonnardot, F., Raad, A., and Badaoui, M. E., 2004, “CyclostationaryModelling of Rotating Machine Vibration Signals,” Mech. Syst. SignalProcess., 18(6), pp. 1285–1314.
[23] Antoni, J., 2007, “Cyclic Spectral Analysis in Practice,” Mech. Syst. SignalProcess., 21(2), pp. 597–630.
Fig. 16 The slice of STFT between 2000 Hz and 2800 Hz at t 5 1 s
Journal of Solar Energy Engineering JUNE 2017, Vol. 139 / 031006-11
Downloaded From: http://solarenergyengineering.asmedigitalcollection.asme.org/ on 02/09/2017 Terms of Use: http://www.asme.org/about-asme/terms-of-use

[24] Antoni, J., 2007, “Cyclic Spectral Analysis of Rolling-Element Bearing Signals:Facts and Fictions,” J. Sound Vib., 304(3–5), pp. 497–529.
[25] Raad, A., Antoni, J., and Sidahmed, M., 2008, “Indicators of Cyclostationarity:Theory and Applications to Gear Fault Monitoring,” Mech. Syst. Signal Pro-cess., 22(3), pp. 574–587.
[26] Chen, J., Pan, J., Li, Z., Zi, Y., and Chen, X., 2016, “Generator Bearing FaultDiagnosis Via Empirical Wavelet Transform Using Measured Vibration Sig-nals,” Renewable Energy, 89, pp. 80–92.
[27] Tang, B., Liu, W., and Song, T., 2010, “Wind Turbine Fault Diagnosis Basedon Morlet Wavelet Transformation and Wigner–Ville Distribution,” RenewableEnergy, 35(12), pp. 2822–2866.
[28] Zhang, X. D., and Bao, Z., 1998, Nonstationary SignalAnalysis and Processing, National Defense Industry Press, Beijing,China.
[29] Allen, J. B., 1977, “Short Time Spectral Analysis, Synthesis, and Modificationby Discrete Fourier Transform,” IEEE Trans. Acoust., Speech, Signal Process.,25(3), pp. 235–238.
[30] VDI 3834, 2009, “Measurement and Evaluation of the Mechanical Vibration ofWind Energy Turbines and Their Components Onshore Wind Energy TurbinesWith Gears,” Verlag des Vereins Deutscher Ingenieure, p. 16.
[31] Gilles, J., 2013, “Empirical Wavelet Transform,” IEEE Trans. Signal Process.,61(16), pp. 3999–4010.
031006-12 / Vol. 139, JUNE 2017 Transactions of the ASME
Downloaded From: http://solarenergyengineering.asmedigitalcollection.asme.org/ on 02/09/2017 Terms of Use: http://www.asme.org/about-asme/terms-of-use