Embed Size (px)
DESCRIPTION
CyprusIndependentDueDiligenceReport_18April
Citation preview
PIMCO Europe Ltd
11 Baker Street
London W1U 3AH
England
Tel: +44 20 3640 1000
Independent Due
Diligence of the Banking
System of Cyprus
February 2013
BANKING SYSTEM OF CYPRUS | INDEPENDENT DUE DILIGENCE REPORT 1
Legal Disclaimer and Limiting Conditions
This report sets forth information contemplated by the engagement of PIMCO Europe Ltd (together with
contemplated by the agreement between PIMCO Europe Ltd and the Central Bank of Cyprus (the
alteration of any section or page from the main body of this report is expressly forbidden. This report has been prepared exclusively for the Steering Committee. There are no third party beneficiaries with respect to this report, and PIMCO expressly disclaims any liability whatsoever (whether in contract, tort or otherwise) to any third party. PIMCO makes no representation or warranty (express or implied) to any third party in relation to this report. A decision by the Steering Committee to release this report to the public shall not constitute any permission, waiver or consent from PIMCO for any third party to rely on this report. Access to this report and its use by any third party implies acceptance by the third party of the terms and conditions contained in this section and other parts of this report. This report is, in all cases, subject to the limitations and other terms and conditions set forth herein and in the Agreement, in particular exclusions of liability. This report has been produced by using and in reliance on information furnished by third parties, including the Central Bank of Cyprus and the Participating Institutions to which this report relates. In preparing this report, PIMCO has used information and advice provided by third party professional advisers including lawyers and real estate valuers. All such information has not been independently validated, verified or confirmed by PIMCO and PIMCO makes no representation or warranty as to the accuracy or completeness of any information provided by third parties. This document has been prepared for information purposes only and is not a solicitation of any offer to buy or sell any security, commodity or instrument or related derivative or to participate in any trading strategy. PIMCO is not responsible for any decisions made in connection with the implementation or use of this report. This report does not provide any opinion regarding the fairness of any transaction. No investor or security holder should rely on the content of this report in any way in connection with the purchase or sale of any security. The report sets out and is based upon certain assumptions which have been agreed with the Steering Committee. No representation is made that the assumptions are reasonable or are likely to be obtained. The use of such assumptions may suggest a valuation for an asset which differs considerably from its market value. PIMCO does not represent that any such assumptions will reflect actual future events or that all assumptions have been considered or stated. Actual events are beyond PIMCO's control, difficult to predict and may differ materially from those assumed. Changes to any assumptions may have a material impact on analyses, projections or estimates. All information included is based on information available on the date hereof and PIMCO is under no obligation to update the information herein. This document contains information which is proprietary and/or commercially sensitive to PIMCO. PIMCO Europe Ltd (Registered in England and Wales, Company No. 2604517), Registered Office 11 Baker Street London W1U 3AH Tel: +44 20 3640 1000. Authorized and regulated by the Financial Services Authority (25 The North Colonnade, Canary Wharf, London E14 5HS).
BANKING SYSTEM OF CYPRUS | INDEPENDENT DUE DILIGENCE REPORT 2
Table of Contents
1 EXECUTIVE SUMMARY ................................................................................................................................6
1.1 OVERVIEW AND OBJECTIVES ...........................................................................................................................6 1.2 BACKGROUND AND CONTEXT ........................................................................................................................8
1.2.1 Overview of Cyprus Banking System .................................................................................................8 1.2.2 Summary Findings ......................................................................................................................... 10 1.2.3 Significant Findings ....................................................................................................................... 13
1.3 PIMCO APPROACH TO INDEPENDENT DUE DILIGENCE ...................................................................................... 15 1.4 AGGREGATE RESULTS ................................................................................................................................ 16
1.4.1 Base Scenario ................................................................................................................................ 17 1.4.2 Adverse Scenario ........................................................................................................................... 19
2 LOSS ABSORPTION CAPACITY .................................................................................................................. 21
2.1 OVERVIEW .............................................................................................................................................. 21 2.2 DELEVERAGING AND NEW LENDING .............................................................................................................. 22
2.2.1 Methodology ................................................................................................................................ 22 2.3 INTEREST INCOME ..................................................................................................................................... 24
2.3.1 Methodology ................................................................................................................................ 24 2.3.2 Results ........................................................................................................................................... 25
2.4 INTEREST EXPENSE ..................................................................................................................................... 27 2.4.1 Methodology ................................................................................................................................ 27 2.4.2 Results ........................................................................................................................................... 28
2.5 NON-INTEREST INCOME .............................................................................................................................. 36 2.5.1 Methodology ................................................................................................................................ 36
2.6 NON-INTEREST EXPENSE ............................................................................................................................. 38 2.6.1 Methodology ................................................................................................................................ 38 2.6.2 Results ........................................................................................................................................... 39
2.7 LOAN LOSSES AND PROVISIONS .................................................................................................................... 41 2.7.1 Methodology ................................................................................................................................ 41 2.7.2 Results ........................................................................................................................................... 43
2.8 DEFERRED TAX ASSETS .............................................................................................................................. 44 2.8.1 Methodology ................................................................................................................................ 44 2.8.2 Results ........................................................................................................................................... 44
2.9 RISK-WEIGHTED ASSETS ............................................................................................................................. 46 2.9.1 Methodology ................................................................................................................................ 46 2.9.2 Results ........................................................................................................................................... 47
2.10 SECURITIES .............................................................................................................................................. 49 2.10.1 Methodology ................................................................................................................................ 49
2.11 NON-BANK SUBSIDIARIES ........................................................................................................................... 50 2.11.1 Methodology ................................................................................................................................ 50 2.11.2 Results ........................................................................................................................................... 50
2.12 OTHER ASSETS ......................................................................................................................................... 50
3 LOAN LOSS ANALYSIS .............................................................................................................................. 51
3.1 OVERVIEW .............................................................................................................................................. 51 3.2 DATA COLLECTION ................................................................................................................................... 51 3.3 PAST PERFORMANCE REVIEW ...................................................................................................................... 55
3.3.1 Framework for Historical Data Review ........................................................................................... 55 3.3.2 Results ........................................................................................................................................... 57
3.4 LOAN LEVEL FORECASTING FRAMEWORK ....................................................................................................... 62 3.4.1 Probability of Default Model .......................................................................................................... 62 3.4.2 Loss Given Default Model .............................................................................................................. 65 3.4.3 Results ........................................................................................................................................... 69
3.5 LARGE LOAN REVIEW................................................................................................................................. 70 3.5.1 Corporate...................................................................................................................................... 70 3.5.2 Commercial Real Estate ................................................................................................................. 76
3.6 PROBLEM LOAN SERVICING ......................................................................................................................... 80 3.6.1 Credit Bureau Information ............................................................................................................. 81
BANKING SYSTEM OF CYPRUS | INDEPENDENT DUE DILIGENCE REPORT 3
3.6.2 Loan Guarantees ........................................................................................................................... 81 3.6.3 Loan Restructuring ........................................................................................................................ 82
4 APPENDIX .................................................................................................................................................. 83
4.1 LIST OF PARTICIPATING INSTITUTIONS ............................................................................................................. 83 4.2 MACROECONOMIC SCENARIOS ................................................................................................................... 84 4.3 SUMMARY OF CAPITAL SHORTFALL BY INSTITUTION GROUP ............................................................................... 85 4.4 SUMMARY OF CAPITAL SHORTFALL FOR COOPERATIVE GROUPS .......................................................................... 87 4.5 DETAILED CAPITAL SHORTFALL BY PARTICIPATING INSTITUTION ........................................................................... 89
4.5.1 Summary of Results: Bank of Cyprus ............................................................................................. 90 4.5.2 Summary of Results: Laiki Bank Group / Cyprus Popular Bank ....................................................... 91 4.5.3 Summary of Results: Hellenic Bank ................................................................................................ 92 4.5.4 Summary of Results: Eurobank Cyprus .......................................................................................... 93 4.5.5 Summary of Results: Alpha Bank ................................................................................................... 94 4.5.6 Summary of Results: Co-operative Central Bank ............................................................................ 95 4.5.7 Summary of Results: Limassol Co-operative Savings Society ........................................................... 96 4.5.8 Summary of Results: Professional Co-operatives ............................................................................ 97 4.5.9 Summary of Results: Large Co-operatives ...................................................................................... 98 4.5.10 Summary of Results: Small Co-operatives ...................................................................................... 99
4.6 SYSTEM WIDE EXPECTED LOSSES ............................................................................................................... 100 4.7 DEFINITIONS AND KEY TERMS .................................................................................................................... 101
BANKING SYSTEM OF CYPRUS | INDEPENDENT DUE DILIGENCE REPORT 4
List of Figures Figure 1: Domestic Credit to Private Sector ...........................................................................................................8 Figure 2: Overview of Cyprus Banking System .......................................................................................................9 Figure 3: Key Assumptions and Definitions......................................................................................................... 15 Figure 4: Summary of Expected Losses and Capital Shortfall .............................................................................. 16 Figure 5: Summary Capital Analysis (Base Scenario) ........................................................................................... 17 Figure 6: Calculation of Capital Shortfall (Base Scenario) .................................................................................... 18 Figure 7: Summary Capital Analysis (Adverse Scenario) ...................................................................................... 19 Figure 8: Calculation of Capital Shortfall (Adverse Scenario) ............................................................................... 20 Figure 9: Deleveraging Path of Cyprus Domestic Net Loans (Base Scenario) ........................................................ 23 Figure 10: Deleveraging Path of Cyprus Domestic Net Loans (Adverse Scenario) ................................................ 23 Figure 11: Interest Income Calculation Approach ............................................................................................... 24 Figure 12: Average Effective Interest Rate for Participating Institutions (Base Scenario)....................................... 26 Figure 13: Average Effective Interest Rate for Participating Institutions (Adverse Scenario) ................................. 26 Figure 14: Aggregate Cost of Deposits ............................................................................................................... 29 Figure 15: Cyprus Resident Cumulative Deposit Outflows .................................................................................. 29 Figure 16: Cyprus Non-Resident Cumulative Deposit Outflows........................................................................... 30 Figure 17: Greek Cumulative Deposit Outflows .................................................................................................. 30 Figure 18: Russian Cumulative Deposit Inflows .................................................................................................. 31 Figure 19: Euro Area Bank Deposits (Non-financial, Household and Other Gov.) ................................................ 31 Figure 20: Quarters from GDP Peak ................................................................................................................... 32 Figure 21: Cyprus Resident Time Deposit Rates .................................................................................................. 33 Figure 22: Cyprus Non-Resident Time Deposit Rates .......................................................................................... 33 Figure 23: Greek Time Deposit Rates .................................................................................................................. 34 Figure 24: Russian Time Deposit Rates ............................................................................................................... 34 Figure 25: Emergency Liquidity Assistance (ELA Funding) ................................................................................... 35 Figure 26: Central Bank Normal Operations Funding .......................................................................................... 35 Figure 27: Aggregate Non-Interest Income......................................................................................................... 36 Figure 28: Non-Interest Expense (Base Scenario) ................................................................................................ 39 Figure 29: Non-Interest Expense (Adverse Scenario) ........................................................................................... 40 Figure 30: Illustrative Example of Provision Methodology ................................................................................... 41 Figure 31: Cumulative Provisions Over Stress Period (Base Scenario) ................................................................... 43 Figure 32: Cumulative Provisions Over Stress Period (Adverse Scenario) ............................................................. 43 Figure 33: Deferred Tax Assets Included in Core Tier 1 Capital (Base Scenario) ................................................... 45 Figure 34: Deferred Tax Assets Included in Core Tier 1 Capital (Adverse Scenario).............................................. 45 Figure 35: Aggregate Credit Risk Weighting for Loans ....................................................................................... 47 Figure 36: Risk-Weighted Assets (Base Scenario) ................................................................................................ 48 Figure 37: Risk-Weighted Assets (Adverse Scenario) ........................................................................................... 48 Figure 38: Total Securities Portfolios for Participating Institutions ....................................................................... 49 Figure 39: Hypothetical Relationship Diagram .................................................................................................... 52 Figure 40: Diagram of Data Model ..................................................................................................................... 53 Figure 41: Asset Characteristics of Loans Reviewed ............................................................................................ 54 Figure 42: Borrower Performance Status Categories .......................................................................................... 56 Figure 43: Simplified Transition Rate Diagram .................................................................................................... 56 Figure 44: Monthly Transition from 90+ dpd (Housing and Consumer Loans) .................................................... 57 Figure 45: Monthly Transition from 90+ dpd (Corporate and SME Loans) .......................................................... 58 Figure 46: Stocks of Loans by Performance Status (Housing and Consumer Loans) ............................................ 59 Figure 47: Stocks of Loans by Performance Status (Corporate and SME Loans) .................................................. 60 Figure 48: Re-offense Multiples by Category ...................................................................................................... 61 Figure 49: Cohort Analysis (Consumer Loans) .................................................................................................... 61 Figure 50: Factor Dependencies Used in Model Calibration ................................................................................ 63 Figure 51: Run-off from First Default (Housing and Consumer) .......................................................................... 66 Figure 52: Run-off from First Default (Corporate and SME) ................................................................................ 66 Figure 53: Recovery Framework ......................................................................................................................... 67 Figure 54: Haircuts for Base and Adverse Scenarios ............................................................................................ 68 Figure 55: Many-to-Many Relationship between Loans and Collateral ................................................................ 69 Figure 56: Corporate Loans Reviewed by Participating Institution ....................................................................... 70 Figure 57: Summary of Selected Exposures (Corporate) ...................................................................................... 71 Figure 58: Commercial Real Estate Loans Reviewed by Participating Institution .................................................. 76
BANKING SYSTEM OF CYPRUS | INDEPENDENT DUE DILIGENCE REPORT 5
Figure 59: Summary of Selected Exposures (Commercial Real Estate) ................................................................. 76 Figure 60: Evolution of 90+ Balances (Domestic Banks) ...................................................................................... 80 Figure 61: Evolution of 90+ Balances (Co-operatives) ......................................................................................... 80 Figure 62: Total Assets of Cyprus Banking System and Participating Institutions ................................................. 83 Figure 63: Participating Co-operative Institutions ............................................................................................... 83 Figure 64: Macroeconomic Scenarios Provided by Steering Committee .............................................................. 84 Figure 65: Macroeconomic Scenarios: Bond Yields and Foreign Exchange Rates ................................................. 84 Figure 66: Summary of Capital Shortfall by Institution (Base Scenario) ............................................................... 85 Figure 67: Summary of Capital Shortfall by Institution (Adverse Scenario) .......................................................... 86 Figure 68: Summary of Capital Shortfall for Co-operative Groups (Base Scenario) .............................................. 87 Figure 69: Summary of Capital Shortfall for Co-operative Groups (Adverse Scenario) ......................................... 88 Figure 70: Expected Losses by Business Unit and Country ................................................................................ 100 Figure 71: Cumulative Probability of Default by Business Unit and Country ...................................................... 100 Figure 72: Loss Given Default by Business Unit and Country ............................................................................ 100 Figure 73: Definitions and Key Terms ............................................................................................................... 101
BANKING SYSTEM OF CYPRUS | INDEPENDENT DUE DILIGENCE REPORT 6
1 Executive Summary
1.1 OVERVIEW AND OBJECTIVES This r -up, loan level due diligence of the Cyprus Banking System conducted at the direction of members of the Cyprus Steering Committee (SC).1
each Participating Institution (PI) involved in the exercise. Capital estimates have been generated under both Base and Adverse macroeconomic scenarios and under other conditions established by the Steering Committee. The applicable reference date for the exercise is 30 June 2012 and the forecast period extends from 30 June 2012 through 30 June 2015. We have estimated the capital shortfall or surplus of each Participating Institution as of 30 June 2015 taking into account projected loan losses and offsetting pre-provision earnings. Capital estimates reflect projections for PIs given the composition of their balance sheets and operating platforms as of June 2012. We have not incorporated changes at the institutions since 30 June 2012, except where core equity capital has been raised in the primary market or convertible capital instruments have been converted into Core Tier 1 capital. Our capital shortfall estimates are in addition to any state capital injections already provided. They do not incorporate any potential liability management exercises that could reduce the amount of capital injection required. We have generally conducted our analysis assuming no changes in relevant legislation or regulations. Changes at Participating Institutions since June 2012 along with the impact of any relevant changes in legislation or regulation will be addressed subsequently as mitigating actions to be generated by each institution in consultation with the Central Bank of Cyprus. These mitigating actions may change the ultimate capital shortfall estimate for some institutions subsequent to the publication of this report. The loan level analysis was performed on 22 Participating Institutions representing domestic banks (including their branch operations in Greece, Russia and elsewhere), subsidiaries of Greek banks operating in Cyprus and co-operative credit institutions. In total, these institutions represented approximately 73% of the total assets of the Cyprus banking system as of 31 March 2012. Excluding foreign banks, the asset coverage amount rises to approximately 83% of domestic institutions for the same reporting period. Our capital shortfall estimate covers only these PIs and does not cover the non-participating institutions, most of which are smaller co-operatives. An overview of all Participating Institutions is presented in the Appendix on page 83. In general the due diligence exercise and the modeling of potential capital shortfalls at Participating Institutions was guided by International Financial Reporting Standards (IFRS principles), per Steering Committee instructions. In consultation with the Steering Committee, this exercise has applied certain prudential filters to an IFRS approach where deemed critical in order to reinforce the credibility of the exercise and ensure stakeholder confidence in the solvency and viability of the Participating Institutions. Instances where such prudential filters have been applied are described in detail in the body of this report. In addition, PIMCO generated these capital estimates using Basel II regulatory guidance as applied and interpreted by the Central Bank of Cyprus. We have not performed an estimate of any potential pro forma impact of the application of Basel III as part of this exercise. The capital shortfall results described herein are the result of over one hundred individual meetings with PIs, wholesale redesigns of data and business plan templates based upon PI feedback, and finally, intense data analysis, proprietary model development and expert judgment to capture the idiosyncrasies of the Cyprus banking system.
1 The Steering Committee comprises representatives from the Central Bank of Cyprus (and other Cypriot authorities), European Commission,
European Central Bank, European Financial Stability Facility / European Stability Mechanism, European Banking Authority and the
International Monetary Fund (as observer).
BANKING SYSTEM OF CYPRUS | INDEPENDENT DUE DILIGENCE REPORT 7
For this report, PIMCO has:
Evaluated expected losses
over a three-year period
Performed evaluations of each PI ability to generate pre-provision profits throughout the three-year
forecast period
Determined the capital needs for each PI
Participated in an in-depth peer review process with the Steering Committee, allowing for modeling
approach and assumptions to be tested and challenged by members of the Steering Committee
This report outlines in sequential detail the two pillars of our approach loss absorption capacity for assessing
pre-provision profits and loan loss analysis for calculating losses ba
default (PD) and loss given default (LGD) for each loan category.
BANKING SYSTEM OF CYPRUS | INDEPENDENT DUE DILIGENCE REPORT 8
1.2 BACKGROUND AND CONTEXT
1.2.1 Overview of Cyprus Banking System
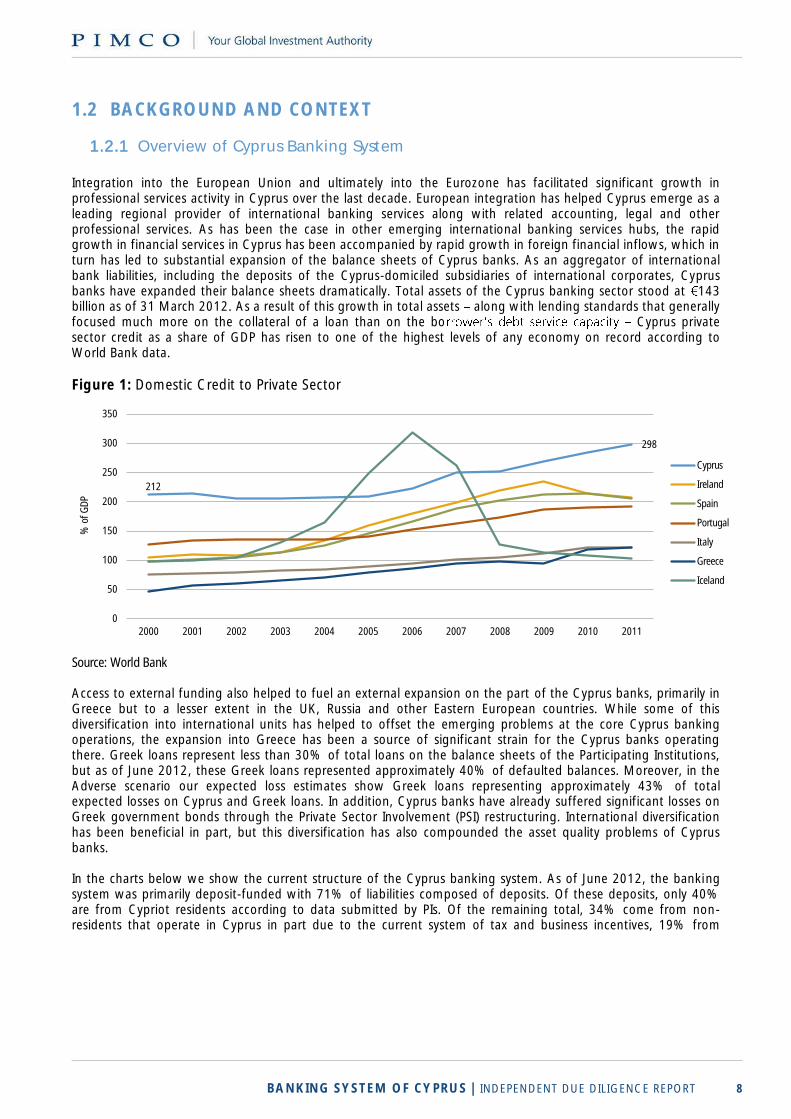
Integration into the European Union and ultimately into the Eurozone has facilitated significant growth in professional services activity in Cyprus over the last decade. European integration has helped Cyprus emerge as a leading regional provider of international banking services along with related accounting, legal and other professional services. As has been the case in other emerging international banking services hubs, the rapid growth in financial services in Cyprus has been accompanied by rapid growth in foreign financial inflows, which in turn has led to substantial expansion of the balance sheets of Cyprus banks. As an aggregator of international bank liabilities, including the deposits of the Cyprus-domiciled subsidiaries of international corporates, Cyprus banks have expanded their balance sheets dramatically. Total assets of the Cyprus banking sector stood at 143 billion as of 31 March 2012. As a result of this growth in total assets along with lending standards that generally focused much more on the collateral of a loan than on the bo Cyprus private sector credit as a share of GDP has risen to one of the highest levels of any economy on record according to World Bank data.
Figure 1: Domestic Credit to Private Sector
212
298
0
50
100
150
200
250
300
350
2000 2001 2002 2003 2004 2005 2006 2007 2008 2009 2010 2011
% o
f GD
P
Cyprus
Ireland
Spain
Portugal
Italy
Greece
Iceland
Source: World Bank
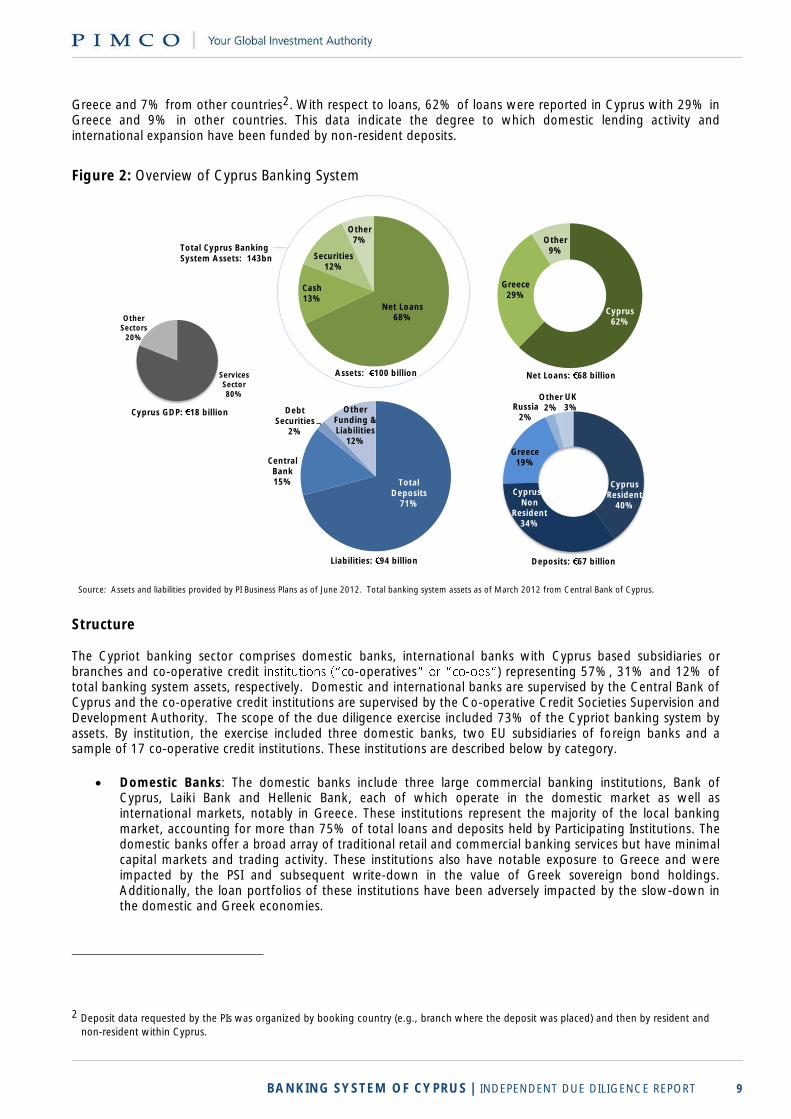
Access to external funding also helped to fuel an external expansion on the part of the Cyprus banks, primarily in Greece but to a lesser extent in the UK, Russia and other Eastern European countries. While some of this diversification into international units has helped to offset the emerging problems at the core Cyprus banking operations, the expansion into Greece has been a source of significant strain for the Cyprus banks operating there. Greek loans represent less than 30% of total loans on the balance sheets of the Participating Institutions, but as of June 2012, these Greek loans represented approximately 40% of defaulted balances. Moreover, in the Adverse scenario our expected loss estimates show Greek loans representing approximately 43% of total expected losses on Cyprus and Greek loans. In addition, Cyprus banks have already suffered significant losses on Greek government bonds through the Private Sector Involvement (PSI) restructuring. International diversification has been beneficial in part, but this diversification has also compounded the asset quality problems of Cyprus banks. In the charts below we show the current structure of the Cyprus banking system. As of June 2012, the banking system was primarily deposit-funded with 71% of liabilities composed of deposits. Of these deposits, only 40% are from Cypriot residents according to data submitted by PIs. Of the remaining total, 34% come from non-residents that operate in Cyprus in part due to the current system of tax and business incentives, 19% from
BANKING SYSTEM OF CYPRUS | INDEPENDENT DUE DILIGENCE REPORT 9
Greece and 7% from other countries2. With respect to loans, 62% of loans were reported in Cyprus with 29% in Greece and 9% in other countries. This data indicate the degree to which domestic lending activity and international expansion have been funded by non-resident deposits.
Figure 2: Overview of Cyprus Banking System
Structure The Cypriot banking sector comprises domestic banks, international banks with Cyprus based subsidiaries or branches and co-operative credit i o-operatives - ) representing 57%, 31% and 12% of total banking system assets, respectively. Domestic and international banks are supervised by the Central Bank of Cyprus and the co-operative credit institutions are supervised by the Co-operative Credit Societies Supervision and Development Authority. The scope of the due diligence exercise included 73% of the Cypriot banking system by assets. By institution, the exercise included three domestic banks, two EU subsidiaries of foreign banks and a sample of 17 co-operative credit institutions. These institutions are described below by category.
Domestic Banks: The domestic banks include three large commercial banking institutions, Bank of
Cyprus, Laiki Bank and Hellenic Bank, each of which operate in the domestic market as well as international markets, notably in Greece. These institutions represent the majority of the local banking market, accounting for more than 75% of total loans and deposits held by Participating Institutions. The domestic banks offer a broad array of traditional retail and commercial banking services but have minimal capital markets and trading activity. These institutions also have notable exposure to Greece and were impacted by the PSI and subsequent write-down in the value of Greek sovereign bond holdings. Additionally, the loan portfolios of these institutions have been adversely impacted by the slow-down in the domestic and Greek economies.
2 Deposit data requested by the PIs was organized by booking country (e.g., branch where the deposit was placed) and then by resident and
non-resident within Cyprus.
Total Deposits
71%
Central Bank15%
Debt Securities
2%
Other Funding & Liabilities
12%
Net Loans68%
Cash13%
Securities12%
Other7%
Services Sector80%
Other Sectors
20%
Liabilities: 94 billion
Assets: 100 billion
Cyprus GDP: 18 billion
Total Cyprus Banking System Assets: 143bn
Source: Assets and liabilities provided by PI Business Plans as of June 2012. Total banking system assets as of March 2012 from Central Bank of Cyprus.
Cyprus62%
Greece29%
Other9%
Cyprus Resident
40%
Cyprus -Non
Resident34%
Greece19%
Russia2%
UK3%
Other2%
Deposits: 67 billion
Net Loans: 68 billion
BANKING SYSTEM OF CYPRUS | INDEPENDENT DUE DILIGENCE REPORT 10
Foreign Banks: The foreign banks included in the due diligence exercise consist of two Cyprus subsidiaries of Greek banks, Alpha Bank and Eurobank Cyprus. This due diligence exercise focused on the activities within the Cypriot subsidiaries and did not include activities conducted outside of these entities. These institutions generally focus on the local banking market and facilitate international banking for companies with Cypriot business activities as well as high net worth Cypriot individuals. These banks have been more recent entrants to the Cypriot market relative to the domestic banks.
The Co-operative Credit Institutions: The co-ops included in this exercise were the Co-operative Central Bank, Limassol Savings Society and 15 individual co-operatives (listed in
Figure 63 on page 83). These were chosen by the Steering Committee as a representative sample of co-operative institutions which includes 96 active co-operatives in Cyprus. The co-operatives are domestic credit institutions that have traditionally focused on the underserved markets of Cyprus. They are owned by their members, and with the exception of the Limassol Co-operative (a separately capitalized entity) the co-operative system shares in a collective capital pool with a two-way guarantee. Each co-operative guarantees the Co-operative Central Bank, which in turn guarantees each co-operative, in effect allowing co-operatives with a capital shortfall to be offset by co-operatives with a capital surplus. Each individual co-operative is required to deposit its excess liquidity at the Co-operative Central Bank which invests the liquidity on behalf of the co-operatives.
1.2.2 Summary Findings The Cyprus banking system and lending practices of Participating Institutions are characterized by a number of idiosyncratic features that differentiate Cyprus from other international banking systems. Understanding these factors is critical to understanding the methodology and findings of this due diligence exercise. These features include:
Prevalence of Asset-Based Lending Practices
Extended Foreclosure and Legal Resolution Timeline
Cross-Collateralization Across Loans and Borrower Groups
Provisioning Methodology and Impairment Recognition Practices
Prevalence of Loan Modifications in Lieu of Problem Loan Servicing
Recognition of Unpaid Interest within Interest Income
Reliance on International Banking Operations
Lending Practices of the Co-operatives Sector
Prevalence of Asset-Based Lending Practices
A key feature of the Cyprus banking system has been the practice of pursuing asset-based lending, meaning a high reliance on collateral in the underwriting of loans, often with less meet debt service payments on the loan. A common theme of commentary from PI management teams during the due diligence exercise was the importance of collateral in underwriting and the historical unwillingness to pursue unsecured lending. In addition, the practice of requiring guarantees from both the borrower and third parties is widespread. The assets of guarantors are also available as collateral as long as there are no prior encumbrances. This practice has
broadening the range of resolution options available to the lender. Under historically more normal economic conditions, this collateral-focused lending practice has served to protect Cyprus PIs from losses on seriously delinquent loans, especially in the context of rising property prices and conservative loan-to-value ratios at origination. Borrowers who were unable to meet their obligations could resolve their difficulties by selling property, releasing equity or pledging further collateral. If these options were not available to the borrower directly, they were often available to the guarantors and the lenders were likely to be able to reach a resolution by pursuing them. With the collapse in the real estate market, these paths to resolution have effectively been closed and borrowers who are unable to meet their obligations are simply falling further into arrears.
response to deteriorating economic conditions in the form of heightened serious delinquency ratios. Indeed, the marginal response of loan performance to changes in economic conditions appears much greater in Cyprus than
BANKING SYSTEM OF CYPRUS | INDEPENDENT DUE DILIGENCE REPORT 11
in many other economies. This attention to collateral and relative inattention to debt service capacity helps to explain why non-performing loan ratios in Cyprus are so elevated despite recent economic performance that has been more robust than that seen in more economically distressed European countries.
Extended Foreclosure and Legal Resolution Timeline Very lengthy foreclosure and repossession timelines are a crucial facet of Cyprus banking. Lenders generally seek a negotiated resolution with a problem borrower once a loan has become non-performing, but lenders may also begin parallel legal proceedings in the event negotiations fail to resolve the loan in order to put pressure on the borrower and guarantors. These legal proceedings can be extremely protracted by international standards. The general timeline to receive a court judgment once a loan has been moved to recoveries can be three to four years. Following this, the borrower can appeal the process which can take another 18 months to two years. In total, the amount of time to reach a forced sale of property through auction historically has ranged between 10 to 12 years. Due to these extended timelines, banks and co-operatives rarely resolve loans through actual foreclosure and repossession. However, once a court judgment has been issued the lenders also have alternative methods of recovering on the loan including: writ of movable properties; forced sale of shares; freezing or receiving control of deposits held at other institutions; writ of sale against non-mortgage property of the guarantor and/or appointment of a receiver under a floating charge. A bankruptcy petition, which can take as little as two to three months, is in general the preferred method to exert pressure on defaulted individual borrowers after a court judgment. For corporate loans, following a court decision the winding down process can take up to one year. Another complication of the problem loan resolution process is that in Cyprus a mortgage does not confer the right to take possession of the property, but only the right to force the sale of the property. This means that lenders are unable to take possession and control the timing of the sale of the property on the open market and must endure a lengthy process in the courts and land registry to achieve resolution. Due to this, as well as backlogs in both the courts and at the land registry, the resolution time for distressed real est s European peers. This reality is in turn exacerbated by the steady increase of distressed loans since the start of the downturn, which has increased the burden on the already overextended system. The net effect is that resolutions through forced sales take between one to three years for a legal judgment to be obtained, and then a further three to ten years for the property to be successfully auctioned. Extended problem loan resolution timelines affect bank and co-operative behavior in a number of important ways. The primary impact of extended timelines is that lenders have little incentive to take legal action. Lenders instead prefer to enter protracted bilateral negotiations with the borrower, often resulting in the borrower pledging further collateral, or receiving a modification and resuming payments. Such solutions are at best temporary,
an. Another result of extended timelines is that the borrowers themselves do not see any immediate consequences from failing to pay, increasing the propensity for missing scheduled payments in the first place. Finally, the inability of lenders to pursue aggressive foreclosure and repossession strategies may also artificially inflate the demand for credit, as borrowers who would otherwise not take the risks involved see little downside to adding additional leverage.
Cross-Collateralization Across Loans and Borrower Groups
Cyprus lending is characterized by a high degree of cross-collateralization of loans. Cross-collateralization means that loans can be backed by multiple properties as collateral, a single property can serve as collateral on multiple loans, or even more complicated multiple properties can serve as collateral on multiple loans. The prevalence of this cross-collateralization is in part due to both the asset-based lending practices and protracted resolution timelines. Lenders are willing to extend additional loans to a borrower group on the pledging of additional
addition, lenders prefer to accept additional collateral pledges from within the borrower group (or in the form of guarantees), rather than go through the lengthy forced sale process. Large borrower groups frequently have complex structures involving numerous entities with extensive cross shareholdings, cross pledges, cross guarantees and floating charges of various priorities. Thus, assessing the quality of the credit becomes a significant challenge. These group structures have grown in prevalence over time as the need for more loans, or for more collateral to support existing problem loans, has led to complex collateral arrangements.
BANKING SYSTEM OF CYPRUS | INDEPENDENT DUE DILIGENCE REPORT 12
From the securities data provided by PIs, which links loans to collateral, PIMCO observed very common cases that multiple collateral, or collateral groups with various collateral types, are linked to support multiple loans with different lien priorities and registered values. Given such many-to-many relationships between loans and collateral, PIMCO found it necessary to develop a robust collateral allocation algorithm to calculate the coverage ratio for each individual loan. Such an allocation algorithm is important to detect collateral value shortfalls in the calculation of loss given default (LGD) and loss severity per loan. The most common collateral types observed from the data provided by PIs include residential properties, commercial properties (land, office, hotel, industrial, etc.), guarantees (government, corporate, personal), cash collateral or equivalent, financial assets, charge/pledge, assignment of contract, vessel, vehicle or equipment.
Provisioning Methodology and Impairment Recognition Practices
Provisioning methodology is a key differentiator between Cyprus banks and other European banks. In particular, the provisioning methodology used by a number of Participating Institutions does not capture expected loss in the financial statements to the same degree as alternative methodologies.
In the European context, where evidence of impairment is identified, provisions are commonly calculated as the difference between the current carrying amount of a loan and the net present value of the expected future cash flows of that loan, discounting those future cash flows at the original effective interest rate of the loan. In Cyprus, most Participating Institutions calculate provisions as the difference between the current principal amount of the
has been defined as a sale where the recovery proceeds are 25% below the most recent appraised value of the collateral. enabled banks to recognize relatively limited provisions on impaired assets.
Another key difference in Cyprus relative to European practices is the definition of a non-performing loan. The Central Bank of Cyprus defines a non-performing loan as a loan that is at least 90 days delinquent and is not fully secured. As a result, the determination of a non-performing loan is partially based on the estimated value of the
. Given the significant level of collateralized lending in Cyprus, and the optimistic collateral values, many significantly past due loans are not included in the stock of non-performing loans. The relatively limited provisions coverage at Cyprus banks has been justified historically by a long pattern of rising property prices that have increased until very recently; the presence of collateral in the vast majority of loans originated; generally adequate loan-to-value ratios at loan origination; and, according to many bank management
perties to be repossessed. As long as property prices were rising consistently, this provisioning methodology adequately covered loan losses. For example, a forced sale discount of 25% previously would have resulted in only moderate losses for loans that were originated at a 60%-80% loan-to-value ratio and in which the collateral had appreciated in value between origination and the liquidation dates; however, provisions calculated under this methodology would not be sufficient to cover expected losses in the Adverse scenario given the Steering Committee forecast for significant home and commercial property price declines.
Prevalence of Loan Modifications in Lieu of Problem Loan Servicing
Loan modifications are common in Cyprus and exist across a broad array of loan types: home loans, consumer, corporate and small and medium enterprises (SME). Modifications often extend loans beyond the contractual maturity, may be . In other cases, modifications rely on third-party personal guarantees or simply result in extensions despite strong evidence
In general, Participating Institutions have been accommodative toward borrowers who face significant liquidity issues (little or negative cash flow generation and minimal cash on balance sheet). Loan repayments are often
the borrower to service the debt. In many cases, overdraft facilities have been used as permanent debt and are usually drawn to the limit and subsequently rolled over.
BANKING SYSTEM OF CYPRUS | INDEPENDENT DUE DILIGENCE REPORT 13
Recognition of Unpaid Interest within Interest Income
Another important feature of the Cyprus banking system has been the relatively high levels of unpaid interest recognized in PIs income statements. Because loan-to-value ratios at origination have generally not been aggressive and because in some cases banks have assumed future property price appreciation up until the point of problem loan resolution, this has enabled banks to assume, in many cases, that some significant portion of unpaid but accrued interest eventually will be realized in the proceeds of a loan resolution. This has helped to support as-reported pre-provision earnings, including reported net interest margins. It has also increased as-reported gross loans. While recognition of unpaid interest in which the accrued amount is expected to be recovered is allowable under IFRS, the amount of unpaid capitalized interest in nt income is unusually high.
Reliance on International Banking Operations
The Cyprus banking system has become an important center of international banking operations over the last decade, and transaction revenues related to international banking have been and are likely to remain critical components of non-interest income for the large Cyprus banks. As is the case in many other centers of international banking, the bulk of these operations relate to transfer and settlement services for client transactions.
The low Cyprus corporate tax rate encourages significant tax optimization activity on the part of the corporate clients of Cyprus banks, and this activity in turn requires significant financial transactional activity facilitated by Cyprus banks. This income segment, which we discuss in greater detail in Section 3.5, is an important stabilizer for Cyprus banks in both the Base and Adverse scenarios, as the level of external demand for these transactional services is expected to remain high and insensitive to Cyprus macroeconomic conditions.
Lending Practices of the Co-operatives Sector
The co-operatives in Cyprus historically have played an important role in providing banking services to under-served communities. In the early years of the sector, much of the activity pursued by the co-operatives was related to agricultural finance and associated transactions. Over time, the co-operatives have become closer to traditional retail banking institutions, now generally providing a full line of standard mortgage, SME and personal lending products. An essential difference between the co-operatives and the banks in Cyprus has been the relative reluctance of co-operative managements to pursue aggressive collection and work-out strategies on problem loans. This relative
belief in the social function of the co-operatives, that is, the aim of the co-operatives is not to maximize profits but to serve their members. This perceived social function of the co-operatives may have helped to develop a culture of non-payment by members in many institutions. Many co-operatives reported the tradition of allowing payment holidays for borrowers experiencing economic difficulties, sometimes with up to two years of forbearance. The provisioning methodology used by the co-operatives, along with most other Cyprus banks, further supported this behavior, especially in the context of the co-operatives relatively conservative loan-to-value underwriting standards combined with rising property prices. The co-operatives generally underwrote to lower loan-to-value ratios than the private banks, so in the event of non-payment there has historically been ample collateral to justify carrying the non-performing loans with no impairment and taking no provision. The co-operatives have recently shown a significant change in their approach to non-performing borrowers, but the history of relatively hands-off treatment of defaulting borrower members has resulted in many co-operative institutions showing non-performing loan levels above those seen at Cyprus banks.
1.2.3 Significant Findings
The idiosyncratic factors described above are reflected in the additional specific findings below:
Loss Absorption Capacity
Cumulative provisions low relative to stock of 90+ days past due (dpd) loans: The Central Bank of Cyprus definition of non-performing loans does not require institutions to recognize provisions on fully secured 90+ dpd loans. As of 30 June 2012 aggregate provision coverage of NPLs was 57% based on the formal definition of NPLs, while provision coverage of all 90+ dpd loans was significantly lower at 36%. Among the Small Co-operatives, provision coverage of 90+ dpd loans was just 9% as of 30 June 2012
BANKING SYSTEM OF CYPRUS | INDEPENDENT DUE DILIGENCE REPORT 14
This means that Participating Institutions have not yet provided fully for the losses anticipated on existing 90+ dpd loans under the Base or Adverse scenarios
Elevated levels of non-cash interest: A significant and rising portion of the interest income reported by Participating Institutions is composed of unpaid interest. This capitalized interest represents an increasing portion of income, having risen from under 7% of net interest income in 2010 to over 20% of net interest income in aggregate for the quarter ending 30 June 2012, effectively boosting the initial capital base for Participating Institutions in addition to enabling PIs to report higher net interest margins. After removing capitalized interest from income, some co-operatives may have had negative net interest margins as of 30 June 2012 on a cash basis
Reliance on funding from non-resident sources: While the core domestic deposit funding of the banking system appears very strong, nearly half of all Cyprus deposits are sourced from non-residents who rely in part on the current system of tax incentives in place in Cyprus. A change in these tax structures could have a significant impact on the overall level of funding in the system. Nonetheless, under the current tax laws, PIs may have the potential to cushion deposit outflows from residents with non-resident and international deposits
Limited alternative funding sources: To fill funding gaps, several PIs rely on access to Emergency Liquidity Assistance (ELA) funding since Cyprus government bonds are not currently eligible as collateral for rfunding for Participating Institutions was from ECB normal operations or ELA. This has resulted in elevated funding costs for some PIs
Significant concentration of DTAs in capital base: Recent losses in Cyprus and Greece have resulted in high levels of deferred tax assets (DTAs) for the largest PIs. As of 30 June 2012, DTAs represented 38% of aggregate Core Tier 1 capital for PIs and nearly 70% for Laiki Bank. These concentrations are likely to rise throughout the forecast period due to high provision expenses and if not capped would represent 80% of aggregate Core Tier 1 capital in the Adverse scenario by 30 June 2015
Loan Loss Analysis
High NPL ratios accompanied by high cure rates and re-default rates: NPL ratios are markedly higher in Cyprus compared to other European countries; however, non-performing loans in Cyprus are also characterized by relatively high cure rates and high levels of collateralization. Loans that have defaulted in the past are more likely to default in the future in both Greece and Cyprus, which mitigates the impact of curing to some extent
High PDs, but low LGDs due to over-collateralization: Because lending decisions have been based on
PIMCO noted many instances of high probabilities of default with low loss severities
High corporate leverage ratios: PIMCO has found that on average leverage ratios are elevated for both Cyprus and Greek corporate borrowers, resulting in higher PDs for corporate loans
Related party loans: Some of the largest exposures at the largest PIs were made to affiliates of the institution. This included cases where PIs lent funds to an offshore investment company that used the
investment companies revealed higher than average losses
BANKING SYSTEM OF CYPRUS | INDEPENDENT DUE DILIGENCE REPORT 15
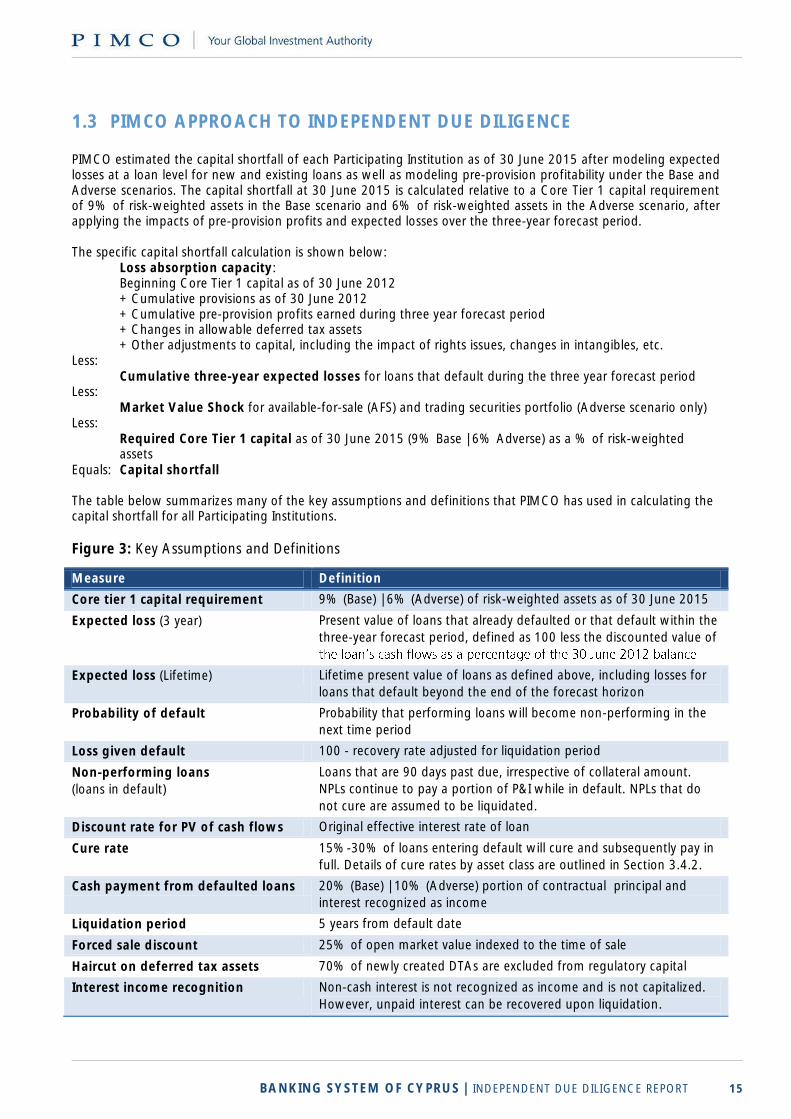
1.3 PIMCO APPROACH TO INDEPENDENT DUE DILIGENCE PIMCO estimated the capital shortfall of each Participating Institution as of 30 June 2015 after modeling expected losses at a loan level for new and existing loans as well as modeling pre-provision profitability under the Base and Adverse scenarios. The capital shortfall at 30 June 2015 is calculated relative to a Core Tier 1 capital requirement of 9% of risk-weighted assets in the Base scenario and 6% of risk-weighted assets in the Adverse scenario, after applying the impacts of pre-provision profits and expected losses over the three-year forecast period. The specific capital shortfall calculation is shown below:
Loss absorption capacity: Beginning Core Tier 1 capital as of 30 June 2012 + Cumulative provisions as of 30 June 2012 + Cumulative pre-provision profits earned during three year forecast period + Changes in allowable deferred tax assets + Other adjustments to capital, including the impact of rights issues, changes in intangibles, etc.
Less: Cumulative three-year expected losses for loans that default during the three year forecast period
Less: Market Value Shock for available-for-sale (AFS) and trading securities portfolio (Adverse scenario only)
Less: Required Core Tier 1 capital as of 30 June 2015 (9% Base | 6% Adverse) as a % of risk-weighted assets
Equals: Capital shortfall The table below summarizes many of the key assumptions and definitions that PIMCO has used in calculating the capital shortfall for all Participating Institutions.
Figure 3: Key Assumptions and Definitions
Measure Definition
Core tier 1 capital requirement 9% (Base) | 6% (Adverse) of risk-weighted assets as of 30 June 2015
Expected loss (3 year) Present value of loans that already defaulted or that default within the
three-year forecast period, defined as 100 less the discounted value of
Expected loss (Lifetime) Lifetime present value of loans as defined above, including losses for
loans that default beyond the end of the forecast horizon
Probability of default Probability that performing loans will become non-performing in the
next time period
Loss given default 100 - recovery rate adjusted for liquidation period
Non-performing loans
(loans in default)
Loans that are 90 days past due, irrespective of collateral amount.
NPLs continue to pay a portion of P&I while in default. NPLs that do
not cure are assumed to be liquidated.
Discount rate for PV of cash flows Original effective interest rate of loan
Cure rate 15%-30% of loans entering default will cure and subsequently pay in
full. Details of cure rates by asset class are outlined in Section 3.4.2.
Cash payment from defaulted loans 20% (Base) | 10% (Adverse) portion of contractual principal and
interest recognized as income
Liquidation period 5 years from default date
Forced sale discount 25% of open market value indexed to the time of sale
Haircut on deferred tax assets 70% of newly created DTAs are excluded from regulatory capital
Interest income recognition Non-cash interest is not recognized as income and is not capitalized.
However, unpaid interest can be recovered upon liquidation.
BANKING SYSTEM OF CYPRUS | INDEPENDENT DUE DILIGENCE REPORT 16
In calculating the capital shortfall, expected losses are netted against loss absorption capacity at the entity level to arrive at a capital shortfall for the system such that a capital surplus of one entity does not reduce the shortfall for other entities. However, this does not apply to the Co-operative Central Bank or to the Professional, Large or Small Co-operative groups as they are modeled collectively and thus the capital surplus of one co-operative can be netted against the capital shortfall at another co-operative. This approach is consistent with the two-way guarantee that allows the capital surplus and shortfall across different co-operative institutions to be netted at a system wide level (for all co-operatives that are a part of the two-way guarantee program).
In modeling the capital shortfall of the co-operatives, PIMCO modeled the Co-operative Central Bank and Limassol Savings Society individually and assigned each of the remaining 15 co-operatives to one of three similar groups: Professional Co-operatives, Large Co-operatives, and Small Co-operatives. Each category of co-operatives was treated as an individual entity for expected loss and capital shortfall calculation purposes, but modeled collectively. The approach for the co-operatives in the Professional, Large and Small groups was as follows:
Expected losses were modeled at an institution-specific level based on the loan level results from our loan loss analysis
Pre-provision profitability was loans relative to peers in the same group
Cumulative provisions and beginning Core Tier 1 capital were captured on an institution-specific basis and all other items were modeled on an allocated basis
Core Tier 1 capital requirements were determined based on the changes in the balance sheet and the institution-specific provisions
In addition, results reflected key drivers from the scenarios provided by the Steering Committee:
Cumulative home price declines during the forecast period of 12.5% in the Base and 25.5% in the
Adverse scenario, in addition to the home price declines that had already occurred before 30 June 2012
Elevated unemployment levels that peak in 2014 at 13.5% and 14.6% under the Base and Adverse
scenarios, respectively
Three-month Euribor forecast reaching 1.20% and 2.45% in 2015 under the Base and Adverse scenarios,
respectively
1.4 AGGREGATE RESULTS
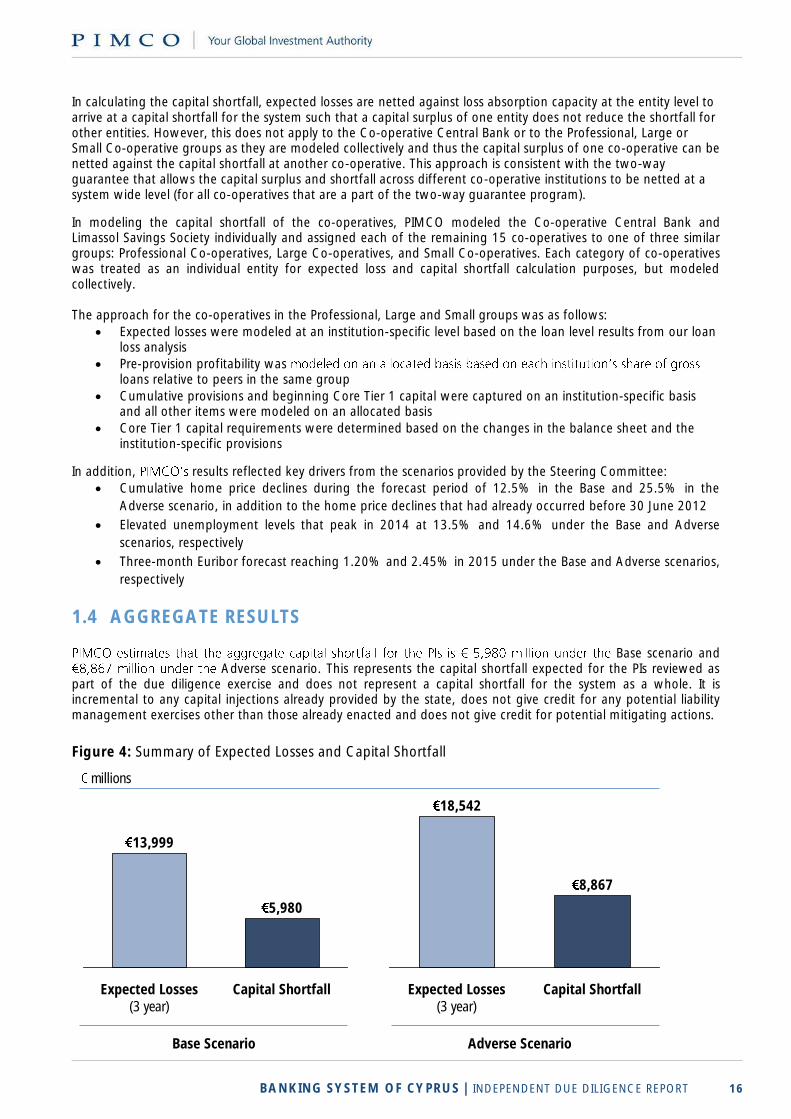
Base scenario and Adverse scenario. This represents the capital shortfall expected for the PIs reviewed as
part of the due diligence exercise and does not represent a capital shortfall for the system as a whole. It is incremental to any capital injections already provided by the state, does not give credit for any potential liability management exercises other than those already enacted and does not give credit for potential mitigating actions.
Figure 4: Summary of Expected Losses and Capital Shortfall
Summary of Expected Losses and Capital Shortfallmillions
Capital Shortfall
5,980
13,999
Expected Losses (3 year)
18,542
Expected Losses (3 year)
Capital Shortfall
8,867
Base Scenario Adverse Scenario
BANKING SYSTEM OF CYPRUS | INDEPENDENT DUE DILIGENCE REPORT 17
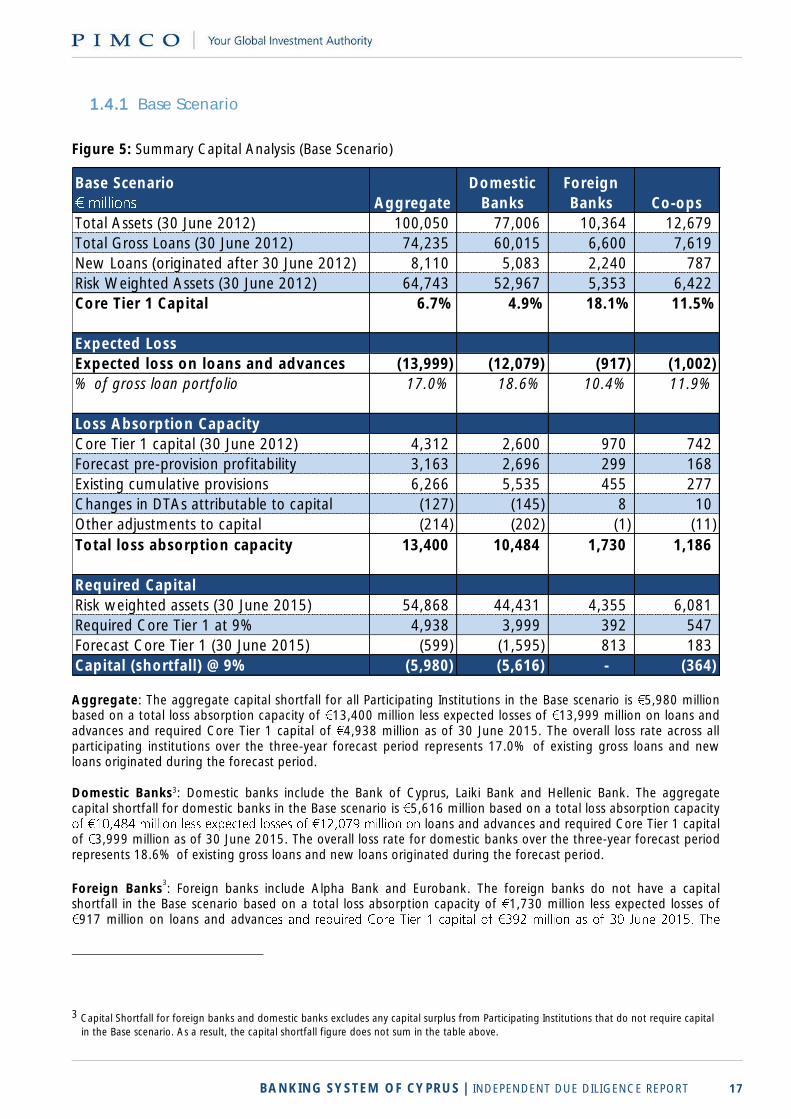
1.4.1 Base Scenario
Figure 5: Summary Capital Analysis (Base Scenario)
Aggregate: The aggregate capital shortfall for all Participating Institutions in the Base scenario is 5,980 million based on a total loss absorption capacity of 13,400 million less expected losses of 13,999 million on loans and advances and required Core Tier 1 capital of 4,938 million as of 30 June 2015. The overall loss rate across all participating institutions over the three-year forecast period represents 17.0% of existing gross loans and new loans originated during the forecast period. Domestic Banks3: Domestic banks include the Bank of Cyprus, Laiki Bank and Hellenic Bank. The aggregate capital shortfall for domestic banks in the Base scenario is 5,616 million based on a total loss absorption capacity
loans and advances and required Core Tier 1 capital of 3,999 million as of 30 June 2015. The overall loss rate for domestic banks over the three-year forecast period represents 18.6% of existing gross loans and new loans originated during the forecast period.
Foreign Banks3: Foreign banks include Alpha Bank and Eurobank. The foreign banks do not have a capital
shortfall in the Base scenario based on a total loss absorption capacity of 1,730 million less expected losses of 917 million on loans and advan
3 Capital Shortfall for foreign banks and domestic banks excludes any capital surplus from Participating Institutions that do not require capital
in the Base scenario. As a result, the capital shortfall figure does not sum in the table above.
Base Scenario
Aggregate
Domestic
Banks
Foreign
Banks Co-ops
Total Assets (30 June 2012) 100,050 77,006 10,364 12,679
Total Gross Loans (30 June 2012) 74,235 60,015 6,600 7,619
New Loans (originated after 30 June 2012) 8,110 5,083 2,240 787
Risk Weighted Assets (30 June 2012) 64,743 52,967 5,353 6,422
Core Tier 1 Capital 6.7% 4.9% 18.1% 11.5%
Expected Loss
Expected loss on loans and advances (13,999) (12,079) (917) (1,002)
% of gross loan portfolio 17.0% 18.6% 10.4% 11.9%
Loss Absorption Capacity
Core Tier 1 capital (30 June 2012) 4,312 2,600 970 742
Forecast pre-provision profitability 3,163 2,696 299 168
Existing cumulative provisions 6,266 5,535 455 277
Changes in DTAs attributable to capital (127) (145) 8 10
Other adjustments to capital (214) (202) (1) (11)
Total loss absorption capacity 13,400 10,484 1,730 1,186
Required Capital
Risk weighted assets (30 June 2015) 54,868 44,431 4,355 6,081
Required Core Tier 1 at 9% 4,938 3,999 392 547
Forecast Core Tier 1 (30 June 2015) (599) (1,595) 813 183
Capital (shortfall) @ 9% (5,980) (5,616) - (364)
BANKING SYSTEM OF CYPRUS | INDEPENDENT DUE DILIGENCE REPORT 18
overall loss rate for foreign banks over the three-year forecast period represents 10.4% of existing gross loans and new loans originated during the forecast period. Co-operative Credit Societies: Cooperative Credit Societies (CCS) include the Co-operative Central Bank, Limassol Savings Society and fifteen co-operatives classified as Large, Small and Professional CCS. The aggregate capital shortfall for the co-operatives in the Base scenario is 364 million based on a total loss absorption capacity of 1,186 million less expected losses of 1,002 million on loans and advances and required Core Tier 1 capital of 547 million as of 30 June 2015. The overall loss rate for co-operatives over the three-year forecast period
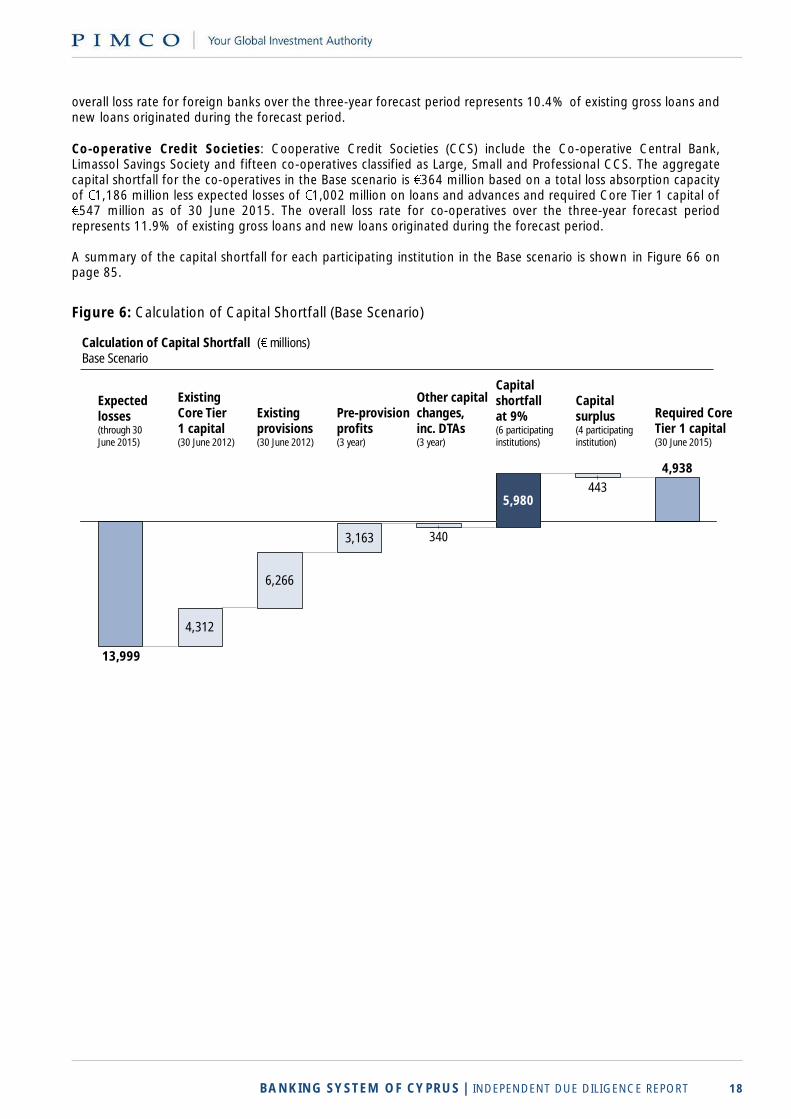
represents 11.9% of existing gross loans and new loans originated during the forecast period. A summary of the capital shortfall for each participating institution in the Base scenario is shown in Figure 66 on page 85.
Figure 6: Calculation of Capital Shortfall (Base Scenario)
Calculation of Capital Shortfall ( millions)Base Scenario
4,312
6,266
3,163
13,999
Pre-provision profits (3 year)
Required Core Tier 1 capital(30 June 2015)
443
Capital surplus (4 participating institution)
4,938
Capital shortfall at 9% (6 participating institutions)
5,980
Other capital changes, inc. DTAs (3 year)
340
Existing provisions (30 June 2012)
Existing Core Tier 1 capital(30 June 2012)
Expected losses (through 30 June 2015)
BANKING SYSTEM OF CYPRUS | INDEPENDENT DUE DILIGENCE REPORT 19
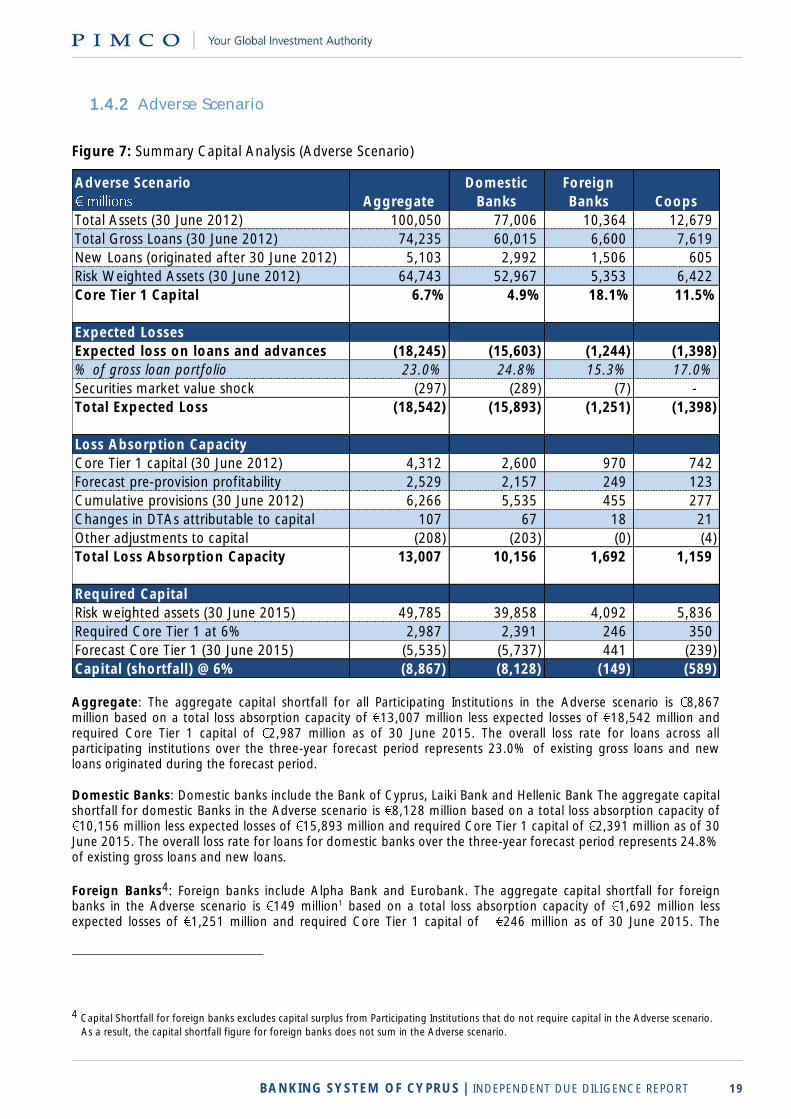
1.4.2 Adverse Scenario
Figure 7: Summary Capital Analysis (Adverse Scenario)
Aggregate: The aggregate capital shortfall for all Participating Institutions in the Adverse scenario is 8,867 million based on a total loss absorption capacity of 13,007 million less expected losses of 18,542 million and required Core Tier 1 capital of 2,987 million as of 30 June 2015. The overall loss rate for loans across all participating institutions over the three-year forecast period represents 23.0% of existing gross loans and new loans originated during the forecast period. Domestic Banks: Domestic banks include the Bank of Cyprus, Laiki Bank and Hellenic Bank The aggregate capital shortfall for domestic Banks in the Adverse scenario is 8,128 million based on a total loss absorption capacity of 10,156 million less expected losses of 15,893 million and required Core Tier 1 capital of 2,391 million as of 30
June 2015. The overall loss rate for loans for domestic banks over the three-year forecast period represents 24.8% of existing gross loans and new loans.
Foreign Banks4: Foreign banks include Alpha Bank and Eurobank. The aggregate capital shortfall for foreign banks in the Adverse scenario is 149 million1 based on a total loss absorption capacity of 1,692 million less expected losses of 1,251 million and required Core Tier 1 capital of 246 million as of 30 June 2015. The
4 Capital Shortfall for foreign banks excludes capital surplus from Participating Institutions that do not require capital in the Adverse scenario.
As a result, the capital shortfall figure for foreign banks does not sum in the Adverse scenario.
Adverse Scenario
Aggregate
Domestic
Banks
Foreign
Banks Coops
Total Assets (30 June 2012) 100,050 77,006 10,364 12,679
Total Gross Loans (30 June 2012) 74,235 60,015 6,600 7,619
New Loans (originated after 30 June 2012) 5,103 2,992 1,506 605
Risk Weighted Assets (30 June 2012) 64,743 52,967 5,353 6,422
Core Tier 1 Capital 6.7% 4.9% 18.1% 11.5%
Expected Losses
Expected loss on loans and advances (18,245) (15,603) (1,244) (1,398)
% of gross loan portfolio 23.0% 24.8% 15.3% 17.0%
Securities market value shock (297) (289) (7) -
Total Expected Loss (18,542) (15,893) (1,251) (1,398)
Loss Absorption Capacity
Core Tier 1 capital (30 June 2012) 4,312 2,600 970 742
Forecast pre-provision profitability 2,529 2,157 249 123
Cumulative provisions (30 June 2012) 6,266 5,535 455 277
Changes in DTAs attributable to capital 107 67 18 21
Other adjustments to capital (208) (203) (0) (4)
Total Loss Absorption Capacity 13,007 10,156 1,692 1,159
Required Capital
Risk weighted assets (30 June 2015) 49,785 39,858 4,092 5,836
Required Core Tier 1 at 6% 2,987 2,391 246 350
Forecast Core Tier 1 (30 June 2015) (5,535) (5,737) 441 (239)
Capital (shortfall) @ 6% (8,867) (8,128) (149) (589)
BANKING SYSTEM OF CYPRUS | INDEPENDENT DUE DILIGENCE REPORT 20
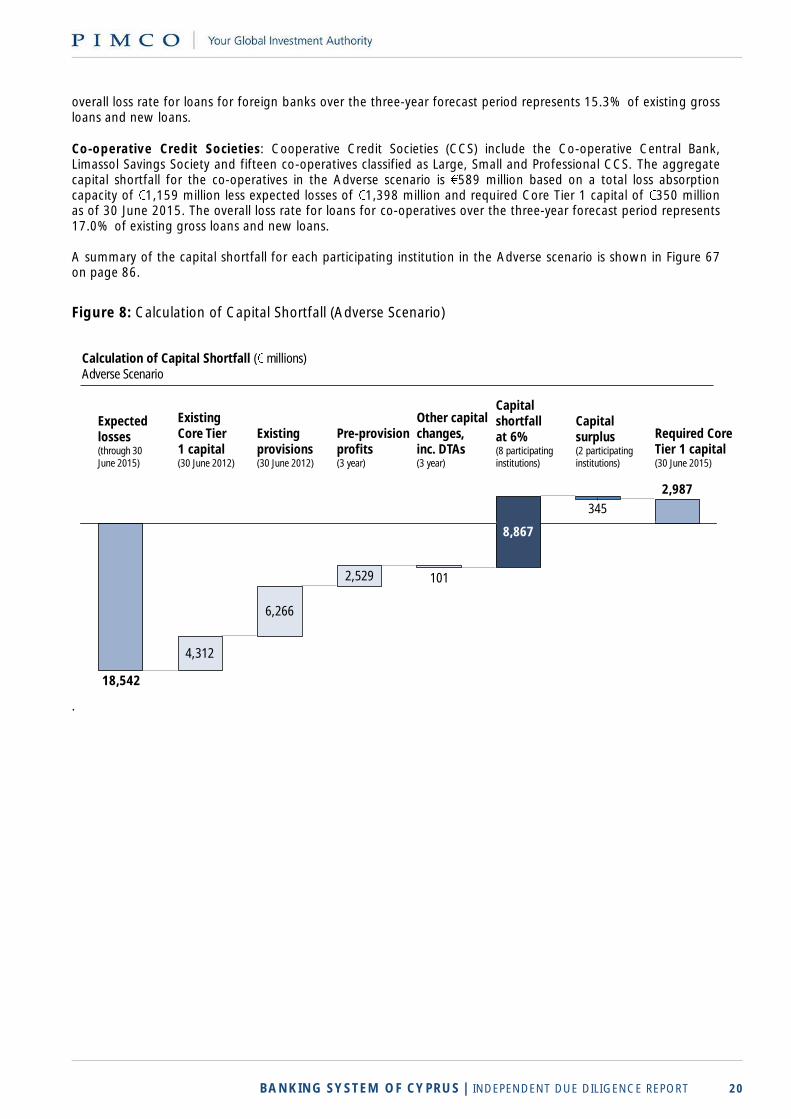
overall loss rate for loans for foreign banks over the three-year forecast period represents 15.3% of existing gross loans and new loans. Co-operative Credit Societies: Cooperative Credit Societies (CCS) include the Co-operative Central Bank, Limassol Savings Society and fifteen co-operatives classified as Large, Small and Professional CCS. The aggregate capital shortfall for the co-operatives in the Adverse scenario is 589 million based on a total loss absorption capacity of 1,159 million less expected losses of 1,398 million and required Core Tier 1 capital of 350 million as of 30 June 2015. The overall loss rate for loans for co-operatives over the three-year forecast period represents 17.0% of existing gross loans and new loans. A summary of the capital shortfall for each participating institution in the Adverse scenario is shown in Figure 67 on page 86.
Figure 8: Calculation of Capital Shortfall (Adverse Scenario)
Calculation of Capital Shortfall ( millions)Adverse Scenario
4,312
6,266
2,529 101
18,542
2,987
Capital surplus (2 participating institutions)
345
Capital shortfall at 6%(8 participating institutions)
8,867
Other capital changes, inc. DTAs (3 year)
Pre-provision profits (3 year)
Existing provisions (30 June 2012)
Existing Core Tier 1 capital(30 June 2012)
Expected losses (through 30 June 2015)
Required Core Tier 1 capital(30 June 2015)
.
BANKING SYSTEM OF CYPRUS | INDEPENDENT DUE DILIGENCE REPORT 21
2 Loss Absorption Capacity
2.1 OVERVIEW The loss absorption workstream evaluated detailed business plans provided by each Participating Institution to develop three year financial statements that modeled pre-provision profitability and converted expected loan losses into provisions. In addition, PIMCO conducted in-depth meetings with senior management of each PI in
ategy, performance, business model, core strengths, competitive position and forecasted capital plan. PIMCO used the business plans provided by bank management to develop its own financial models which incorporated the macroeconomic scenarios provided by the SC and other industry data to forecast each driver of pre-provision profit. The key financial statement elements modeled for each PI included:
Deleveraging
Interest income
Interest expense
Non-interest income
Non-interest expense
Loan losses and provisions
Deferred tax assets (DTAs)
Risk-weighted assets (RWAs)
Securities
Non-bank subsidiaries
Each of these components is described in the corresponding methodology section below.
BANKING SYSTEM OF CYPRUS | INDEPENDENT DUE DILIGENCE REPORT 22
2.2 DELEVERAGING AND NEW LENDING
2.2.1 Methodology
PIMCO modeled the deleveraging path of net domestic credit within the Cypriot banking system to ensure that
the aggregate decline in domestic credit was consistent with the Base and Adverse scenarios. PIMCO did not
explicitly model deleveraging in Greece or other foreign countries where Cypriot banks do not represent a
significant portion of overall domestic credit.
PIMCO triangulated the system-wide deleveraging path for domestic credit in Cyprus using three approaches:
Natural deleveraging due to loan losses. Loan losses and capital constraints are likely to be the primary
drivers of deleveraging in Cyprus over the next three years. As such, significant deleveraging is likely to occur
naturally from the provisioning for expected losses modeled by the loan loss workstream.
Credit renewal rate required to maintain the level of economic activity anticipated in the Steering
Committee macroeconomic scenarios. PIMCO anticipates that the economy will not be able to achieve the
Base or Adverse level of GDP without some renewal of credit and thus PIMCO calculated a replacement level
would be required to replace those loans that mature and payoff in each period. Although lending is likely to
remain below this replacement level for at least the next several quarters, new lending will be an important
driver of growth as the economy improves.
Historical comparison based on a review of historical episodes of the deleveraging path of domestic credit
in other countries during the first three years following a banking or financial crisis.
PIMCO reviewed trends in domestic credit as a fraction of GDP from the World Bank and identified
the 16 recent episodes of deleveraging during which domestic credit declined by more than a third
from its peak or by at least 25% of GDP.
The median cumulative decline in domestic credit among these episodes was 23% (e.g., total
domestic credit declined from 100 to 77 during the first three years of deleveraging). PIMCO used
this as a benchmark for the Base scenario, but also incorporated new lending projections based on PI
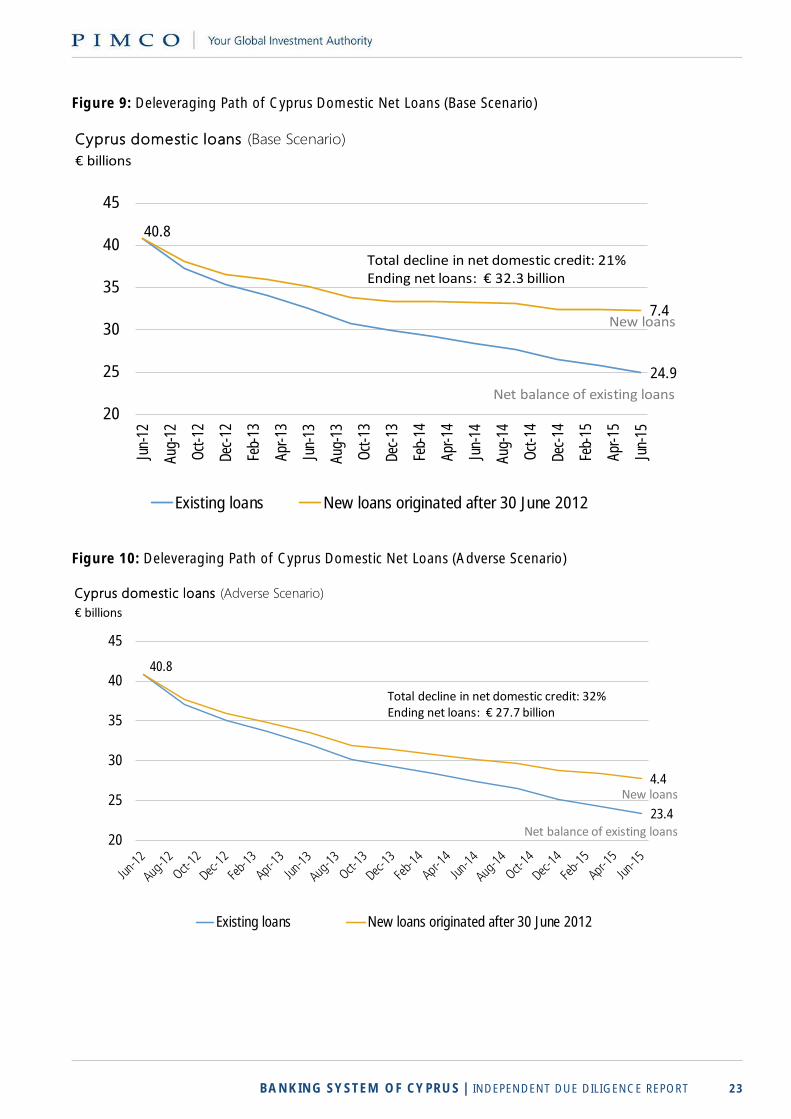
business plans. The resulting aggregate deleveraging path in the Base scenario assumes a 21%
decline in net domestic lending during the forecast period.
The median cumulative decline in domestic credit for the most severe of these episodes was 33%
(e.g., total domestic credit declined from 100 to 67 during the first three years of deleveraging).
PIMCO used this as a benchmark for the Adverse scenario with minor adjustments. The resulting
aggregate deleveraging path in the Adverse scenario assumes a 32% decline in net domestic lending
during the forecast period.
Based on these analyses, PIMCO modeled a deleveraging path in line with the historical episodes outlined
above and solved for new lending as the volume of new loans and/or loan renewals required to achieve the
target level of domestic credit (see Figure 6 and Figure 7 below). PIMCO did not assume any deleveraging
associated with disposition of assets.
BANKING SYSTEM OF CYPRUS | INDEPENDENT DUE DILIGENCE REPORT 23
Figure 9: Deleveraging Path of Cyprus Domestic Net Loans (Base Scenario)
Figure 10: Deleveraging Path of Cyprus Domestic Net Loans (Adverse Scenario)
Cyprus domestic loans (Base Scenario)
€ billions
40.8
24.9
7.4
20
25
30
35
40
45
Jun-
12
Aug-
12
Oct
-12
Dec-
12
Feb-
13
Apr-
13
Jun-
13
Aug-
13
Oct
-13
Dec-
13
Feb-
14
Apr-
14
Jun-
14
Aug-
14
Oct
-14
Dec-
14
Feb-
15
Apr-
15
Jun-
15
Existing loans New loans originated after 30 June 2012
Total decline in net domestic credit: 21%Ending net loans: € 32.3 billion
New loans
Net balance of existing loans
Cyprus domestic loans (Adverse Scenario)
€ billions
40.8
23.4
4.4
20
25
30
35
40
45
Existing loans New loans originated after 30 June 2012
Total decline in net domestic credit: 32%Ending net loans: € 27.7 billion
New loans
Net balance of existing loans
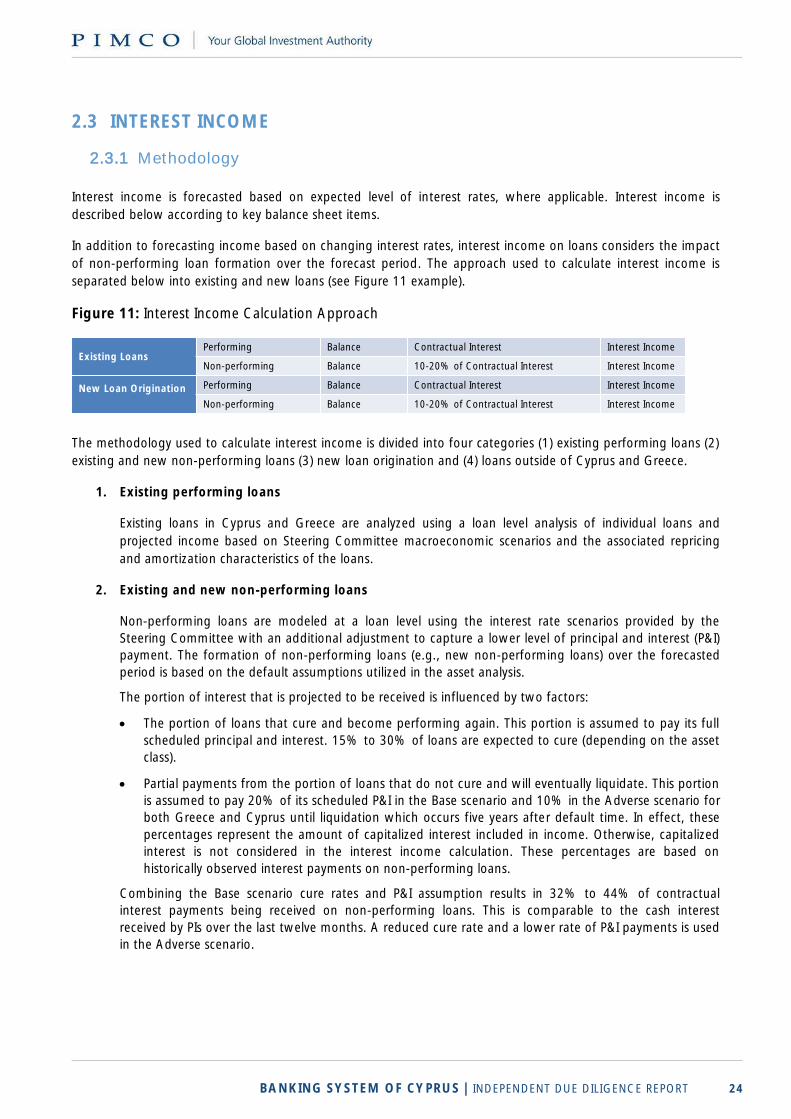
BANKING SYSTEM OF CYPRUS | INDEPENDENT DUE DILIGENCE REPORT 24
2.3 INTEREST INCOME
2.3.1 Methodology
Interest income is forecasted based on expected level of interest rates, where applicable. Interest income is
described below according to key balance sheet items.
In addition to forecasting income based on changing interest rates, interest income on loans considers the impact
of non-performing loan formation over the forecast period. The approach used to calculate interest income is
separated below into existing and new loans (see Figure 11 example).
Figure 11: Interest Income Calculation Approach
The methodology used to calculate interest income is divided into four categories (1) existing performing loans (2)
existing and new non-performing loans (3) new loan origination and (4) loans outside of Cyprus and Greece.
1. Existing performing loans
Existing loans in Cyprus and Greece are analyzed using a loan level analysis of individual loans and
projected income based on Steering Committee macroeconomic scenarios and the associated repricing
and amortization characteristics of the loans.
2. Existing and new non-performing loans
Non-performing loans are modeled at a loan level using the interest rate scenarios provided by the
Steering Committee with an additional adjustment to capture a lower level of principal and interest (P&I)
payment. The formation of non-performing loans (e.g., new non-performing loans) over the forecasted
period is based on the default assumptions utilized in the asset analysis.
The portion of interest that is projected to be received is influenced by two factors:
The portion of loans that cure and become performing again. This portion is assumed to pay its full
scheduled principal and interest. 15% to 30% of loans are expected to cure (depending on the asset
class).
Partial payments from the portion of loans that do not cure and will eventually liquidate. This portion
is assumed to pay 20% of its scheduled P&I in the Base scenario and 10% in the Adverse scenario for
both Greece and Cyprus until liquidation which occurs five years after default time. In effect, these
percentages represent the amount of capitalized interest included in income. Otherwise, capitalized
interest is not considered in the interest income calculation. These percentages are based on
historically observed interest payments on non-performing loans.
Combining the Base scenario cure rates and P&I assumption results in 32% to 44% of contractual
interest payments being received on non-performing loans. This is comparable to the cash interest
received by PIs over the last twelve months. A reduced cure rate and a lower rate of P&I payments is used
in the Adverse scenario.
Existing LoansPerforming Balance Contractual Interest Interest Income
Non-performing Balance 10-20% of Contractual Interest Interest Income
New Loan Origination Performing Balance Contractual Interest Interest Income
Non-performing Balance 10-20% of Contractual Interest Interest Income
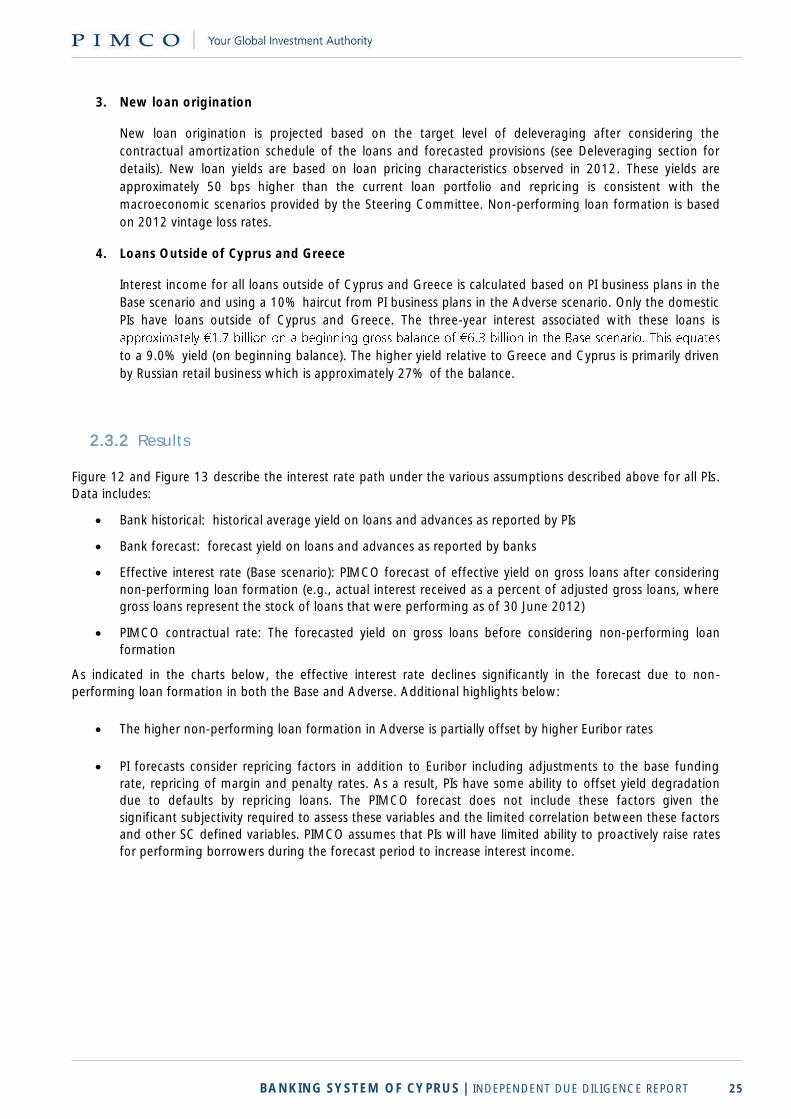
BANKING SYSTEM OF CYPRUS | INDEPENDENT DUE DILIGENCE REPORT 25
3. New loan origination
New loan origination is projected based on the target level of deleveraging after considering the
contractual amortization schedule of the loans and forecasted provisions (see Deleveraging section for
details). New loan yields are based on loan pricing characteristics observed in 2012. These yields are
approximately 50 bps higher than the current loan portfolio and repricing is consistent with the
macroeconomic scenarios provided by the Steering Committee. Non-performing loan formation is based
on 2012 vintage loss rates.
4. Loans Outside of Cyprus and Greece
Interest income for all loans outside of Cyprus and Greece is calculated based on PI business plans in the
Base scenario and using a 10% haircut from PI business plans in the Adverse scenario. Only the domestic
PIs have loans outside of Cyprus and Greece. The three-year interest associated with these loans is
to a 9.0% yield (on beginning balance). The higher yield relative to Greece and Cyprus is primarily driven
by Russian retail business which is approximately 27% of the balance.
2.3.2 Results Figure 12 and Figure 13 describe the interest rate path under the various assumptions described above for all PIs.
Data includes:
Bank historical: historical average yield on loans and advances as reported by PIs
Bank forecast: forecast yield on loans and advances as reported by banks
Effective interest rate (Base scenario): PIMCO forecast of effective yield on gross loans after considering
non-performing loan formation (e.g., actual interest received as a percent of adjusted gross loans, where
gross loans represent the stock of loans that were performing as of 30 June 2012)
PIMCO contractual rate: The forecasted yield on gross loans before considering non-performing loan
formation
As indicated in the charts below, the effective interest rate declines significantly in the forecast due to non-
performing loan formation in both the Base and Adverse. Additional highlights below:
The higher non-performing loan formation in Adverse is partially offset by higher Euribor rates
PI forecasts consider repricing factors in addition to Euribor including adjustments to the base funding
rate, repricing of margin and penalty rates. As a result, PIs have some ability to offset yield degradation
due to defaults by repricing loans. The PIMCO forecast does not include these factors given the
significant subjectivity required to assess these variables and the limited correlation between these factors
and other SC defined variables. PIMCO assumes that PIs will have limited ability to proactively raise rates
for performing borrowers during the forecast period to increase interest income.
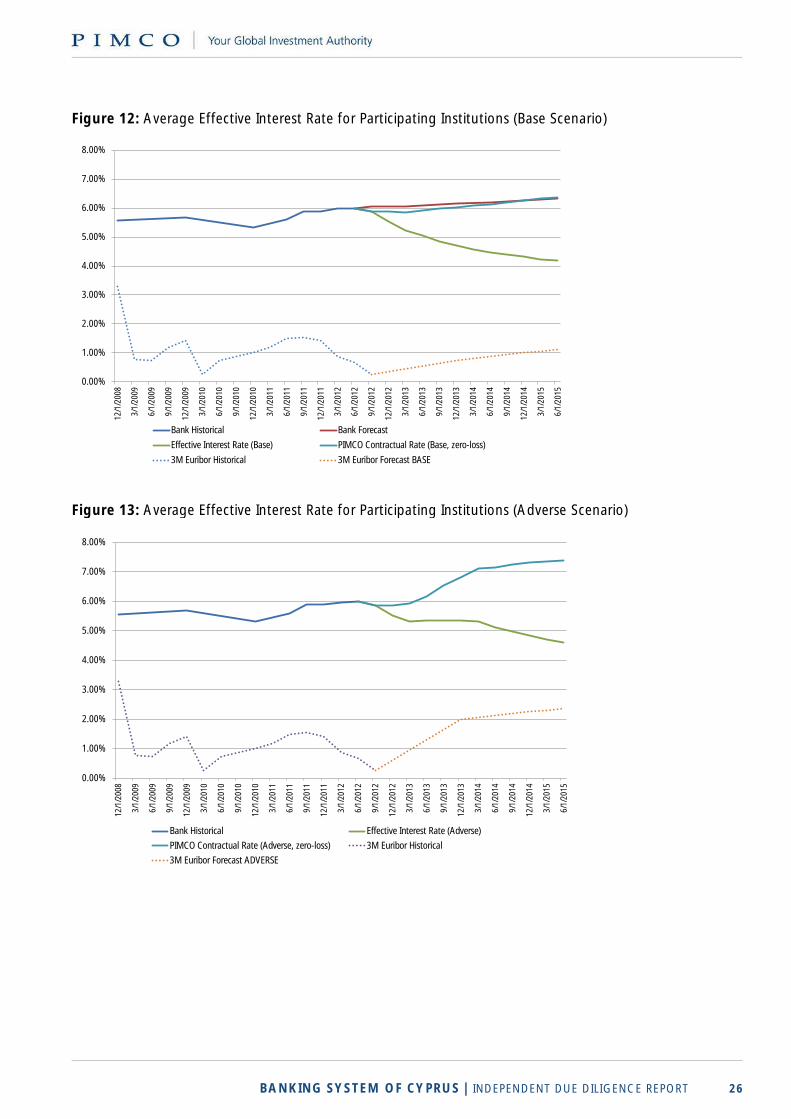
BANKING SYSTEM OF CYPRUS | INDEPENDENT DUE DILIGENCE REPORT 26
Figure 12: Average Effective Interest Rate for Participating Institutions (Base Scenario)
0.00%
1.00%
2.00%
3.00%
4.00%
5.00%
6.00%
7.00%
8.00%
12/1
/200
8
3/1/
2009
6/1/
2009
9/1/
2009
12/1
/200
9
3/1/
2010
6/1/
2010
9/1/
2010
12/1
/201
0
3/1/
2011
6/1/
2011
9/1/
2011
12/1
/201
1
3/1/
2012
6/1/
2012
9/1/
2012
12/1
/201
2
3/1/
2013
6/1/
2013
9/1/
2013
12/1
/201
3
3/1/
2014
6/1/
2014
9/1/
2014
12/1
/201
4
3/1/
2015
6/1/
2015
Bank Historical Bank Forecast
Effective Interest Rate (Base) PIMCO Contractual Rate (Base, zero-loss)
3M Euribor Historical 3M Euribor Forecast BASE
Figure 13: Average Effective Interest Rate for Participating Institutions (Adverse Scenario)
0.00%
1.00%
2.00%
3.00%
4.00%
5.00%
6.00%
7.00%
8.00%
12/1
/200
8
3/1/
2009
6/1/
2009
9/1/
2009
12/1
/200
9
3/1/
2010
6/1/
2010
9/1/
2010
12/1
/201
0
3/1/
2011
6/1/
2011
9/1/
2011
12/1
/201
1
3/1/
2012
6/1/
2012
9/1/
2012
12/1
/201
2
3/1/
2013
6/1/
2013
9/1/
2013
12/1
/201
3
3/1/
2014
6/1/
2014
9/1/
2014
12/1
/201
4
3/1/
2015
6/1/
2015
Bank Historical Effective Interest Rate (Adverse)
PIMCO Contractual Rate (Adverse, zero-loss) 3M Euribor Historical
3M Euribor Forecast ADVERSE
BANKING SYSTEM OF CYPRUS | INDEPENDENT DUE DILIGENCE REPORT 27
2.4 INTEREST EXPENSE
2.4.1 Methodology
Deposits
The largest contributor to interest expense is expense related to deposits given that the PIs are primarily deposit
funded. There are a number of deposit categories for each of the PIs including Cyprus resident and Cyprus non-
resident deposits in addition to Greek, Russian and other country deposits for select PIs. To forecast deposit
balance growth (flows) and deposit rates for each PI, PIMCO first projected system-wide deposit flows and rates
for the country as a whole. The countries for which PIMCO projected system-wide flows and rates were Cyprus,
Greece and Russia. For UK and other country deposits PIMCO determined that using the projections provided by
the PIs was reasonable (this applied only to two banks).
Deposit Flows
Country-level deposit forecasts were developed using historical experiences in other countries such as Greece,
Ireland, Italy, Spain and Portugal. A variety of underlying fundamental economic data such as unemployment rate,
real GDP as well as other variables were used to determine the best approach to forecasting deposit flows. The
analysis indicated that the best factors for forecasting deposit flows were 10-year credit spreads, previous deposit
growth and real GDP. Additionally, the analysis indicated that real GDP and 10-year credit spreads had similar
impacts on deposit flow forecasts with the coefficient for real GDP a positive number and the coefficient for 10-
year credit spreads a negative number. PIMCO determined credit spreads based on the government bond yields
provided by the Steering Committee for each scenario. Real GDP growth rates were also provided by the Steering
Committee for each country for both scenarios. This approach was used as a guide in conjunction with the
experience of other countries for developing forecasts for future deposit growth in various countries.
Non-time deposit flows were projected to be in line with time deposit flows for periods in which PIMCO projected
overall deposit inflows. For periods in which PIMCO projected overall deposit outflows, non-time deposit outflows
were projected to be slightly higher than the outflows for time deposits. Therefore, PIMCO allowed the maturity
profile of deposits to fluctuate over time. However, the impact of this assumption was minimal on the overall
maturity profile of deposits.
Deposit flows for specific PIs were determined based on the relative rate differential between PIs. For any given
quarter, PIs paying above average rates on deposits experienced slightly less outflows or slightly more inflows for
that period. Those PIs paying below average rates on deposits for a given quarter were projected to have slightly
more outflows or slightly less inflows for that period. In this way, PIMCO estimated changes in market share
between PIs. PIMCO observed that in the historical period, PIs with weaker credit quality and lower capital levels
were paying higher than average deposit rates in Cyprus.
For Cyprus non-resident deposits, flows were projected based on underlying fundamentals in Cyprus and in
Russia. These deposits often have ties to countries outside of Cyprus and therefore were modeled as such. Greek
deposit flows were based on factors in Greece and Russian deposit flows were based entirely on Russian
economic factors. This methodology resulted in a benefit to cumulative deposit flows for PIs with exposure to
Russia but a decrease in deposit flows for those with exposure to Greece.
The draft memorandum of understanding (MOU) from the troika considers potential changes to the prudential
liquidity requirement that would require a minimum liquidity ratio of 60% for non-resident deposits. This
provision, as well as other structural changes related to the legal framework or provisions in the final MOU have
the potential to change forecasts for deposit flows particularly for non-resident deposits. However, the analysis
conducted does not take these potential changes into account given the lack of certainty around the potential
nature and execution of any such changes.
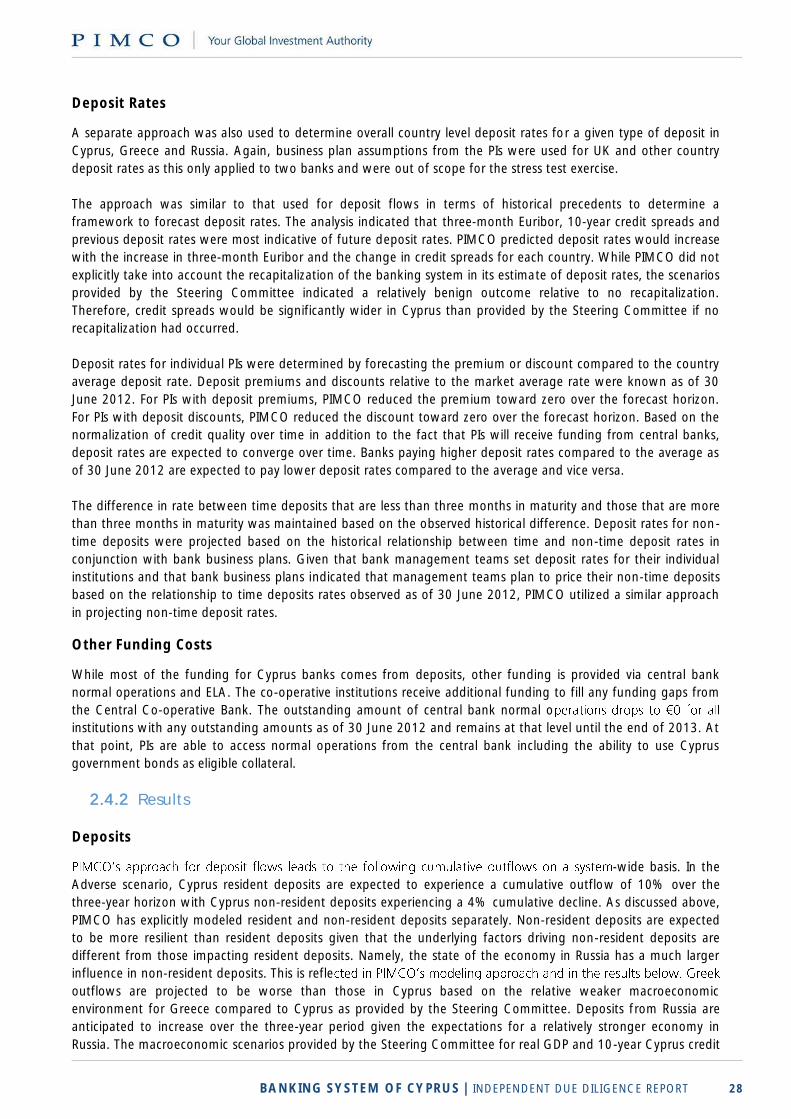
BANKING SYSTEM OF CYPRUS | INDEPENDENT DUE DILIGENCE REPORT 28
Deposit Rates
A separate approach was also used to determine overall country level deposit rates for a given type of deposit in
Cyprus, Greece and Russia. Again, business plan assumptions from the PIs were used for UK and other country
deposit rates as this only applied to two banks and were out of scope for the stress test exercise.
The approach was similar to that used for deposit flows in terms of historical precedents to determine a
framework to forecast deposit rates. The analysis indicated that three-month Euribor, 10-year credit spreads and
previous deposit rates were most indicative of future deposit rates. PIMCO predicted deposit rates would increase
with the increase in three-month Euribor and the change in credit spreads for each country. While PIMCO did not
explicitly take into account the recapitalization of the banking system in its estimate of deposit rates, the scenarios
provided by the Steering Committee indicated a relatively benign outcome relative to no recapitalization.
Therefore, credit spreads would be significantly wider in Cyprus than provided by the Steering Committee if no
recapitalization had occurred.
Deposit rates for individual PIs were determined by forecasting the premium or discount compared to the country
average deposit rate. Deposit premiums and discounts relative to the market average rate were known as of 30
June 2012. For PIs with deposit premiums, PIMCO reduced the premium toward zero over the forecast horizon.
For PIs with deposit discounts, PIMCO reduced the discount toward zero over the forecast horizon. Based on the
normalization of credit quality over time in addition to the fact that PIs will receive funding from central banks,
deposit rates are expected to converge over time. Banks paying higher deposit rates compared to the average as
of 30 June 2012 are expected to pay lower deposit rates compared to the average and vice versa.
The difference in rate between time deposits that are less than three months in maturity and those that are more
than three months in maturity was maintained based on the observed historical difference. Deposit rates for non-
time deposits were projected based on the historical relationship between time and non-time deposit rates in
conjunction with bank business plans. Given that bank management teams set deposit rates for their individual
institutions and that bank business plans indicated that management teams plan to price their non-time deposits
based on the relationship to time deposits rates observed as of 30 June 2012, PIMCO utilized a similar approach
in projecting non-time deposit rates.
Other Funding Costs
While most of the funding for Cyprus banks comes from deposits, other funding is provided via central bank
normal operations and ELA. The co-operative institutions receive additional funding to fill any funding gaps from
the Central Co-operative Bank. The outstanding amount of central bank normal o
institutions with any outstanding amounts as of 30 June 2012 and remains at that level until the end of 2013. At
that point, PIs are able to access normal operations from the central bank including the ability to use Cyprus
government bonds as eligible collateral.
2.4.2 Results
Deposits
-wide basis. In the
Adverse scenario, Cyprus resident deposits are expected to experience a cumulative outflow of 10% over the
three-year horizon with Cyprus non-resident deposits experiencing a 4% cumulative decline. As discussed above,
PIMCO has explicitly modeled resident and non-resident deposits separately. Non-resident deposits are expected
to be more resilient than resident deposits given that the underlying factors driving non-resident deposits are
different from those impacting resident deposits. Namely, the state of the economy in Russia has a much larger
influence in non-resident deposits. This is refle
outflows are projected to be worse than those in Cyprus based on the relative weaker macroeconomic
environment for Greece compared to Cyprus as provided by the Steering Committee. Deposits from Russia are
anticipated to increase over the three-year period given the expectations for a relatively stronger economy in
Russia. The macroeconomic scenarios provided by the Steering Committee for real GDP and 10-year Cyprus credit
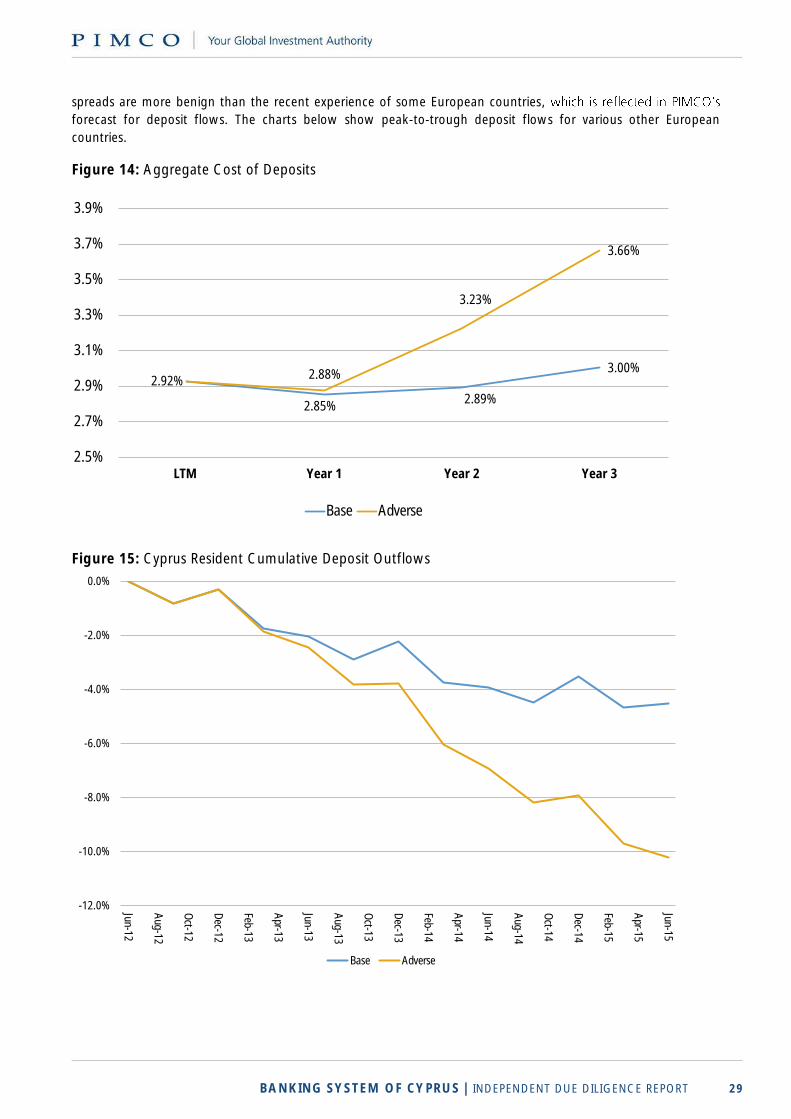
BANKING SYSTEM OF CYPRUS | INDEPENDENT DUE DILIGENCE REPORT 29
spreads are more benign than the recent experience of some European countries,
forecast for deposit flows. The charts below show peak-to-trough deposit flows for various other European
countries.
Figure 14: Aggregate Cost of Deposits
Figure 15: Cyprus Resident Cumulative Deposit Outflows
2.92%
2.85%2.89%
3.00%2.88%
3.23%
3.66%
2.5%
2.7%
2.9%
3.1%
3.3%
3.5%
3.7%
3.9%
LTM Year 1 Year 2 Year 3
Base Adverse
-12.0%
-10.0%
-8.0%
-6.0%
-4.0%
-2.0%
0.0%
Jun-12
Aug-12
Oct-12
Dec-12
Feb-13
Apr-13
Jun-13
Aug-13
Oct-13
Dec-13
Feb-14
Apr-14
Jun-14
Aug-14
Oct-14
Dec-14
Feb-15
Apr-15
Jun-15
Base Adverse
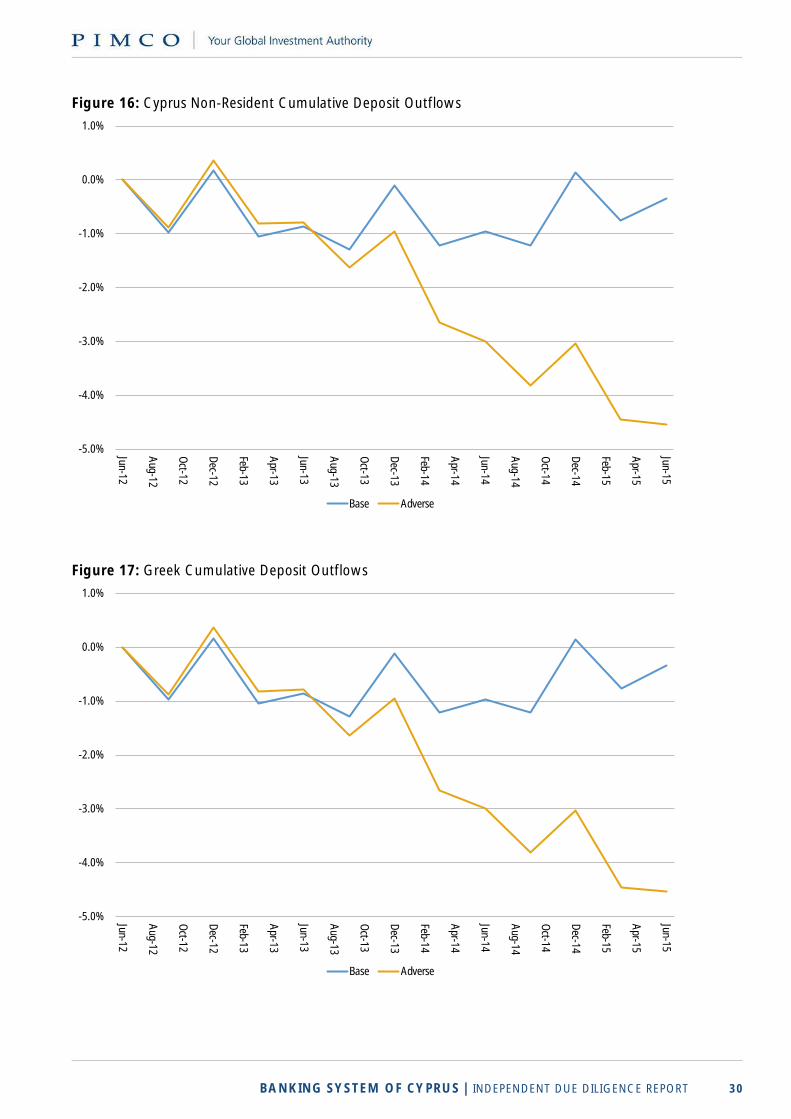
BANKING SYSTEM OF CYPRUS | INDEPENDENT DUE DILIGENCE REPORT 30
Figure 16: Cyprus Non-Resident Cumulative Deposit Outflows
Figure 17: Greek Cumulative Deposit Outflows
-5.0%
-4.0%
-3.0%
-2.0%
-1.0%
0.0%
1.0%
Jun-12
Aug-12
Oct-12
Dec-12
Feb-13
Apr-13
Jun-13
Aug-13
Oct-13
Dec-13
Feb-14
Apr-14
Jun-14
Aug-14
Oct-14
Dec-14
Feb-15
Apr-15
Jun-15
Base Adverse
-5.0%
-4.0%
-3.0%
-2.0%
-1.0%
0.0%
1.0%
Jun-12
Aug-12
Oct-12
Dec-12
Feb-13
Apr-13
Jun-13
Aug-13
Oct-13
Dec-13
Feb-14
Apr-14
Jun-14
Aug-14
Oct-14
Dec-14
Feb-15
Apr-15
Jun-15
Base Adverse
BANKING SYSTEM OF CYPRUS | INDEPENDENT DUE DILIGENCE REPORT 31
Figure 18: Russian Cumulative Deposit Inflows
Figure 19: Euro Area Bank Deposits (Non-financial, Household and Other Gov.)
(T= month in which total deposits peaked)
-2.0%
-1.0%
0.0%
1.0%
2.0%
3.0%
4.0%
5.0%
6.0%
7.0%
Jun-12
Aug-12
Oct-12
Dec-12
Feb-13
Apr-13
Jun-13
Aug-13
Oct-13
Dec-13
Feb-14
Apr-14
Jun-14
Aug-14
Oct-14
Dec-14
Feb-15
Apr-15
Jun-15
Base Adverse
0
20
40
60
80
100
120
T 2 4 6 8 10 12 14 16 18 20 22 24 26 28 30 32 34 36 38 40 42 44 46 48
Index
100 a
t m
onth
T (peak in
deposi
ts)
Months from peak in deposits (month T)
Cyprus (T=Dec 2010)
Greece (T=Sep 2009)
Ireland (T= Aug 2008)
Spain (T= Jul 2011)
Italy (T= Dec 2010)
Portugal (T= Oct 2011)
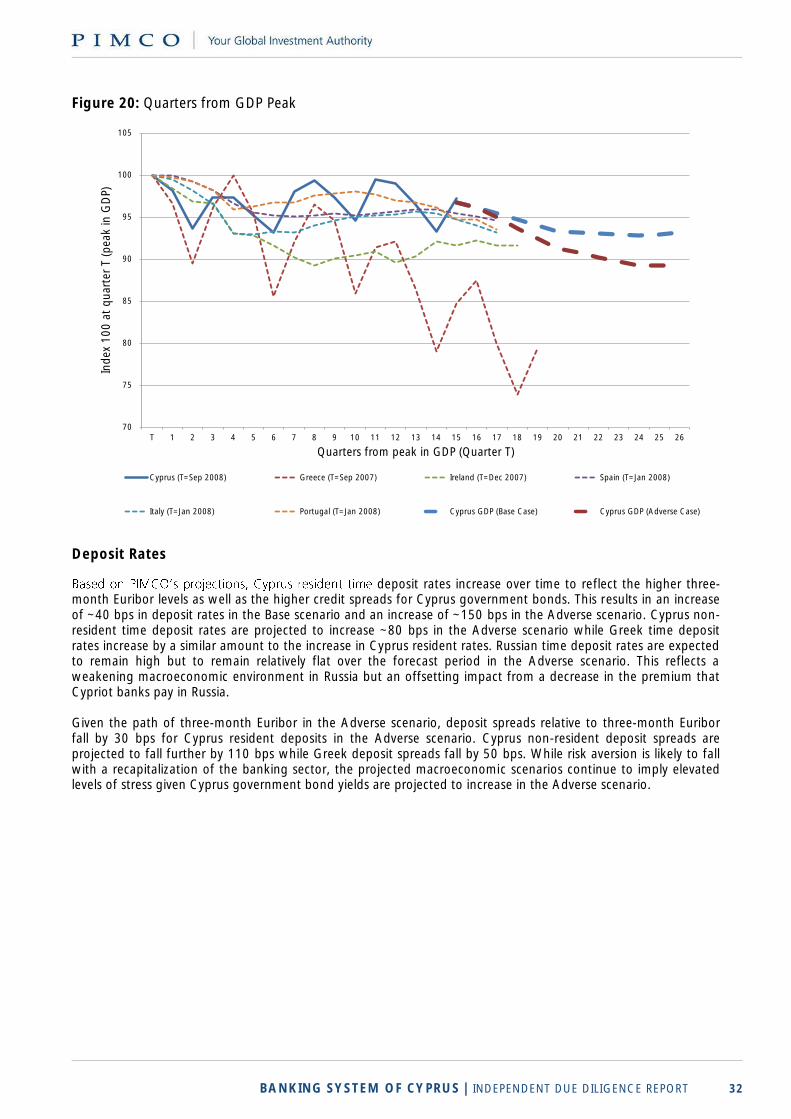
BANKING SYSTEM OF CYPRUS | INDEPENDENT DUE DILIGENCE REPORT 32
Figure 20: Quarters from GDP Peak
Deposit Rates
deposit rates increase over time to reflect the higher three-month Euribor levels as well as the higher credit spreads for Cyprus government bonds. This results in an increase of ~40 bps in deposit rates in the Base scenario and an increase of ~150 bps in the Adverse scenario. Cyprus non-resident time deposit rates are projected to increase ~80 bps in the Adverse scenario while Greek time deposit rates increase by a similar amount to the increase in Cyprus resident rates. Russian time deposit rates are expected to remain high but to remain relatively flat over the forecast period in the Adverse scenario. This reflects a weakening macroeconomic environment in Russia but an offsetting impact from a decrease in the premium that Cypriot banks pay in Russia. Given the path of three-month Euribor in the Adverse scenario, deposit spreads relative to three-month Euribor fall by 30 bps for Cyprus resident deposits in the Adverse scenario. Cyprus non-resident deposit spreads are projected to fall further by 110 bps while Greek deposit spreads fall by 50 bps. While risk aversion is likely to fall with a recapitalization of the banking sector, the projected macroeconomic scenarios continue to imply elevated levels of stress given Cyprus government bond yields are projected to increase in the Adverse scenario.
70
75
80
85
90
95
100
105
T 1 2 3 4 5 6 7 8 9 10 11 12 13 14 15 16 17 18 19 20 21 22 23 24 25 26
Index
100 a
t quar
ter
T (p
eak
in G
DP)
Quarters from peak in GDP (Quarter T)
Cyprus (T=Sep 2008) Greece (T=Sep 2007) Ireland (T=Dec 2007) Spain (T=Jan 2008)
Italy (T=Jan 2008) Portugal (T=Jan 2008) Cyprus GDP (Base Case) Cyprus GDP (Adverse Case)
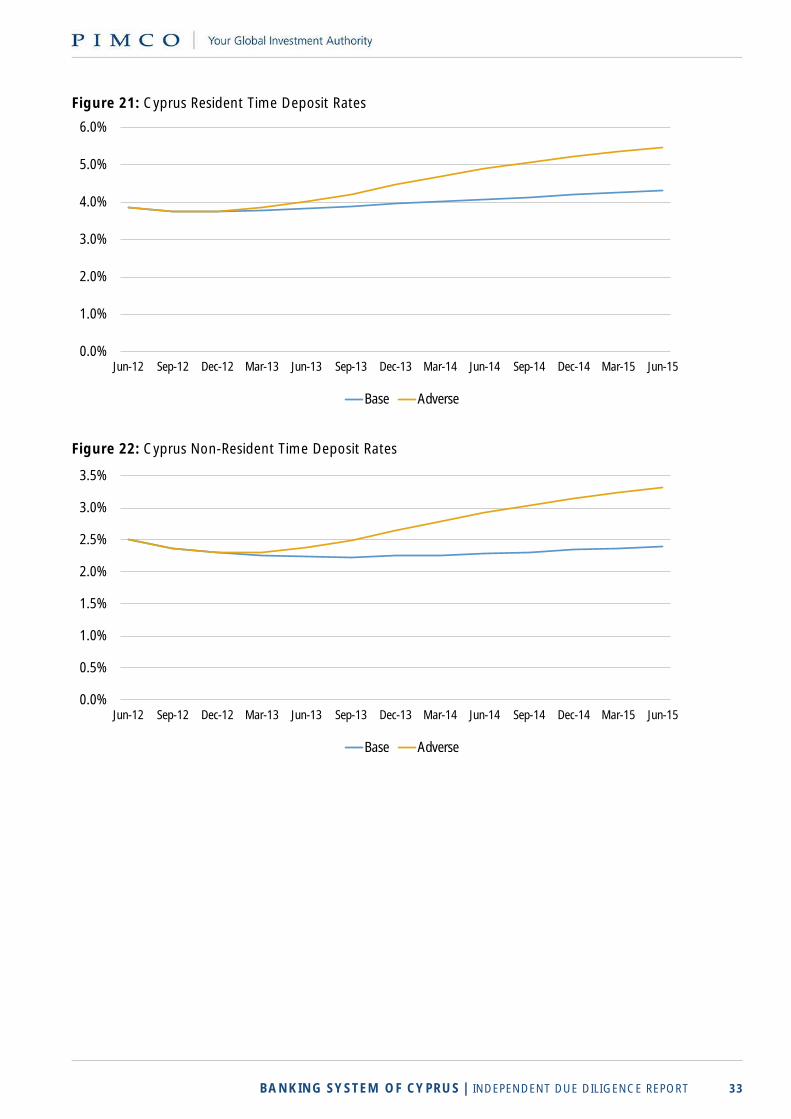
BANKING SYSTEM OF CYPRUS | INDEPENDENT DUE DILIGENCE REPORT 33
Figure 21: Cyprus Resident Time Deposit Rates
Figure 22: Cyprus Non-Resident Time Deposit Rates
0.0%
1.0%
2.0%
3.0%
4.0%
5.0%
6.0%
Jun-12 Sep-12 Dec-12 Mar-13 Jun-13 Sep-13 Dec-13 Mar-14 Jun-14 Sep-14 Dec-14 Mar-15 Jun-15
Base Adverse
0.0%
0.5%
1.0%
1.5%
2.0%
2.5%
3.0%
3.5%
Jun-12 Sep-12 Dec-12 Mar-13 Jun-13 Sep-13 Dec-13 Mar-14 Jun-14 Sep-14 Dec-14 Mar-15 Jun-15
Base Adverse
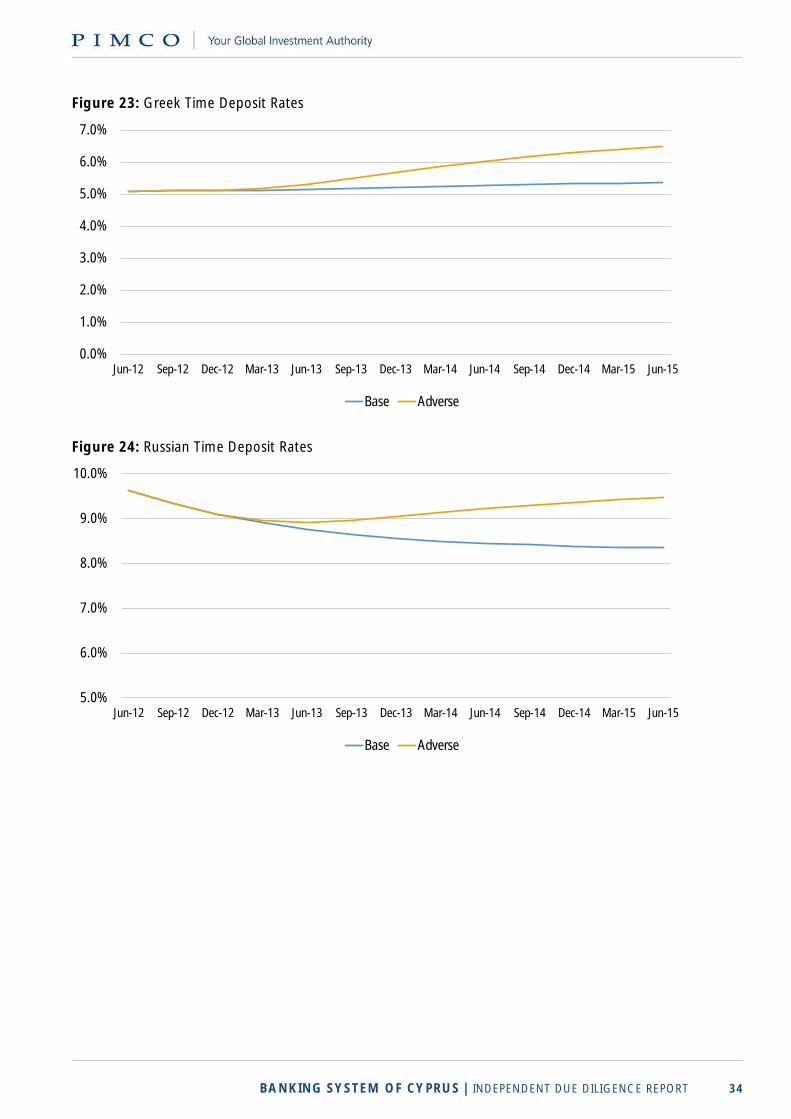
BANKING SYSTEM OF CYPRUS | INDEPENDENT DUE DILIGENCE REPORT 34
Figure 23: Greek Time Deposit Rates
Figure 24: Russian Time Deposit Rates
0.0%
1.0%
2.0%
3.0%
4.0%
5.0%
6.0%
7.0%
Jun-12 Sep-12 Dec-12 Mar-13 Jun-13 Sep-13 Dec-13 Mar-14 Jun-14 Sep-14 Dec-14 Mar-15 Jun-15
Base Adverse
5.0%
6.0%
7.0%
8.0%
9.0%
10.0%
Jun-12 Sep-12 Dec-12 Mar-13 Jun-13 Sep-13 Dec-13 Mar-14 Jun-14 Sep-14 Dec-14 Mar-15 Jun-15
Base Adverse
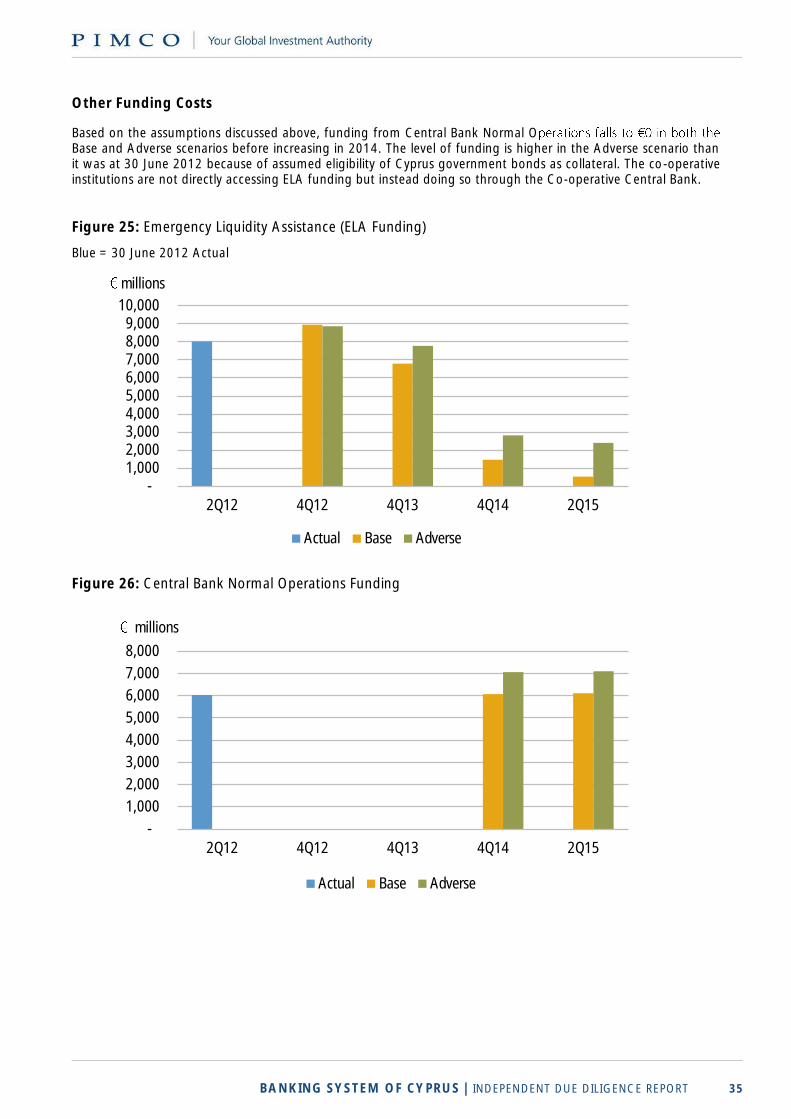
BANKING SYSTEM OF CYPRUS | INDEPENDENT DUE DILIGENCE REPORT 35
Other Funding Costs
Based on the assumptions discussed above, funding from Central Bank Normal OBase and Adverse scenarios before increasing in 2014. The level of funding is higher in the Adverse scenario than it was at 30 June 2012 because of assumed eligibility of Cyprus government bonds as collateral. The co-operative institutions are not directly accessing ELA funding but instead doing so through the Co-operative Central Bank.
Figure 25: Emergency Liquidity Assistance (ELA Funding)
Blue = 30 June 2012 Actual
Figure 26: Central Bank Normal Operations Funding
- 1,000 2,000 3,000 4,000 5,000 6,000 7,000 8,000 9,000
10,000
2Q12 4Q12 4Q13 4Q14 2Q15
millions
Actual Base Adverse
-
1,000
2,000
3,000
4,000
5,000
6,000
7,000
8,000
2Q12 4Q12 4Q13 4Q14 2Q15
millions
Actual Base Adverse
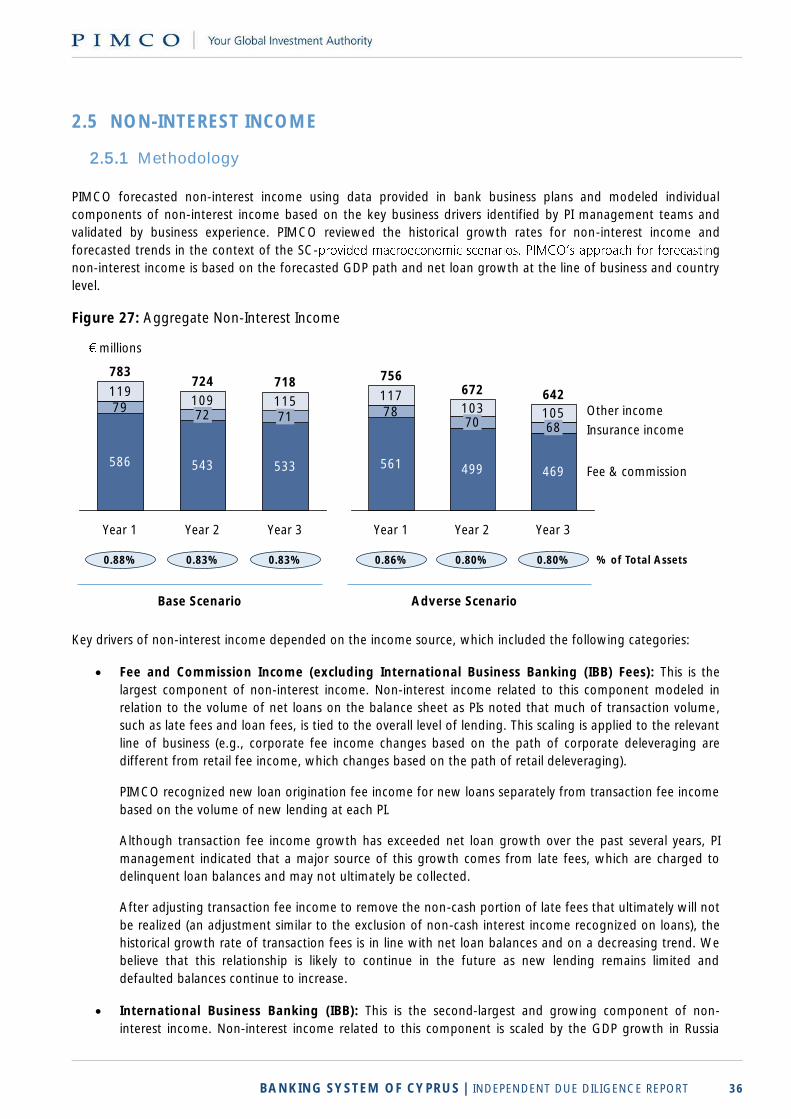
BANKING SYSTEM OF CYPRUS | INDEPENDENT DUE DILIGENCE REPORT 36
2.5 NON-INTEREST INCOME
2.5.1 Methodology
PIMCO forecasted non-interest income using data provided in bank business plans and modeled individual
components of non-interest income based on the key business drivers identified by PI management teams and
validated by business experience. PIMCO reviewed the historical growth rates for non-interest income and
forecasted trends in the context of the SC- g
non-interest income is based on the forecasted GDP path and net loan growth at the line of business and country
level.
Figure 27: Aggregate Non-Interest Income
Key drivers of non-interest income depended on the income source, which included the following categories:
Fee and Commission Income (excluding International Business Banking (IBB) Fees): This is the
largest component of non-interest income. Non-interest income related to this component modeled in
relation to the volume of net loans on the balance sheet as PIs noted that much of transaction volume,
such as late fees and loan fees, is tied to the overall level of lending. This scaling is applied to the relevant
line of business (e.g., corporate fee income changes based on the path of corporate deleveraging are
different from retail fee income, which changes based on the path of retail deleveraging).
PIMCO recognized new loan origination fee income for new loans separately from transaction fee income
based on the volume of new lending at each PI.
Although transaction fee income growth has exceeded net loan growth over the past several years, PI
management indicated that a major source of this growth comes from late fees, which are charged to
delinquent loan balances and may not ultimately be collected.
After adjusting transaction fee income to remove the non-cash portion of late fees that ultimately will not
be realized (an adjustment similar to the exclusion of non-cash interest income recognized on loans), the
historical growth rate of transaction fees is in line with net loan balances and on a decreasing trend. We
believe that this relationship is likely to continue in the future as new lending remains limited and
defaulted balances continue to increase.
International Business Banking (IBB): This is the second-largest and growing component of non-
interest income. Non-interest income related to this component is scaled by the GDP growth in Russia
119109 11579
Year 2Year 1
783
543586
72
724
71
718
Year 3
533
117103 10578
672
499 469
Year 3
561
642
Year 2
6870
Year 1
756
Other income
Insurance income
Fee & commission
millions
% of Total Assets0.83%0.88% 0.83% 0.80%0.86% 0.80%
Base Scenario Adverse Scenario

BANKING SYSTEM OF CYPRUS | INDEPENDENT DUE DILIGENCE REPORT 37
and the UK as clients of these divisions are predominantly of foreign origin with offshore businesses and
the activities are correlated to Russia and UK economic growth
Asset Management and Insurance Fees: Non-interest income related to this component is scaled by
the GDP growth in the relevant geography (e.g., Cyprus asset management scales are in line with the
Cyprus GDP forecast and UK insurance fees are scaled in line with UK GDP forecast)
Other Non-Interest Income: Non-interest income associated with ancillary activities, such as income
from REO (i.e., Real Estate Owned by the bank) that is converted into rental properties and co-
agricultural businesses, are modeled separately. This component of non-interest income scales with
Cyprus GDP
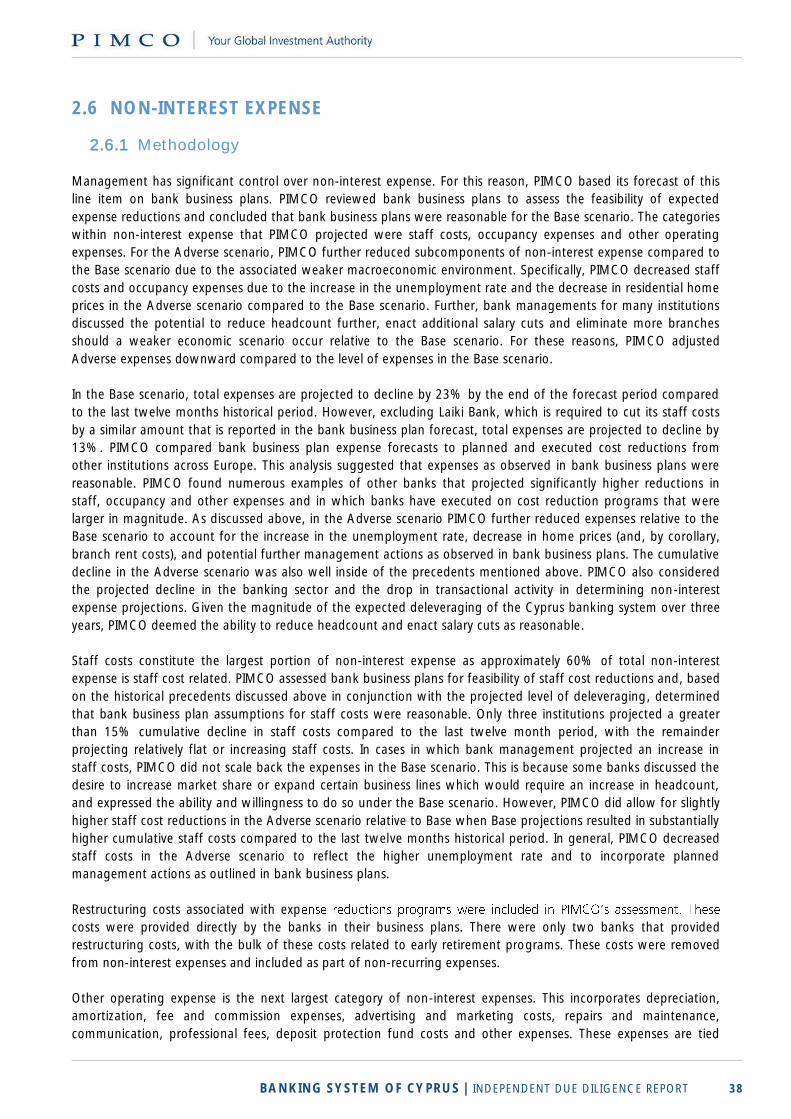
BANKING SYSTEM OF CYPRUS | INDEPENDENT DUE DILIGENCE REPORT 38
2.6 NON-INTEREST EXPENSE
2.6.1 Methodology Management has significant control over non-interest expense. For this reason, PIMCO based its forecast of this
line item on bank business plans. PIMCO reviewed bank business plans to assess the feasibility of expected
expense reductions and concluded that bank business plans were reasonable for the Base scenario. The categories
within non-interest expense that PIMCO projected were staff costs, occupancy expenses and other operating
expenses. For the Adverse scenario, PIMCO further reduced subcomponents of non-interest expense compared to
the Base scenario due to the associated weaker macroeconomic environment. Specifically, PIMCO decreased staff
costs and occupancy expenses due to the increase in the unemployment rate and the decrease in residential home
prices in the Adverse scenario compared to the Base scenario. Further, bank managements for many institutions
discussed the potential to reduce headcount further, enact additional salary cuts and eliminate more branches
should a weaker economic scenario occur relative to the Base scenario. For these reasons, PIMCO adjusted
Adverse expenses downward compared to the level of expenses in the Base scenario.
In the Base scenario, total expenses are projected to decline by 23% by the end of the forecast period compared
to the last twelve months historical period. However, excluding Laiki Bank, which is required to cut its staff costs
by a similar amount that is reported in the bank business plan forecast, total expenses are projected to decline by
13%. PIMCO compared bank business plan expense forecasts to planned and executed cost reductions from
other institutions across Europe. This analysis suggested that expenses as observed in bank business plans were
reasonable. PIMCO found numerous examples of other banks that projected significantly higher reductions in
staff, occupancy and other expenses and in which banks have executed on cost reduction programs that were
larger in magnitude. As discussed above, in the Adverse scenario PIMCO further reduced expenses relative to the
Base scenario to account for the increase in the unemployment rate, decrease in home prices (and, by corollary,
branch rent costs), and potential further management actions as observed in bank business plans. The cumulative
decline in the Adverse scenario was also well inside of the precedents mentioned above. PIMCO also considered
the projected decline in the banking sector and the drop in transactional activity in determining non-interest
expense projections. Given the magnitude of the expected deleveraging of the Cyprus banking system over three
years, PIMCO deemed the ability to reduce headcount and enact salary cuts as reasonable.
Staff costs constitute the largest portion of non-interest expense as approximately 60% of total non-interest
expense is staff cost related. PIMCO assessed bank business plans for feasibility of staff cost reductions and, based
on the historical precedents discussed above in conjunction with the projected level of deleveraging, determined
that bank business plan assumptions for staff costs were reasonable. Only three institutions projected a greater
than 15% cumulative decline in staff costs compared to the last twelve month period, with the remainder
projecting relatively flat or increasing staff costs. In cases in which bank management projected an increase in
staff costs, PIMCO did not scale back the expenses in the Base scenario. This is because some banks discussed the
desire to increase market share or expand certain business lines which would require an increase in headcount,
and expressed the ability and willingness to do so under the Base scenario. However, PIMCO did allow for slightly
higher staff cost reductions in the Adverse scenario relative to Base when Base projections resulted in substantially
higher cumulative staff costs compared to the last twelve months historical period. In general, PIMCO decreased
staff costs in the Adverse scenario to reflect the higher unemployment rate and to incorporate planned
management actions as outlined in bank business plans.
Restructuring costs associated with exp
costs were provided directly by the banks in their business plans. There were only two banks that provided
restructuring costs, with the bulk of these costs related to early retirement programs. These costs were removed
from non-interest expenses and included as part of non-recurring expenses.
Other operating expense is the next largest category of non-interest expenses. This incorporates depreciation,
amortization, fee and commission expenses, advertising and marketing costs, repairs and maintenance,
communication, professional fees, deposit protection fund costs and other expenses. These expenses are tied
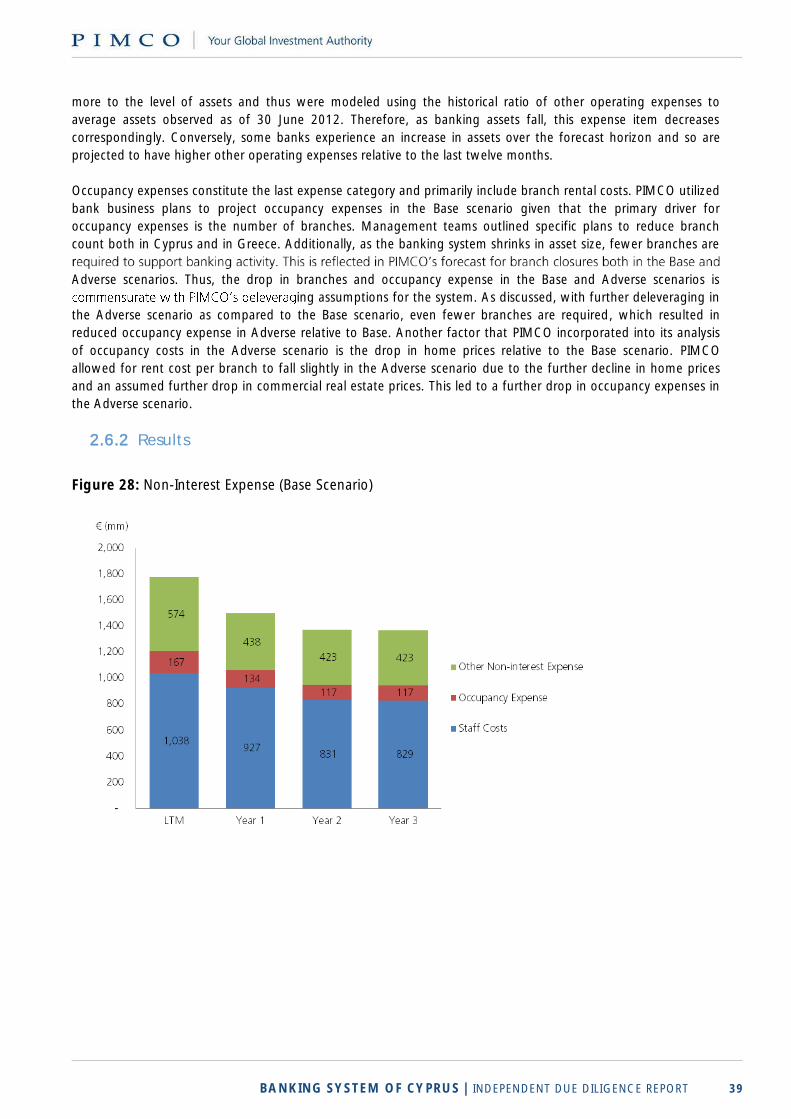
BANKING SYSTEM OF CYPRUS | INDEPENDENT DUE DILIGENCE REPORT 39
more to the level of assets and thus were modeled using the historical ratio of other operating expenses to
average assets observed as of 30 June 2012. Therefore, as banking assets fall, this expense item decreases
correspondingly. Conversely, some banks experience an increase in assets over the forecast horizon and so are
projected to have higher other operating expenses relative to the last twelve months.
Occupancy expenses constitute the last expense category and primarily include branch rental costs. PIMCO utilized
bank business plans to project occupancy expenses in the Base scenario given that the primary driver for
occupancy expenses is the number of branches. Management teams outlined specific plans to reduce branch
count both in Cyprus and in Greece. Additionally, as the banking system shrinks in asset size, fewer branches are
r
Adverse scenarios. Thus, the drop in branches and occupancy expense in the Base and Adverse scenarios is
ing assumptions for the system. As discussed, with further deleveraging in
the Adverse scenario as compared to the Base scenario, even fewer branches are required, which resulted in
reduced occupancy expense in Adverse relative to Base. Another factor that PIMCO incorporated into its analysis
of occupancy costs in the Adverse scenario is the drop in home prices relative to the Base scenario. PIMCO
allowed for rent cost per branch to fall slightly in the Adverse scenario due to the further decline in home prices
and an assumed further drop in commercial real estate prices. This led to a further drop in occupancy expenses in
the Adverse scenario.
2.6.2 Results
Figure 28: Non-Interest Expense (Base Scenario)
BANKING SYSTEM OF CYPRUS | INDEPENDENT DUE DILIGENCE REPORT 40
Figure 29: Non-Interest Expense (Adverse Scenario)
The cumulative decline in non-interest expense in the Base scenario is 23%. This is due to a 20% decline in staff costs, 30% decrease in occupancy expenses and a 25% drop in other operating expenses in the Base scenario. In the Adverse scenario, PIMCO projects staff costs to fall by 23%, occupancy to decline by 36% and for other operating expenses to drop by 35%, leading to a total decline in non-interest expenses of 28%. As discussed above, PIMCO bases its system-wide expense reductions on bank business plans and the expected decrease in banking assets over the next three years. The combination of branch closures, planned staff cost reductions and expected deleveraging lead to the magnitude of expense reductions observed above. Bank business plans in aggregate have staff costs declining by ~20% by 1H2015 as compared to the last twelve months. The collective action of reducing salary costs by ~10%-12% on average and reducing headcount should enable the PIs to reach this cost-cutting target by the end of 1H2015. The reduction in headcount is based on natural attrition in addition to early retirement programs designed to provide an incentive for employees to opt for early retirement. Occupancy costs fall by 30% in the Base scenario and 35% in the Adverse scenario. The driver of the drop in occupancy expenses is the expected decline in branches in operation. The bulk of the reduction in occupancy costs occurs in the first year, in which banks close the greatest number of branches. Other operating costs decline by 25% and 35% in Base and Adverse, respectively. This is predicated on the overall decline in banking sector assets over time.
1,038 921
815 804
167
131 113 107
574
404
383 375
-
200
400
600
800
1,000
1,200
1,400
1,600
1,800
2,000
LTM Year 1 Year 2 Year 3
(mm)
Other Non-interest Expense
Occupancy Expense
Staff Costs
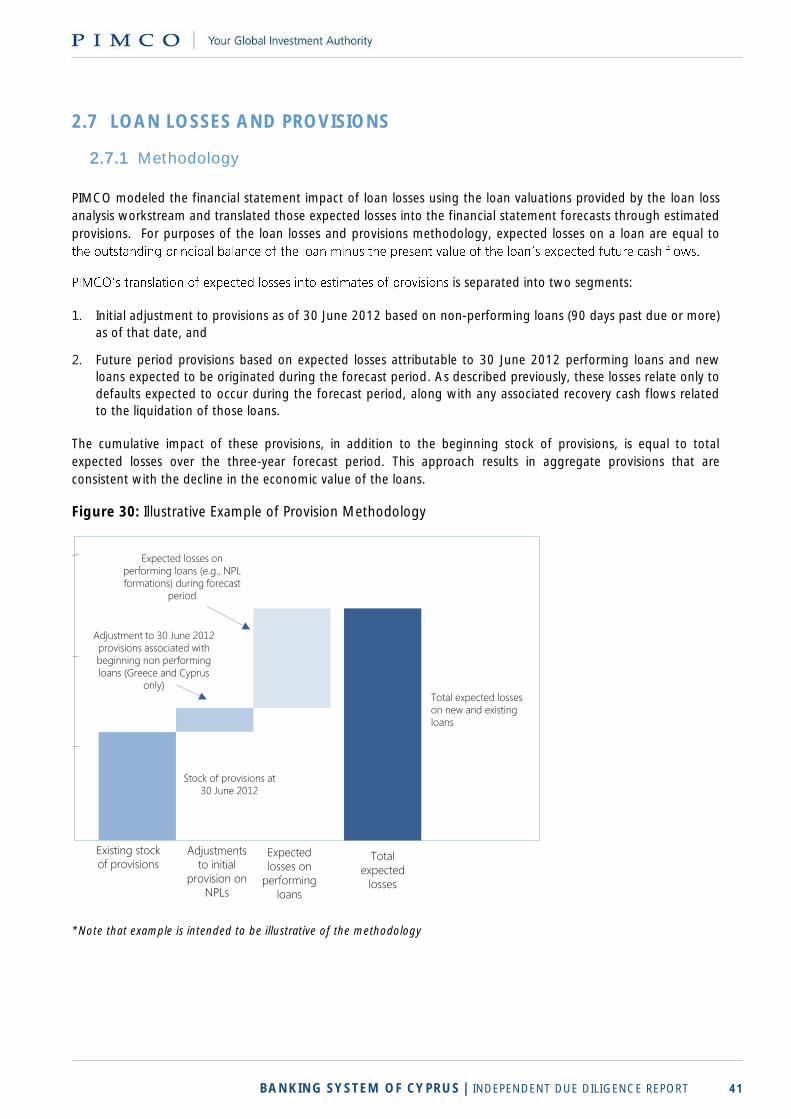
BANKING SYSTEM OF CYPRUS | INDEPENDENT DUE DILIGENCE REPORT 41
2.7 LOAN LOSSES AND PROVISIONS
2.7.1 Methodology
PIMCO modeled the financial statement impact of loan losses using the loan valuations provided by the loan loss
analysis workstream and translated those expected losses into the financial statement forecasts through estimated
provisions. For purposes of the loan losses and provisions methodology, expected losses on a loan are equal to
is separated into two segments:
1. Initial adjustment to provisions as of 30 June 2012 based on non-performing loans (90 days past due or more)
as of that date, and
2. Future period provisions based on expected losses attributable to 30 June 2012 performing loans and new
loans expected to be originated during the forecast period. As described previously, these losses relate only to
defaults expected to occur during the forecast period, along with any associated recovery cash flows related
to the liquidation of those loans.
The cumulative impact of these provisions, in addition to the beginning stock of provisions, is equal to total
expected losses over the three-year forecast period. This approach results in aggregate provisions that are
consistent with the decline in the economic value of the loans.
Figure 30: Illustrative Example of Provision Methodology
Existing stock
of provisions
Adjustments
to initial
provision on
NPLs
Stock of provisions at
30 June 2012
Adjustment to 30 June 2012
provisions associated with
beginning non performing
loans (Greece and Cyprus
only)
Expected losses on
performing loans (e.g., NPL
formations) during forecast
period
Total expected losses
on new and existing
loans
Expected
losses on
performing
loans
Total
expected
losses
*Note that example is intended to be illustrative of the methodology
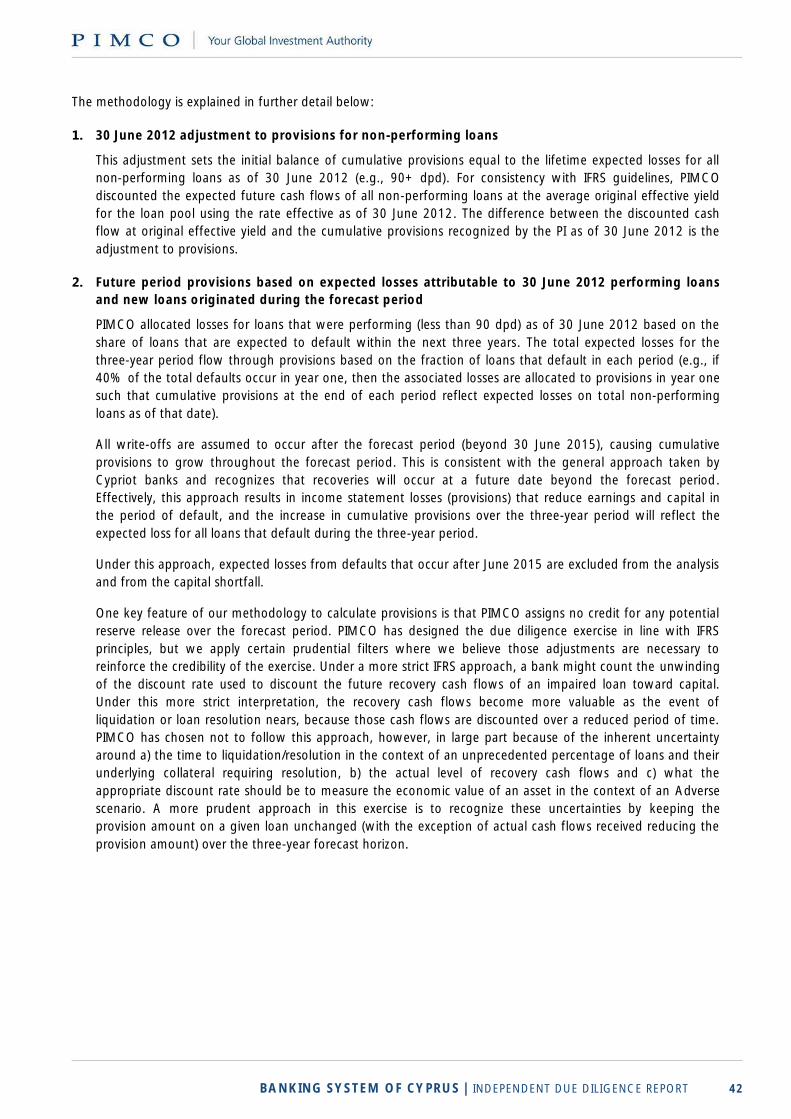
BANKING SYSTEM OF CYPRUS | INDEPENDENT DUE DILIGENCE REPORT 42
The methodology is explained in further detail below:
1. 30 June 2012 adjustment to provisions for non-performing loans
This adjustment sets the initial balance of cumulative provisions equal to the lifetime expected losses for all
non-performing loans as of 30 June 2012 (e.g., 90+ dpd). For consistency with IFRS guidelines, PIMCO
discounted the expected future cash flows of all non-performing loans at the average original effective yield
for the loan pool using the rate effective as of 30 June 2012. The difference between the discounted cash
flow at original effective yield and the cumulative provisions recognized by the PI as of 30 June 2012 is the
adjustment to provisions.
2. Future period provisions based on expected losses attributable to 30 June 2012 performing loans
and new loans originated during the forecast period
PIMCO allocated losses for loans that were performing (less than 90 dpd) as of 30 June 2012 based on the
share of loans that are expected to default within the next three years. The total expected losses for the
three-year period flow through provisions based on the fraction of loans that default in each period (e.g., if
40% of the total defaults occur in year one, then the associated losses are allocated to provisions in year one
such that cumulative provisions at the end of each period reflect expected losses on total non-performing
loans as of that date).
All write-offs are assumed to occur after the forecast period (beyond 30 June 2015), causing cumulative
provisions to grow throughout the forecast period. This is consistent with the general approach taken by
Cypriot banks and recognizes that recoveries will occur at a future date beyond the forecast period.
Effectively, this approach results in income statement losses (provisions) that reduce earnings and capital in
the period of default, and the increase in cumulative provisions over the three-year period will reflect the
expected loss for all loans that default during the three-year period.
Under this approach, expected losses from defaults that occur after June 2015 are excluded from the analysis
and from the capital shortfall.
One key feature of our methodology to calculate provisions is that PIMCO assigns no credit for any potential
reserve release over the forecast period. PIMCO has designed the due diligence exercise in line with IFRS
principles, but we apply certain prudential filters where we believe those adjustments are necessary to
reinforce the credibility of the exercise. Under a more strict IFRS approach, a bank might count the unwinding
of the discount rate used to discount the future recovery cash flows of an impaired loan toward capital.
Under this more strict interpretation, the recovery cash flows become more valuable as the event of
liquidation or loan resolution nears, because those cash flows are discounted over a reduced period of time.
PIMCO has chosen not to follow this approach, however, in large part because of the inherent uncertainty
around a) the time to liquidation/resolution in the context of an unprecedented percentage of loans and their
underlying collateral requiring resolution, b) the actual level of recovery cash flows and c) what the
appropriate discount rate should be to measure the economic value of an asset in the context of an Adverse
scenario. A more prudent approach in this exercise is to recognize these uncertainties by keeping the
provision amount on a given loan unchanged (with the exception of actual cash flows received reducing the
provision amount) over the three-year forecast horizon.
BANKING SYSTEM OF CYPRUS | INDEPENDENT DUE DILIGENCE REPORT 43
2.7.2 Results
The figures below separate total three-year expected losses into losses on loans that were non-performing as of
30 June 2012, losses on loans that were performing as of 30 June 2012 but which will default within the three-
year forecast period and losses on new loans originated between 30 June 2012 and 30 June 2015.
The provision adjustment is identical for both the Base and Adverse scenario because PIMCO has calculated the
provision true-up at 30 June 2012 using the Base scenario.
Figure 31: Cumulative Provisions Over Stress Period (Base Scenario)
Figure 32: Cumulative Provisions Over Stress Period (Adverse Scenario)
Other
Total 3 year expected losses
13,999
Losses on new loans originated
after 30 June 2012
186
Losses on existing loans that default
before 30 June 2015
6,146
Provision adjustment for NPLs as of 30 June 2012
1,476
Existing provisions as of 30 June 2012
6,191
Cyprus
Greece
Cumulative provisions over stress period (Base Scenario)millions
Cyprus
Greece
Other
Total 3 year expected losses
18,245
Losses on new loans originated
after 30 June 2012
181
Losses on existing loans that default
before 30 June 2015
10,397
Provision adjustment for NPLs as of 30 June 2012
1,476
Existing provisions as of 30 June 2012
6,191
Cumulative provisions over stress period (Adverse Scenario)millions
BANKING SYSTEM OF CYPRUS | INDEPENDENT DUE DILIGENCE REPORT 44
2.8 DEFERRED TAX ASSETS
2.8.1 Methodology
PIMCO applied a haircut on unutilized non-Greek government bond deferred tax assets ( DTAs ) at the end of
the forecast period, but allowed for the creation of new DTAs during the forecast period.
Existing DTAs: In calculating the capital shortfall at 30 June 2015, PIMCO excluded from Core Tier 1 capital the
portion of unutilized pre-existing DTAs (created prior to 30 June 2012) that were related to impairments on loans
and securities, net of any offsetting deferred tax liabilities ( DTLs ); however, DTAs related to losses on Greek PSIs
were not excluded from regulatory capital because those losses can be utilized over the next thirty years subject to
certain requirements.
New DTAs due to tax loss carryforwards: New DTAs were created as a result of negative pre-tax earnings,
primarily related to loan loss provisions in Cyprus and Greece, based on a blended corporate tax rate weighted by
each PI s lending operations (e.g., Cyprus = 10%, Greece = 24%, Russia = 20%, UK = 20%).
For DTAs created during the forecast period due to net losses, PIMCO applied a haircut of 70% based on an
assessment of the potential for tax loss carryforwards to be utilized within five years, as required by new
legislation in Cyprus.
In considering the appropriate level for this haircut, PIMCO considered the potential future profitability of
Participating Institutions as well as upcoming Basel III phase-in provisions that will disqualify by 2018 all DTAs that
depend on future profitability from regulatory capital.
2.8.2 Results Deferred tax assets represented a significant portion of the capital base for several Participating Institutions at the
beginning of the
1 capital base as of 30 June 2012. Due to persistent net losses, these initial DTAs are expected to grow to over
in the Adverse scenario and would represent over 80% of the
aggregate capital base as of 30 June 2015 if no DTAs were excluded from regulatory capital.
Although Cyprus does not currently limit the inclusion of DTAs within regulatory capital, there are a number of
reasons to exclude a portion of DTAs in the context of the due diligence exercise. Specifically:
A significant portion of newly created DTAs may not be realizable within the five-year utilization period in
Cyprus. PIMCO estimates that it would take over 16 years to utilize the DTAs created in Cyprus and
Greece even if bank profitability were to return to 2008-2010 levels immediately after the end of the
forecast period. This suggests that PIs would be able to utilize at most 30% of the newly created DTAs
(e.g., PIs could utilize DTAs during the five years allowable under current law, but 16 years would be
required to utilize all of the DTAs). Profitability is likely to be significantly lower than 2008-2010 levels at
the end of the forecast period, both because banks are smaller and because the economic recovery will
still be nascent rather than accelerating
Beginning in 2018 under Basel III phase-in provisions, 100% of the DTAs that depend on the future
profitability of PIs will be excluded from capital. If PIMCO were to estimate the capital shortfall as of 30
June 2015 including the full amount of newly created DTAs, then PIs effectively would have less than
three years to utilize the substantial majority of the new DTAs before becoming significantly
undercapitalized in 2018 once those DTAs were no longer eligible as regulatory capital. Phrased
differently, the current capital shortfall estimate would be understated if it admitted a large amount of
DTAs that will be excluded from capital within several years
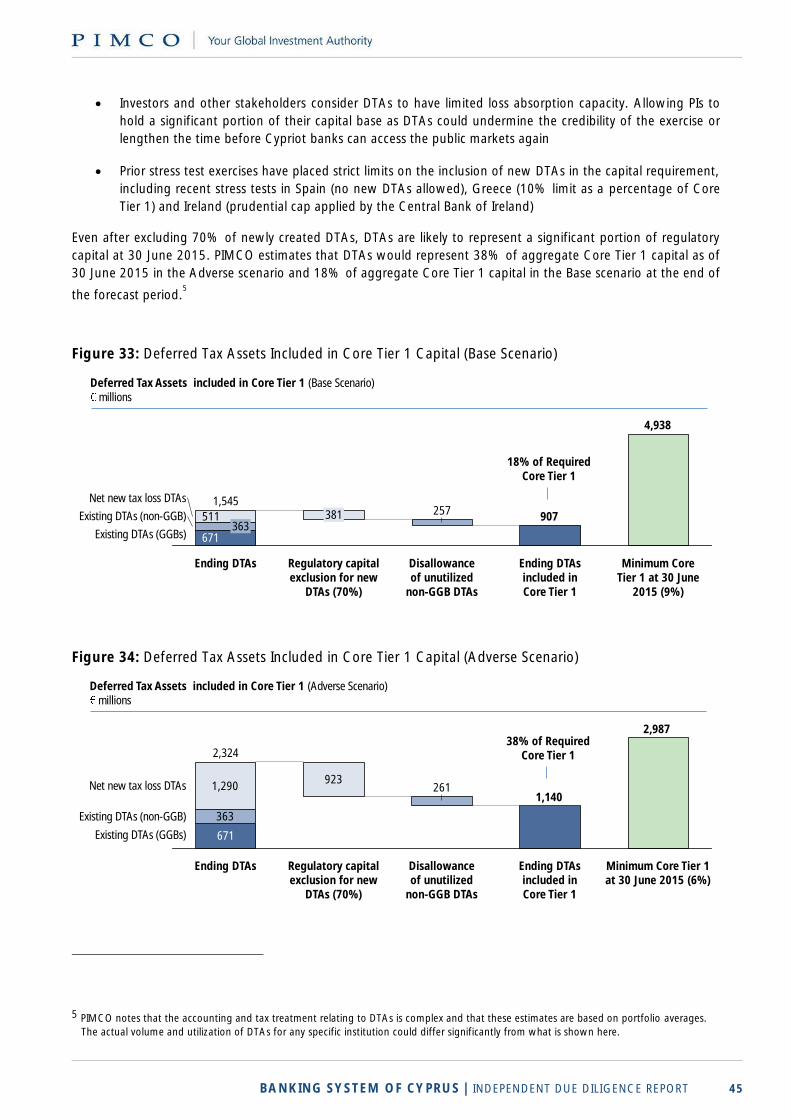
BANKING SYSTEM OF CYPRUS | INDEPENDENT DUE DILIGENCE REPORT 45
Investors and other stakeholders consider DTAs to have limited loss absorption capacity. Allowing PIs to
hold a significant portion of their capital base as DTAs could undermine the credibility of the exercise or
lengthen the time before Cypriot banks can access the public markets again
Prior stress test exercises have placed strict limits on the inclusion of new DTAs in the capital requirement,
including recent stress tests in Spain (no new DTAs allowed), Greece (10% limit as a percentage of Core
Tier 1) and Ireland (prudential cap applied by the Central Bank of Ireland)
Even after excluding 70% of newly created DTAs, DTAs are likely to represent a significant portion of regulatory
capital at 30 June 2015. PIMCO estimates that DTAs would represent 38% of aggregate Core Tier 1 capital as of
30 June 2015 in the Adverse scenario and 18% of aggregate Core Tier 1 capital in the Base scenario at the end of
the forecast period.5
Figure 33: Deferred Tax Assets Included in Core Tier 1 Capital (Base Scenario)
Figure 34: Deferred Tax Assets Included in Core Tier 1 Capital (Adverse Scenario)
5 PIMCO notes that the accounting and tax treatment relating to DTAs is complex and that these estimates are based on portfolio averages.
The actual volume and utilization of DTAs for any specific institution could differ significantly from what is shown here.
257
4,938
907511
Existing DTAs (GGBs)
Existing DTAs (non-GGB)
Net new tax loss DTAs
Minimum Core Tier 1 at 30 June
2015 (9%)
Ending DTAs included in Core Tier 1
Disallowance of unutilized
non-GGB DTAs
Regulatory capital exclusion for new
DTAs (70%)
Ending DTAs
1,545
671363
381
Deferred Tax Assets included in Core Tier 1 (Base Scenario)millions
18% of Required Core Tier 1
923261
2,987
1,140
363
1,290
Existing DTAs (GGBs)
Existing DTAs (non-GGB)
Net new tax loss DTAs
Minimum Core Tier 1 at 30 June 2015 (6%)
Ending DTAs included in Core Tier 1
Disallowance of unutilized
non-GGB DTAs
Ending DTAs
2,324
671
Regulatory capital exclusion for new
DTAs (70%)
Deferred Tax Assets included in Core Tier 1 (Adverse Scenario)millions
38% of Required Core Tier 1
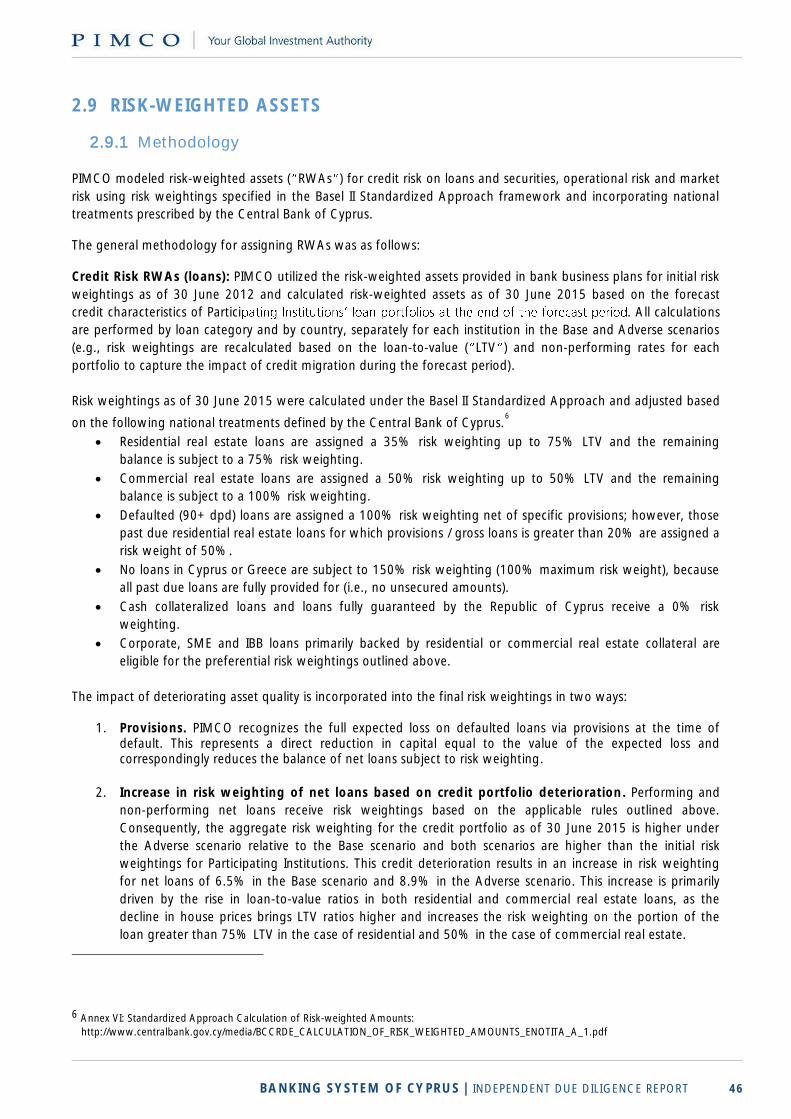
BANKING SYSTEM OF CYPRUS | INDEPENDENT DUE DILIGENCE REPORT 46
2.9 RISK-WEIGHTED ASSETS
2.9.1 Methodology
PIMCO modeled risk-weighted assets ( RWAs ) for credit risk on loans and securities, operational risk and market
risk using risk weightings specified in the Basel II Standardized Approach framework and incorporating national
treatments prescribed by the Central Bank of Cyprus.
The general methodology for assigning RWAs was as follows:
Credit Risk RWAs (loans): PIMCO utilized the risk-weighted assets provided in bank business plans for initial risk
weightings as of 30 June 2012 and calculated risk-weighted assets as of 30 June 2015 based on the forecast
credit characteristics of Partici . All calculations
are performed by loan category and by country, separately for each institution in the Base and Adverse scenarios
(e.g., risk weightings are recalculated based on the loan-to-value ( LTV ) and non-performing rates for each
portfolio to capture the impact of credit migration during the forecast period).
Risk weightings as of 30 June 2015 were calculated under the Basel II Standardized Approach and adjusted based
on the following national treatments defined by the Central Bank of Cyprus.6
Residential real estate loans are assigned a 35% risk weighting up to 75% LTV and the remaining
balance is subject to a 75% risk weighting.
Commercial real estate loans are assigned a 50% risk weighting up to 50% LTV and the remaining
balance is subject to a 100% risk weighting.
Defaulted (90+ dpd) loans are assigned a 100% risk weighting net of specific provisions; however, those
past due residential real estate loans for which provisions / gross loans is greater than 20% are assigned a
risk weight of 50%.
No loans in Cyprus or Greece are subject to 150% risk weighting (100% maximum risk weight), because
all past due loans are fully provided for (i.e., no unsecured amounts).
Cash collateralized loans and loans fully guaranteed by the Republic of Cyprus receive a 0% risk
weighting.
Corporate, SME and IBB loans primarily backed by residential or commercial real estate collateral are
eligible for the preferential risk weightings outlined above.
The impact of deteriorating asset quality is incorporated into the final risk weightings in two ways:
1. Provisions. PIMCO recognizes the full expected loss on defaulted loans via provisions at the time of default. This represents a direct reduction in capital equal to the value of the expected loss and correspondingly reduces the balance of net loans subject to risk weighting.
2. Increase in risk weighting of net loans based on credit portfolio deterioration. Performing and
non-performing net loans receive risk weightings based on the applicable rules outlined above.
Consequently, the aggregate risk weighting for the credit portfolio as of 30 June 2015 is higher under
the Adverse scenario relative to the Base scenario and both scenarios are higher than the initial risk
weightings for Participating Institutions. This credit deterioration results in an increase in risk weighting
for net loans of 6.5% in the Base scenario and 8.9% in the Adverse scenario. This increase is primarily
driven by the rise in loan-to-value ratios in both residential and commercial real estate loans, as the
decline in house prices brings LTV ratios higher and increases the risk weighting on the portion of the
loan greater than 75% LTV in the case of residential and 50% in the case of commercial real estate.
6 Annex VI: Standardized Approach Calculation of Risk-weighted Amounts:
http://www.centralbank.gov.cy/media/BCCRDE_CALCULATION_OF_RISK_WEIGHTED_AMOUNTS_ENOTITA_A_1.pdf
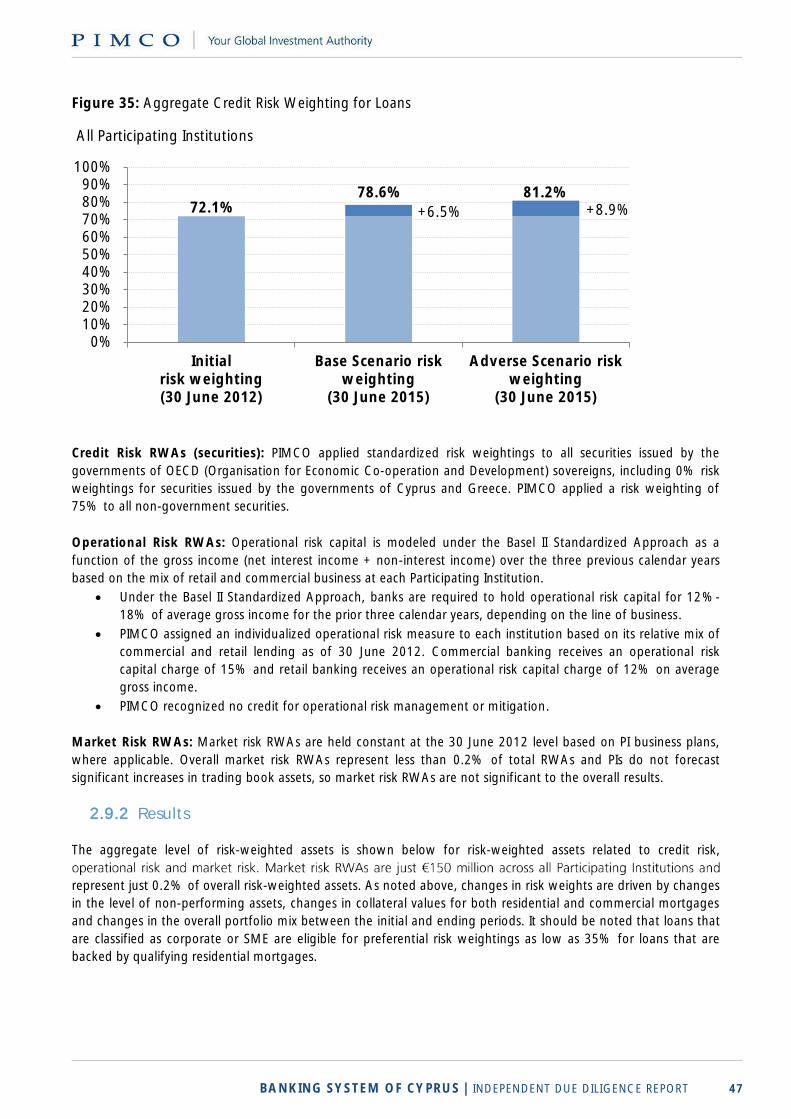
BANKING SYSTEM OF CYPRUS | INDEPENDENT DUE DILIGENCE REPORT 47
Figure 35: Aggregate Credit Risk Weighting for Loans
Credit Risk RWAs (securities): PIMCO applied standardized risk weightings to all securities issued by the
governments of OECD (Organisation for Economic Co-operation and Development) sovereigns, including 0% risk
weightings for securities issued by the governments of Cyprus and Greece. PIMCO applied a risk weighting of
75% to all non-government securities.
Operational Risk RWAs: Operational risk capital is modeled under the Basel II Standardized Approach as a
function of the gross income (net interest income + non-interest income) over the three previous calendar years
based on the mix of retail and commercial business at each Participating Institution.
Under the Basel II Standardized Approach, banks are required to hold operational risk capital for 12%-
18% of average gross income for the prior three calendar years, depending on the line of business.
PIMCO assigned an individualized operational risk measure to each institution based on its relative mix of
commercial and retail lending as of 30 June 2012. Commercial banking receives an operational risk
capital charge of 15% and retail banking receives an operational risk capital charge of 12% on average
gross income.
PIMCO recognized no credit for operational risk management or mitigation.
Market Risk RWAs: Market risk RWAs are held constant at the 30 June 2012 level based on PI business plans,
where applicable. Overall market risk RWAs represent less than 0.2% of total RWAs and PIs do not forecast
significant increases in trading book assets, so market risk RWAs are not significant to the overall results.
2.9.2 Results
The aggregate level of risk-weighted assets is shown below for risk-weighted assets related to credit risk,
represent just 0.2% of overall risk-weighted assets. As noted above, changes in risk weights are driven by changes
in the level of non-performing assets, changes in collateral values for both residential and commercial mortgages
and changes in the overall portfolio mix between the initial and ending periods. It should be noted that loans that
are classified as corporate or SME are eligible for preferential risk weightings as low as 35% for loans that are
backed by qualifying residential mortgages.
72.1%78.6% 81.2%
+6.5% +8.9%
0%10%20%30%40%50%60%70%80%90%
100%
Initialrisk weighting(30 June 2012)
Base Scenario riskweighting
(30 June 2015)
Adverse Scenario riskweighting
(30 June 2015)
All Participating Institutions
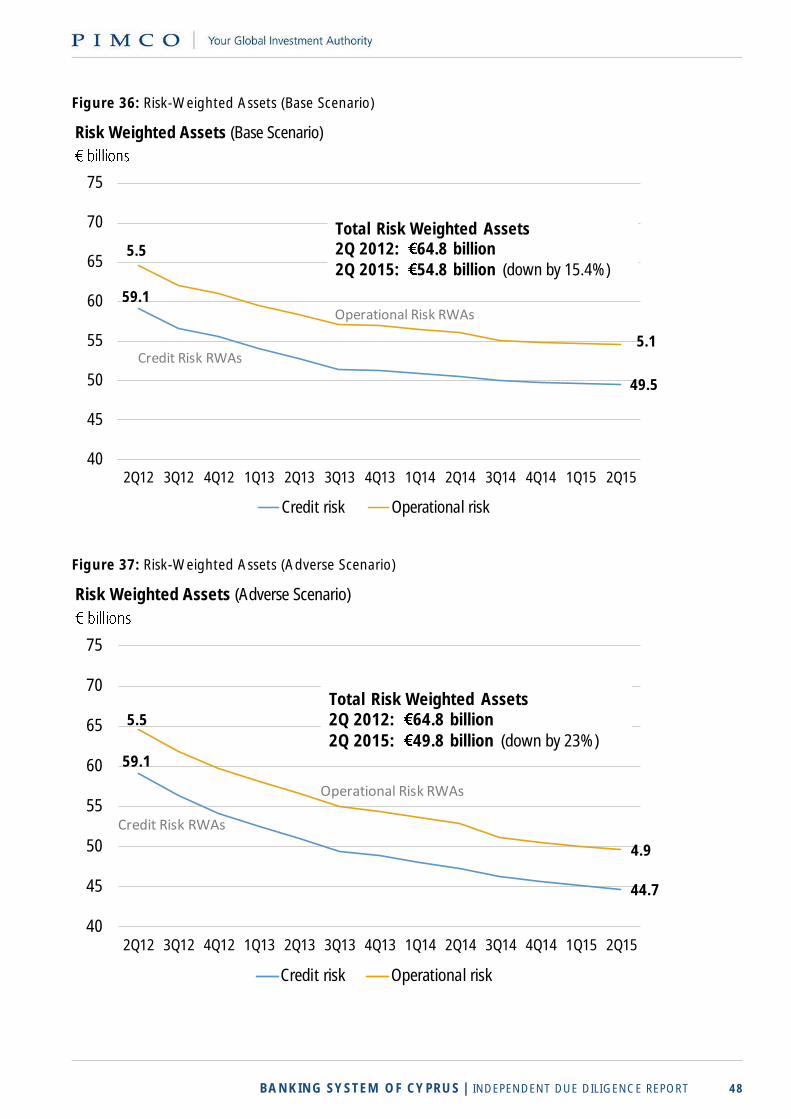
BANKING SYSTEM OF CYPRUS | INDEPENDENT DUE DILIGENCE REPORT 48
Figure 36: Risk-Weighted Assets (Base Scenario)
Figure 37: Risk-Weighted Assets (Adverse Scenario)
Risk Weighted Assets (Base Scenario)
59.1
49.5
5.5
5.1
40
45
50
55
60
65
70
75
2Q12 3Q12 4Q12 1Q13 2Q13 3Q13 4Q13 1Q14 2Q14 3Q14 4Q14 1Q15 2Q15
Credit risk Operational risk
Total Risk Weighted Assets2Q 2012: 64.8 billion2Q 2015: 54.8 billion (down by 15.4%)
Credit Risk RWAs
Operational Risk RWAs
Risk Weighted Assets (Adverse Scenario)
59.1
44.7
5.5
4.9
40
45
50
55
60
65
70
75
2Q12 3Q12 4Q12 1Q13 2Q13 3Q13 4Q13 1Q14 2Q14 3Q14 4Q14 1Q15 2Q15
Credit risk Operational risk
Total Risk Weighted Assets2Q 2012: 64.8 billion2Q 2015: 49.8 billion (down by 23%)
Credit Risk RWAs
Operational Risk RWAs
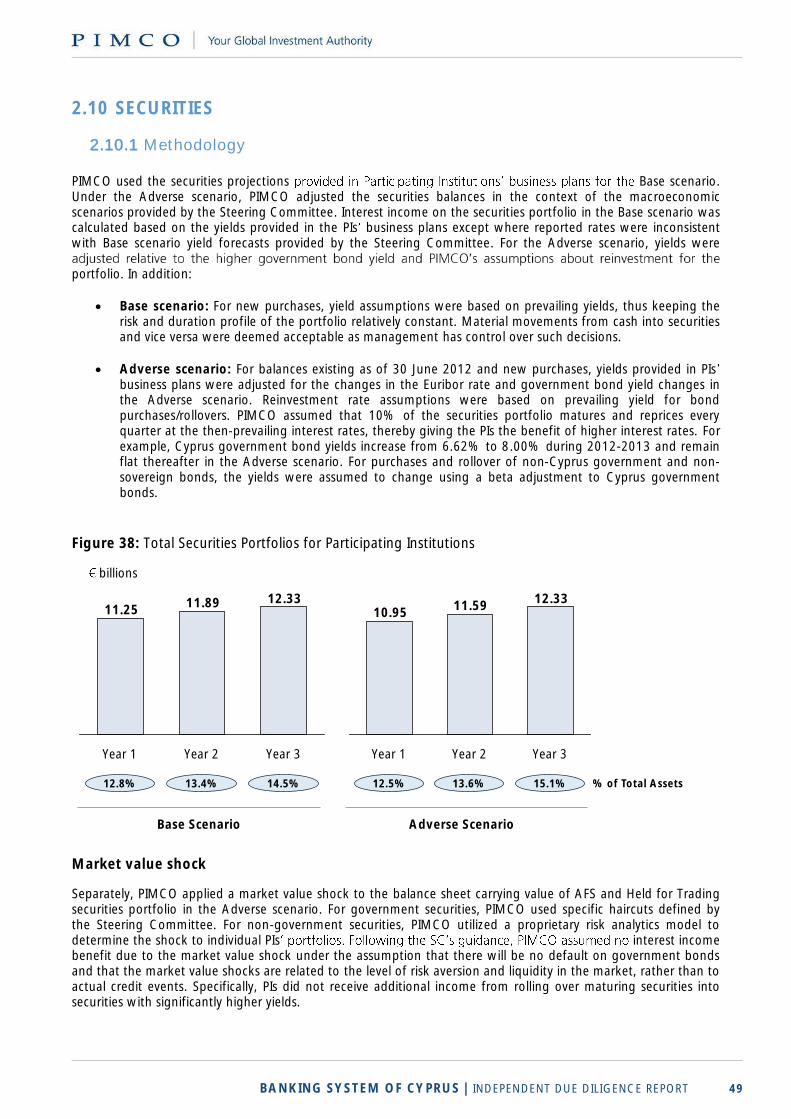
BANKING SYSTEM OF CYPRUS | INDEPENDENT DUE DILIGENCE REPORT 49
2.10 SECURITIES
2.10.1 Methodology PIMCO used the securities projections Base scenario. Under the Adverse scenario, PIMCO adjusted the securities balances in the context of the macroeconomic scenarios provided by the Steering Committee. Interest income on the securities portfolio in the Base scenario was calculated based on the yields provided in the PIs business plans except where reported rates were inconsistent with Base scenario yield forecasts provided by the Steering Committee. For the Adverse scenario, yields were
portfolio. In addition:
Base scenario: For new purchases, yield assumptions were based on prevailing yields, thus keeping the risk and duration profile of the portfolio relatively constant. Material movements from cash into securities and vice versa were deemed acceptable as management has control over such decisions.
Adverse scenario: For balances existing as of 30 June 2012 and new purchases, yields provided in PIs business plans were adjusted for the changes in the Euribor rate and government bond yield changes in the Adverse scenario. Reinvestment rate assumptions were based on prevailing yield for bond purchases/rollovers. PIMCO assumed that 10% of the securities portfolio matures and reprices every quarter at the then-prevailing interest rates, thereby giving the PIs the benefit of higher interest rates. For example, Cyprus government bond yields increase from 6.62% to 8.00% during 2012-2013 and remain flat thereafter in the Adverse scenario. For purchases and rollover of non-Cyprus government and non-sovereign bonds, the yields were assumed to change using a beta adjustment to Cyprus government bonds.
Figure 38: Total Securities Portfolios for Participating Institutions
Market value shock
Separately, PIMCO applied a market value shock to the balance sheet carrying value of AFS and Held for Trading securities portfolio in the Adverse scenario. For government securities, PIMCO used specific haircuts defined by the Steering Committee. For non-government securities, PIMCO utilized a proprietary risk analytics model to determine the shock to individual PIs interest income benefit due to the market value shock under the assumption that there will be no default on government bonds and that the market value shocks are related to the level of risk aversion and liquidity in the market, rather than to actual credit events. Specifically, PIs did not receive additional income from rolling over maturing securities into securities with significantly higher yields.
12.3311.8911.25
Year 3Year 2Year 1
12.3311.59
10.95
Year 3Year 2Year 1
billions
% of Total Assets13.4%12.8% 14.5% 13.6%12.5% 15.1%
Base Scenario Adverse Scenario
BANKING SYSTEM OF CYPRUS | INDEPENDENT DUE DILIGENCE REPORT 50
Approximately 85% of the Participating I held-to-maturity and thus is not impacted by the market value shock. Additionally, securities purchased after 30 June 2012 are not impacted by market value shock regardless of accounting classification as this shock is a point-in-time adjustment. In aggregate, the market shock applied to securities resulted across all Participating Institutions. This market shock should be understood as a prudential filter to IFRS per the Steering Committee instructions, ensuring that banks are adequately capitalized to sustain a temporary shock to securities values.
2.11 NON-BANK SUBSIDIARIES
2.11.1 Methodology Participating Institutions provided details regarding non-bank subsidiaries as part of their business plan submissions. PIMCO analyzed the impact of these non-profitability and modeled it accordingly under the Base and Adverse scenarios. For domestic and foreign banks, several non-bank subsidiaries included insurance providers, and the associated
modeled in non-interest income under insurance income. For subsidiaries engaged in brokerage and leasing/factoring, the associated income is captured and modeled in non-interest income as part of Fee and commission income . Several of the co-operative banks own and manage agricultural stores where members can purchase food and supplies. Although these businesses are non-core to the co-operativepart of the co-operativerelated to these businesses within Other non-interest income .
2.11.2 Results The contribution of all non- -provision profitability and balance sheets represented less than 2% of gross income as of 30 June 2012. All of the revenues associated with these businesses are captured and modeled in non-interest income using the methodology discussed in that section.
2.12 OTHER ASSETS
Income reported in bank business plans that is associated with other assets was assessed considering the nature
Base and Adverse scenarios. In general, this
income includes, but is not limited to, rental income from properties or businesses owned by the bank, including
those taken as Real Estate Owned as part of a loan workout. For several co-operatives, other assets also include
businesses such as agricultural supply businesses that have traditionally been affiliated with the co-operatives. See
Non-interest income section for methodology discussion.
BANKING SYSTEM OF CYPRUS | INDEPENDENT DUE DILIGENCE REPORT 51
3 Loan Loss Analysis
3.1 OVERVIEW The primary objective of the loan loss analysis was to project the future performance of the Participating
loan portfolios under the macroeconomic scenarios provided by the Steering Committee. The process consisted of two phases: 1) data collection and 2) loan-level forecasting and large loan review. In the data collection and discovery stage, PIMCO collected a large amount of granular data from the PIs, which included loan characteristics, past performance, borrower characteristics and financials. During this process, numerous meetings were held with the PIs to understand the local market and bank practices and how they are reflected in the data. Through dialogue with the PIs, collection of the required data was streamlined and processes put in place to facilitate the transfer of data. During the second phase of the loan loss analysis, PIMCO developed a loan-level model to assess the probability of default (PD), loss given default (LGD . As part of the second phase, PIMCO performed a bottom-up loan file review on a sample of large loan exposures for each PI. Finally, legal reviews on loan documentation and asset quality reviews on collateral were performed in parallel to support results and assumptions in the final model.
3.2 DATA COLLECTION At the beginning of this due diligence exercise, PIMCO undertook several rounds of interviews with bank officials at each of the PIs. Through the course of these meetings, PIMCO aimed to gain an in-depth understanding of the underwriting, origination and servicing processes at each institution, the amount of information available and specifically how various aspects would be reflected in the data systems of the PIs. During this process it became evident that:
1. The PIs focus on the customer rather than the loan. This means the entire relationship with the
customer belongs to a particular business unit of the bank, regardless of the particular types of
accounts the customer has.
2. Customers tend to have multiple accounts (often jointly with other customers) and these accounts may
share collateral with other accounts.
Figure 39 shows a hypothetical relationship structure that reflects these key points.7
7 All data in this section is drawn from the largest and most complete data set available. It is representative of the system as a whole.
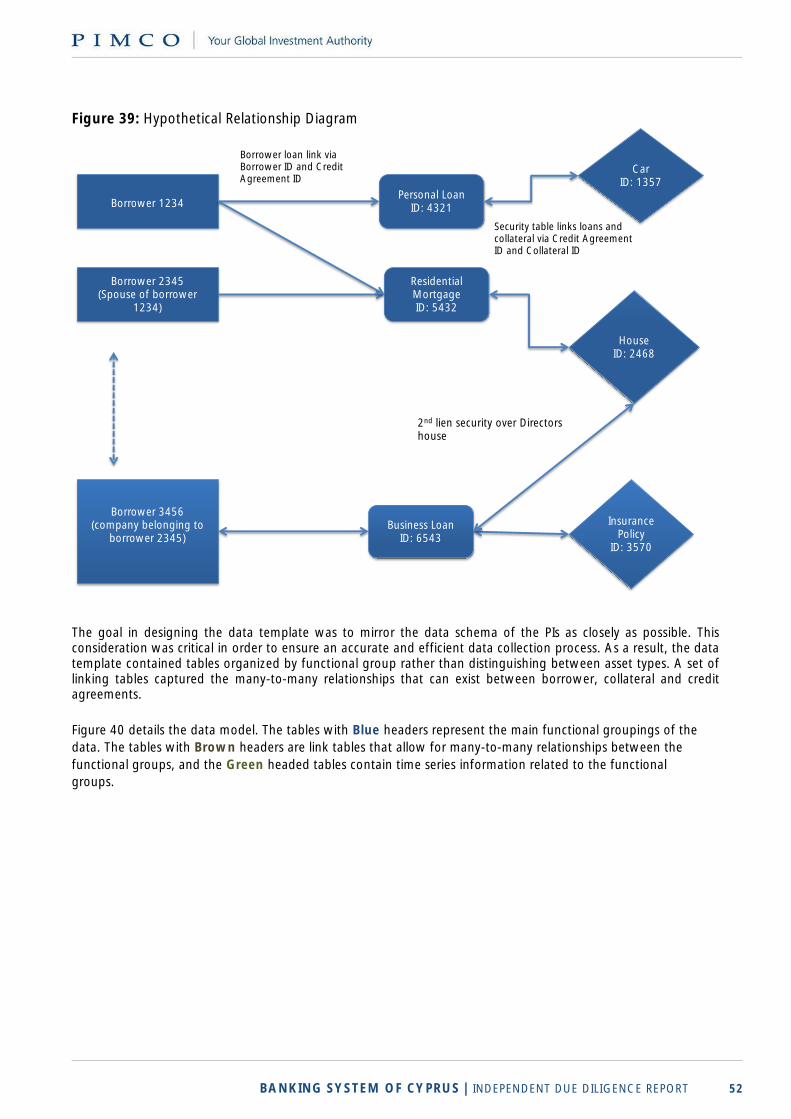
BANKING SYSTEM OF CYPRUS | INDEPENDENT DUE DILIGENCE REPORT 52
Figure 39: Hypothetical Relationship Diagram
The goal in designing the data template was to mirror the data schema of the PIs as closely as possible. This consideration was critical in order to ensure an accurate and efficient data collection process. As a result, the data template contained tables organized by functional group rather than distinguishing between asset types. A set of linking tables captured the many-to-many relationships that can exist between borrower, collateral and credit agreements.
Figure 40 details the data model. The tables with Blue headers represent the main functional groupings of the
data. The tables with Brown headers are link tables that allow for many-to-many relationships between the
functional groups, and the Green headed tables contain time series information related to the functional
groups.
Borrower 1234
Borrower 2345(Spouse of borrower
1234)
Borrower 3456(company belonging to
borrower 2345)
Personal LoanID: 4321
Residential MortgageID: 5432
CarID: 1357
HouseID: 2468
Insurance Policy
ID: 3570
Business LoanID: 6543
Borrower loan link via Borrower ID and Credit Agreement ID
2nd lien security over Directors house
Security table links loans and collateral via Credit AgreementID and Collateral ID
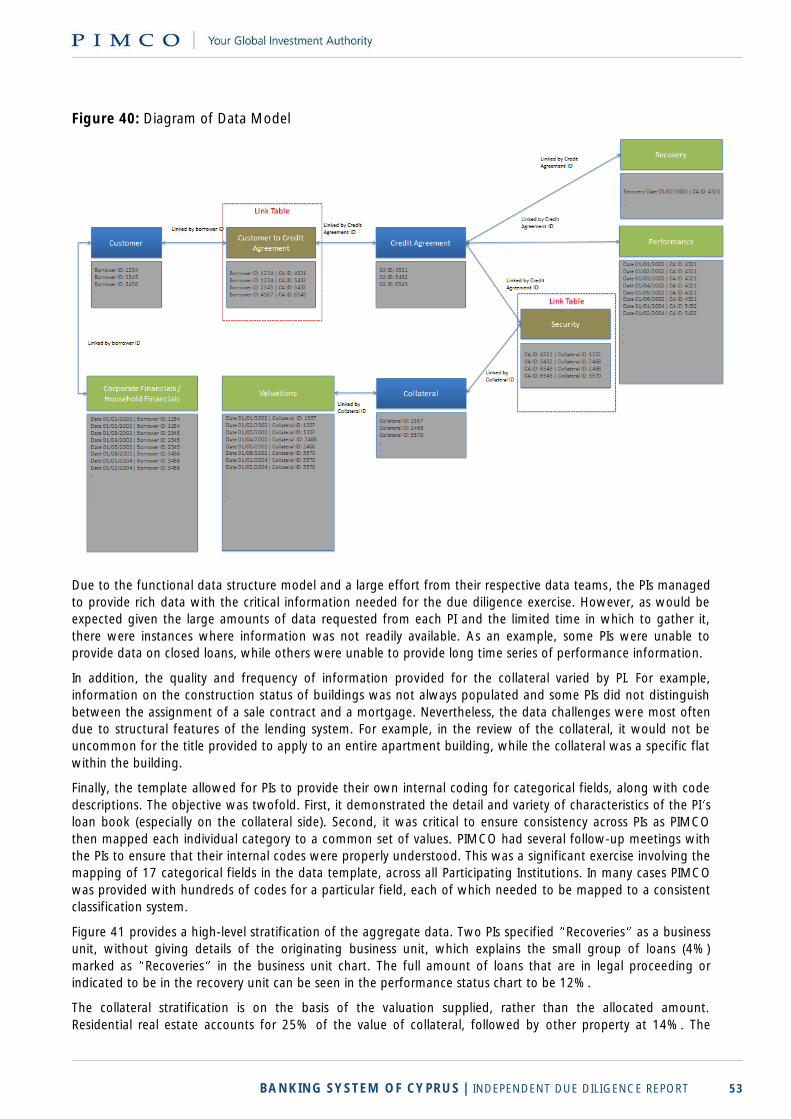
BANKING SYSTEM OF CYPRUS | INDEPENDENT DUE DILIGENCE REPORT 53
Figure 40: Diagram of Data Model
Due to the functional data structure model and a large effort from their respective data teams, the PIs managed
to provide rich data with the critical information needed for the due diligence exercise. However, as would be
expected given the large amounts of data requested from each PI and the limited time in which to gather it,
there were instances where information was not readily available. As an example, some PIs were unable to
provide data on closed loans, while others were unable to provide long time series of performance information.
In addition, the quality and frequency of information provided for the collateral varied by PI. For example,
information on the construction status of buildings was not always populated and some PIs did not distinguish
between the assignment of a sale contract and a mortgage. Nevertheless, the data challenges were most often
due to structural features of the lending system. For example, in the review of the collateral, it would not be
uncommon for the title provided to apply to an entire apartment building, while the collateral was a specific flat
within the building.
Finally, the template allowed for PIs to provide their own internal coding for categorical fields, along with code
descriptions. The objective was twofold. First, it demonstrated the detail and variety of characteristics of the PI s
loan book (especially on the collateral side). Second, it was critical to ensure consistency across PIs as PIMCO
then mapped each individual category to a common set of values. PIMCO had several follow-up meetings with
the PIs to ensure that their internal codes were properly understood. This was a significant exercise involving the
mapping of 17 categorical fields in the data template, across all Participating Institutions. In many cases PIMCO
was provided with hundreds of codes for a particular field, each of which needed to be mapped to a consistent
classification system.
Figure 41 provides a high-level stratification of the aggregate data. Two PIs specified Recoveries as a business
unit, without giving details of the originating business unit, which explains the small group of loans (4%)
marked as Recoveries in the business unit chart. The full amount of loans that are in legal proceeding or
indicated to be in the recovery unit can be seen in the performance status chart to be 12%.
The collateral stratification is on the basis of the valuation supplied, rather than the allocated amount.
Residential real estate accounts for 25% of the value of collateral, followed by other property at 14%. The
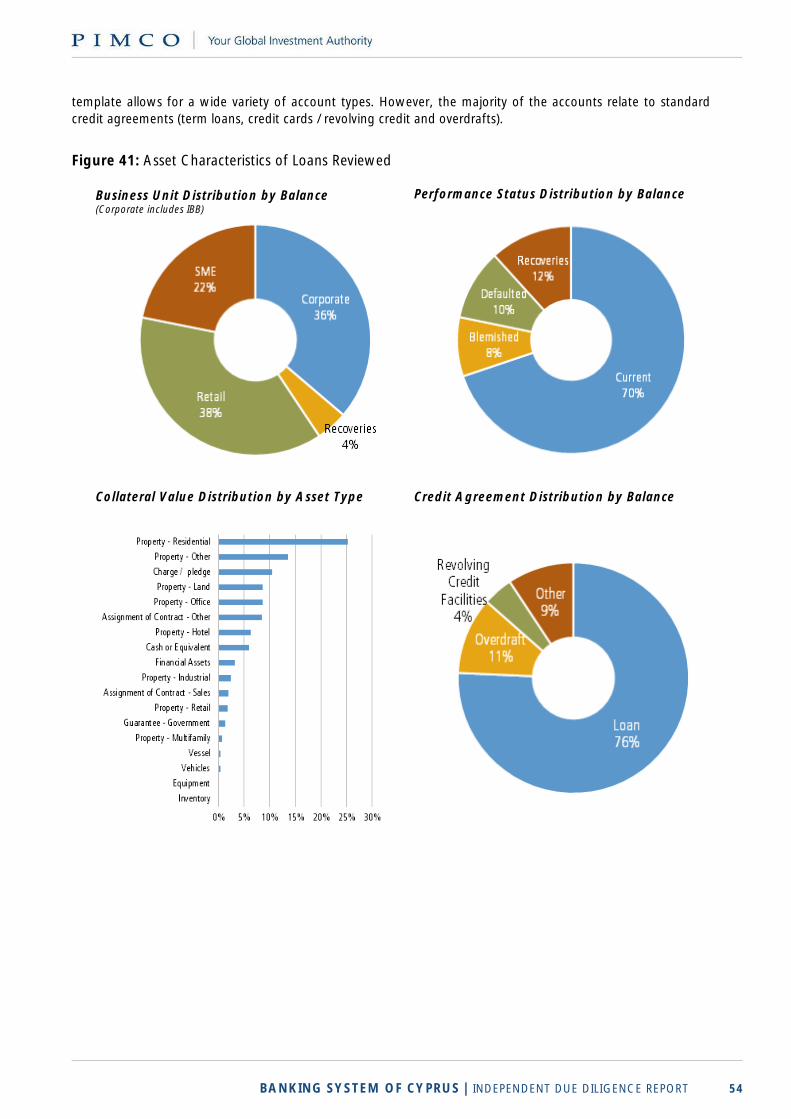
BANKING SYSTEM OF CYPRUS | INDEPENDENT DUE DILIGENCE REPORT 54
template allows for a wide variety of account types. However, the majority of the accounts relate to standard
credit agreements (term loans, credit cards / revolving credit and overdrafts).
Figure 41: Asset Characteristics of Loans Reviewed
Business Unit Distribution by Balance (Corporate includes IBB)
Performance Status Distribution by Balance
Collateral Value Distribution by Asset Type Credit Agreement Distribution by Balance
BANKING SYSTEM OF CYPRUS | INDEPENDENT DUE DILIGENCE REPORT 55
3.3 PAST PERFORMANCE REVIEW
As a precursor to the detailed modeling analysis, PIMCO carried out a review of the historical data to understand the performance dynamics of the loans in the context of the requirements of the Steering Committee. As prescribed by the Steering Committee, default is defined as either (1) entry into 90 days or more past due (90+), or (2) modification or restructuring due to distress, where the subsequent payment behavior of modified loans is taken into account. This creates two requirements:
1. Default events as defined above must be correctly identified and 2. The performance of loans subsequent to the default event must be examined.
The days past due status of the loan was well defined in the data, enabling the ready identification of the first component of the default event. However, it was challenging for the PIs to specifically provide data on distressed modification. As a proxy, PIMCO collected information on restructuring as defined by the Central Bank of Cyprus. This is a broad definition and not restricted to distressed loans. This information was widely available across PIs and the data does indicate that restructured loans have much higher default rates, confirming our opinion that even pre- ation of such inability in the future). To comply with the Steering Committee directive to take account of historical payment behavior of modified loans, PIMCO has examined the payment behavior of loans that experience credit events both on a periodic and cohort basis. This has informed our cure rate analysis. The following sections present high level results from this review. Summary:
Cure rates from 90+ are generally high. Monthly transition rate analysis indicates between 10% and 20% of loans that are in 90+ cure each month.
There has been significant growth in the stock of modified loans over the last two years. Although it is impossible to know whether such loans would have gone on to default had they not been modified, it is likely that this practice has reduced the flow into 90+, at least on a temporary basis.
The data show that neither cure nor modification results in lasting resolution. Re-offense rates are materially higher than initial offense rates. A loan that has been in 90+ in the past is three to 11 times more likely to re-offend. Loans that cure through modification are even more likely to re-offend.
Cohort analysis illustrates that ultimate cure rates range from 15% to 30%, depending on the asset class.
3.3.1 Framework for Historical Data Review
During the course of the initial round of discovery and clarification meetings, the PIs repeatedly stressed the need to consider the performance of loans after they enter 90+. Anecdotally, the PIs indicated that they achieved cure rates from 90+ as high as 30% per month, and in many cases, those loans that did not cure remained cash-flowing to some extent. Through data analysis, PIMCO confirmed that this was the case. However, PIMCO also established that looking at the subsequent performance of cured loans was critical. Re-default rates are very high, and therefore it is important to look at the data on a cohort basis in order to establish the terminal state of a loan after it has entered 90+. To ensure that these dynamics are properly reflected in the modeling approach, PIMCO carried out a cohort transition study between the following states:
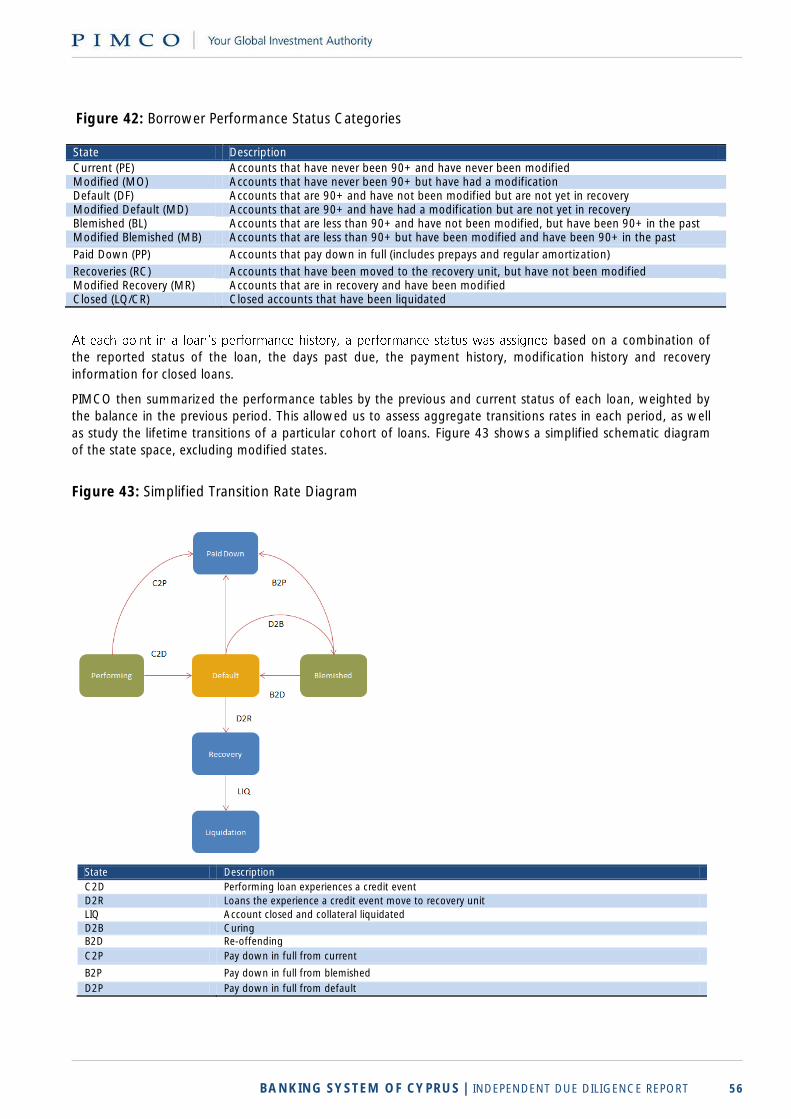
BANKING SYSTEM OF CYPRUS | INDEPENDENT DUE DILIGENCE REPORT 56
Figure 42: Borrower Performance Status Categories State Description
Current (PE) Accounts that have never been 90+ and have never been modified Modified (MO) Accounts that have never been 90+ but have had a modification Default (DF) Accounts that are 90+ and have not been modified but are not yet in recovery Modified Default (MD) Accounts that are 90+ and have had a modification but are not yet in recovery Blemished (BL) Accounts that are less than 90+ and have not been modified, but have been 90+ in the past Modified Blemished (MB) Accounts that are less than 90+ but have been modified and have been 90+ in the past
Paid Down (PP) Accounts that pay down in full (includes prepays and regular amortization)
Recoveries (RC) Accounts that have been moved to the recovery unit, but have not been modified Modified Recovery (MR) Accounts that are in recovery and have been modified Closed (LQ/CR) Closed accounts that have been liquidated
based on a combination of
the reported status of the loan, the days past due, the payment history, modification history and recovery
information for closed loans.
PIMCO then summarized the performance tables by the previous and current status of each loan, weighted by
the balance in the previous period. This allowed us to assess aggregate transitions rates in each period, as well
as study the lifetime transitions of a particular cohort of loans. Figure 43 shows a simplified schematic diagram
of the state space, excluding modified states.
Figure 43: Simplified Transition Rate Diagram
State Description
C2D Performing loan experiences a credit event
D2R Loans the experience a credit event move to recovery unit
LIQ Account closed and collateral liquidated
D2B Curing B2D Re-offending
C2P Pay down in full from current
B2P Pay down in full from blemished
D2P Pay down in full from default
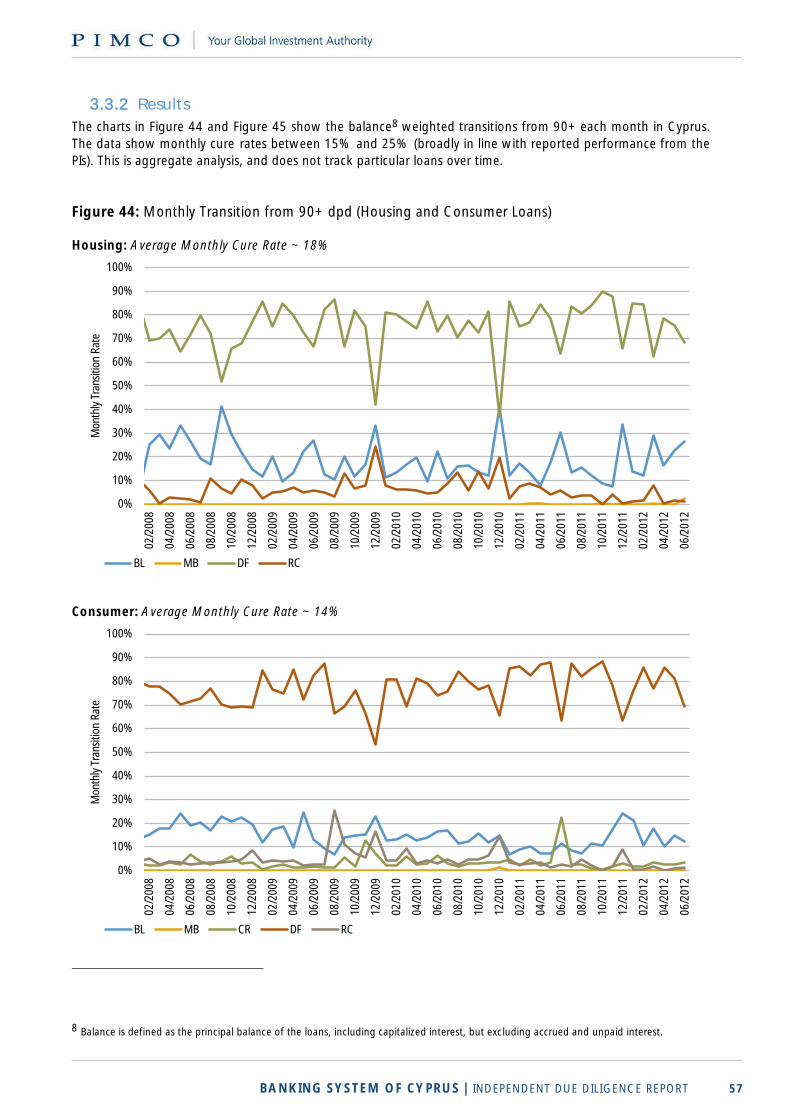
BANKING SYSTEM OF CYPRUS | INDEPENDENT DUE DILIGENCE REPORT 57
3.3.2 Results
The charts in Figure 44 and Figure 45 show the balance8 weighted transitions from 90+ each month in Cyprus.
The data show monthly cure rates between 15% and 25% (broadly in line with reported performance from the
PIs). This is aggregate analysis, and does not track particular loans over time.
Figure 44: Monthly Transition from 90+ dpd (Housing and Consumer Loans) Housing: Average Monthly Cure Rate ~ 18%
Consumer: Average Monthly Cure Rate ~ 14%
8 Balance is defined as the principal balance of the loans, including capitalized interest, but excluding accrued and unpaid interest.
0%
10%
20%
30%
40%
50%
60%
70%
80%
90%
100%
02/2
008
04/2
008
06/2
008
08/2
008
10/2
008
12/2
008
02/2
009
04/2
009
06/2
009
08/2
009
10/2
009
12/2
009
02/2
010
04/2
010
06/2
010
08/2
010
10/2
010
12/2
010
02/2
011
04/2
011
06/2
011
08/2
011
10/2
011
12/2
011
02/2
012
04/2
012
06/2
012
Mon
thly
Tra
nsiti
on R
ate
BL MB DF RC
0%
10%
20%
30%
40%
50%
60%
70%
80%
90%
100%
02/2
008
04/2
008
06/2
008
08/2
008
10/2
008
12/2
008
02/2
009
04/2
009
06/2
009
08/2
009
10/2
009
12/2
009
02/2
010
04/2
010
06/2
010
08/2
010
10/2
010
12/2
010
02/2
011
04/2
011
06/2
011
08/2
011
10/2
011
12/2
011
02/2
012
04/2
012
06/2
012
Mon
thly
Tra
nsiti
on R
ate
BL MB CR DF RC
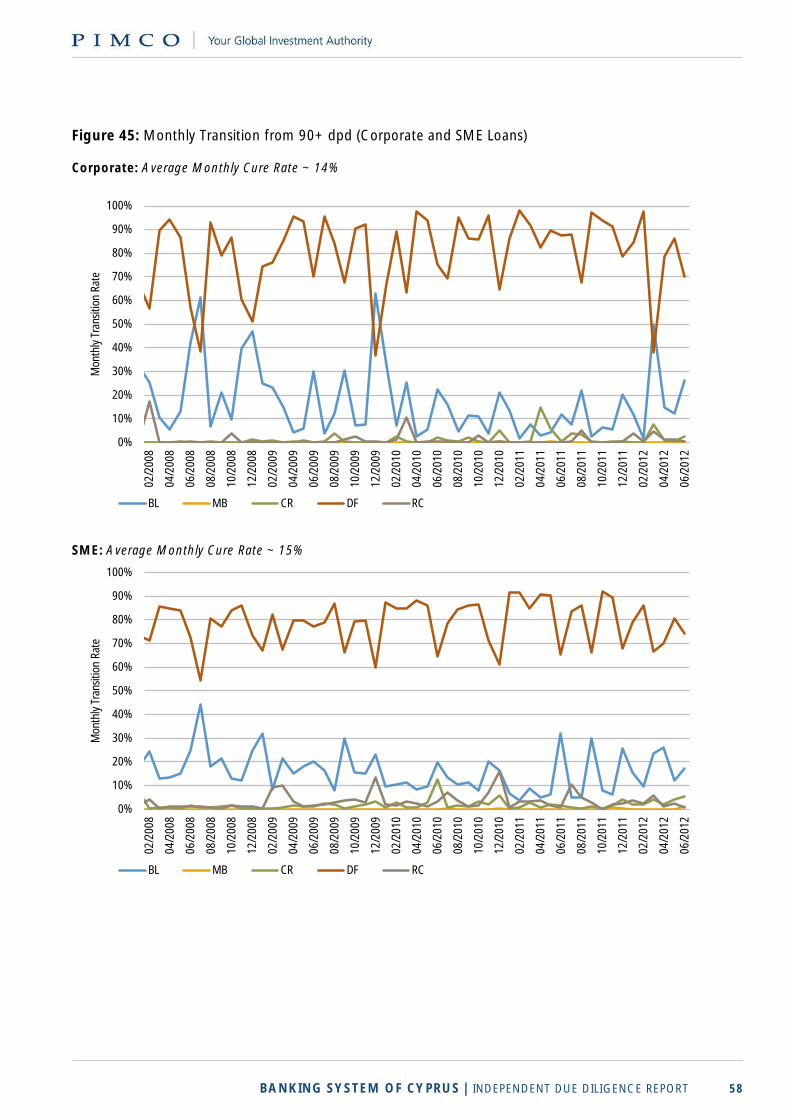
BANKING SYSTEM OF CYPRUS | INDEPENDENT DUE DILIGENCE REPORT 58
Figure 45: Monthly Transition from 90+ dpd (Corporate and SME Loans) Corporate: Average Monthly Cure Rate ~ 14%
SME: Average Monthly Cure Rate ~ 15%
0%
10%
20%
30%
40%
50%
60%
70%
80%
90%
100%
02/2
008
04/2
008
06/2
008
08/2
008
10/2
008
12/2
008
02/2
009
04/2
009
06/2
009
08/2
009
10/2
009
12/2
009
02/2
010
04/2
010
06/2
010
08/2
010
10/2
010
12/2
010
02/2
011
04/2
011
06/2
011
08/2
011
10/2
011
12/2
011
02/2
012
04/2
012
06/2
012
Mon
thly
Tra
nsiti
on R
ate
BL MB CR DF RC
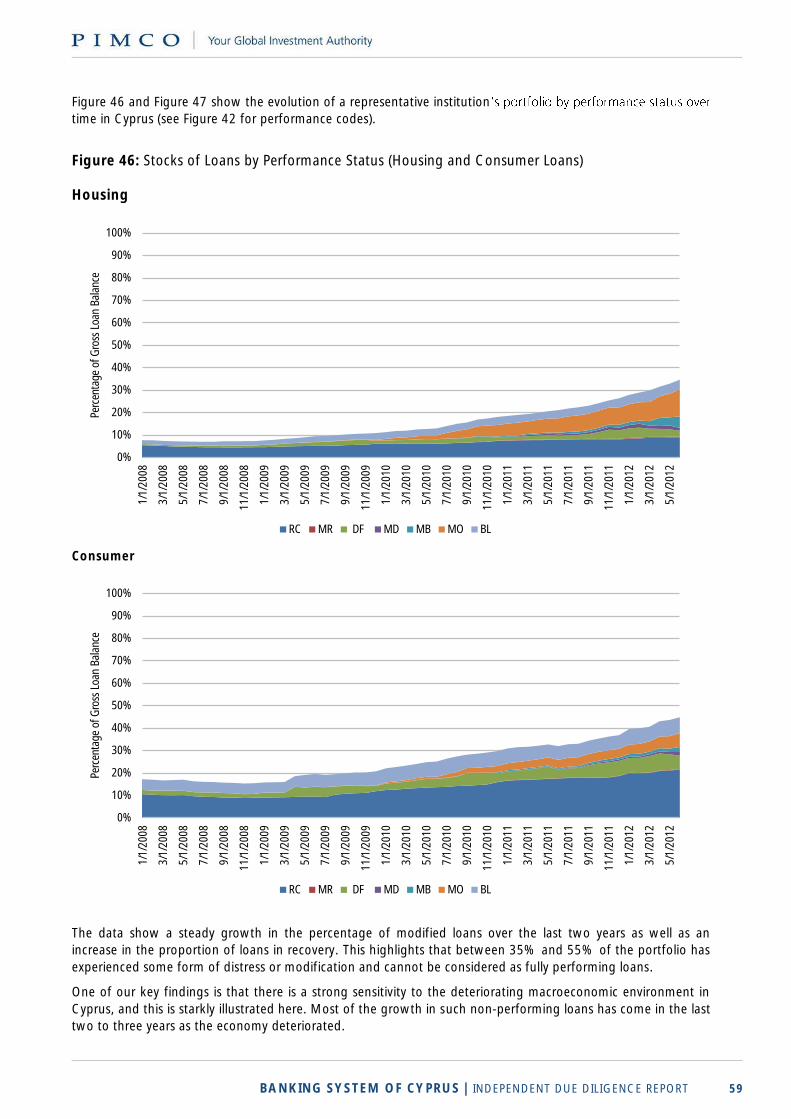
BANKING SYSTEM OF CYPRUS | INDEPENDENT DUE DILIGENCE REPORT 59
Figure 46 and Figure 47 show the evolution of a representative institution
time in Cyprus (see Figure 42 for performance codes).
Figure 46: Stocks of Loans by Performance Status (Housing and Consumer Loans) Housing
Consumer
The data show a steady growth in the percentage of modified loans over the last two years as well as an
increase in the proportion of loans in recovery. This highlights that between 35% and 55% of the portfolio has
experienced some form of distress or modification and cannot be considered as fully performing loans.
One of our key findings is that there is a strong sensitivity to the deteriorating macroeconomic environment in
Cyprus, and this is starkly illustrated here. Most of the growth in such non-performing loans has come in the last
two to three years as the economy deteriorated.
0%
10%
20%
30%
40%
50%
60%
70%
80%
90%
100%
1/1/
2008
3/1/
2008
5/1/
2008
7/1/
2008
9/1/
2008
11/1
/200
8
1/1/
2009
3/1/
2009
5/1/
2009
7/1/
2009
9/1/
2009
11/1
/200
9
1/1/
2010
3/1/
2010
5/1/
2010
7/1/
2010
9/1/
2010
11/1
/201
0
1/1/
2011
3/1/
2011
5/1/
2011
7/1/
2011
9/1/
2011
11/1
/201
1
1/1/
2012
3/1/
2012
5/1/
2012
Perc
enta
ge o
f Gro
ss L
oan
Bal
ance
RC MR DF MD MB MO BL
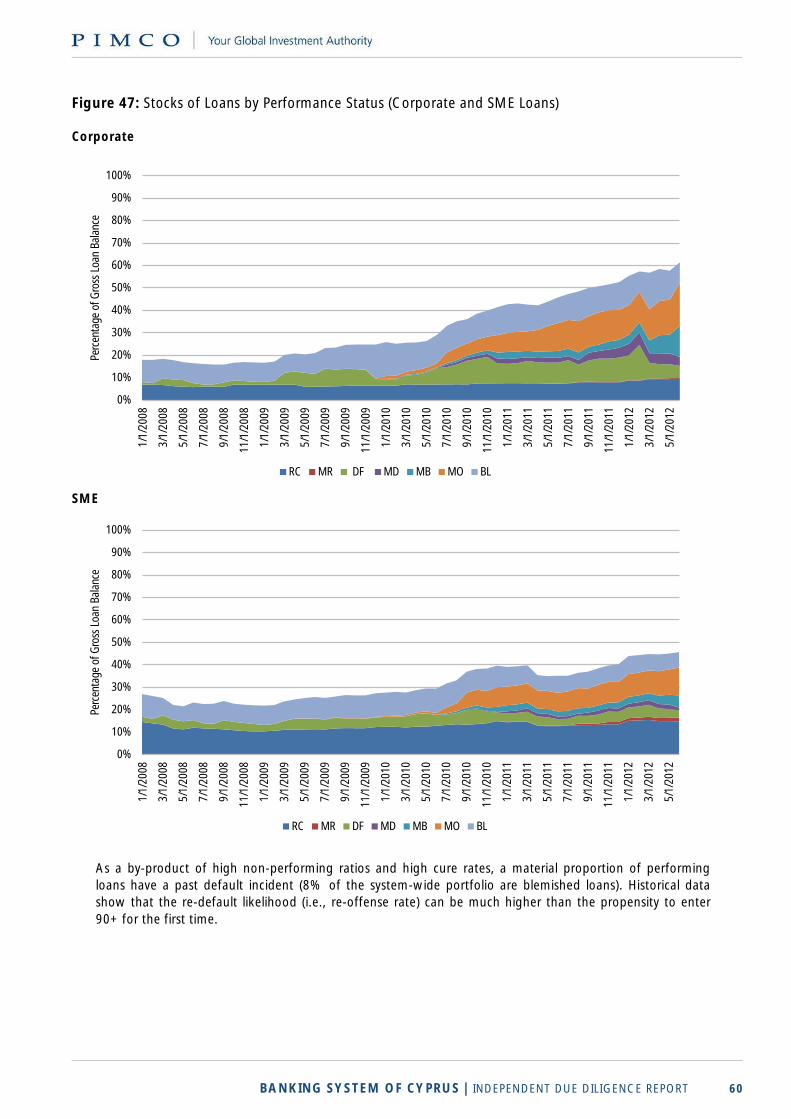
BANKING SYSTEM OF CYPRUS | INDEPENDENT DUE DILIGENCE REPORT 60
Figure 47: Stocks of Loans by Performance Status (Corporate and SME Loans) Corporate
SME
As a by-product of high non-performing ratios and high cure rates, a material proportion of performing
loans have a past default incident (8% of the system-wide portfolio are blemished loans). Historical data
show that the re-default likelihood (i.e., re-offense rate) can be much higher than the propensity to enter
90+ for the first time.
0%
10%
20%
30%
40%
50%
60%
70%
80%
90%
100%
1/1/
2008
3/1/
2008
5/1/
2008
7/1/
2008
9/1/
2008
11/1
/200
8
1/1/
2009
3/1/
2009
5/1/
2009
7/1/
2009
9/1/
2009
11/1
/200
9
1/1/
2010
3/1/
2010
5/1/
2010
7/1/
2010
9/1/
2010
11/1
/201
0
1/1/
2011
3/1/
2011
5/1/
2011
7/1/
2011
9/1/
2011
11/1
/201
1
1/1/
2012
3/1/
2012
5/1/
2012
Perc
enta
ge o
f Gro
ss L
oan
Bal
ance
RC MR DF MD MB MO BL
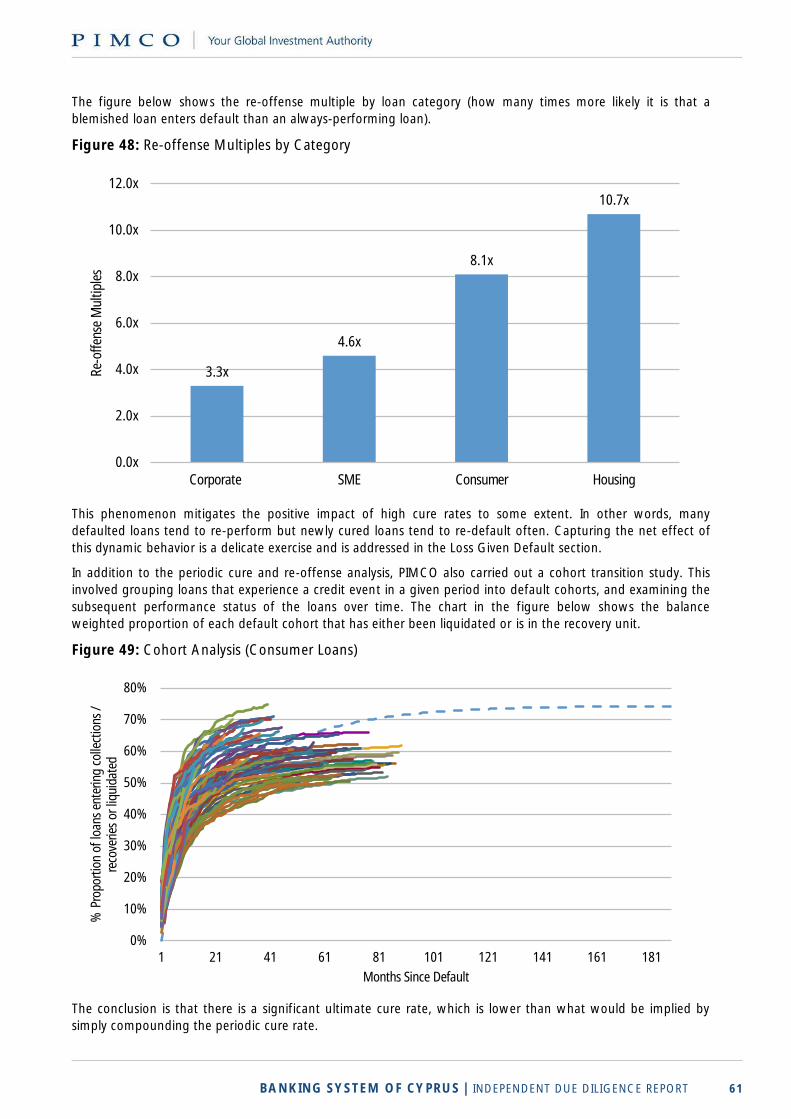
BANKING SYSTEM OF CYPRUS | INDEPENDENT DUE DILIGENCE REPORT 61
The figure below shows the re-offense multiple by loan category (how many times more likely it is that a
blemished loan enters default than an always-performing loan).
Figure 48: Re-offense Multiples by Category
This phenomenon mitigates the positive impact of high cure rates to some extent. In other words, many
defaulted loans tend to re-perform but newly cured loans tend to re-default often. Capturing the net effect of
this dynamic behavior is a delicate exercise and is addressed in the Loss Given Default section.
In addition to the periodic cure and re-offense analysis, PIMCO also carried out a cohort transition study. This
involved grouping loans that experience a credit event in a given period into default cohorts, and examining the
subsequent performance status of the loans over time. The chart in the figure below shows the balance
weighted proportion of each default cohort that has either been liquidated or is in the recovery unit.
Figure 49: Cohort Analysis (Consumer Loans)
The conclusion is that there is a significant ultimate cure rate, which is lower than what would be implied by
simply compounding the periodic cure rate.
3.3x
4.6x
8.1x
10.7x
0.0x
2.0x
4.0x
6.0x
8.0x
10.0x
12.0x
Corporate SME Consumer Housing
Re-o
ffen
se M
ultip
les
0%
10%
20%
30%
40%
50%
60%
70%
80%
1 21 41 61 81 101 121 141 161 181
% P
ropo
rtio
n of
loan
s en
terin
g co
llect
ions
/ re
cove
ries
or li
quid
ated
Months Since Default
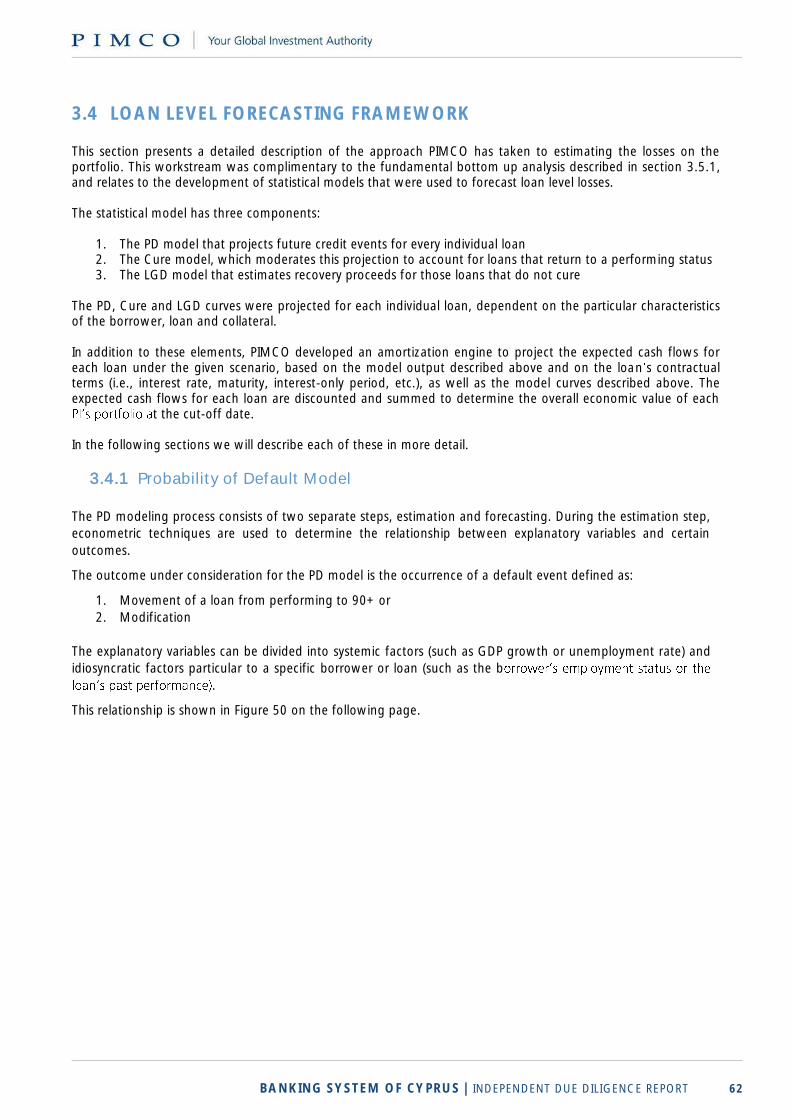
BANKING SYSTEM OF CYPRUS | INDEPENDENT DUE DILIGENCE REPORT 62
3.4 LOAN LEVEL FORECASTING FRAMEWORK This section presents a detailed description of the approach PIMCO has taken to estimating the losses on the portfolio. This workstream was complimentary to the fundamental bottom up analysis described in section 3.5.1, and relates to the development of statistical models that were used to forecast loan level losses. The statistical model has three components:
1. The PD model that projects future credit events for every individual loan 2. The Cure model, which moderates this projection to account for loans that return to a performing status 3. The LGD model that estimates recovery proceeds for those loans that do not cure
The PD, Cure and LGD curves were projected for each individual loan, dependent on the particular characteristics of the borrower, loan and collateral. In addition to these elements, PIMCO developed an amortization engine to project the expected cash flows for each loan under the given scenario, based on the model output described above and on the loan s contractual terms (i.e., interest rate, maturity, interest-only period, etc.), as well as the model curves described above. The expected cash flows for each loan are discounted and summed to determine the overall economic value of each
t the cut-off date. In the following sections we will describe each of these in more detail.
3.4.1 Probability of Default Model
The PD modeling process consists of two separate steps, estimation and forecasting. During the estimation step,
econometric techniques are used to determine the relationship between explanatory variables and certain
outcomes.
The outcome under consideration for the PD model is the occurrence of a default event defined as:
1. Movement of a loan from performing to 90+ or
2. Modification
The explanatory variables can be divided into systemic factors (such as GDP growth or unemployment rate) and
idiosyncratic factors particular to a specific borrower or loan (such as the b
.
This relationship is shown in Figure 50 on the following page.
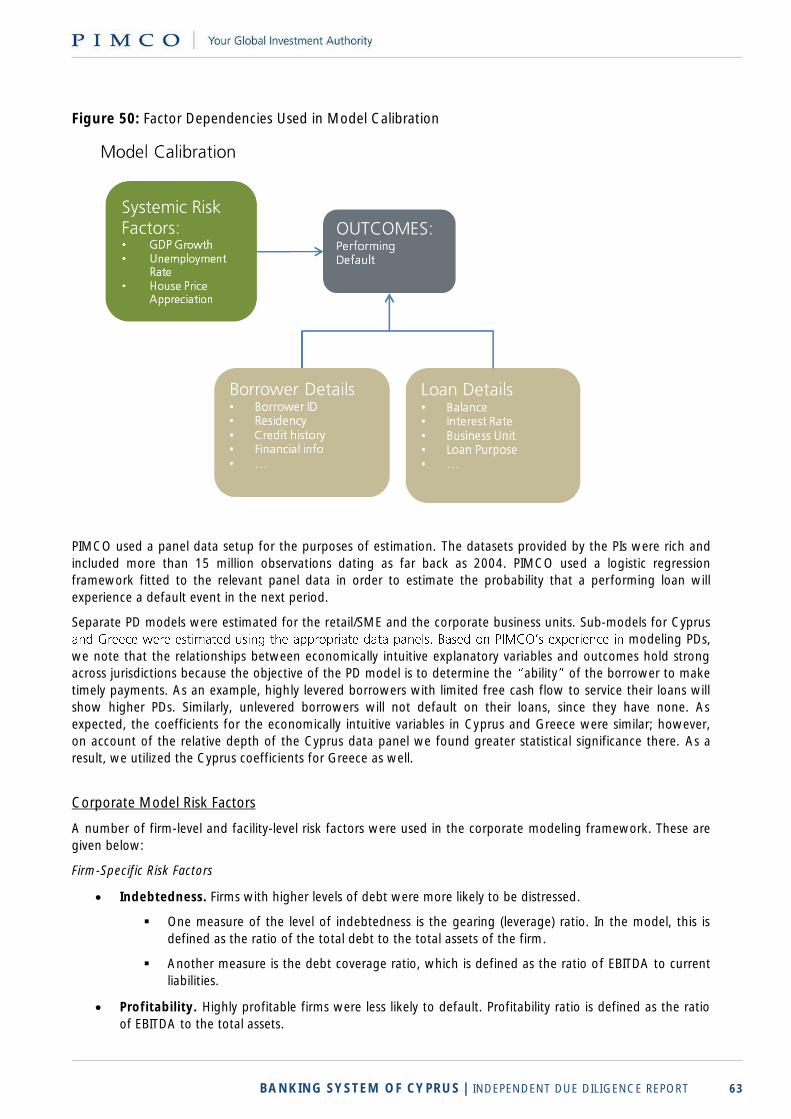
BANKING SYSTEM OF CYPRUS | INDEPENDENT DUE DILIGENCE REPORT 63
Figure 50: Factor Dependencies Used in Model Calibration
PIMCO used a panel data setup for the purposes of estimation. The datasets provided by the PIs were rich and
included more than 15 million observations dating as far back as 2004. PIMCO used a logistic regression
framework fitted to the relevant panel data in order to estimate the probability that a performing loan will
experience a default event in the next period.
Separate PD models were estimated for the retail/SME and the corporate business units. Sub-models for Cyprus
modeling PDs,
we note that the relationships between economically intuitive explanatory variables and outcomes hold strong
across jurisdictions because the objective of the PD model is to determine the ability of the borrower to make
timely payments. As an example, highly levered borrowers with limited free cash flow to service their loans will
show higher PDs. Similarly, unlevered borrowers will not default on their loans, since they have none. As
expected, the coefficients for the economically intuitive variables in Cyprus and Greece were similar; however,
on account of the relative depth of the Cyprus data panel we found greater statistical significance there. As a
result, we utilized the Cyprus coefficients for Greece as well.
Corporate Model Risk Factors
A number of firm-level and facility-level risk factors were used in the corporate modeling framework. These are
given below:
Firm-Specific Risk Factors
Indebtedness. Firms with higher levels of debt were more likely to be distressed.
One measure of the level of indebtedness is the gearing (leverage) ratio. In the model, this is
defined as the ratio of the total debt to the total assets of the firm.
Another measure is the debt coverage ratio, which is defined as the ratio of EBITDA to current
liabilities.
Profitability. Highly profitable firms were less likely to default. Profitability ratio is defined as the ratio
of EBITDA to the total assets.
BANKING SYSTEM OF CYPRUS | INDEPENDENT DUE DILIGENCE REPORT 64
Liquidity. Firms with higher liquidity were less likely to default. In the model, liquidity is defined as the
ratio of the current assets to current liabilities.
Size. Large firms were less likely to be distressed. Size is defined as the logarithm of the sales of the
firm.
Facility-Specific Risk Factor
Default History. Facilities that were 90+ dpd in the past were observed to have a higher propensity to default in the future.
Systemic Risk Factor
GDP. A decline in GDP implies a worsening economic environment and hence business performance and PIMCO used a
three-month lagged version of GDP growth to capture this effect.
Since some of the above factors are correlated, PIMCO used a variable selection scheme to pick the appropriate
variables to use in the model. It is important to note the following:
Leverage ratio was determined to be the most important firm specific risk factor in predicting default. the large loan book.
It is intuitive that able and to generate positive free cash flow should be an important determinant of its default probability. This aspect does enter our model through the DSCR, which is defined as the ratio of the firm's EBITDA to its debt service obligation. T TDA is a measure of its free cash flow.
Retail and SME Model Risk Factors
A number of borrower level and facility level risk factors were used in the retail/SME modeling framework.
Separate models were estimated for the Cypriot and Greek portfolios. These are given below, and where they
are country specific, this is indicated:9
Borrower-Specific Risk Factors
Employment Status. The unemployment status of an individual has a direct bearing on their ability to pay.
Debt-to-Income Ratio (DTI).* A higher DTI ratio for a borrower indicates larger default probability.
Residency.* Local residents have a lower probability of default than foreigners.
Bank Staff.* Loans to bank staff have lower probability of default. Facility-Specific Risk Factors
Default History. A facility specific default history is used as the propensity to re-default is observed to be very high.
Credit Agreement Type. Overdraft, credit card, loans stemming from unfunded credit agreements* and auto loans* have a smaller chance to default.
Interest Rate. Loans with higher interest rates have a larger default probability.
9 Characteristics particular c
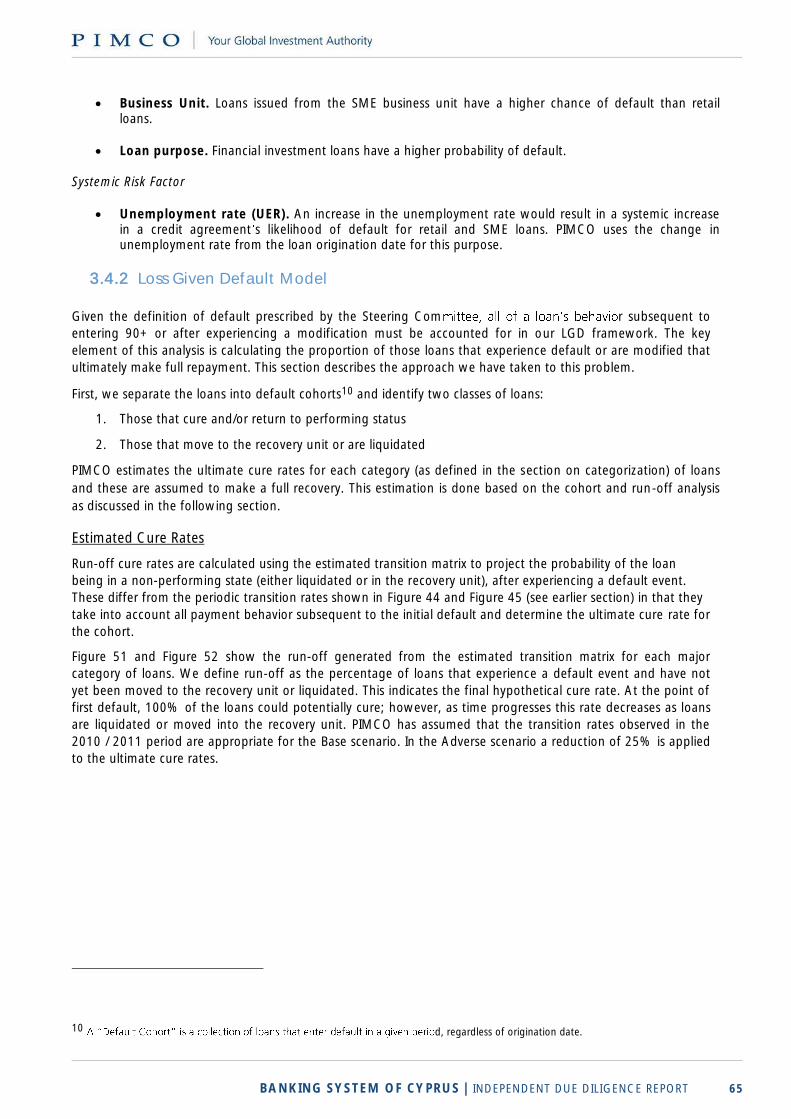
BANKING SYSTEM OF CYPRUS | INDEPENDENT DUE DILIGENCE REPORT 65
Business Unit. Loans issued from the SME business unit have a higher chance of default than retail loans.
Loan purpose. Financial investment loans have a higher probability of default. Systemic Risk Factor
Unemployment rate (UER). An increase in the unemployment rate would result in a systemic increase in a credit agreement s likelihood of default for retail and SME loans. PIMCO uses the change in unemployment rate from the loan origination date for this purpose.
3.4.2 Loss Given Default Model
Given the definition of default prescribed by the Steering Com r subsequent to
entering 90+ or after experiencing a modification must be accounted for in our LGD framework. The key
element of this analysis is calculating the proportion of those loans that experience default or are modified that
ultimately make full repayment. This section describes the approach we have taken to this problem.
First, we separate the loans into default cohorts10 and identify two classes of loans:
1. Those that cure and/or return to performing status
2. Those that move to the recovery unit or are liquidated
PIMCO estimates the ultimate cure rates for each category (as defined in the section on categorization) of loans
and these are assumed to make a full recovery. This estimation is done based on the cohort and run-off analysis
as discussed in the following section.
Estimated Cure Rates
Run-off cure rates are calculated using the estimated transition matrix to project the probability of the loan
being in a non-performing state (either liquidated or in the recovery unit), after experiencing a default event.
These differ from the periodic transition rates shown in Figure 44 and Figure 45 (see earlier section) in that they
take into account all payment behavior subsequent to the initial default and determine the ultimate cure rate for
the cohort.
Figure 51 and Figure 52 show the run-off generated from the estimated transition matrix for each major
category of loans. We define run-off as the percentage of loans that experience a default event and have not
yet been moved to the recovery unit or liquidated. This indicates the final hypothetical cure rate. At the point of
first default, 100% of the loans could potentially cure; however, as time progresses this rate decreases as loans
are liquidated or moved into the recovery unit. PIMCO has assumed that the transition rates observed in the
2010 / 2011 period are appropriate for the Base scenario. In the Adverse scenario a reduction of 25% is applied
to the ultimate cure rates.
10 d, regardless of origination date.
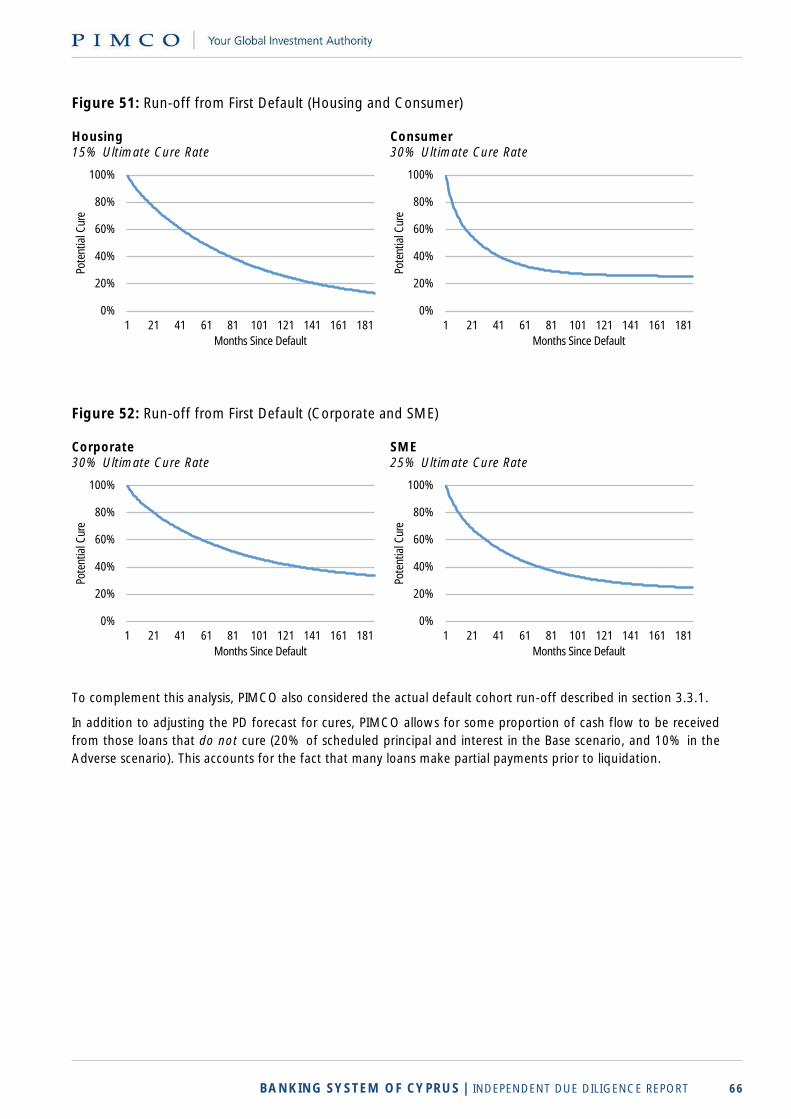
BANKING SYSTEM OF CYPRUS | INDEPENDENT DUE DILIGENCE REPORT 66
Figure 51: Run-off from First Default (Housing and Consumer) Housing 15% Ultimate Cure Rate
Consumer 30% Ultimate Cure Rate
Figure 52: Run-off from First Default (Corporate and SME) Corporate 30% Ultimate Cure Rate
SME 25% Ultimate Cure Rate
To complement this analysis, PIMCO also considered the actual default cohort run-off described in section 3.3.1.
In addition to adjusting the PD forecast for cures, PIMCO allows for some proportion of cash flow to be received
from those loans that do not cure (20% of scheduled principal and interest in the Base scenario, and 10% in the
Adverse scenario). This accounts for the fact that many loans make partial payments prior to liquidation.
0%
20%
40%
60%
80%
100%
1 21 41 61 81 101 121 141 161 181
Pote
ntia
l Cur
e
Months Since Default
0%
20%
40%
60%
80%
100%
1 21 41 61 81 101 121 141 161 181
Pote
ntia
l Cur
e
Months Since Default
0%
20%
40%
60%
80%
100%
1 21 41 61 81 101 121 141 161 181
Pote
ntia
l Cur
e
Months Since Default
0%
20%
40%
60%
80%
100%
1 21 41 61 81 101 121 141 161 181
Pote
ntia
l Cur
e
Months Since Default
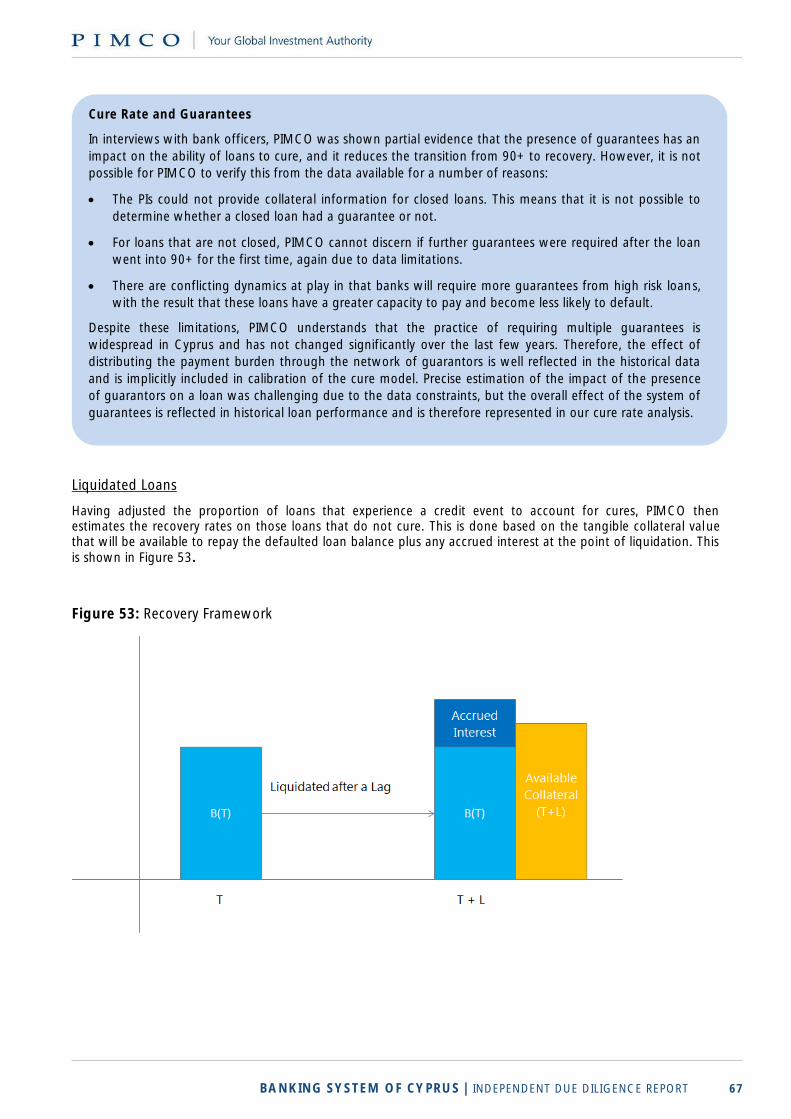
BANKING SYSTEM OF CYPRUS | INDEPENDENT DUE DILIGENCE REPORT 67
Liquidated Loans
Having adjusted the proportion of loans that experience a credit event to account for cures, PIMCO then estimates the recovery rates on those loans that do not cure. This is done based on the tangible collateral value that will be available to repay the defaulted loan balance plus any accrued interest at the point of liquidation. This is shown in Figure 53.
Figure 53: Recovery Framework
Cure Rate and Guarantees
In interviews with bank officers, PIMCO was shown partial evidence that the presence of guarantees has an
impact on the ability of loans to cure, and it reduces the transition from 90+ to recovery. However, it is not
possible for PIMCO to verify this from the data available for a number of reasons:
The PIs could not provide collateral information for closed loans. This means that it is not possible to
determine whether a closed loan had a guarantee or not.
For loans that are not closed, PIMCO cannot discern if further guarantees were required after the loan
went into 90+ for the first time, again due to data limitations.
There are conflicting dynamics at play in that banks will require more guarantees from high risk loans,
with the result that these loans have a greater capacity to pay and become less likely to default.
Despite these limitations, PIMCO understands that the practice of requiring multiple guarantees is
widespread in Cyprus and has not changed significantly over the last few years. Therefore, the effect of
distributing the payment burden through the network of guarantors is well reflected in the historical data
and is implicitly included in calibration of the cure model. Precise estimation of the impact of the presence
of guarantors on a loan was challenging due to the data constraints, but the overall effect of the system of
guarantees is reflected in historical loan performance and is therefore represented in our cure rate analysis.
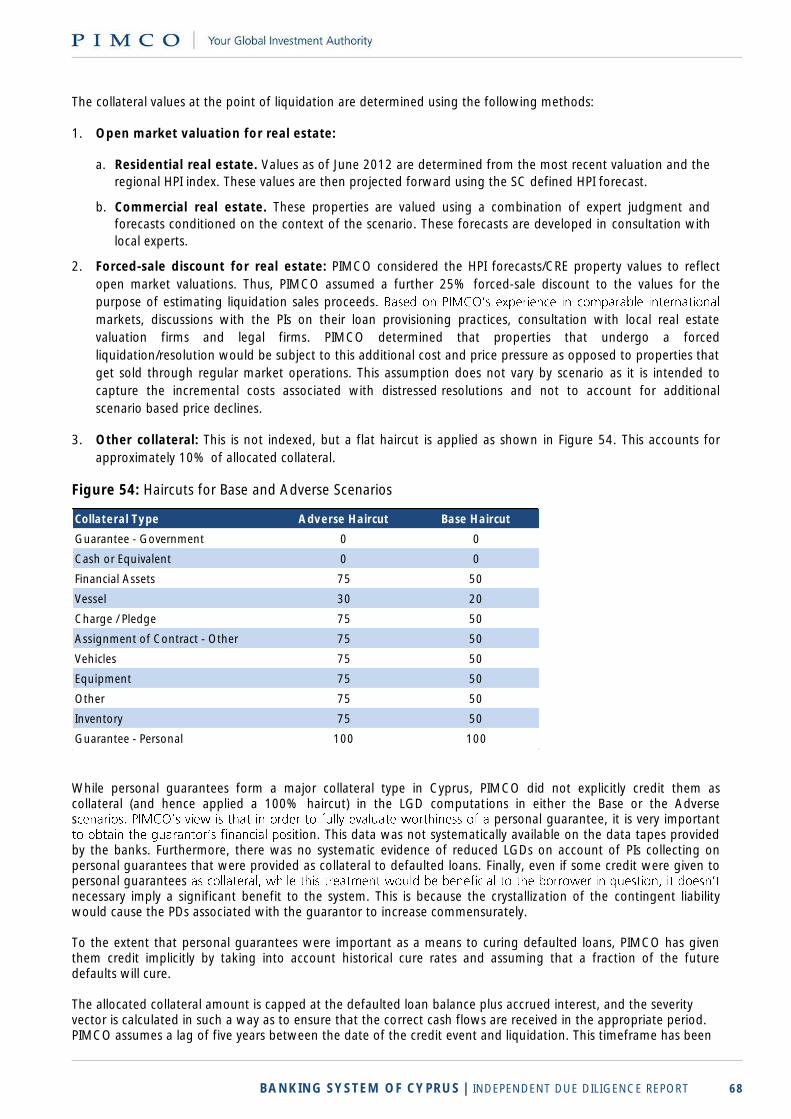
BANKING SYSTEM OF CYPRUS | INDEPENDENT DUE DILIGENCE REPORT 68
The collateral values at the point of liquidation are determined using the following methods:
1. Open market valuation for real estate:
a. Residential real estate. Values as of June 2012 are determined from the most recent valuation and the
regional HPI index. These values are then projected forward using the SC defined HPI forecast.
b. Commercial real estate. These properties are valued using a combination of expert judgment and
forecasts conditioned on the context of the scenario. These forecasts are developed in consultation with
local experts.
2. Forced-sale discount for real estate: PIMCO considered the HPI forecasts/CRE property values to reflect
open market valuations. Thus, PIMCO assumed a further 25% forced-sale discount to the values for the
purpose of estimating liquidation sales proceeds
markets, discussions with the PIs on their loan provisioning practices, consultation with local real estate
valuation firms and legal firms. PIMCO determined that properties that undergo a forced
liquidation/resolution would be subject to this additional cost and price pressure as opposed to properties that
get sold through regular market operations. This assumption does not vary by scenario as it is intended to
capture the incremental costs associated with distressed resolutions and not to account for additional
scenario based price declines.
3. Other collateral: This is not indexed, but a flat haircut is applied as shown in Figure 54. This accounts for
approximately 10% of allocated collateral.
Figure 54: Haircuts for Base and Adverse Scenarios
While personal guarantees form a major collateral type in Cyprus, PIMCO did not explicitly credit them as collateral (and hence applied a 100% haircut) in the LGD computations in either the Base or the Adverse s personal guarantee, it is very important
tion. This data was not systematically available on the data tapes provided by the banks. Furthermore, there was no systematic evidence of reduced LGDs on account of PIs collecting on personal guarantees that were provided as collateral to defaulted loans. Finally, even if some credit were given to personal guarantees necessary imply a significant benefit to the system. This is because the crystallization of the contingent liability would cause the PDs associated with the guarantor to increase commensurately. To the extent that personal guarantees were important as a means to curing defaulted loans, PIMCO has given them credit implicitly by taking into account historical cure rates and assuming that a fraction of the future defaults will cure. The allocated collateral amount is capped at the defaulted loan balance plus accrued interest, and the severity vector is calculated in such a way as to ensure that the correct cash flows are received in the appropriate period. PIMCO assumes a lag of five years between the date of the credit event and liquidation. This timeframe has been
Collateral Type Adverse Haircut Base Haircut
Guarantee - Government 0 0
Cash or Equivalent 0 0
Financial Assets 75 50
Vessel 30 20
Charge / Pledge 75 50
Assignment of Contract - Other 75 50
Vehicles 75 50
Equipment 75 50
Other 75 50
Inventory 75 50
Guarantee - Personal 100 100
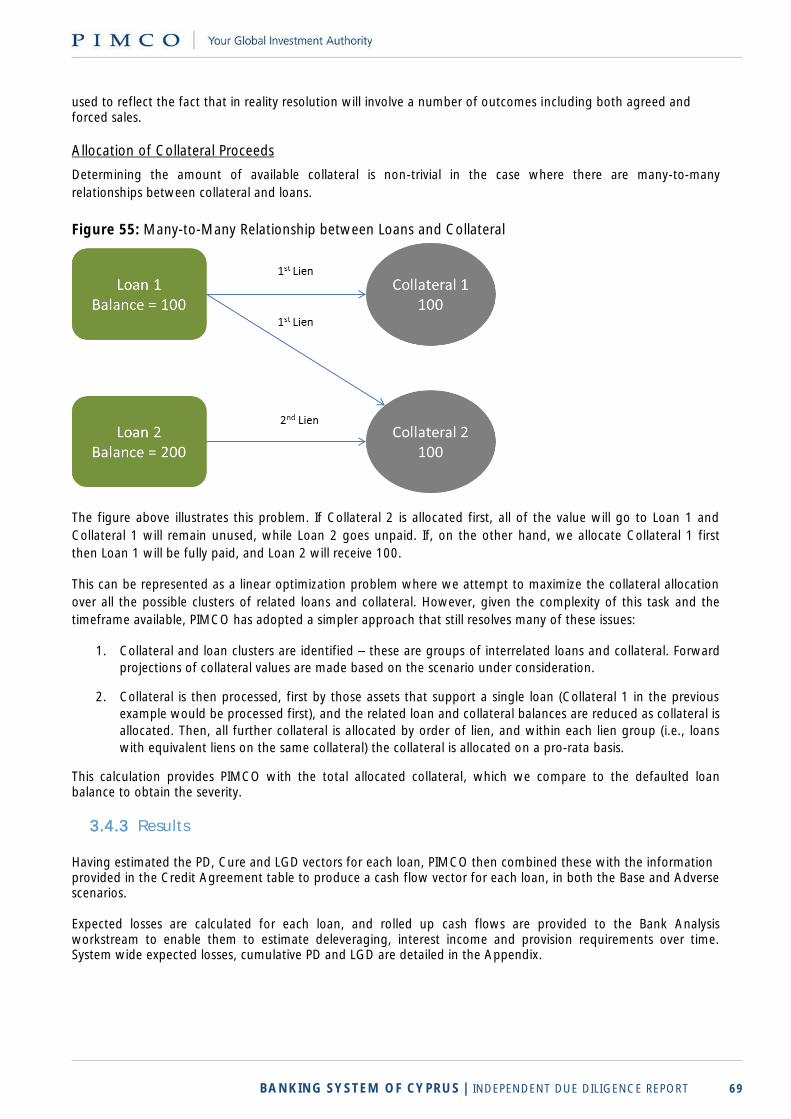
BANKING SYSTEM OF CYPRUS | INDEPENDENT DUE DILIGENCE REPORT 69
used to reflect the fact that in reality resolution will involve a number of outcomes including both agreed and forced sales. Allocation of Collateral Proceeds
Determining the amount of available collateral is non-trivial in the case where there are many-to-many
relationships between collateral and loans.
Figure 55: Many-to-Many Relationship between Loans and Collateral
The figure above illustrates this problem. If Collateral 2 is allocated first, all of the value will go to Loan 1 and
Collateral 1 will remain unused, while Loan 2 goes unpaid. If, on the other hand, we allocate Collateral 1 first
then Loan 1 will be fully paid, and Loan 2 will receive 100.
This can be represented as a linear optimization problem where we attempt to maximize the collateral allocation
over all the possible clusters of related loans and collateral. However, given the complexity of this task and the
timeframe available, PIMCO has adopted a simpler approach that still resolves many of these issues:
1. Collateral and loan clusters are identified these are groups of interrelated loans and collateral. Forward
projections of collateral values are made based on the scenario under consideration.
2. Collateral is then processed, first by those assets that support a single loan (Collateral 1 in the previous
example would be processed first), and the related loan and collateral balances are reduced as collateral is
allocated. Then, all further collateral is allocated by order of lien, and within each lien group (i.e., loans
with equivalent liens on the same collateral) the collateral is allocated on a pro-rata basis.
This calculation provides PIMCO with the total allocated collateral, which we compare to the defaulted loan balance to obtain the severity.
3.4.3 Results
Having estimated the PD, Cure and LGD vectors for each loan, PIMCO then combined these with the information provided in the Credit Agreement table to produce a cash flow vector for each loan, in both the Base and Adverse scenarios. Expected losses are calculated for each loan, and rolled up cash flows are provided to the Bank Analysis workstream to enable them to estimate deleveraging, interest income and provision requirements over time. System wide expected losses, cumulative PD and LGD are detailed in the Appendix.
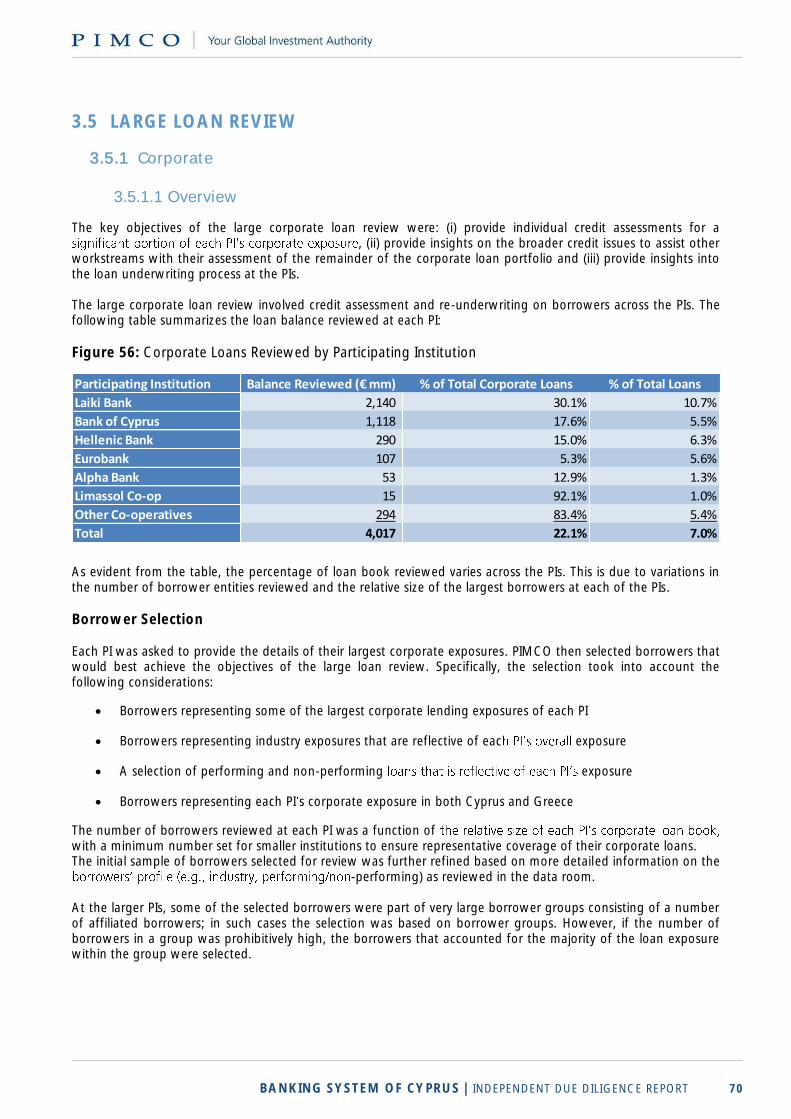
BANKING SYSTEM OF CYPRUS | INDEPENDENT DUE DILIGENCE REPORT 70
3.5 LARGE LOAN REVIEW
3.5.1 Corporate
3.5.1.1 Overview
The key objectives of the large corporate loan review were: (i) provide individual credit assessments for a , (ii) provide insights on the broader credit issues to assist other
workstreams with their assessment of the remainder of the corporate loan portfolio and (iii) provide insights into the loan underwriting process at the PIs. The large corporate loan review involved credit assessment and re-underwriting on borrowers across the PIs. The following table summarizes the loan balance reviewed at each PI:
Figure 56: Corporate Loans Reviewed by Participating Institution
As evident from the table, the percentage of loan book reviewed varies across the PIs. This is due to variations in the number of borrower entities reviewed and the relative size of the largest borrowers at each of the PIs.
Borrower Selection Each PI was asked to provide the details of their largest corporate exposures. PIMCO then selected borrowers that would best achieve the objectives of the large loan review. Specifically, the selection took into account the following considerations:
Borrowers representing some of the largest corporate lending exposures of each PI
Borrowers representing industry exposures that are reflective of eac exposure
A selection of performing and non-performing exposure
Borrowers representing each PI s corporate exposure in both Cyprus and Greece
The number of borrowers reviewed at each PI was a function of with a minimum number set for smaller institutions to ensure representative coverage of their corporate loans. The initial sample of borrowers selected for review was further refined based on more detailed information on the
-performing) as reviewed in the data room. At the larger PIs, some of the selected borrowers were part of very large borrower groups consisting of a number of affiliated borrowers; in such cases the selection was based on borrower groups. However, if the number of borrowers in a group was prohibitively high, the borrowers that accounted for the majority of the loan exposure within the group were selected.
Participating Institution Balance Reviewed (€ mm) % of Total Corporate Loans % of Total Loans
Laiki Bank 2,140 30.1% 10.7%
Bank of Cyprus 1,118 17.6% 5.5%
Hellenic Bank 290 15.0% 6.3%
Eurobank 107 5.3% 5.6%
Alpha Bank 53 12.9% 1.3%
Limassol Co-op 15 92.1% 1.0%
Other Co-operatives 294 83.4% 5.4%
Total 4,017 22.1% 7.0%
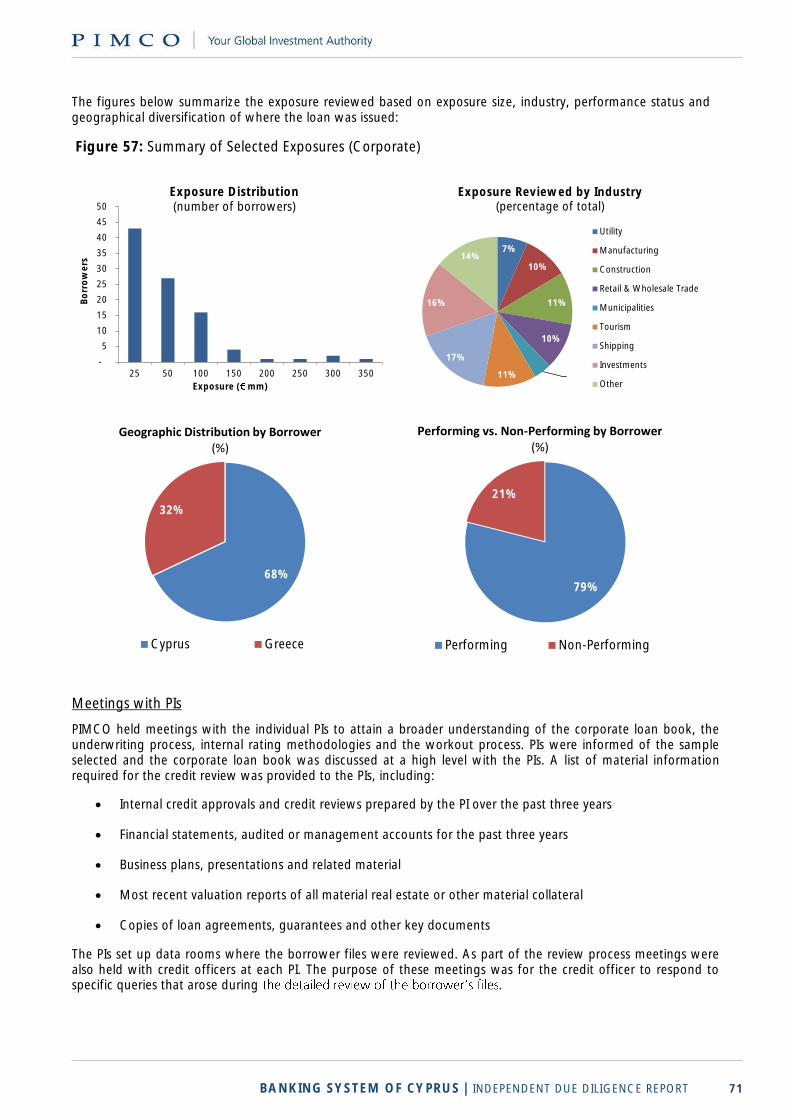
BANKING SYSTEM OF CYPRUS | INDEPENDENT DUE DILIGENCE REPORT 71
The figures below summarize the exposure reviewed based on exposure size, industry, performance status and geographical diversification of where the loan was issued:
Figure 57: Summary of Selected Exposures (Corporate)
Meetings with PIs
PIMCO held meetings with the individual PIs to attain a broader understanding of the corporate loan book, the underwriting process, internal rating methodologies and the workout process. PIs were informed of the sample selected and the corporate loan book was discussed at a high level with the PIs. A list of material information required for the credit review was provided to the PIs, including:
Internal credit approvals and credit reviews prepared by the PI over the past three years
Financial statements, audited or management accounts for the past three years
Business plans, presentations and related material
Most recent valuation reports of all material real estate or other material collateral
Copies of loan agreements, guarantees and other key documents
The PIs set up data rooms where the borrower files were reviewed. As part of the review process meetings were also held with credit officers at each PI. The purpose of these meetings was for the credit officer to respond to specific queries that arose during .
-
5
10
15
20
25
30
35
40
45
50
25 50 100 150 200 250 300 350
Bo
rro
we
rs
Exposure ( mm)
Exposure Distribution(number of borrowers)
7%
10%
11%
10%
4%11%
17%
16%
14%
Utility
Manufacturing
Construction
Retail & Wholesale Trade
Municipalities
Tourism
Shipping
Investments
Other
Exposure Reviewed by Industry(percentage of total)
68%
32%
Cyprus Greece
Geographic Distribution by Borrower(%)
79%
21%
Performing Non-Performing
Performing vs. Non-Performing by Borrower (%)
BANKING SYSTEM OF CYPRUS | INDEPENDENT DUE DILIGENCE REPORT 72
Credit Analysis Team and Review Process
PIMCO drew on the expertise of its global credit research analysts and developed a bespoke template for the credit assessment. The ratings methodologies were derived in close co-experts to establish the key outcomes of the review process. All loan re-underwriting results were subject to a two-stage review process comprising i) a peer review on site and ii) a final review with a credit committee comprising members from credit research team. In addition to the borrower specific reviews, all results were subject to a final review to ensure consistency of results across all sectors and credits reviewed.
Lending Practices
During the file review process and the interviews with relationship managers and/or credit officers, PIMCO gathered certain information on the PIs lending processes, including:
lending practices and credit underwriting criteria
use of internal ratings
credit monitoring process
approach to challenged credits
Findings on lending processes provided more general insights into business practices and lending criteria at the PIs.
Legal Review
PIMCO appointed external counsel to review the loan documents in both Cyprus and Greece. The loans selected for legal review included both performing and non-performing loans. The appointed counsel reviewed loan files of performing loans to verify the consistency of rights and remedies included in the loan documents. An additional review was carried out on defaulted loans to identify the steps taken since default to mitigate losses, alternatives available to the creditor, key risks to recovery and estimated length of the recovery process.
3.5.1.2 Methodology
The key quantitative outputs of the credit re-underwriting exercise were (i) a credit rating that was translated into a probability of default and (ii) a loss given default (LGD) for each borrower reviewed. In addition, qualitative
loan book and practices was documented. PIMCO used a bespoke template to document the analysis and findings. This ensured that all key data points were reviewed and collected. The following describes the methodology and key assumptions used in the credit rating and LGD assessment.
Credit Rating
The credit rating of each borrower was determined by taking into account both quantitative and qualitative d hotels, energy,
telecommunication, utility, manufacturing, retail, shipping, food and beverage as well as municipalities. The quantitative metrics included leverage, interest coverage, free cash flow, gross profit and EBITDA margins, liquidity ratios and size (e.g., total revenues, total EBITDA). In relation to shipping loans, factors considered for establishing a rating varied from those used for other
industries. Leverage ratio (loan to value), freight rate to expense ratio and chartering terms were among the key
factors considered in assessing the credit quality of these loans.
the thresholds, the ratio levels consistent with a particular rating,
European peers operating in the same industry.
BANKING SYSTEM OF CYPRUS | INDEPENDENT DUE DILIGENCE REPORT 73
The credit assessment also involved establishing historical financial trends and preparing the financial projections
of the borrowers to 2015. The projections were based on a detailed review of the industry and business
characteristics of the borrower, historical financial trends, current financial standing and an assessment of the
dynamics of the borrower in the context of the macroeconomic assumptions for Cyprus and Greece, as provided
by the Steering Committee.
PIMCO assessed the impact of each macroeconomic scenario on the future earnings potential of the business by
focusing on some of the key aspects of the business and the industry, including: cyclicality of the industry,
dependence on domestic trade vs. export orientation, product and customer type and overall industry dynamics.
In addition to the above, for sectors such as shipping that are dependent on the global economic performance,
the outlook for the global economy was also considered. The projection
assessment and were informed by current market conditions and the outlook for the shipping sector.
The main qualitative criteria considered in the corporate review were: industry risk, competitive position, barriers
to entry, product offering, market positioning, business diversification and geographical presence. These factors
were assessed based on discussions with PIMCO industry experts and discussions
Loss Given Default (LGD)
The LGD assessment was generally based on two methods: (i) a peer multiple valuation that valued the
-based valuation that assessed the value of the
e.g., in an asset sale or liquidation scenario).
In relation to shipping loans, the LGD assessment was based on asset valuation. This method was more
appropriate as the majority of the shipping loans reviewed were generally made to borrowers whose sole
business was to own and lease the shipping vessel(s).
The LGD model also took into consideration:
The structural/contractual position of loans in the capital structure.
The estimated exposure amount at the time of default. This was determined by (i) the loan balance and
(ii) the potential for any additional funding the borrower could access up to the time of default.
In rare cases, the value of pledged collateral was included in the peer multiple valuation where the
s.
Peer Multiple Approach
The peer multiple valuation applied an earnings multiple to the projected EBITDA for fiscal year 2012. The choice
of multiple was based on an assessment of the individual business conditions and was informed by European peer
multiples.
guideline. The multiples were adjusted based on what was deemed to be the appropriate multiple for the
business. In deciding the correct adjustment, PIMCO took into account insights into the specific business, size,
industry and the macro environment. Given the small size of many companies, tight liquidity in some cases and
the tough economic environment, a discount was generally warranted to traded peer multiples. Also, in some
cases, higher than average multiples were chosen where it was deemed appropriate to reflect the business reality
of the specific company (e.g., an expected structural (not cyclical) improvement in the coming years).
The Adverse scenario peer multiples were informed by the Base scenario multiple and the range of comparable
peer multiples, and were adjusted downward to reflect reduced earnings potential of the business under the
weaker economic conditions assumed in the Adverse scenario. The adverse effect on earnings potential was
assumptions.
BANKING SYSTEM OF CYPRUS | INDEPENDENT DUE DILIGENCE REPORT 74
Asset-Based Approach
The asset-based method valued business assets, including any additional assets pledged by the borrower. The
specific balance sheet items considered in the valuation include cash and equivalents, accounts receivables,
inventory, property, plant and equipment, listed shares, bonds and other securities. The value assigned to these
assets was also impacted by whether the specific PI had either fixed or floating charges on the asset or whether
it was considered unsecured recoveries, in which case a lower value was assigned.
The asset based method also took into account liquidation costs.
informed by discussions with the members of the recoveries team at the PIs.
A key input in the LGD assessment was the recovery rate on assets.
was based on specific information gathered from the loan file review. In cases where the information on specific
assets or balance sheet items was insufficient to form a reasonable view on the recovery rate for the specific
assets, a general guideline on the recovery rates was used to ensure that the LGD assessment performed by
different credit analysts was consistent and comparable. PIMCO used the Central Bank of Cyprus guidelines
E CALCULATION OF THE
. The guideline was used in few
cases and these were generally not material in terms of the overall LGD assessment. In the Adverse scenario, the
recovery rates were further reduced from the Base scenario.
To form a comprehensive opinion about the asset value of the borrower, PIMCO reviewed financial statements,
estate analyst team was sought where the real estate collateral value was expected to have a material impact on
the LGD results, and available bank valuations were either dated or considered inadequate. Third party
valuations were commissioned on specific critical cases.
The assessment on the value of corporate guarantees was based on the review of the borrower file. Specific
factors considered included: a review of the corporate guarantee documents, the financial standing of the
guarantor, ownership structure, group structure and relationship with the borrower. In relation to government
guarantees, full value was assumed in the Base scenario and no value was assigned in the Adverse scenario (i.e.,
organizations were assessed on a stand-alone basis).
Choice of Approach for LGD Assessment
In deciding which LGD assessment method would be most appropriate, PIMCO considered several aspects
including the business viability and value on a going concern basis, overall state of the specific sector in Cyprus or
Greece, profitability, leverage, liquidity and potential recovery under the asset based approach. Frequently, the
LGD assessment method that yielded higher recovery was chosen, as it was assumed that in recovery, creditors
would seek remedies that result in the highest overall recovery.
In the Adverse scenario, PIMCO selected the appropriate method after taking into consideration similar factors to
those in the Base scenario. Where the going concern of the business was questionable in the Base scenario,
PIMCO typically applied the asset-based approach (i.e., liquidation) in the Adverse scenario.
Time Lag to Liquidation for LGD Assessment
The liquidation time period for each borrowing entity was based on the composition of the collateral supporting
the loan(s). Specific liquidation time assumptions were formed for the main asset categories forming loan
collateral including real estate and shipping vessels.
BANKING SYSTEM OF CYPRUS | INDEPENDENT DUE DILIGENCE REPORT 75
3.5.1.3 Findings
Credit Rating
PIMCO found that the results of our analysis were broadly consistent between Cyprus and Greece. The average
credit quality of the borrowers in both countries was found to be low. The vast majority of loans reviewed
obtained a rating in the B to CCC range, and a large number of non-performing loans were rated D.
The generally low ratings reflect a combination of: (i) high leverage, (ii) liquidity issues with little or negative cash
flow generation, (iii) the relatively small size of businesses, (iv) significant exposure to the Cypriot or Greek market
and the continued weak economic conditions in these economies and (v) low international exposure.
A number of companies reviewed may require some form of restructuring due to (i) low profitability, (ii) low return on assets, (iii) low or negative cash flow generation and (iv) high leverage. In a number of such cases, the PIs had reduced the loan servicing requirements of the borrower by either extending the grace period or lowering the regular repayments. In the absence of these amendments, there would potentially be higher numbers of non-performing loans.
Loss Given Default
LGDs were found to be relatively low. This was particularly the case in Cyprus where lending has been primarily based on collateral with over-collateralization in place for some borrowers. Also, in the Base scenario some borrowers benefit from government guarantees.
LGDs were found to be higher in Greece compared to Cyprus. This was due to a significant decline in the collateral value of a number of borrowers reviewed. The main collateral types encountered in Greece were real estate, investment holdings (shares, other securities) and shipping vessels. Also, based on the borrowers reviewed, unsecured lending appeared to be more common in Greece than in Cyprus.
Underwriting and Credit Practices
The following summarizes some of the main findings in relation to the lending and credit practices at the PIs.
Focus on collateral: Lending decisions were frequently based on collateral coverage rather than the ons.
Focus on security: In addition to collateral, PIs frequently sought personal guarantees and personal assets were pledged as collateral as a further commitment from the borrower to remain in good standing.
Accommodative stance: PIs generally appeared to be accommodative toward borrowers who face significant liquidity issues. A significant number of loans reviewed were being extended beyond contractual maturity.
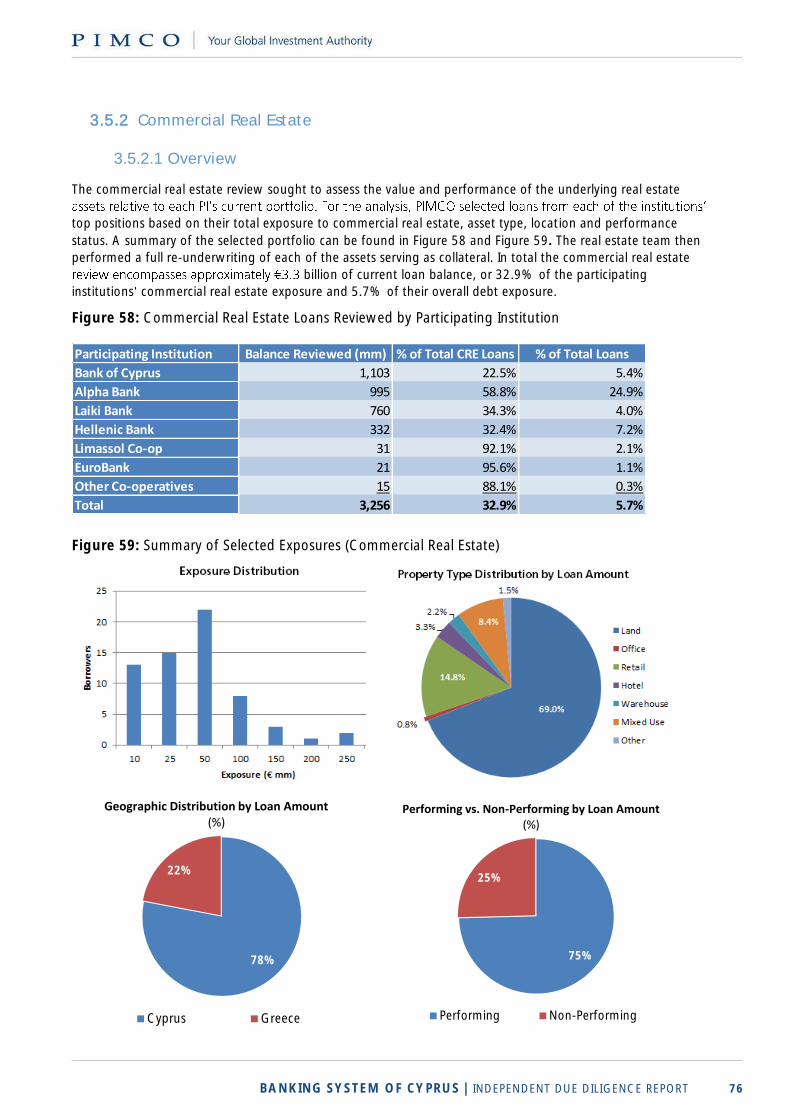
BANKING SYSTEM OF CYPRUS | INDEPENDENT DUE DILIGENCE REPORT 76
3.5.2 Commercial Real Estate
3.5.2.1 Overview
The commercial real estate review sought to assess the value and performance of the underlying real estate
top positions based on their total exposure to commercial real estate, asset type, location and performance
status. A summary of the selected portfolio can be found in Figure 58 and Figure 59. The real estate team then
performed a full re-underwriting of each of the assets serving as collateral. In total the commercial real estate
billion of current loan balance, or 32.9% of the participating
institutions commercial real estate exposure and 5.7% of their overall debt exposure.
Figure 58: Commercial Real Estate Loans Reviewed by Participating Institution
Figure 59: Summary of Selected Exposures (Commercial Real Estate)
Participating Institution Balance Reviewed (mm) % of Total CRE Loans % of Total Loans
Bank of Cyprus 1,103 22.5% 5.4%
Alpha Bank 995 58.8% 24.9%
Laiki Bank 760 34.3% 4.0%
Hellenic Bank 332 32.4% 7.2%
Limassol Co-op 31 92.1% 2.1%
EuroBank 21 95.6% 1.1%
Other Co-operatives 15 88.1% 0.3%
Total 3,256 32.9% 5.7%
78%
22%
Cyprus Greece
Geographic Distribution by Loan Amount(%)
75%
25%
Performing Non-Performing
Performing vs. Non-Performing by Loan Amount (%)
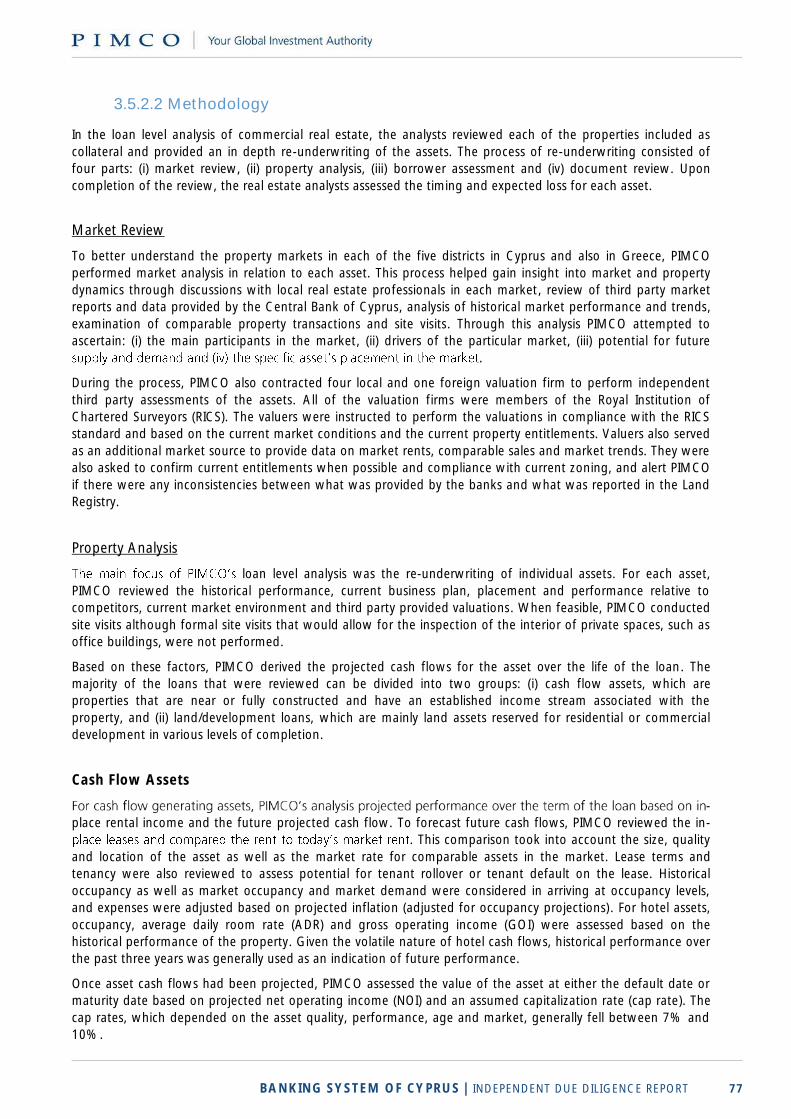
BANKING SYSTEM OF CYPRUS | INDEPENDENT DUE DILIGENCE REPORT 77
3.5.2.2 Methodology
In the loan level analysis of commercial real estate, the analysts reviewed each of the properties included as
collateral and provided an in depth re-underwriting of the assets. The process of re-underwriting consisted of
four parts: (i) market review, (ii) property analysis, (iii) borrower assessment and (iv) document review. Upon
completion of the review, the real estate analysts assessed the timing and expected loss for each asset.
Market Review
To better understand the property markets in each of the five districts in Cyprus and also in Greece, PIMCO
performed market analysis in relation to each asset. This process helped gain insight into market and property
dynamics through discussions with local real estate professionals in each market, review of third party market
reports and data provided by the Central Bank of Cyprus, analysis of historical market performance and trends,
examination of comparable property transactions and site visits. Through this analysis PIMCO attempted to
ascertain: (i) the main participants in the market, (ii) drivers of the particular market, (iii) potential for future
.
During the process, PIMCO also contracted four local and one foreign valuation firm to perform independent
third party assessments of the assets. All of the valuation firms were members of the Royal Institution of
Chartered Surveyors (RICS). The valuers were instructed to perform the valuations in compliance with the RICS
standard and based on the current market conditions and the current property entitlements. Valuers also served
as an additional market source to provide data on market rents, comparable sales and market trends. They were
also asked to confirm current entitlements when possible and compliance with current zoning, and alert PIMCO
if there were any inconsistencies between what was provided by the banks and what was reported in the Land
Registry.
Property Analysis
loan level analysis was the re-underwriting of individual assets. For each asset,
PIMCO reviewed the historical performance, current business plan, placement and performance relative to
competitors, current market environment and third party provided valuations. When feasible, PIMCO conducted
site visits although formal site visits that would allow for the inspection of the interior of private spaces, such as
office buildings, were not performed.
Based on these factors, PIMCO derived the projected cash flows for the asset over the life of the loan. The
majority of the loans that were reviewed can be divided into two groups: (i) cash flow assets, which are
properties that are near or fully constructed and have an established income stream associated with the
property, and (ii) land/development loans, which are mainly land assets reserved for residential or commercial
development in various levels of completion.
Cash Flow Assets
-
place rental income and the future projected cash flow. To forecast future cash flows, PIMCO reviewed the in-
. This comparison took into account the size, quality
and location of the asset as well as the market rate for comparable assets in the market. Lease terms and
tenancy were also reviewed to assess potential for tenant rollover or tenant default on the lease. Historical
occupancy as well as market occupancy and market demand were considered in arriving at occupancy levels,
and expenses were adjusted based on projected inflation (adjusted for occupancy projections). For hotel assets,
occupancy, average daily room rate (ADR) and gross operating income (GOI) were assessed based on the
historical performance of the property. Given the volatile nature of hotel cash flows, historical performance over
the past three years was generally used as an indication of future performance.
Once asset cash flows had been projected, PIMCO assessed the value of the asset at either the default date or
maturity date based on projected net operating income (NOI) and an assumed capitalization rate (cap rate). The
cap rates, which depended on the asset quality, performance, age and market, generally fell between 7% and
10%.
BANKING SYSTEM OF CYPRUS | INDEPENDENT DUE DILIGENCE REPORT 78
PIMCO reviewed the valuations within the loan files provided by the institutions. If the valuation was found to
be older than six months, PIMCO normally requested an updated valuation from one of valuation firms engaged
by PIMCO. Valuations would also be requested for assets where performance information was not as readily
available. PIMCO then projected the value of the asset based on the provided valuation and the appropriate
PIMCO generated property value growth curves (discussed below). This would be compared to the value PIMCO
projected from cash flows to check the reasonableness of the projections.
Land/Development Loans
The majority of the loans reviewed in conjunction with the loan-level modeling were development loans with a
focus on residential development targeted mainly at foreign buyers. To assess the likelihood of success of these
projects, PIMCO made a number of assumptions based on historical performance and the provided macro
scenarios.
The key value drivers of assets in the same market are the state of completion of the project, geographical
location, level of current entitlements and amount and access to available capital for completion. In the analysis
capital needed to complete the project versus the expected recoverable value, the contractual obligations of
both the PIs and the borrower under the loan documents and the expected timing of asset sales.
d, PIMCO assumed that the PIs would continue to support
the project through sell out as the proceeds from selling completed assets to end buyers resulted in the highest
recoverable value. For assets where the property is still in plot form, PIMCO assessed the highest recoverable
value based on either taking the asset through to sell out of the property (including additional capital
requirements) or potentially finding another equity source to come into the project.
Finally, when evaluating agricultural land that was originally earmarked to be developed, PIMCO reviewed the
feasibility of development. In most cases, the assessment was made that the costs associated with developing
the land outweighed the market demand. In these situations, the assets were deemed to be sold off as
agricultural land.
PIMCO enlisted the help of Leaf Research in Cyprus and NAI Global in Greece to project the future value of
commercial real estate and land. Using historical data, the macroeconomic assumptions provided by the Steering
Committee and local market knowledge, forecasts were produced that reflect the expected performance of
these markets.
In Cyprus, curves were generated for plots (developable land), fields (agricultural land), retail, office and
warehouse properties in each of the five districts: Paphos, Nicosia, Limassol, Larnaca and Famagusta. However,
for the commercial property types (office, retail and warehouse), a number of the markets had limited data
points due to low historical transaction volume. For properties where the local market fell into this category,
PIMCO cho c
commercial property types. In Greece, value curves were generated for land, office, retail, industrial and hotel
properties in the Athens, Thessaloniki, Island and Mainland markets.
Borrower Assessment
. This analysis was
designed to understand the ability of the borrower to complete the stated business plan. PIMCO performed a
(i) their ability to access capital, (ii) the amount of cash equity
they have invested in the property and (iii) the total amount of debt relative to their assets to form an opinion on
whether the borrower will be able to execute their plans in the current environment.
performance and real estate experience were also taken into account. Finally, a view was formed on the
creditworthiness of the borrower.
performance of the loan, particularly if the asset is underperforming. PIMCO would also use the borrower
assessment as an opportunity to evaluate any corporate or personal guarantees associated with the loan.
BANKING SYSTEM OF CYPRUS | INDEPENDENT DUE DILIGENCE REPORT 79
Document Review
In the final stage of the analysis, PIMCO reviewed loan documentation; this included a review of loan terms,
covenants, ability for additional claims, and obligations of both the borrower and the lender under the
documents. PIMCO interviewed credit officers and reviewed the historical performance of the loan, including
missed payments, modifications and restructuring, and other factors to understand the current status of the
loan . The expected loan cash flows are then compared to projected asset
performance to assess whether the loan will perform under the documents and to assess the total loan exposure
versus asset value at either an event of default or at loan maturity.
documents in both Cyprus and Greece. The subset of the loans for legal review included both performing and
non-performing loans as well as any loans where, over the course of the review, PIMCO determined additional
review may be necessary. In the case of performing loans, counsel reviewed loan files to ensure that across PIs,
the documentation provided a consistent set of rights and remedies. In the case of defaulted loans or those
requiring additional review, in addition to the above described review, counsel was requested to review the
current status of the loan and recovery steps taken since default to date, and identify any legal remedies
available to the creditor, key risks to recovery and an associated timeline for resolution.
3.5.2.3 Findings
During the course of the review, PIMCO noted a number of trends across institutions. Below PIMCO has listed
some of the more prevalent trends to provide insight into the credit profile of the CRE.
Large exposure to development loans: billion of
exposure to residential development, accounting for 69% of reviewed CRE exposure.
Both borrowers and lenders appear to be slow to adapt to a downturn: From conversations with
both the credit officers and developers, neither of the parties has adapted their business plans to adjust
current consensus.
Lenders have been more likely to modify than to impair a loan: Due to
approach, lenders have tended to modify loans rather than to move forward with recovering on the
collateral. In development loans, it was not uncommon to see modifications to capitalize interest for an
extended period of time. Interest rates on these loans tended to be in the 5%-9% range. Considering
the fall in real estate prices and the current rate at which the loans are accruing interest, real estate
values would have to see significant growth in the future in order for the PIs to recover the entire loan
amount.
Institutions lent on 100% of open market value ( OMV ): Institutions lent on 100% of OMV at
the height of the market. Additionally, a number of the valuations were made on the assumption that
the development rights were in place, overstating the OMV. As asset prices have fallen and
development has slowed, these loans are now well under-collateralized.
Related party loans are common: It is not uncommon for the largest exposure at the PIs to be made
to related parties.
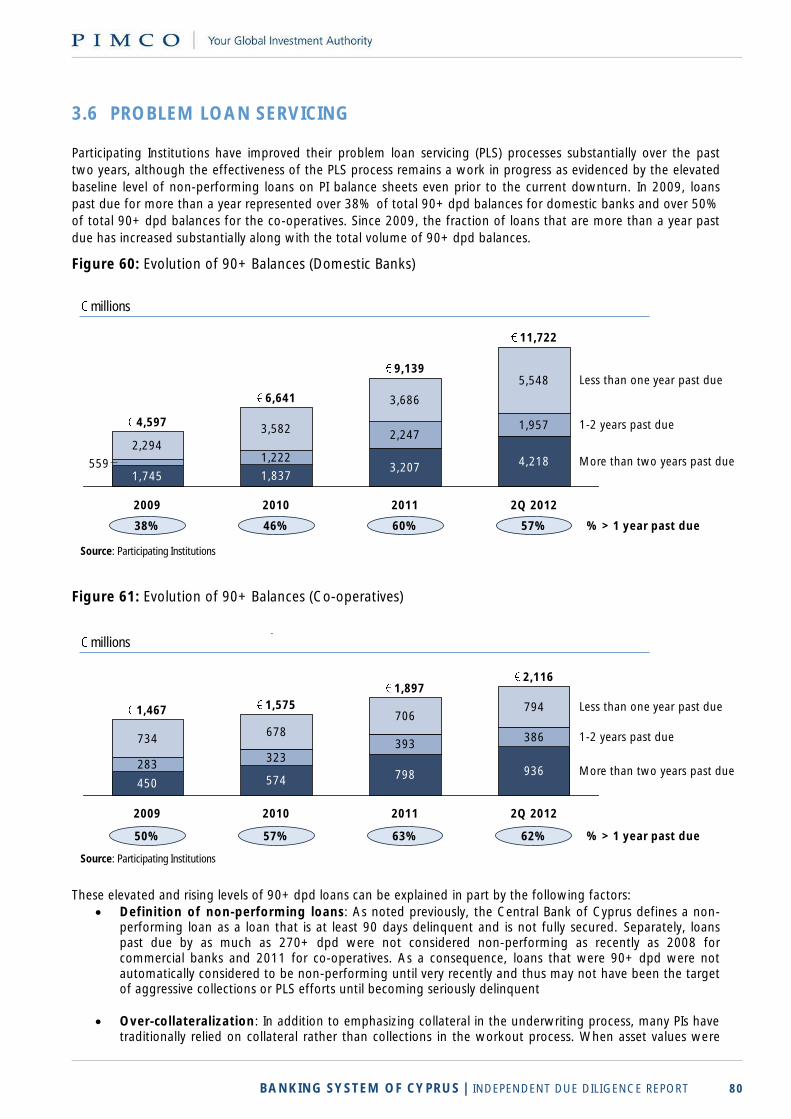
BANKING SYSTEM OF CYPRUS | INDEPENDENT DUE DILIGENCE REPORT 80
3.6 PROBLEM LOAN SERVICING
Participating Institutions have improved their problem loan servicing (PLS) processes substantially over the past
two years, although the effectiveness of the PLS process remains a work in progress as evidenced by the elevated
baseline level of non-performing loans on PI balance sheets even prior to the current downturn. In 2009, loans
past due for more than a year represented over 38% of total 90+ dpd balances for domestic banks and over 50%
of total 90+ dpd balances for the co-operatives. Since 2009, the fraction of loans that are more than a year past
due has increased substantially along with the total volume of 90+ dpd balances.
Figure 60: Evolution of 90+ Balances (Domestic Banks)
Figure 61: Evolution of 90+ Balances (Co-operatives)
These elevated and rising levels of 90+ dpd loans can be explained in part by the following factors:
Definition of non-performing loans: As noted previously, the Central Bank of Cyprus defines a non-performing loan as a loan that is at least 90 days delinquent and is not fully secured. Separately, loans past due by as much as 270+ dpd were not considered non-performing as recently as 2008 for commercial banks and 2011 for co-operatives. As a consequence, loans that were 90+ dpd were not automatically considered to be non-performing until very recently and thus may not have been the target of aggressive collections or PLS efforts until becoming seriously delinquent
Over-collateralization: In addition to emphasizing collateral in the underwriting process, many PIs have traditionally relied on collateral rather than collections in the workout process. When asset values were
Evolution of 90+ balances (Domestic Banks)millions
1,222
2,2471,957
2,294
3,582
3,686
5,548
559
11,722
2Q 2012
1-2 years past due
3,207
2011
9,139Less than one year past due
More than two years past due4,218
2010
6,641
1,837
2009
4,597
1,745
% > 1 year past due57%60%46%38%
Source: Participating Institutions
Evolution of 90+ balances (Co-operatives)millions
283323
393386734
678
706794
More than two years past due
1-2 years past due
Less than one year past due
2Q 2012
2,116
936
2011
1,897
798
2010
1,575
574
2009
1,467
450
% > 1 year past due62%63%57%50%
Source: Participating Institutions

BANKING SYSTEM OF CYPRUS | INDEPENDENT DUE DILIGENCE REPORT 81
rising, this served as an additional source of profitability because past due interest was capitalized at a higher penalty rate (>9%) and PIs generally recovered the full amount of arrears either in the form of payment or when the property was sold at a profit.
Long recovery timelines: The extensive administrative and legal hurdles that PIs face in liquidating collateral in Cyprus shift the balance of power to borrowers in most workout situations because borrowers can afford to remain delinquent for a long time with limited consequences. As a matter of
-delinquent borrowers to pay or have opted for protracted negotiations rather than enduring the legal path.
Borrower payment holidays: Certain PIs, particularly the co-operatives, traditionally offered that enabled borrowers to miss up to two monthly installments each year without penalty. Such
payment holidays were not a contractual feature of the loans, so missed payments have resulted in a
build-up of arrears based on the 90+ dpd delinquency definition11. Although PIs no longer allow payment holidays, many borrowers continue to feel entitled to miss payments occasionally.
Due to their larger size and international operations, PLS workout processes are more advanced among the domestic banks, with established collections departments and procedures to deal with borrowers in each of the various delinquency stages. In addition to the requisite monitoring and processing, collection efforts among the domestic banks aim to exert pressure on delinquent borrowers not only during early and mid-stage arrears, but also when loans have been transferred to a specialized recoveries business unit and after legal proceedings are in process. Key challenges for both the domestic banks and co-operatives relate to the lack of a single centralized borrower credit database, limited ability to monitor or enforce personal guarantees, cultural aversion to aggressive collections practices and the limited variety of treatment options available.
3.6.1 Credit Bureau Information
Cyprus lacks a centralized credit bureau. Co-operatives and domestic banks each report to separate credit-
reporting agencies. For commercial banks, the Artemis credit bureau was set up in late 2008 and provides data
only for loans that have entered the legal recovery process (e.g., decisions on collections issued by courts,
bankruptcies and dissolution of companies); however, Artemis does not keep data on delinquencies that are not
in legal process or on the total loans outstanding per person or corporate entity. Since co-operatives do not
participate in Artemis, there is potentially room for arbitrage: A borrower defaulting on a loan to a bank could
obtain a loan from a co-operative (and vice-versa) potentially even using the proceeds from the new loan to pay
off the outstanding delinquent balance. There are ongoing discussions in Cyprus to include co-operatives and
banks in Artemis and to expand the information that is recorded.
Participating Institutions can check the national land registry for outstanding debts by a borrower upon
application for credit; however, the national land registry only holds information on secured mortgage debt, so
many forms of debt are not reported. In addition, a borrower may keep multiple relations with different
institutions and may shift or add debt across institutions over time. Such actions are difficult for PIs to track under
the current system.
3.6.2 Loan Guarantees
A common PLS practice for Participating Institutions in both Cyprus and Greece is to secure additional collateral or add additional guarantees as part of a restructuring. Such guarantees generally improve the collateral position of the PI because each guarantee carries joint and several liabilities.
11 PIMCO has calibrated its default models so that infrequent payment holidays taken by otherwise creditworthy borrowers do not increase
expected losses.
BANKING SYSTEM OF CYPRUS | INDEPENDENT DUE DILIGENCE REPORT 82
Aside from cash collateral, legal mortgages and pledge of listed securities, common guarantees are:
Personal guarantees, given by individuals to other individuals or company liabilities. Personal guarantees are common from family members or from professional colleagues
Corporate guarantees, given to either individuals or company liabilities
Government guarantees, usually provided by the government to companies
Letters of comfort/intent, typically given from a parent company to its subsidiary
Bank guarantees
At present, there is no credit bureau registry for guarantors, so their contingent liability is not considered when they either seek a loan for themselves or become guarantors for another borrower. This inability to track the contingent liability of guarantors increases the challenge of assessing the value of any personal guarantee.
3.6.3 Loan Restructuring
Banks and co-operatives have had an increasingly active policy of rescheduling or modifying loans for customers
with financial difficulties in order to avert defaults and to keep borrowers engaged. Loans can be rescheduled
either when borrowers are already delinquent, or proactively during pre-delinquency for at-risk borrowers.
Rescheduling guidelines were established by the Central Bank of Cyprus in 2009, and consistent records on
rescheduling are available starting in 2010. Based on this regulation, a 90+ dpd loan that is rescheduled must
remain current for six months in order to be re-classified as a performing loan. Common types of rescheduling
and modifications include maturity extension and/or reduction of installments, extension of grace period, payment
holidays, forgiveness of overdue payments, closure of the existing loan and reopening of a new loan with
additional covenants, and increasing the loan size to cover balances in arrears. The following summarizes the
general hierarchy of modifications in practice, as outlined by Participating Institutions.
Domestic Banks:
1. Maturity extension: Extensions can get to maturities of up to 40 years for mortgages and 15 years for
consumer loans. Banks may seek additional collateral
2. Extension of grace period and payment holidays: Available for extensions of up to 36 months. Granted
to retail clients in extreme, but temporary, difficulty in servicing a loan (e.g., unemployment or illness). This
type of modification is common for loans to construction / development companies
3. Forgiveness of arrears overdues: Several institutions indicated that they do not offer forgiveness, while
others recorded it as a common practice as part of a restructuring
4. Closing of a loan and re-opening of a new loan with adjusted terms: Generally used to consolidate old
loans but also to renew terms for borrowers with difficulties (e.g., rate reduction, extension)
5. Increase in size of loan: Available for revolving retail and SME loans to cover overdues
Co-operatives:
1. Payment holidays: Although payment holidays are less common today, this still represents a common
practice among co-operatives for borrowers with extreme, but temporary, difficulties. In the past, payment
holidays were a standard practice for all borrowers even without evidence of economic hardship. Payment
holidays are mostly granted for secured mortgage loans.
2. Closing of a loan and re-opening of a new loan with adjusted terms: As part of a rescheduling, co-
operatives often close the old loan and create a new loan with adjusted terms and potentially with additional
collateral or a guarantee (e.g., the new loan must have an effective LTV ratio similar to other new loans).
Participating Institutions reported that the eligibility criteria for granting a rescheduling is that the borrower is viable or can become viable with the proposed restructuring; however, PIMCO noted instances where modifications appeared to have been granted to borrowers with persistent inability to pay. It is clear that rescheduling eligibility remains subjective. For example, banks may have granted long term modifications to real estate development loans that were not sustainable under current market conditions. For co-operatives, the common practice of closing a loan and re-opening a new one may conceal a loss of economic value.
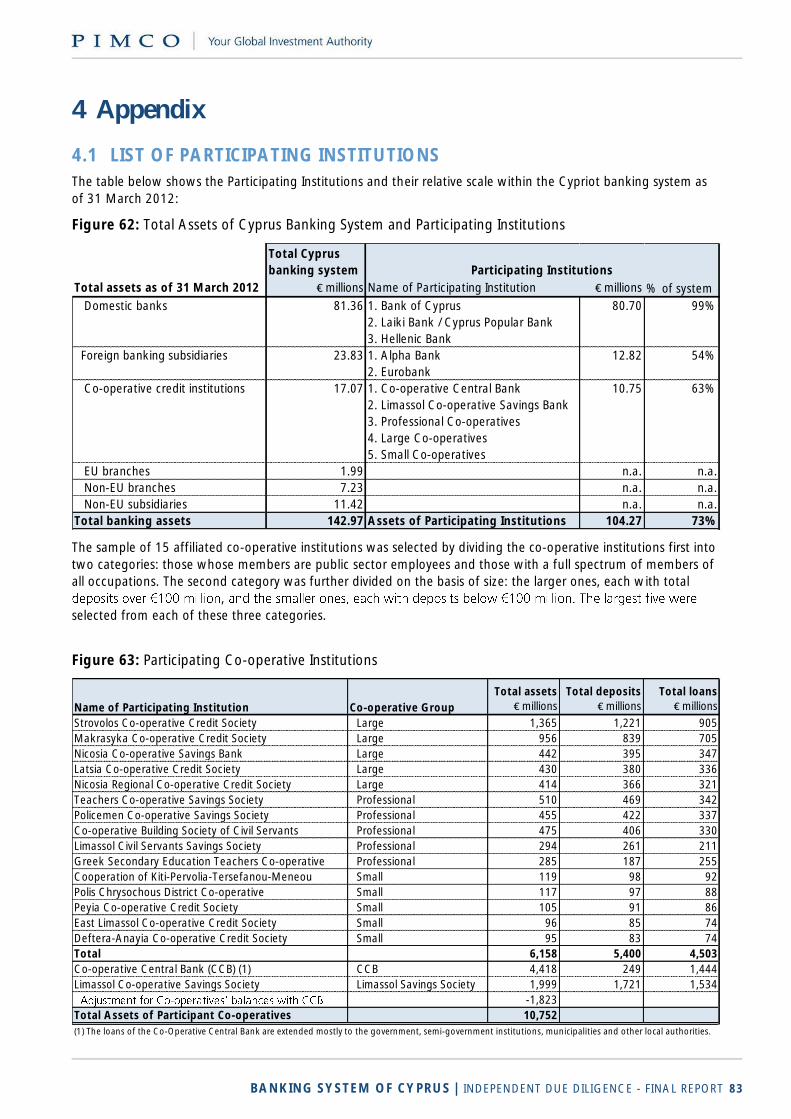
BANKING SYSTEM OF CYPRUS | INDEPENDENT DUE DILIGENCE - FINAL REPORT 83
4 Appendix
4.1 LIST OF PARTICIPATING INSTITUTIONS
The table below shows the Participating Institutions and their relative scale within the Cypriot banking system as
of 31 March 2012:
Figure 62: Total Assets of Cyprus Banking System and Participating Institutions
The sample of 15 affiliated co-operative institutions was selected by dividing the co-operative institutions first into
two categories: those whose members are public sector employees and those with a full spectrum of members of
all occupations. The second category was further divided on the basis of size: the larger ones, each with total
,
selected from each of these three categories.
Figure 63: Participating Co-operative Institutions
Total Cyprus
banking system
Total assets as of 31 March 2012 € millions Name of Participating Institution € millions % of system
Domestic banks 81.36 1. Bank of Cyprus
2. Laiki Bank / Cyprus Popular Bank
3. Hellenic Bank
80.70 99%
Foreign banking subsidiaries 23.83 1. Alpha Bank
2. Eurobank
12.82 54%
Co-operative credit institutions 17.07 1. Co-operative Central Bank
2. Limassol Co-operative Savings Bank
3. Professional Co-operatives
4. Large Co-operatives
5. Small Co-operatives
10.75 63%
EU branches 1.99 n.a. n.a.
Non-EU branches 7.23 n.a. n.a.
Non-EU subsidiaries 11.42 n.a. n.a.
Total banking assets 142.97 Assets of Participating Institutions 104.27 73%
Participating Institutions
Total assets Total deposits Total loans
€ millions € millions € millions
Strovolos Co-operative Credit Society Large 1,365 1,221 905
Makrasyka Co-operative Credit Society Large 956 839 705
Nicosia Co-operative Savings Bank Large 442 395 347
Latsia Co-operative Credit Society Large 430 380 336
Nicosia Regional Co-operative Credit Society Large 414 366 321
Teachers Co-operative Savings Society Professional 510 469 342
Policemen Co-operative Savings Society Professional 455 422 337
Co-operative Building Society of Civil Servants Professional 475 406 330
Limassol Civil Servants Savings Society Professional 294 261 211
Greek Secondary Education Teachers Co-operative Professional 285 187 255
Cooperation of Kiti-Pervolia-Tersefanou-Meneou Small 119 98 92
Polis Chrysochous District Co-operative Small 117 97 88
Peyia Co-operative Credit Society Small 105 91 86
East Limassol Co-operative Credit Society Small 96 85 74
Deftera-Anayia Co-operative Credit Society Small 95 83 74
Total 6,158 5,400 4,503
Co-operative Central Bank (CCB) (1) CCB 4,418 249 1,444
Limassol Co-operative Savings Society Limassol Savings Society 1,999 1,721 1,534
-1,823
Total Assets of Participant Co-operatives 10,752
(1) The loans of the Co-Operative Central Bank are extended mostly to the government, semi-government institutions, municipalities and other local authorities.
Name of Participating Institution Co-operative Group
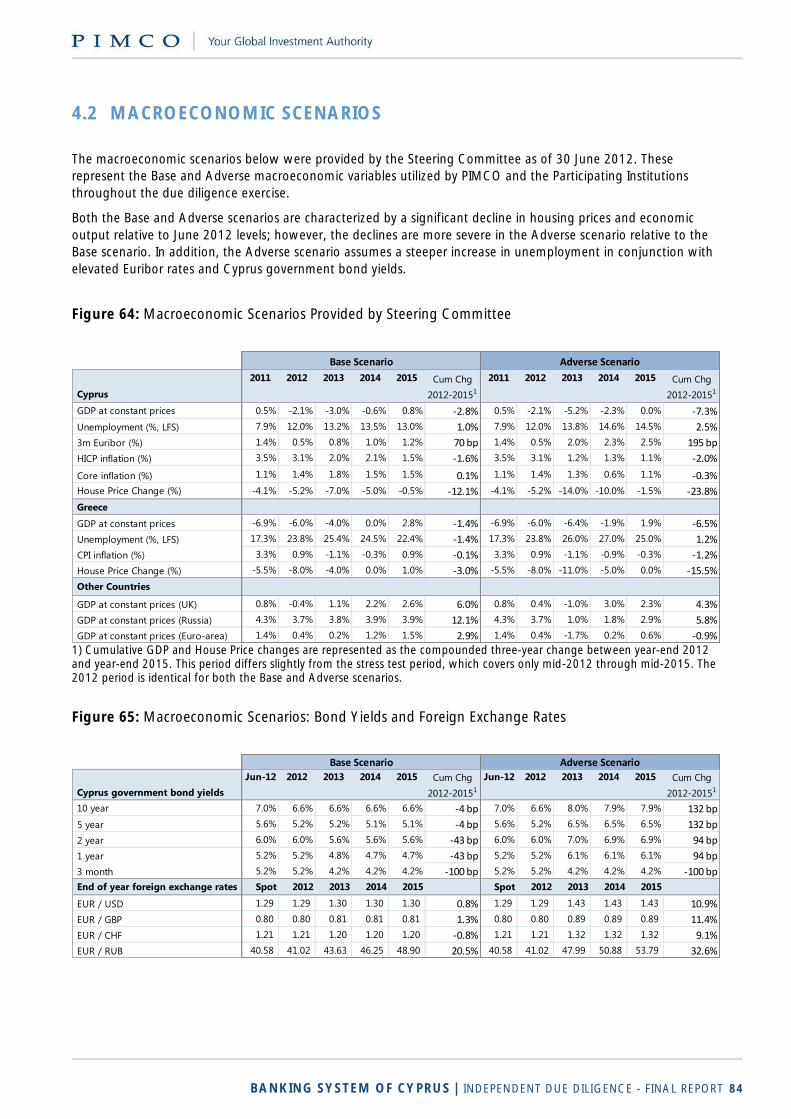
BANKING SYSTEM OF CYPRUS | INDEPENDENT DUE DILIGENCE - FINAL REPORT 84
4.2 MACROECONOMIC SCENARIOS
The macroeconomic scenarios below were provided by the Steering Committee as of 30 June 2012. These
represent the Base and Adverse macroeconomic variables utilized by PIMCO and the Participating Institutions
throughout the due diligence exercise.
Both the Base and Adverse scenarios are characterized by a significant decline in housing prices and economic
output relative to June 2012 levels; however, the declines are more severe in the Adverse scenario relative to the
Base scenario. In addition, the Adverse scenario assumes a steeper increase in unemployment in conjunction with
elevated Euribor rates and Cyprus government bond yields.
Figure 64: Macroeconomic Scenarios Provided by Steering Committee
1) Cumulative GDP and House Price changes are represented as the compounded three-year change between year-end 2012 and year-end 2015. This period differs slightly from the stress test period, which covers only mid-2012 through mid-2015. The 2012 period is identical for both the Base and Adverse scenarios.
Figure 65: Macroeconomic Scenarios: Bond Yields and Foreign Exchange Rates
2011 2012 2013 2014 2015 2011 2012 2013 2014 2015
Cyprus
GDP at constant prices 0.5% -2.1% -3.0% -0.6% 0.8% -2.8% 0.5% -2.1% -5.2% -2.3% 0.0% -7.3%
Unemployment (%, LFS) 7.9% 12.0% 13.2% 13.5% 13.0% 1.0% 7.9% 12.0% 13.8% 14.6% 14.5% 2.5%
3m Euribor (%) 1.4% 0.5% 0.8% 1.0% 1.2% 70 bp 1.4% 0.5% 2.0% 2.3% 2.5% 195 bp
HICP inflation (%) 3.5% 3.1% 2.0% 2.1% 1.5% -1.6% 3.5% 3.1% 1.2% 1.3% 1.1% -2.0%
Core inflation (%) 1.1% 1.4% 1.8% 1.5% 1.5% 0.1% 1.1% 1.4% 1.3% 0.6% 1.1% -0.3%
House Price Change (%) -4.1% -5.2% -7.0% -5.0% -0.5% -12.1% -4.1% -5.2% -14.0% -10.0% -1.5% -23.8%
Greece
GDP at constant prices -6.9% -6.0% -4.0% 0.0% 2.8% -1.4% -6.9% -6.0% -6.4% -1.9% 1.9% -6.5%
Unemployment (%, LFS) 17.3% 23.8% 25.4% 24.5% 22.4% -1.4% 17.3% 23.8% 26.0% 27.0% 25.0% 1.2%
CPI inflation (%) 3.3% 0.9% -1.1% -0.3% 0.9% -0.1% 3.3% 0.9% -1.1% -0.9% -0.3% -1.2%
House Price Change (%) -5.5% -8.0% -4.0% 0.0% 1.0% -3.0% -5.5% -8.0% -11.0% -5.0% 0.0% -15.5%
Other Countries
GDP at constant prices (UK) 0.8% -0.4% 1.1% 2.2% 2.6% 6.0% 0.8% 0.4% -1.0% 3.0% 2.3% 4.3%
GDP at constant prices (Russia) 4.3% 3.7% 3.8% 3.9% 3.9% 12.1% 4.3% 3.7% 1.0% 1.8% 2.9% 5.8%
GDP at constant prices (Euro-area) 1.4% 0.4% 0.2% 1.2% 1.5% 2.9% 1.4% 0.4% -1.7% 0.2% 0.6% -0.9%
Base Scenario Adverse Scenario
Cum Chg
2012-20151
Cum Chg
2012-20151
Jun-12 2012 2013 2014 2015 Jun-12 2012 2013 2014 2015
Cyprus government bond yields
10 year 7.0% 6.6% 6.6% 6.6% 6.6% -4 bp 7.0% 6.6% 8.0% 7.9% 7.9% 132 bp
5 year 5.6% 5.2% 5.2% 5.1% 5.1% -4 bp 5.6% 5.2% 6.5% 6.5% 6.5% 132 bp
2 year 6.0% 6.0% 5.6% 5.6% 5.6% -43 bp 6.0% 6.0% 7.0% 6.9% 6.9% 94 bp
1 year 5.2% 5.2% 4.8% 4.7% 4.7% -43 bp 5.2% 5.2% 6.1% 6.1% 6.1% 94 bp
3 month 5.2% 5.2% 4.2% 4.2% 4.2% -100 bp 5.2% 5.2% 4.2% 4.2% 4.2% -100 bp
End of year foreign exchange rates Spot 2012 2013 2014 2015 Spot 2012 2013 2014 2015
EUR / USD 1.29 1.29 1.30 1.30 1.30 0.8% 1.29 1.29 1.43 1.43 1.43 10.9%
EUR / GBP 0.80 0.80 0.81 0.81 0.81 1.3% 0.80 0.80 0.89 0.89 0.89 11.4%
EUR / CHF 1.21 1.21 1.20 1.20 1.20 -0.8% 1.21 1.21 1.32 1.32 1.32 9.1%
EUR / RUB 40.58 41.02 43.63 46.25 48.90 20.5% 40.58 41.02 47.99 50.88 53.79 32.6%
Base Scenario Adverse Scenario
Cum Chg
2012-20151
Cum Chg
2012-20151
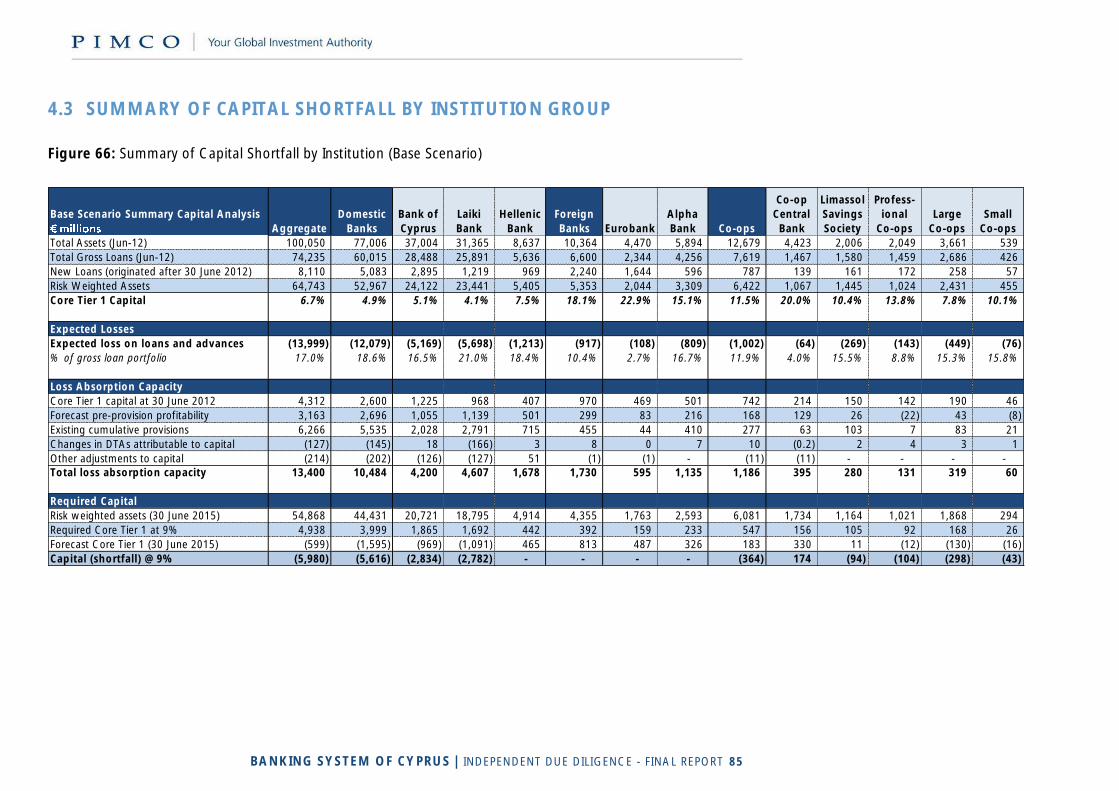
BANKING SYSTEM OF CYPRUS | INDEPENDENT DUE DILIGENCE - FINAL REPORT 85
4.3 SUMMARY OF CAPITAL SHORTFALL BY INSTITUTION GROUP
Figure 66: Summary of Capital Shortfall by Institution (Base Scenario)
Base Scenario Summary Capital Analysis
Aggregate
Domestic
Banks
Bank of
Cyprus
Laiki
Bank
Hellenic
Bank
Foreign
Banks Eurobank
Alpha
Bank Co-ops
Co-op
Central
Bank
Limassol
Savings
Society
Profess-
ional
Co-ops
Large
Co-ops
Small
Co-ops
Total Assets (Jun-12) 100,050 77,006 37,004 31,365 8,637 10,364 4,470 5,894 12,679 4,423 2,006 2,049 3,661 539
Total Gross Loans (Jun-12) 74,235 60,015 28,488 25,891 5,636 6,600 2,344 4,256 7,619 1,467 1,580 1,459 2,686 426
New Loans (originated after 30 June 2012) 8,110 5,083 2,895 1,219 969 2,240 1,644 596 787 139 161 172 258 57
Risk Weighted Assets 64,743 52,967 24,122 23,441 5,405 5,353 2,044 3,309 6,422 1,067 1,445 1,024 2,431 455
Core Tier 1 Capital 6.7% 4.9% 5.1% 4.1% 7.5% 18.1% 22.9% 15.1% 11.5% 20.0% 10.4% 13.8% 7.8% 10.1%
Expected Losses
Expected loss on loans and advances (13,999) (12,079) (5,169) (5,698) (1,213) (917) (108) (809) (1,002) (64) (269) (143) (449) (76)
% of gross loan portfolio 17.0% 18.6% 16.5% 21.0% 18.4% 10.4% 2.7% 16.7% 11.9% 4.0% 15.5% 8.8% 15.3% 15.8%
Loss Absorption Capacity
Core Tier 1 capital at 30 June 2012 4,312 2,600 1,225 968 407 970 469 501 742 214 150 142 190 46
Forecast pre-provision profitability 3,163 2,696 1,055 1,139 501 299 83 216 168 129 26 (22) 43 (8)
Existing cumulative provisions 6,266 5,535 2,028 2,791 715 455 44 410 277 63 103 7 83 21
Changes in DTAs attributable to capital (127) (145) 18 (166) 3 8 0 7 10 (0.2) 2 4 3 1
Other adjustments to capital (214) (202) (126) (127) 51 (1) (1) - (11) (11) - - - - Total loss absorption capacity 13,400 10,484 4,200 4,607 1,678 1,730 595 1,135 1,186 395 280 131 319 60
Required Capital
Risk weighted assets (30 June 2015) 54,868 44,431 20,721 18,795 4,914 4,355 1,763 2,593 6,081 1,734 1,164 1,021 1,868 294
Required Core Tier 1 at 9% 4,938 3,999 1,865 1,692 442 392 159 233 547 156 105 92 168 26
Forecast Core Tier 1 (30 June 2015) (599) (1,595) (969) (1,091) 465 813 487 326 183 330 11 (12) (130) (16)
Capital (shortfall) @ 9% (5,980) (5,616) (2,834) (2,782) - - - - (364) 174 (94) (104) (298) (43)
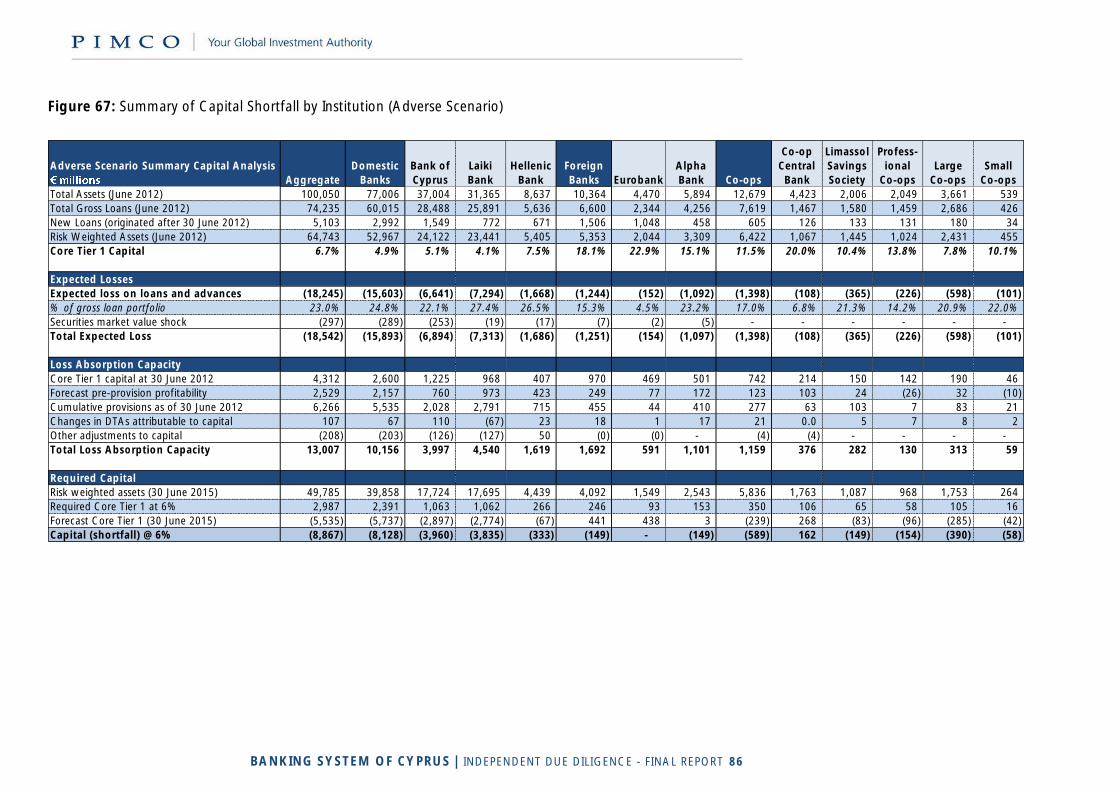
BANKING SYSTEM OF CYPRUS | INDEPENDENT DUE DILIGENCE - FINAL REPORT 86
Figure 67: Summary of Capital Shortfall by Institution (Adverse Scenario)
Adverse Scenario Summary Capital Analysis
Aggregate
Domestic
Banks
Bank of
Cyprus
Laiki
Bank
Hellenic
Bank
Foreign
Banks Eurobank
Alpha
Bank Co-ops
Co-op
Central
Bank
Limassol
Savings
Society
Profess-
ional
Co-ops
Large
Co-ops
Small
Co-ops
Total Assets (June 2012) 100,050 77,006 37,004 31,365 8,637 10,364 4,470 5,894 12,679 4,423 2,006 2,049 3,661 539
Total Gross Loans (June 2012) 74,235 60,015 28,488 25,891 5,636 6,600 2,344 4,256 7,619 1,467 1,580 1,459 2,686 426
New Loans (originated after 30 June 2012) 5,103 2,992 1,549 772 671 1,506 1,048 458 605 126 133 131 180 34
Risk Weighted Assets (June 2012) 64,743 52,967 24,122 23,441 5,405 5,353 2,044 3,309 6,422 1,067 1,445 1,024 2,431 455
Core Tier 1 Capital 6.7% 4.9% 5.1% 4.1% 7.5% 18.1% 22.9% 15.1% 11.5% 20.0% 10.4% 13.8% 7.8% 10.1%
Expected Losses
Expected loss on loans and advances (18,245) (15,603) (6,641) (7,294) (1,668) (1,244) (152) (1,092) (1,398) (108) (365) (226) (598) (101)
% of gross loan portfolio 23.0% 24.8% 22.1% 27.4% 26.5% 15.3% 4.5% 23.2% 17.0% 6.8% 21.3% 14.2% 20.9% 22.0%
Securities market value shock (297) (289) (253) (19) (17) (7) (2) (5) - - - - - -
Total Expected Loss (18,542) (15,893) (6,894) (7,313) (1,686) (1,251) (154) (1,097) (1,398) (108) (365) (226) (598) (101)
Loss Absorption Capacity
Core Tier 1 capital at 30 June 2012 4,312 2,600 1,225 968 407 970 469 501 742 214 150 142 190 46
Forecast pre-provision profitability 2,529 2,157 760 973 423 249 77 172 123 103 24 (26) 32 (10)
Cumulative provisions as of 30 June 2012 6,266 5,535 2,028 2,791 715 455 44 410 277 63 103 7 83 21
Changes in DTAs attributable to capital 107 67 110 (67) 23 18 1 17 21 0.0 5 7 8 2
Other adjustments to capital (208) (203) (126) (127) 50 (0) (0) - (4) (4) - - - -
Total Loss Absorption Capacity 13,007 10,156 3,997 4,540 1,619 1,692 591 1,101 1,159 376 282 130 313 59
Required Capital
Risk weighted assets (30 June 2015) 49,785 39,858 17,724 17,695 4,439 4,092 1,549 2,543 5,836 1,763 1,087 968 1,753 264
Required Core Tier 1 at 6% 2,987 2,391 1,063 1,062 266 246 93 153 350 106 65 58 105 16
Forecast Core Tier 1 (30 June 2015) (5,535) (5,737) (2,897) (2,774) (67) 441 438 3 (239) 268 (83) (96) (285) (42)
Capital (shortfall) @ 6% (8,867) (8,128) (3,960) (3,835) (333) (149) - (149) (589) 162 (149) (154) (390) (58)
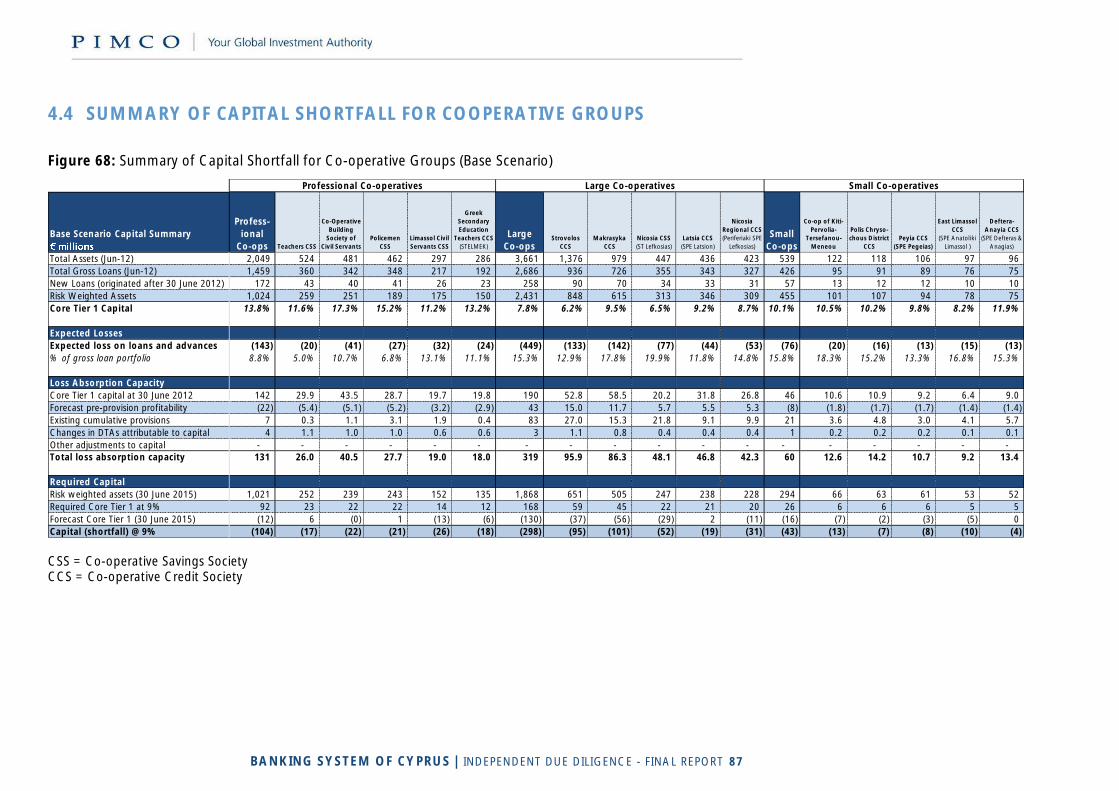
BANKING SYSTEM OF CYPRUS | INDEPENDENT DUE DILIGENCE - FINAL REPORT 87
4.4 SUMMARY OF CAPITAL SHORTFALL FOR COOPERATIVE GROUPS
Figure 68: Summary of Capital Shortfall for Co-operative Groups (Base Scenario)
CSS = Co-operative Savings Society CCS = Co-operative Credit Society
Base Scenario Capital Summary
Profess-
ional
Co-ops Teachers CSS
Co-Operative
Building
Society of
Civil Servants
Policemen
CSS
Limassol Civil
Servants CSS
Greek
Secondary
Education
Teachers CCS
(STELMEK)
Large
Co-opsStrovolos
CCS
Makrasyka
CCS
Nicosia CSS
(ST Lefkosias)
Latsia CCS
(SPE Latsion)
Nicosia
Regional CCS
(Periferiaki SPE
Lefkosias)
Small
Co-ops
Co-op of Kiti-
Pervolia-
Tersefanou-
Meneou
Polis Chryso-
chous District
CCS
Peyia CCS
(SPE Pegeias)
East Limassol
CCS
(SPE Anatoliki
Limassol )
Deftera-
Anayia CCS
(SPE Defteras &
Anagias)
Total Assets (Jun-12) 2,049 524 481 462 297 286 3,661 1,376 979 447 436 423 539 122 118 106 97 96
Total Gross Loans (Jun-12) 1,459 360 342 348 217 192 2,686 936 726 355 343 327 426 95 91 89 76 75
New Loans (originated after 30 June 2012) 172 43 40 41 26 23 258 90 70 34 33 31 57 13 12 12 10 10
Risk Weighted Assets 1,024 259 251 189 175 150 2,431 848 615 313 346 309 455 101 107 94 78 75
Core Tier 1 Capital 13.8% 11.6% 17.3% 15.2% 11.2% 13.2% 7.8% 6.2% 9.5% 6.5% 9.2% 8.7% 10.1% 10.5% 10.2% 9.8% 8.2% 11.9%
Expected Losses
Expected loss on loans and advances (143) (20) (41) (27) (32) (24) (449) (133) (142) (77) (44) (53) (76) (20) (16) (13) (15) (13)
% of gross loan portfolio 8.8% 5.0% 10.7% 6.8% 13.1% 11.1% 15.3% 12.9% 17.8% 19.9% 11.8% 14.8% 15.8% 18.3% 15.2% 13.3% 16.8% 15.3%
Loss Absorption Capacity
Core Tier 1 capital at 30 June 2012 142 29.9 43.5 28.7 19.7 19.8 190 52.8 58.5 20.2 31.8 26.8 46 10.6 10.9 9.2 6.4 9.0
Forecast pre-provision profitability (22) (5.4) (5.1) (5.2) (3.2) (2.9) 43 15.0 11.7 5.7 5.5 5.3 (8) (1.8) (1.7) (1.7) (1.4) (1.4)
Existing cumulative provisions 7 0.3 1.1 3.1 1.9 0.4 83 27.0 15.3 21.8 9.1 9.9 21 3.6 4.8 3.0 4.1 5.7
Changes in DTAs attributable to capital 4 1.1 1.0 1.0 0.6 0.6 3 1.1 0.8 0.4 0.4 0.4 1 0.2 0.2 0.2 0.1 0.1
Other adjustments to capital - - - - - - - - - - - - - - - - - - Total loss absorption capacity 131 26.0 40.5 27.7 19.0 18.0 319 95.9 86.3 48.1 46.8 42.3 60 12.6 14.2 10.7 9.2 13.4
Required Capital
Risk weighted assets (30 June 2015) 1,021 252 239 243 152 135 1,868 651 505 247 238 228 294 66 63 61 53 52
Required Core Tier 1 at 9% 92 23 22 22 14 12 168 59 45 22 21 20 26 6 6 6 5 5
Forecast Core Tier 1 (30 June 2015) (12) 6 (0) 1 (13) (6) (130) (37) (56) (29) 2 (11) (16) (7) (2) (3) (5) 0
Capital (shortfall) @ 9% (104) (17) (22) (21) (26) (18) (298) (95) (101) (52) (19) (31) (43) (13) (7) (8) (10) (4)
Professional Co-operatives Large Co-operatives Small Co-operatives
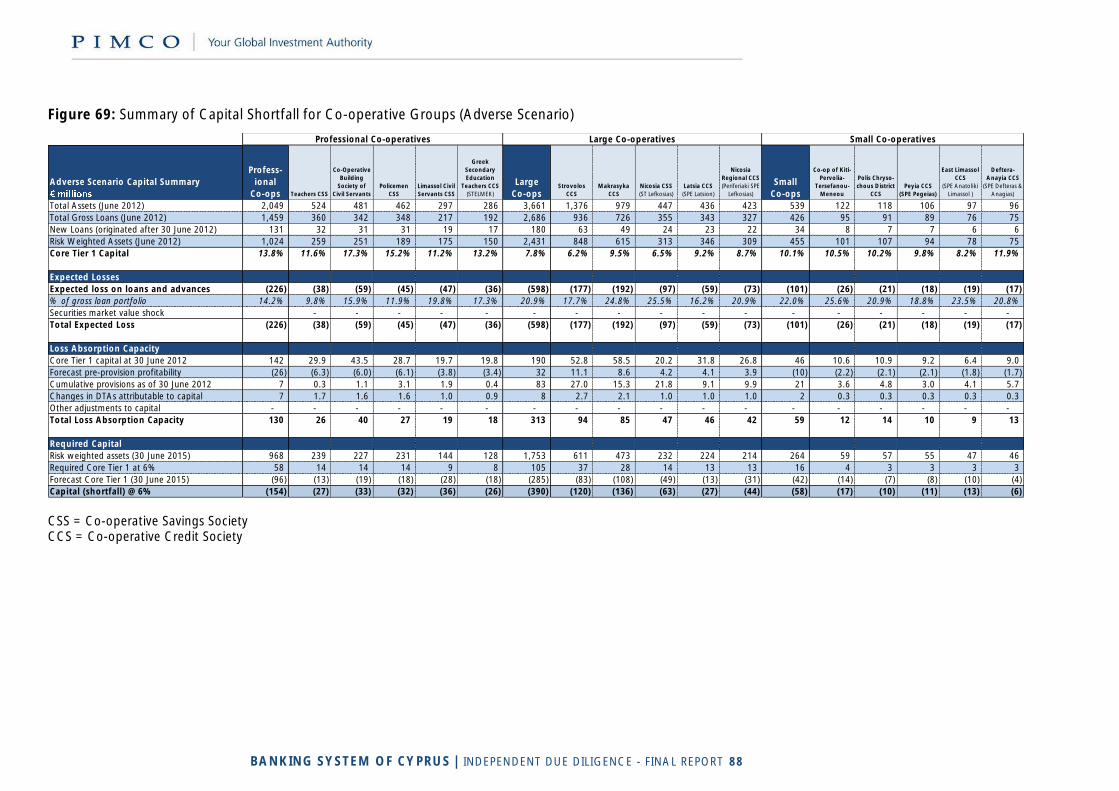
BANKING SYSTEM OF CYPRUS | INDEPENDENT DUE DILIGENCE - FINAL REPORT 88
Figure 69: Summary of Capital Shortfall for Co-operative Groups (Adverse Scenario)
CSS = Co-operative Savings Society CCS = Co-operative Credit Society
Adverse Scenario Capital Summary
Profess-
ional
Co-ops Teachers CSS
Co-Operative
Building
Society of
Civil Servants
Policemen
CSS
Limassol Civil
Servants CSS
Greek
Secondary
Education
Teachers CCS
(STELMEK)
Large
Co-opsStrovolos
CCS
Makrasyka
CCS
Nicosia CSS
(ST Lefkosias)
Latsia CCS
(SPE Latsion)
Nicosia
Regional CCS
(Periferiaki SPE
Lefkosias)
Small
Co-ops
Co-op of Kiti-
Pervolia-
Tersefanou-
Meneou
Polis Chryso-
chous District
CCS
Peyia CCS
(SPE Pegeias)
East Limassol
CCS
(SPE Anatoliki
Limassol )
Deftera-
Anayia CCS
(SPE Defteras &
Anagias)
Total Assets (June 2012) 2,049 524 481 462 297 286 3,661 1,376 979 447 436 423 539 122 118 106 97 96
Total Gross Loans (June 2012) 1,459 360 342 348 217 192 2,686 936 726 355 343 327 426 95 91 89 76 75
New Loans (originated after 30 June 2012) 131 32 31 31 19 17 180 63 49 24 23 22 34 8 7 7 6 6
Risk Weighted Assets (June 2012) 1,024 259 251 189 175 150 2,431 848 615 313 346 309 455 101 107 94 78 75
Core Tier 1 Capital 13.8% 11.6% 17.3% 15.2% 11.2% 13.2% 7.8% 6.2% 9.5% 6.5% 9.2% 8.7% 10.1% 10.5% 10.2% 9.8% 8.2% 11.9%
Expected Losses
Expected loss on loans and advances (226) (38) (59) (45) (47) (36) (598) (177) (192) (97) (59) (73) (101) (26) (21) (18) (19) (17)
% of gross loan portfolio 14.2% 9.8% 15.9% 11.9% 19.8% 17.3% 20.9% 17.7% 24.8% 25.5% 16.2% 20.9% 22.0% 25.6% 20.9% 18.8% 23.5% 20.8%
Securities market value shock - - - - - - - - - - - - - - - - -
Total Expected Loss (226) (38) (59) (45) (47) (36) (598) (177) (192) (97) (59) (73) (101) (26) (21) (18) (19) (17)
Loss Absorption Capacity
Core Tier 1 capital at 30 June 2012 142 29.9 43.5 28.7 19.7 19.8 190 52.8 58.5 20.2 31.8 26.8 46 10.6 10.9 9.2 6.4 9.0
Forecast pre-provision profitability (26) (6.3) (6.0) (6.1) (3.8) (3.4) 32 11.1 8.6 4.2 4.1 3.9 (10) (2.2) (2.1) (2.1) (1.8) (1.7)
Cumulative provisions as of 30 June 2012 7 0.3 1.1 3.1 1.9 0.4 83 27.0 15.3 21.8 9.1 9.9 21 3.6 4.8 3.0 4.1 5.7
Changes in DTAs attributable to capital 7 1.7 1.6 1.6 1.0 0.9 8 2.7 2.1 1.0 1.0 1.0 2 0.3 0.3 0.3 0.3 0.3
Other adjustments to capital - - - - - - - - - - - - - - - - - -
Total Loss Absorption Capacity 130 26 40 27 19 18 313 94 85 47 46 42 59 12 14 10 9 13
Required Capital
Risk weighted assets (30 June 2015) 968 239 227 231 144 128 1,753 611 473 232 224 214 264 59 57 55 47 46
Required Core Tier 1 at 6% 58 14 14 14 9 8 105 37 28 14 13 13 16 4 3 3 3 3
Forecast Core Tier 1 (30 June 2015) (96) (13) (19) (18) (28) (18) (285) (83) (108) (49) (13) (31) (42) (14) (7) (8) (10) (4)
Capital (shortfall) @ 6% (154) (27) (33) (32) (36) (26) (390) (120) (136) (63) (27) (44) (58) (17) (10) (11) (13) (6)
Professional Co-operatives Large Co-operatives Small Co-operatives
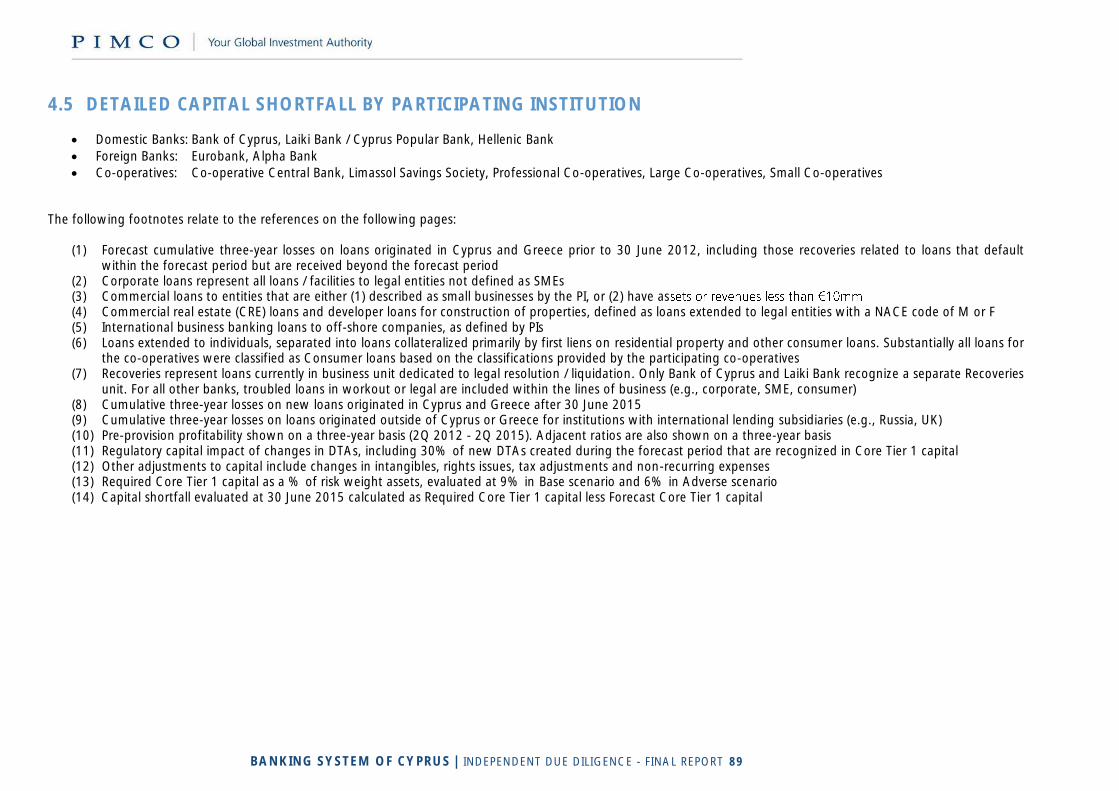
BANKING SYSTEM OF CYPRUS | INDEPENDENT DUE DILIGENCE - FINAL REPORT 89
4.5 DETAILED CAPITAL SHORTFALL BY PARTICIPATING INSTITUTION
Domestic Banks: Bank of Cyprus, Laiki Bank / Cyprus Popular Bank, Hellenic Bank
Foreign Banks: Eurobank, Alpha Bank
Co-operatives: Co-operative Central Bank, Limassol Savings Society, Professional Co-operatives, Large Co-operatives, Small Co-operatives
The following footnotes relate to the references on the following pages:
(1) Forecast cumulative three-year losses on loans originated in Cyprus and Greece prior to 30 June 2012, including those recoveries related to loans that default within the forecast period but are received beyond the forecast period
(2) Corporate loans represent all loans / facilities to legal entities not defined as SMEs (3) Commercial loans to entities that are either (1) described as small businesses by the PI, or (2) have as (4) Commercial real estate (CRE) loans and developer loans for construction of properties, defined as loans extended to legal entities with a NACE code of M or F (5) International business banking loans to off-shore companies, as defined by PIs (6) Loans extended to individuals, separated into loans collateralized primarily by first liens on residential property and other consumer loans. Substantially all loans for
the co-operatives were classified as Consumer loans based on the classifications provided by the participating co-operatives (7) Recoveries represent loans currently in business unit dedicated to legal resolution / liquidation. Only Bank of Cyprus and Laiki Bank recognize a separate Recoveries
unit. For all other banks, troubled loans in workout or legal are included within the lines of business (e.g., corporate, SME, consumer) (8) Cumulative three-year losses on new loans originated in Cyprus and Greece after 30 June 2015 (9) Cumulative three-year losses on loans originated outside of Cyprus or Greece for institutions with international lending subsidiaries (e.g., Russia, UK) (10) Pre-provision profitability shown on a three-year basis (2Q 2012 - 2Q 2015). Adjacent ratios are also shown on a three-year basis (11) Regulatory capital impact of changes in DTAs, including 30% of new DTAs created during the forecast period that are recognized in Core Tier 1 capital (12) Other adjustments to capital include changes in intangibles, rights issues, tax adjustments and non-recurring expenses (13) Required Core Tier 1 capital as a % of risk weight assets, evaluated at 9% in Base scenario and 6% in Adverse scenario (14) Capital shortfall evaluated at 30 June 2015 calculated as Required Core Tier 1 capital less Forecast Core Tier 1 capital
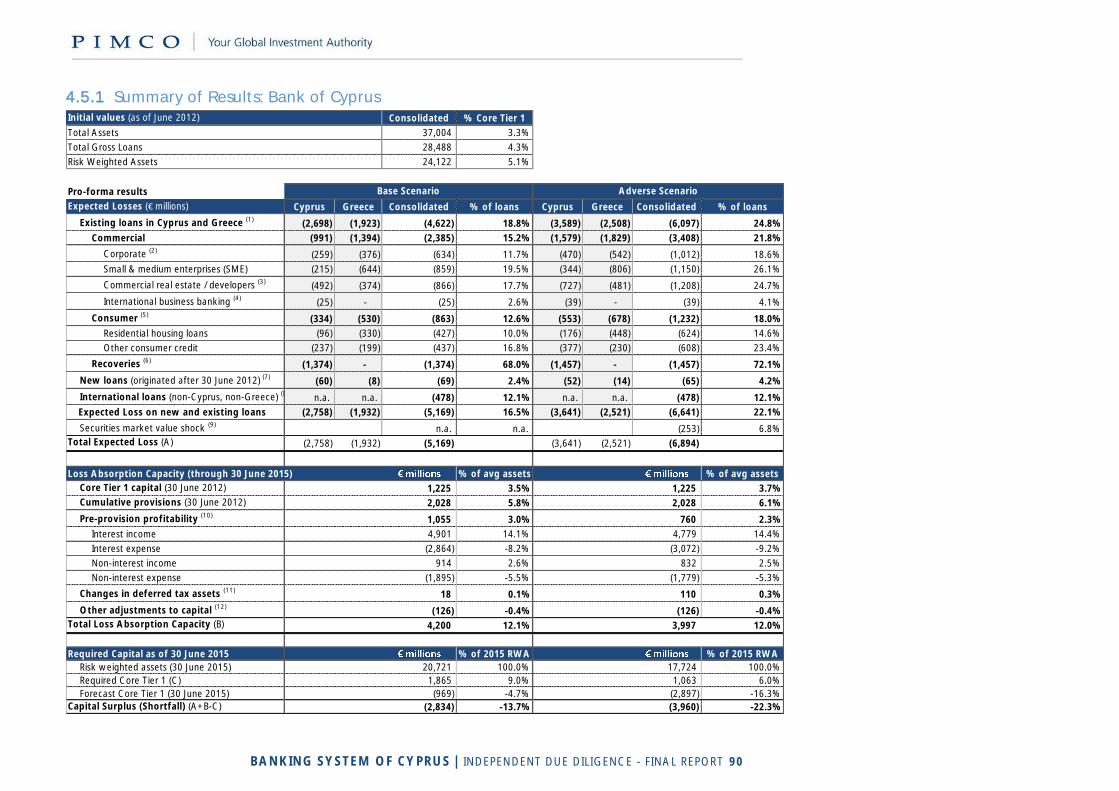
BANKING SYSTEM OF CYPRUS | INDEPENDENT DUE DILIGENCE - FINAL REPORT 90
4.5.1 Summary of Results: Bank of Cyprus
Initial values (as of June 2012) Consolidated
Total Assets 37,004 3.3%
Total Gross Loans 28,488 4.3%
Risk Weighted Assets 24,122 5.1%
Pro-forma results
Expected Losses (€ millions) Cyprus Greece Consolidated % of loans Cyprus Greece Consolidated % of loans
Existing loans in Cyprus and Greece (1)(2,698) (1,923) (4,622) 18.8% (3,589) (2,508) (6,097) 24.8%
Commercial (991) (1,394) (2,385) 15.2% (1,579) (1,829) (3,408) 21.8%
Corporate (2)(259) (376) (634) 11.7% (470) (542) (1,012) 18.6%
Small & medium enterprises (SME) (215) (644) (859) 19.5% (344) (806) (1,150) 26.1%
Commercial real estate / developers (3)(492) (374) (866) 17.7% (727) (481) (1,208) 24.7%
International business banking (4)(25) - (25) 2.6% (39) - (39) 4.1%
Consumer (5)(334) (530) (863) 12.6% (553) (678) (1,232) 18.0%
Residential housing loans (96) (330) (427) 10.0% (176) (448) (624) 14.6%
Other consumer credit (237) (199) (437) 16.8% (377) (230) (608) 23.4%
Recoveries (6)(1,374) - (1,374) 68.0% (1,457) - (1,457) 72.1%
New loans (originated after 30 June 2012) (7)(60) (8) (69) 2.4% (52) (14) (65) 4.2%
International loans (non-Cyprus, non-Greece) (8)n.a. n.a. (478) 12.1% n.a. n.a. (478) 12.1%
Expected Loss on new and existing loans (2,758) (1,932) (5,169) 16.5% (3,641) (2,521) (6,641) 22.1%
Securities market value shock (9)n.a. n.a. (253) 6.8%
Total Expected Loss (A) (2,758) (1,932) (5,169) (3,641) (2,521) (6,894)
Loss Absorption Capacity (through 30 June 2015) % of avg assets % of avg assets
Core Tier 1 capital (30 June 2012) 1,225 3.5% 1,225 3.7%
Cumulative provisions (30 June 2012) 2,028 5.8% 2,028 6.1%
Pre-provision profitability (10)1,055 3.0% 760 2.3%
Interest income 4,901 14.1% 4,779 14.4%
Interest expense (2,864) -8.2% (3,072) -9.2%
Non-interest income 914 2.6% 832 2.5%
Non-interest expense (1,895) -5.5% (1,779) -5.3%
Changes in deferred tax assets (11)18 0.1% 110 0.3%
Other adjustments to capital (12)(126) -0.4% (126) -0.4%
Total Loss Absorption Capacity (B) 4,200 12.1% 3,997 12.0%
Required Capital as of 30 June 2015 % of 2015 RWA % of 2015 RWA
Risk weighted assets (30 June 2015) 20,721 100.0% 17,724 100.0%
Required Core Tier 1 (C) 1,865 9.0% 1,063 6.0%
Forecast Core Tier 1 (30 June 2015) (969) -4.7% (2,897) -16.3%
Capital Surplus (Shortfall) (A+B-C) (2,834) -13.7% (3,960) -22.3%
Base Scenario Adverse Scenario
% Core Tier 1
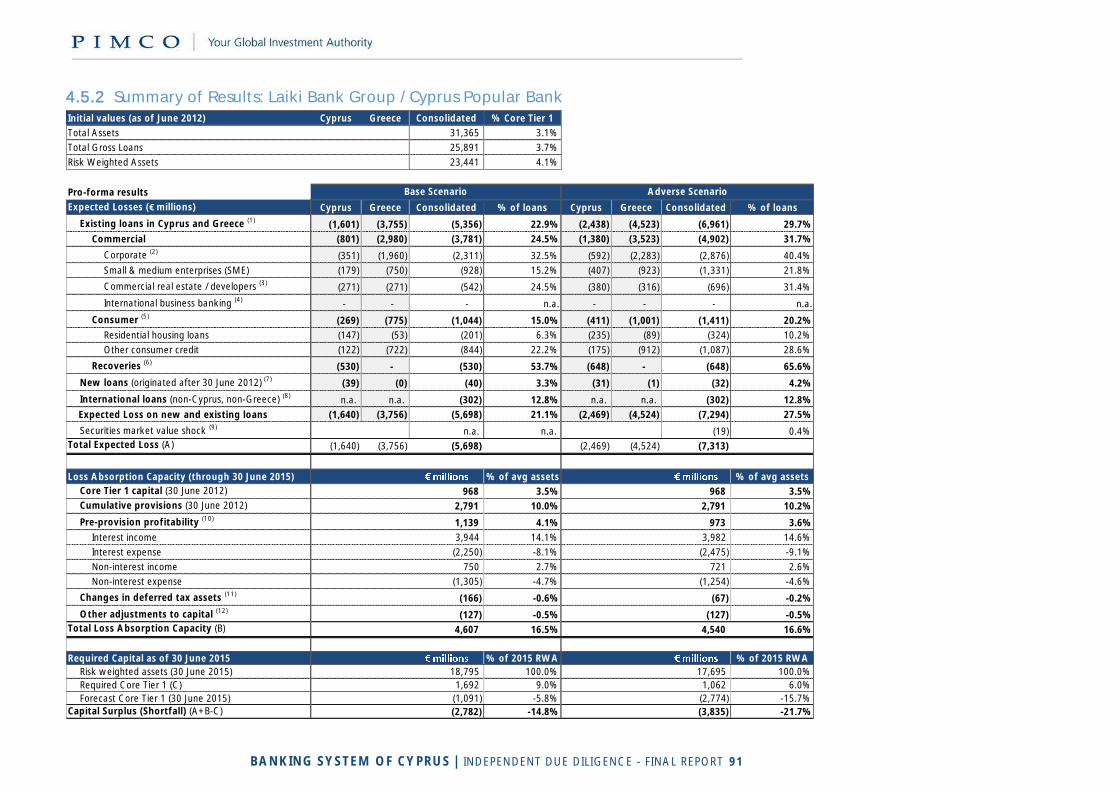
BANKING SYSTEM OF CYPRUS | INDEPENDENT DUE DILIGENCE - FINAL REPORT 91
4.5.2 Summary of Results: Laiki Bank Group / Cyprus Popular Bank
Initial values (as of June 2012) Cyprus Greece Consolidated
Total Assets 31,365 3.1%
Total Gross Loans 25,891 3.7%
Risk Weighted Assets 23,441 4.1%
Pro-forma results
Expected Losses (€ millions) Cyprus Greece Consolidated % of loans Cyprus Greece Consolidated % of loans
Existing loans in Cyprus and Greece (1)(1,601) (3,755) (5,356) 22.9% (2,438) (4,523) (6,961) 29.7%
Commercial (801) (2,980) (3,781) 24.5% (1,380) (3,523) (4,902) 31.7%
Corporate (2)(351) (1,960) (2,311) 32.5% (592) (2,283) (2,876) 40.4%
Small & medium enterprises (SME) (179) (750) (928) 15.2% (407) (923) (1,331) 21.8%
Commercial real estate / developers (3)(271) (271) (542) 24.5% (380) (316) (696) 31.4%
International business banking (4)- - - n.a. - - - n.a.
Consumer (5)(269) (775) (1,044) 15.0% (411) (1,001) (1,411) 20.2%
Residential housing loans (147) (53) (201) 6.3% (235) (89) (324) 10.2%
Other consumer credit (122) (722) (844) 22.2% (175) (912) (1,087) 28.6%
Recoveries (6)(530) - (530) 53.7% (648) - (648) 65.6%
New loans (originated after 30 June 2012) (7)(39) (0) (40) 3.3% (31) (1) (32) 4.2%
International loans (non-Cyprus, non-Greece) (8)n.a. n.a. (302) 12.8% n.a. n.a. (302) 12.8%
Expected Loss on new and existing loans (1,640) (3,756) (5,698) 21.1% (2,469) (4,524) (7,294) 27.5%
Securities market value shock (9)n.a. n.a. (19) 0.4%
Total Expected Loss (A) (1,640) (3,756) (5,698) (2,469) (4,524) (7,313)
Loss Absorption Capacity (through 30 June 2015) % of avg assets % of avg assets
Core Tier 1 capital (30 June 2012) 968 3.5% 968 3.5%
Cumulative provisions (30 June 2012) 2,791 10.0% 2,791 10.2%
Pre-provision profitability (10)1,139 4.1% 973 3.6%
Interest income 3,944 14.1% 3,982 14.6%
Interest expense (2,250) -8.1% (2,475) -9.1%
Non-interest income 750 2.7% 721 2.6%
Non-interest expense (1,305) -4.7% (1,254) -4.6%
Changes in deferred tax assets (11)(166) -0.6% (67) -0.2%
Other adjustments to capital (12)(127) -0.5% (127) -0.5%
Total Loss Absorption Capacity (B) 4,607 16.5% 4,540 16.6%
Required Capital as of 30 June 2015 % of 2015 RWA % of 2015 RWA
Risk weighted assets (30 June 2015) 18,795 100.0% 17,695 100.0%
Required Core Tier 1 (C) 1,692 9.0% 1,062 6.0%
Forecast Core Tier 1 (30 June 2015) (1,091) -5.8% (2,774) -15.7%
Capital Surplus (Shortfall) (A+B-C) (2,782) -14.8% (3,835) -21.7%
% Core Tier 1
Base Scenario Adverse Scenario
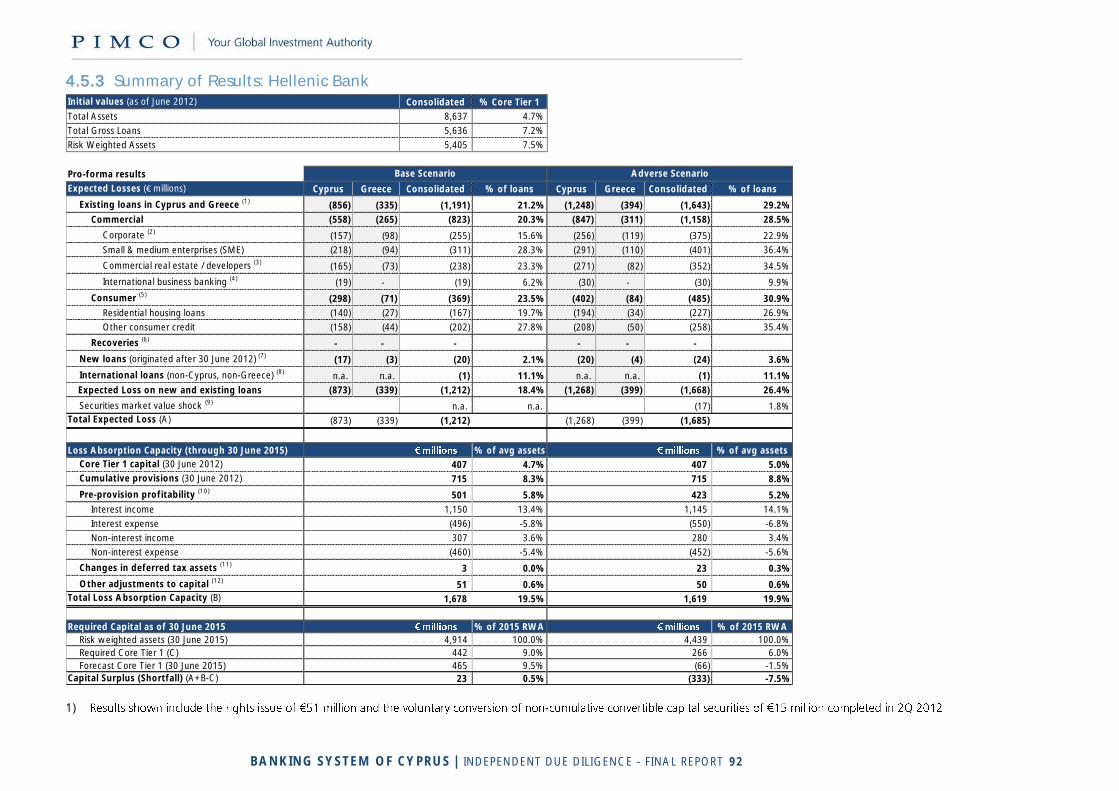
BANKING SYSTEM OF CYPRUS | INDEPENDENT DUE DILIGENCE - FINAL REPORT 92
4.5.3 Summary of Results: Hellenic Bank
1) -
Initial values (as of June 2012) Consolidated
Total Assets 8,637 4.7%
Total Gross Loans 5,636 7.2%
Risk Weighted Assets 5,405 7.5%
Pro-forma results
Expected Losses (€ millions) Cyprus Greece Consolidated % of loans Cyprus Greece Consolidated % of loans
Existing loans in Cyprus and Greece (1)(856) (335) (1,191) 21.2% (1,248) (394) (1,643) 29.2%
Commercial (558) (265) (823) 20.3% (847) (311) (1,158) 28.5%
Corporate (2)(157) (98) (255) 15.6% (256) (119) (375) 22.9%
Small & medium enterprises (SME) (218) (94) (311) 28.3% (291) (110) (401) 36.4%
Commercial real estate / developers (3)(165) (73) (238) 23.3% (271) (82) (352) 34.5%
International business banking (4)(19) - (19) 6.2% (30) - (30) 9.9%
Consumer (5)(298) (71) (369) 23.5% (402) (84) (485) 30.9%
Residential housing loans (140) (27) (167) 19.7% (194) (34) (227) 26.9%
Other consumer credit (158) (44) (202) 27.8% (208) (50) (258) 35.4%
Recoveries (6)- - - - - -
New loans (originated after 30 June 2012) (7)(17) (3) (20) 2.1% (20) (4) (24) 3.6%
International loans (non-Cyprus, non-Greece) (8)n.a. n.a. (1) 11.1% n.a. n.a. (1) 11.1%
Expected Loss on new and existing loans (873) (339) (1,212) 18.4% (1,268) (399) (1,668) 26.4%
Securities market value shock (9)n.a. n.a. (17) 1.8%
Total Expected Loss (A) (873) (339) (1,212) (1,268) (399) (1,685)
Loss Absorption Capacity (through 30 June 2015) % of avg assets % of avg assets
Core Tier 1 capital (30 June 2012) 407 4.7% 407 5.0%
Cumulative provisions (30 June 2012) 715 8.3% 715 8.8%
Pre-provision profitability (10)501 5.8% 423 5.2%
Interest income 1,150 13.4% 1,145 14.1%
Interest expense (496) -5.8% (550) -6.8%
Non-interest income 307 3.6% 280 3.4%
Non-interest expense (460) -5.4% (452) -5.6%
Changes in deferred tax assets (11)3 0.0% 23 0.3%
Other adjustments to capital (12)51 0.6% 50 0.6%
Total Loss Absorption Capacity (B) 1,678 19.5% 1,619 19.9%
Required Capital as of 30 June 2015 % of 2015 RWA % of 2015 RWA
Risk weighted assets (30 June 2015) 4,914 100.0% 4,439 100.0%
Required Core Tier 1 (C) 442 9.0% 266 6.0%
Forecast Core Tier 1 (30 June 2015) 465 9.5% (66) -1.5%
Capital Surplus (Shortfall) (A+B-C) 23 0.5% (333) -7.5%
% Core Tier 1
Base Scenario Adverse Scenario
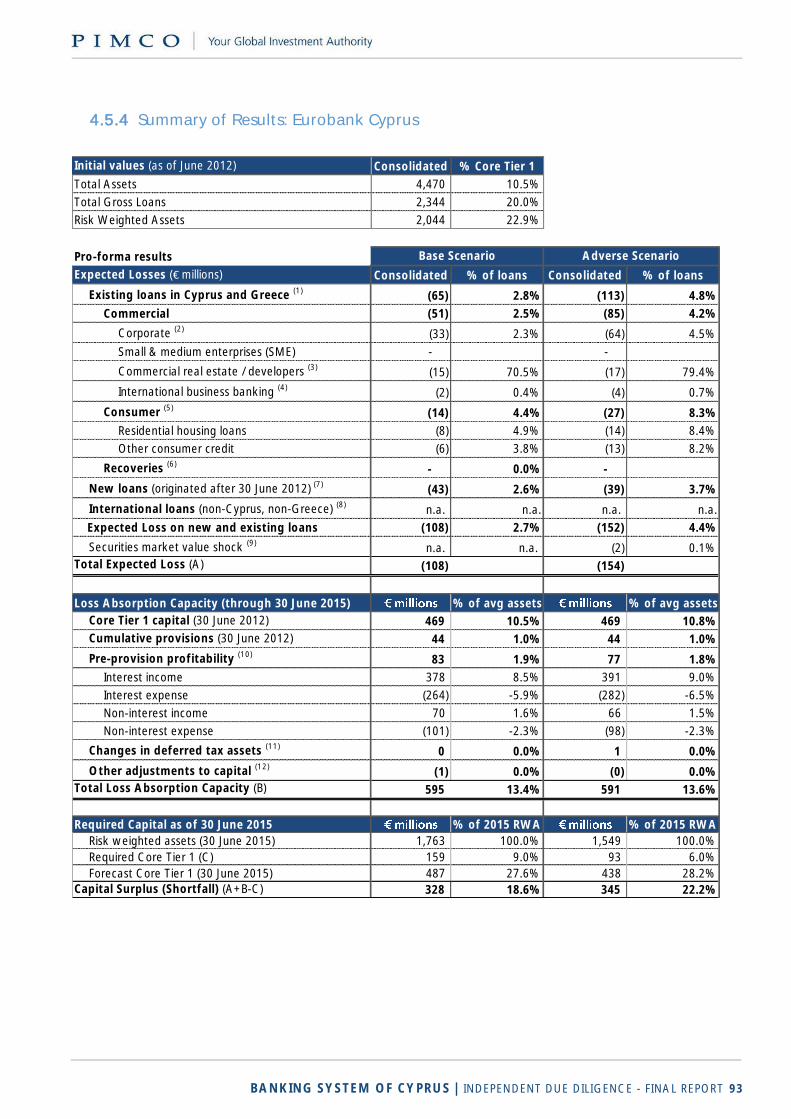
BANKING SYSTEM OF CYPRUS | INDEPENDENT DUE DILIGENCE - FINAL REPORT 93
4.5.4 Summary of Results: Eurobank Cyprus
Initial values (as of June 2012) Consolidated
Total Assets 4,470 10.5%
Total Gross Loans 2,344 20.0%
Risk Weighted Assets 2,044 22.9%
Pro-forma results
Expected Losses (€ millions) Consolidated % of loans Consolidated % of loans
Existing loans in Cyprus and Greece (1)(65) 2.8% (113) 4.8%
Commercial (51) 2.5% (85) 4.2%
Corporate (2)(33) 2.3% (64) 4.5%
Small & medium enterprises (SME) - -
Commercial real estate / developers (3)(15) 70.5% (17) 79.4%
International business banking (4)(2) 0.4% (4) 0.7%
Consumer (5)(14) 4.4% (27) 8.3%
Residential housing loans (8) 4.9% (14) 8.4%
Other consumer credit (6) 3.8% (13) 8.2%
Recoveries (6)- 0.0% -
New loans (originated after 30 June 2012) (7)(43) 2.6% (39) 3.7%
International loans (non-Cyprus, non-Greece) (8)n.a. n.a. n.a. n.a.
Expected Loss on new and existing loans (108) 2.7% (152) 4.4%
Securities market value shock (9)n.a. n.a. (2) 0.1%
Total Expected Loss (A) (108) (154)
Loss Absorption Capacity (through 30 June 2015) % of avg assets % of avg assets
Core Tier 1 capital (30 June 2012) 469 10.5% 469 10.8%
Cumulative provisions (30 June 2012) 44 1.0% 44 1.0%
Pre-provision profitability (10)83 1.9% 77 1.8%
Interest income 378 8.5% 391 9.0%
Interest expense (264) -5.9% (282) -6.5%
Non-interest income 70 1.6% 66 1.5%
Non-interest expense (101) -2.3% (98) -2.3%
Changes in deferred tax assets (11)0 0.0% 1 0.0%
Other adjustments to capital (12)(1) 0.0% (0) 0.0%
Total Loss Absorption Capacity (B) 595 13.4% 591 13.6%
Required Capital as of 30 June 2015 % of 2015 RWA % of 2015 RWA
Risk weighted assets (30 June 2015) 1,763 100.0% 1,549 100.0%
Required Core Tier 1 (C) 159 9.0% 93 6.0%
Forecast Core Tier 1 (30 June 2015) 487 27.6% 438 28.2%
Capital Surplus (Shortfall) (A+B-C) 328 18.6% 345 22.2%
% Core Tier 1
Base Scenario Adverse Scenario
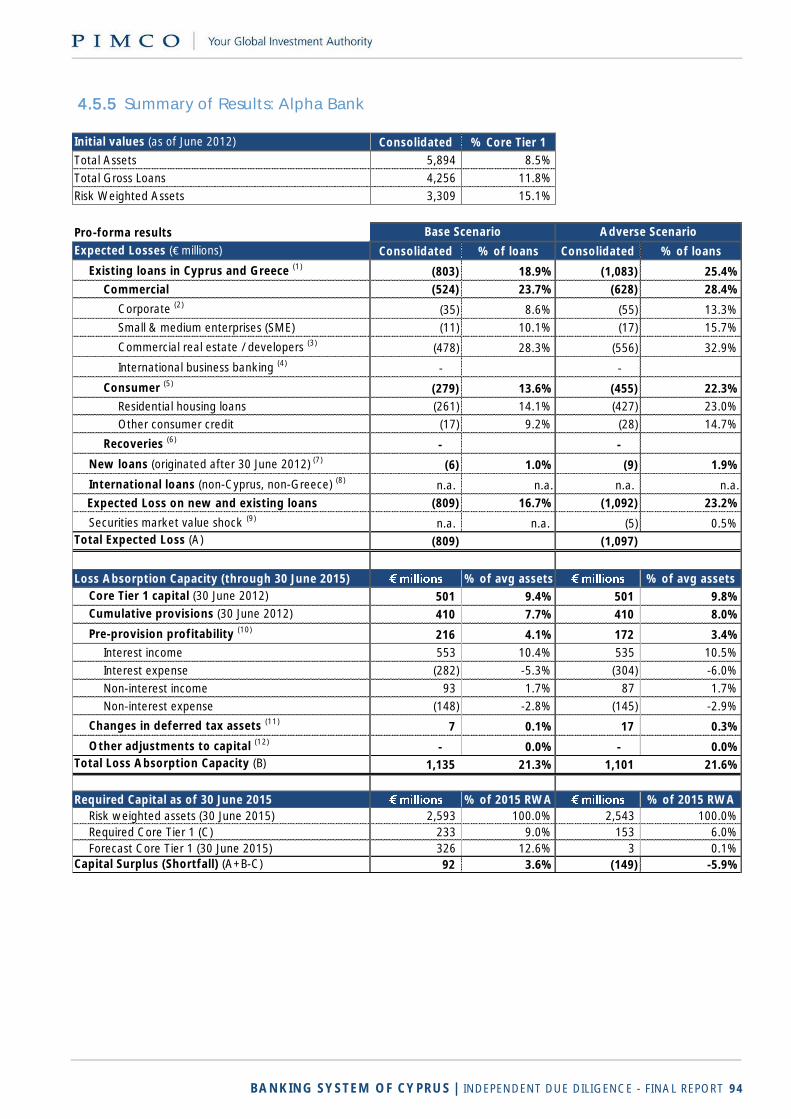
BANKING SYSTEM OF CYPRUS | INDEPENDENT DUE DILIGENCE - FINAL REPORT 94
4.5.5 Summary of Results: Alpha Bank
Initial values (as of June 2012) Consolidated
Total Assets 5,894 8.5%
Total Gross Loans 4,256 11.8%
Risk Weighted Assets 3,309 15.1%
Pro-forma results
Expected Losses (€ millions) Consolidated % of loans Consolidated % of loans
Existing loans in Cyprus and Greece (1)(803) 18.9% (1,083) 25.4%
Commercial (524) 23.7% (628) 28.4%
Corporate (2)(35) 8.6% (55) 13.3%
Small & medium enterprises (SME) (11) 10.1% (17) 15.7%
Commercial real estate / developers (3)(478) 28.3% (556) 32.9%
International business banking (4)- -
Consumer (5)(279) 13.6% (455) 22.3%
Residential housing loans (261) 14.1% (427) 23.0%
Other consumer credit (17) 9.2% (28) 14.7%
Recoveries (6)- -
New loans (originated after 30 June 2012) (7)(6) 1.0% (9) 1.9%
International loans (non-Cyprus, non-Greece) (8)n.a. n.a. n.a. n.a.
Expected Loss on new and existing loans (809) 16.7% (1,092) 23.2%
Securities market value shock (9)n.a. n.a. (5) 0.5%
Total Expected Loss (A) (809) (1,097)
Loss Absorption Capacity (through 30 June 2015) % of avg assets % of avg assets
Core Tier 1 capital (30 June 2012) 501 9.4% 501 9.8%
Cumulative provisions (30 June 2012) 410 7.7% 410 8.0%
Pre-provision profitability (10)216 4.1% 172 3.4%
Interest income 553 10.4% 535 10.5%
Interest expense (282) -5.3% (304) -6.0%
Non-interest income 93 1.7% 87 1.7%
Non-interest expense (148) -2.8% (145) -2.9%
Changes in deferred tax assets (11)7 0.1% 17 0.3%
Other adjustments to capital (12)- 0.0% - 0.0%
Total Loss Absorption Capacity (B) 1,135 21.3% 1,101 21.6%
Required Capital as of 30 June 2015 % of 2015 RWA % of 2015 RWA
Risk weighted assets (30 June 2015) 2,593 100.0% 2,543 100.0%
Required Core Tier 1 (C) 233 9.0% 153 6.0%
Forecast Core Tier 1 (30 June 2015) 326 12.6% 3 0.1%
Capital Surplus (Shortfall) (A+B-C) 92 3.6% (149) -5.9%
% Core Tier 1
Base Scenario Adverse Scenario
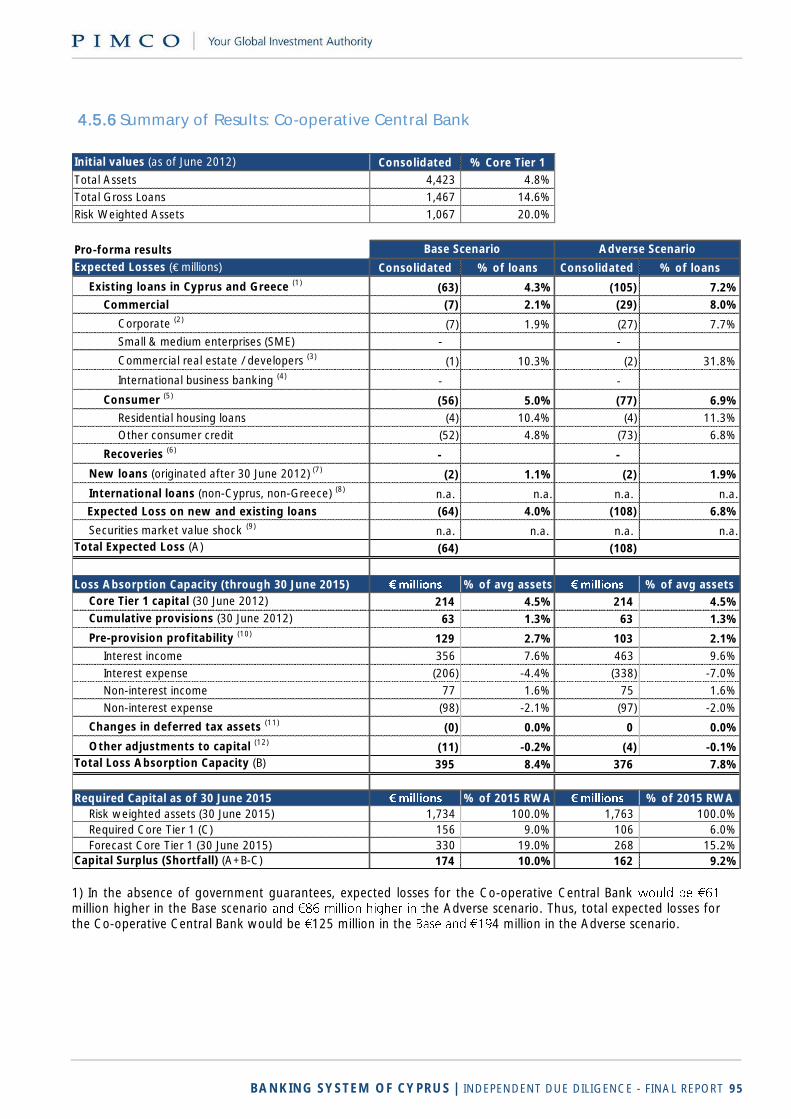
BANKING SYSTEM OF CYPRUS | INDEPENDENT DUE DILIGENCE - FINAL REPORT 95
4.5.6 Summary of Results: Co-operative Central Bank Participating Institution name 3F
Initial values (as of June 2012) Consolidated
Total Assets 4,423 4.8%
Total Gross Loans 1,467 14.6%
Risk Weighted Assets 1,067 20.0%
Pro-forma results
Expected Losses (€ millions) Consolidated % of loans Consolidated % of loans
Existing loans in Cyprus and Greece (1)(63) 4.3% (105) 7.2%
Commercial (7) 2.1% (29) 8.0%
Corporate (2)(7) 1.9% (27) 7.7%
Small & medium enterprises (SME) - -
Commercial real estate / developers (3)(1) 10.3% (2) 31.8%
International business banking (4)- -
Consumer (5)(56) 5.0% (77) 6.9%
Residential housing loans (4) 10.4% (4) 11.3%
Other consumer credit (52) 4.8% (73) 6.8%
Recoveries (6)- -
New loans (originated after 30 June 2012) (7)(2) 1.1% (2) 1.9%
International loans (non-Cyprus, non-Greece) (8)n.a. n.a. n.a. n.a.
Expected Loss on new and existing loans (64) 4.0% (108) 6.8%
Securities market value shock (9)n.a. n.a. n.a. n.a.
Total Expected Loss (A) (64) (108)
Loss Absorption Capacity (through 30 June 2015) % of avg assets % of avg assets
Core Tier 1 capital (30 June 2012) 214 4.5% 214 4.5%
Cumulative provisions (30 June 2012) 63 1.3% 63 1.3%
Pre-provision profitability (10)129 2.7% 103 2.1%
Interest income 356 7.6% 463 9.6%
Interest expense (206) -4.4% (338) -7.0%
Non-interest income 77 1.6% 75 1.6%
Non-interest expense (98) -2.1% (97) -2.0%
Changes in deferred tax assets (11)(0) 0.0% 0 0.0%
Other adjustments to capital (12)(11) -0.2% (4) -0.1%
Total Loss Absorption Capacity (B) 395 8.4% 376 7.8%
Required Capital as of 30 June 2015 % of 2015 RWA % of 2015 RWA
Risk weighted assets (30 June 2015) 1,734 100.0% 1,763 100.0%
Required Core Tier 1 (C) 156 9.0% 106 6.0%
Forecast Core Tier 1 (30 June 2015) 330 19.0% 268 15.2%
Capital Surplus (Shortfall) (A+B-C) 174 10.0% 162 9.2%
% Core Tier 1
Base Scenario Adverse Scenario
1) In the absence of government guarantees, expected losses for the Co-operative Central Bank million higher in the Base scenario he Adverse scenario. Thus, total expected losses for the Co-operative Central Bank would be 125 million in the 4 million in the Adverse scenario.
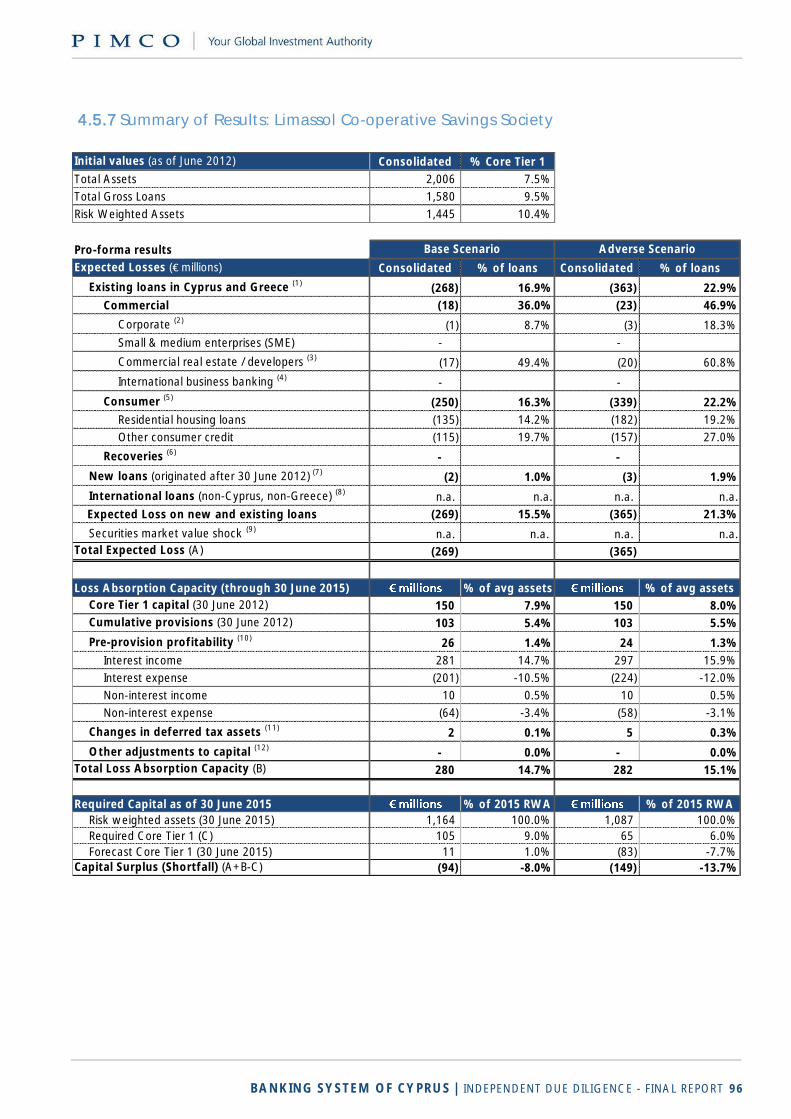
BANKING SYSTEM OF CYPRUS | INDEPENDENT DUE DILIGENCE - FINAL REPORT 96
4.5.7 Summary of Results: Limassol Co-operative Savings Society Participating Institution name 3G
Initial values (as of June 2012) Consolidated
Total Assets 2,006 7.5%
Total Gross Loans 1,580 9.5%
Risk Weighted Assets 1,445 10.4%
Pro-forma results
Expected Losses (€ millions) Consolidated % of loans Consolidated % of loans
Existing loans in Cyprus and Greece (1)(268) 16.9% (363) 22.9%
Commercial (18) 36.0% (23) 46.9%
Corporate (2)(1) 8.7% (3) 18.3%
Small & medium enterprises (SME) - -
Commercial real estate / developers (3)(17) 49.4% (20) 60.8%
International business banking (4)- -
Consumer (5)(250) 16.3% (339) 22.2%
Residential housing loans (135) 14.2% (182) 19.2%
Other consumer credit (115) 19.7% (157) 27.0%
Recoveries (6)- -
New loans (originated after 30 June 2012) (7)(2) 1.0% (3) 1.9%
International loans (non-Cyprus, non-Greece) (8)n.a. n.a. n.a. n.a.
Expected Loss on new and existing loans (269) 15.5% (365) 21.3%
Securities market value shock (9)n.a. n.a. n.a. n.a.
Total Expected Loss (A) (269) (365)
Loss Absorption Capacity (through 30 June 2015) % of avg assets % of avg assets
Core Tier 1 capital (30 June 2012) 150 7.9% 150 8.0%
Cumulative provisions (30 June 2012) 103 5.4% 103 5.5%
Pre-provision profitability (10)26 1.4% 24 1.3%
Interest income 281 14.7% 297 15.9%
Interest expense (201) -10.5% (224) -12.0%
Non-interest income 10 0.5% 10 0.5%
Non-interest expense (64) -3.4% (58) -3.1%
Changes in deferred tax assets (11)2 0.1% 5 0.3%
Other adjustments to capital (12)- 0.0% - 0.0%
Total Loss Absorption Capacity (B) 280 14.7% 282 15.1%
Required Capital as of 30 June 2015 % of 2015 RWA % of 2015 RWA
Risk weighted assets (30 June 2015) 1,164 100.0% 1,087 100.0%
Required Core Tier 1 (C) 105 9.0% 65 6.0%
Forecast Core Tier 1 (30 June 2015) 11 1.0% (83) -7.7%
Capital Surplus (Shortfall) (A+B-C) (94) -8.0% (149) -13.7%
% Core Tier 1
Base Scenario Adverse Scenario
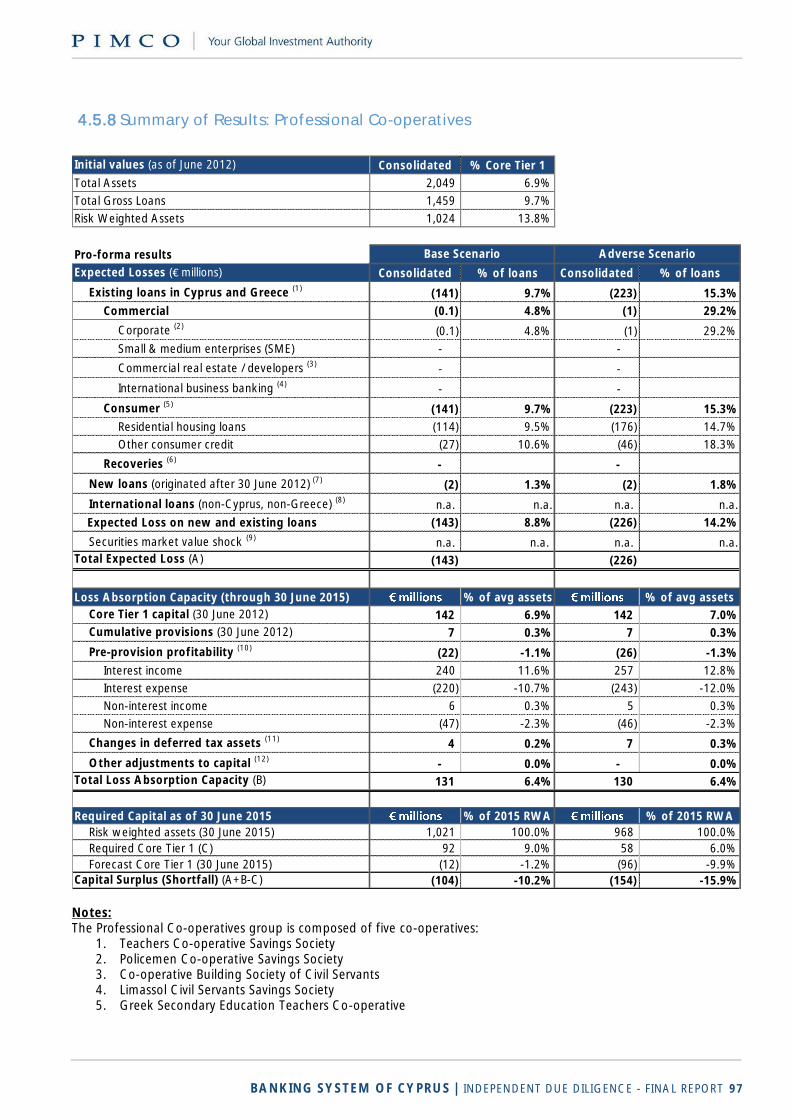
BANKING SYSTEM OF CYPRUS | INDEPENDENT DUE DILIGENCE - FINAL REPORT 97
4.5.8 Summary of Results: Professional Co-operatives Participating Institution name 4H
Initial values (as of June 2012) Consolidated
Total Assets 2,049 6.9%
Total Gross Loans 1,459 9.7%
Risk Weighted Assets 1,024 13.8%
Pro-forma results
Expected Losses (€ millions) Consolidated % of loans Consolidated % of loans
Existing loans in Cyprus and Greece (1)(141) 9.7% (223) 15.3%
Commercial (0.1) 4.8% (1) 29.2%
Corporate (2)(0.1) 4.8% (1) 29.2%
Small & medium enterprises (SME) - -
Commercial real estate / developers (3)- -
International business banking (4)- -
Consumer (5)(141) 9.7% (223) 15.3%
Residential housing loans (114) 9.5% (176) 14.7%
Other consumer credit (27) 10.6% (46) 18.3%
Recoveries (6)- -
New loans (originated after 30 June 2012) (7)(2) 1.3% (2) 1.8%
International loans (non-Cyprus, non-Greece) (8)n.a. n.a. n.a. n.a.
Expected Loss on new and existing loans (143) 8.8% (226) 14.2%
Securities market value shock (9)n.a. n.a. n.a. n.a.
Total Expected Loss (A) (143) (226)
Loss Absorption Capacity (through 30 June 2015) % of avg assets % of avg assets
Core Tier 1 capital (30 June 2012) 142 6.9% 142 7.0%
Cumulative provisions (30 June 2012) 7 0.3% 7 0.3%
Pre-provision profitability (10)(22) -1.1% (26) -1.3%
Interest income 240 11.6% 257 12.8%
Interest expense (220) -10.7% (243) -12.0%
Non-interest income 6 0.3% 5 0.3%
Non-interest expense (47) -2.3% (46) -2.3%
Changes in deferred tax assets (11)4 0.2% 7 0.3%
Other adjustments to capital (12)- 0.0% - 0.0%
Total Loss Absorption Capacity (B) 131 6.4% 130 6.4%
Required Capital as of 30 June 2015 % of 2015 RWA % of 2015 RWA
Risk weighted assets (30 June 2015) 1,021 100.0% 968 100.0%
Required Core Tier 1 (C) 92 9.0% 58 6.0%
Forecast Core Tier 1 (30 June 2015) (12) -1.2% (96) -9.9%
Capital Surplus (Shortfall) (A+B-C) (104) -10.2% (154) -15.9%
% Core Tier 1
Base Scenario Adverse Scenario
Notes: The Professional Co-operatives group is composed of five co-operatives:
1. Teachers Co-operative Savings Society 2. Policemen Co-operative Savings Society 3. Co-operative Building Society of Civil Servants 4. Limassol Civil Servants Savings Society 5. Greek Secondary Education Teachers Co-operative
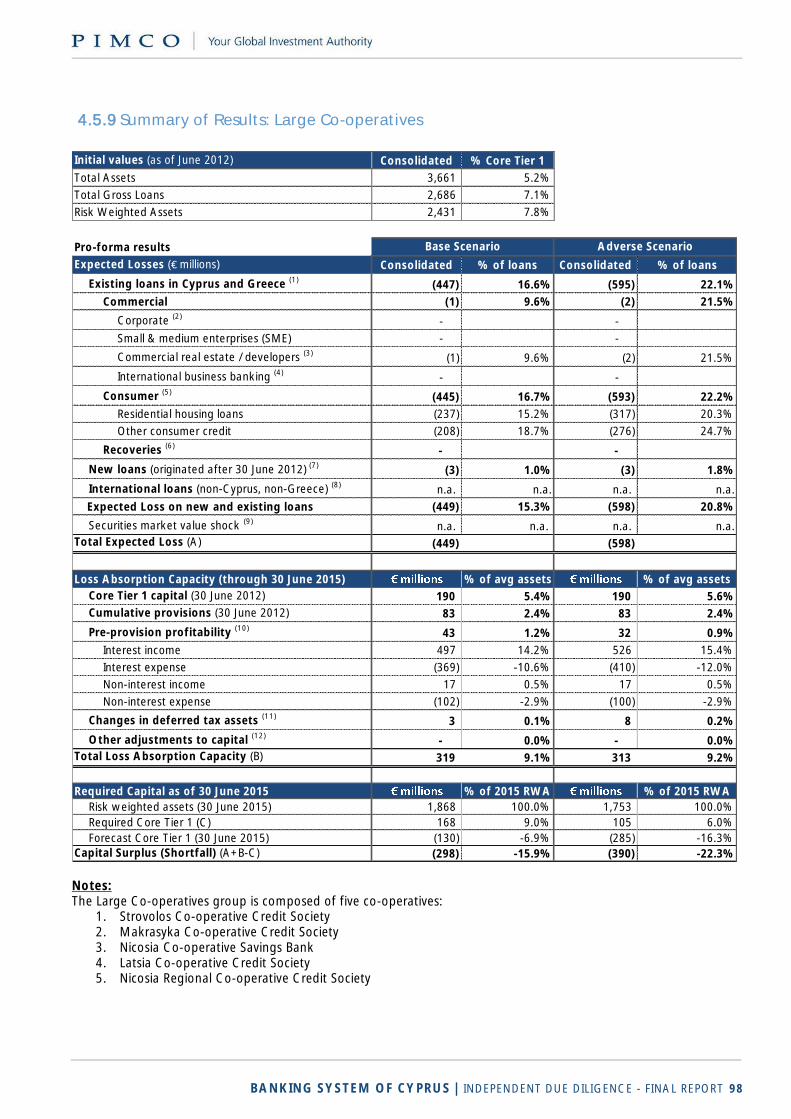
BANKING SYSTEM OF CYPRUS | INDEPENDENT DUE DILIGENCE - FINAL REPORT 98
4.5.9 Summary of Results: Large Co-operatives Participating Institution name 5I
Initial values (as of June 2012) Consolidated
Total Assets 3,661 5.2%
Total Gross Loans 2,686 7.1%
Risk Weighted Assets 2,431 7.8%
Pro-forma results
Expected Losses (€ millions) Consolidated % of loans Consolidated % of loans
Existing loans in Cyprus and Greece (1)(447) 16.6% (595) 22.1%
Commercial (1) 9.6% (2) 21.5%
Corporate (2)- -
Small & medium enterprises (SME) - -
Commercial real estate / developers (3)(1) 9.6% (2) 21.5%
International business banking (4)- -
Consumer (5)(445) 16.7% (593) 22.2%
Residential housing loans (237) 15.2% (317) 20.3%
Other consumer credit (208) 18.7% (276) 24.7%
Recoveries (6)- -
New loans (originated after 30 June 2012) (7)(3) 1.0% (3) 1.8%
International loans (non-Cyprus, non-Greece) (8)n.a. n.a. n.a. n.a.
Expected Loss on new and existing loans (449) 15.3% (598) 20.8%
Securities market value shock (9)n.a. n.a. n.a. n.a.
Total Expected Loss (A) (449) (598)
Loss Absorption Capacity (through 30 June 2015) % of avg assets % of avg assets
Core Tier 1 capital (30 June 2012) 190 5.4% 190 5.6%
Cumulative provisions (30 June 2012) 83 2.4% 83 2.4%
Pre-provision profitability (10)43 1.2% 32 0.9%
Interest income 497 14.2% 526 15.4%
Interest expense (369) -10.6% (410) -12.0%
Non-interest income 17 0.5% 17 0.5%
Non-interest expense (102) -2.9% (100) -2.9%
Changes in deferred tax assets (11)3 0.1% 8 0.2%
Other adjustments to capital (12)- 0.0% - 0.0%
Total Loss Absorption Capacity (B) 319 9.1% 313 9.2%
Required Capital as of 30 June 2015 % of 2015 RWA % of 2015 RWA
Risk weighted assets (30 June 2015) 1,868 100.0% 1,753 100.0%
Required Core Tier 1 (C) 168 9.0% 105 6.0%
Forecast Core Tier 1 (30 June 2015) (130) -6.9% (285) -16.3%
Capital Surplus (Shortfall) (A+B-C) (298) -15.9% (390) -22.3%
% Core Tier 1
Base Scenario Adverse Scenario
Notes: The Large Co-operatives group is composed of five co-operatives:
1. Strovolos Co-operative Credit Society 2. Makrasyka Co-operative Credit Society 3. Nicosia Co-operative Savings Bank 4. Latsia Co-operative Credit Society 5. Nicosia Regional Co-operative Credit Society
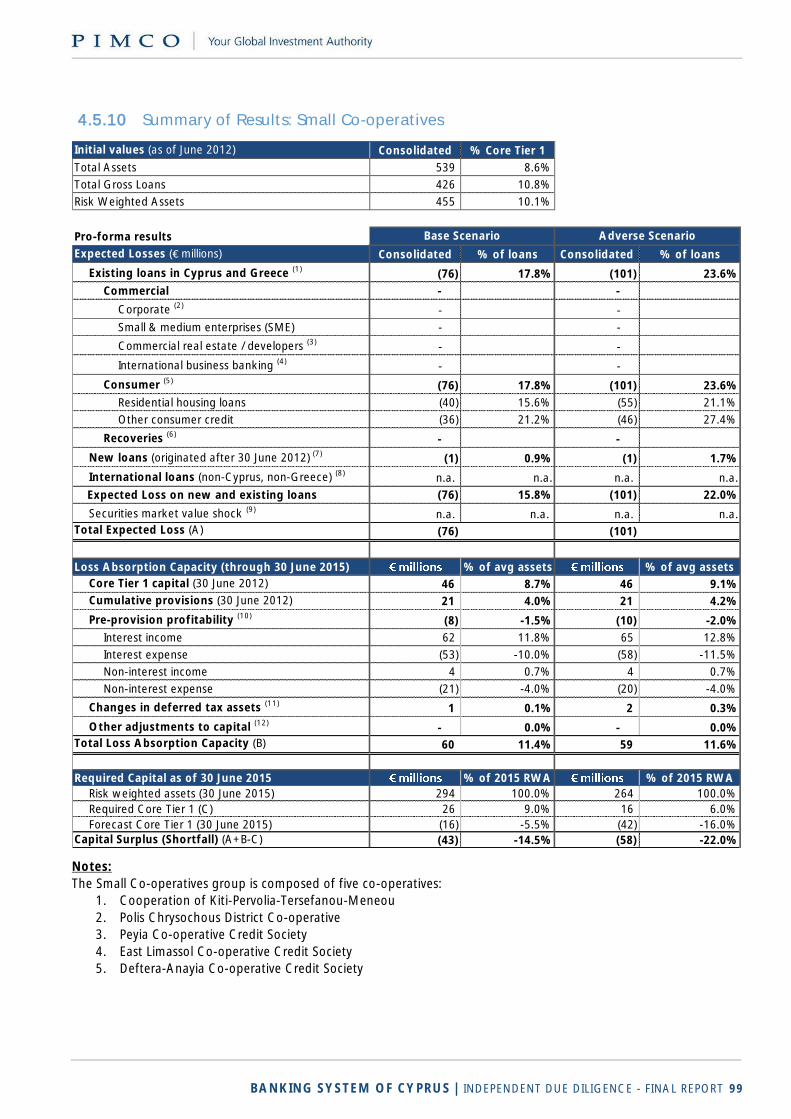
BANKING SYSTEM OF CYPRUS | INDEPENDENT DUE DILIGENCE - FINAL REPORT 99
4.5.10 Summary of Results: Small Co-operatives Participating Institution name 6J
Initial values (as of June 2012) Consolidated
Total Assets 539 8.6%
Total Gross Loans 426 10.8%
Risk Weighted Assets 455 10.1%
Pro-forma results
Expected Losses (€ millions) Consolidated % of loans Consolidated % of loans
Existing loans in Cyprus and Greece (1)(76) 17.8% (101) 23.6%
Commercial - -
Corporate (2)- -
Small & medium enterprises (SME) - -
Commercial real estate / developers (3)- -
International business banking (4)- -
Consumer (5)(76) 17.8% (101) 23.6%
Residential housing loans (40) 15.6% (55) 21.1%
Other consumer credit (36) 21.2% (46) 27.4%
Recoveries (6)- -
New loans (originated after 30 June 2012) (7)(1) 0.9% (1) 1.7%
International loans (non-Cyprus, non-Greece) (8)n.a. n.a. n.a. n.a.
Expected Loss on new and existing loans (76) 15.8% (101) 22.0%
Securities market value shock (9)n.a. n.a. n.a. n.a.
Total Expected Loss (A) (76) (101)
Loss Absorption Capacity (through 30 June 2015) % of avg assets % of avg assets
Core Tier 1 capital (30 June 2012) 46 8.7% 46 9.1%
Cumulative provisions (30 June 2012) 21 4.0% 21 4.2%
Pre-provision profitability (10)(8) -1.5% (10) -2.0%
Interest income 62 11.8% 65 12.8%
Interest expense (53) -10.0% (58) -11.5%
Non-interest income 4 0.7% 4 0.7%
Non-interest expense (21) -4.0% (20) -4.0%
Changes in deferred tax assets (11)1 0.1% 2 0.3%
Other adjustments to capital (12)- 0.0% - 0.0%
Total Loss Absorption Capacity (B) 60 11.4% 59 11.6%
Required Capital as of 30 June 2015 % of 2015 RWA % of 2015 RWA
Risk weighted assets (30 June 2015) 294 100.0% 264 100.0%
Required Core Tier 1 (C) 26 9.0% 16 6.0%
Forecast Core Tier 1 (30 June 2015) (16) -5.5% (42) -16.0%
Capital Surplus (Shortfall) (A+B-C) (43) -14.5% (58) -22.0%
% Core Tier 1
Base Scenario Adverse Scenario
Notes:
The Small Co-operatives group is composed of five co-operatives:
1. Cooperation of Kiti-Pervolia-Tersefanou-Meneou
2. Polis Chrysochous District Co-operative
3. Peyia Co-operative Credit Society
4. East Limassol Co-operative Credit Society
5. Deftera-Anayia Co-operative Credit Society
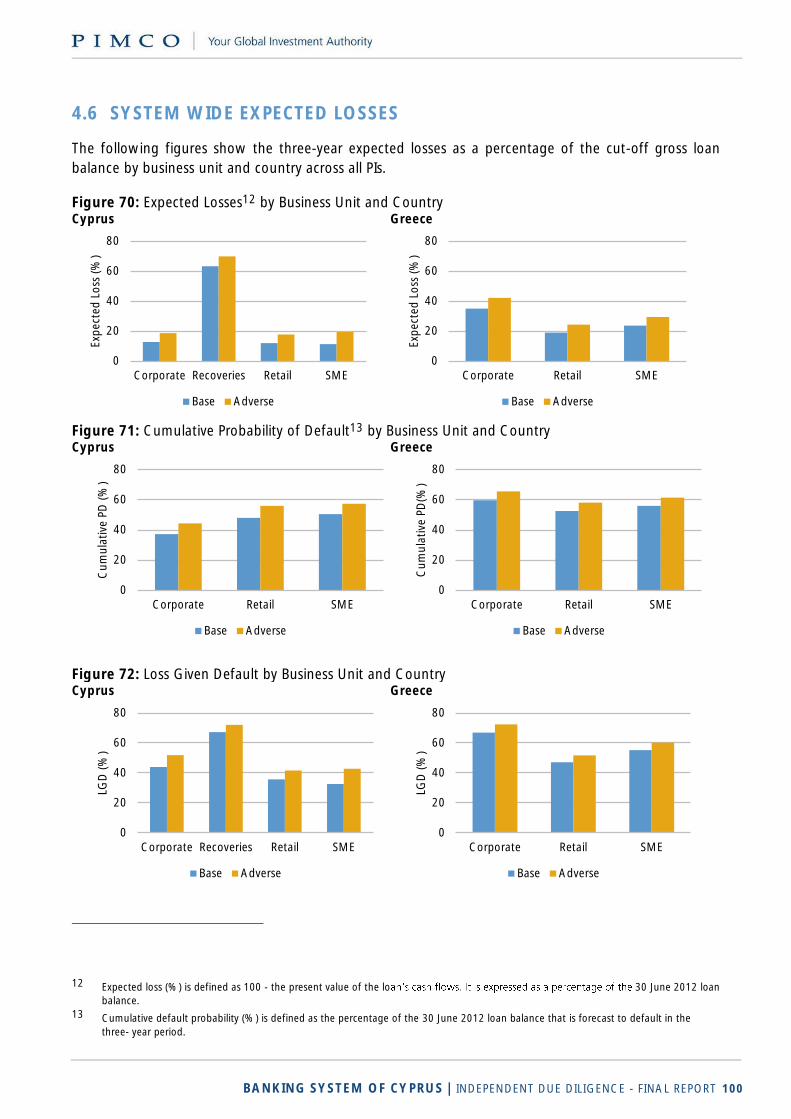
BANKING SYSTEM OF CYPRUS | INDEPENDENT DUE DILIGENCE - FINAL REPORT 100
4.6 SYSTEM WIDE EXPECTED LOSSES
The following figures show the three-year expected losses as a percentage of the cut-off gross loan
balance by business unit and country across all PIs.
Figure 70: Expected Losses12 by Business Unit and Country Cyprus Greece
Figure 71: Cumulative Probability of Default13 by Business Unit and Country Cyprus Greece
Figure 72: Loss Given Default by Business Unit and Country Cyprus Greece
12 Expected loss (%) is defined as 100 - the present value of the lo 30 June 2012 loan
balance.
13 Cumulative default probability (%) is defined as the percentage of the 30 June 2012 loan balance that is forecast to default in the
three- year period.
0
20
40
60
80
Corporate Recoveries Retail SME
Exp
ect
ed
Lo
ss (
%)
Base Adverse
0
20
40
60
80
Corporate Retail SME
Exp
ect
ed
Lo
ss (
%)
Base Adverse
0
20
40
60
80
Corporate Retail SME
Cu
mu
lati
ve P
D (
%)
Base Adverse
0
20
40
60
80
Corporate Retail SME
Cu
mu
lati
ve P
D(%
)
Base Adverse
0
20
40
60
80
Corporate Recoveries Retail SME
LGD
(%
)
Base Adverse
0
20
40
60
80
Corporate Retail SME
LGD
(%
)
Base Adverse
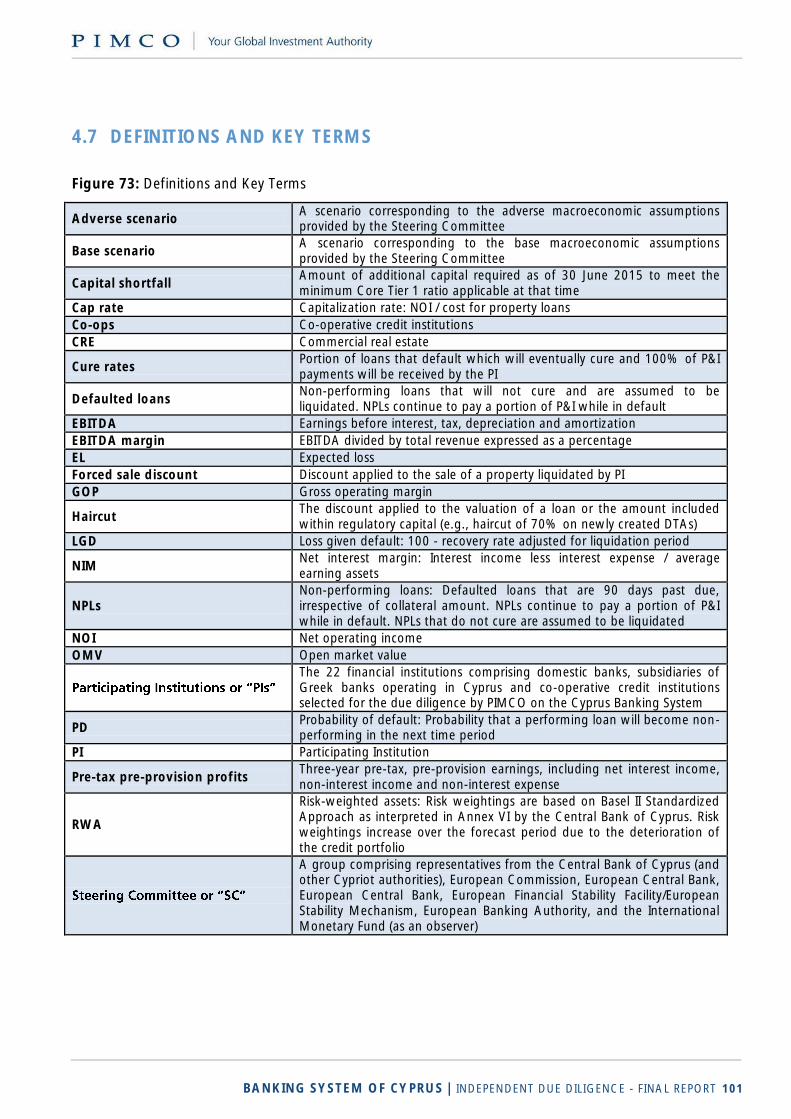
BANKING SYSTEM OF CYPRUS | INDEPENDENT DUE DILIGENCE - FINAL REPORT 101
4.7 DEFINITIONS AND KEY TERMS
Figure 73: Definitions and Key Terms
Adverse scenario A scenario corresponding to the adverse macroeconomic assumptions provided by the Steering Committee
Base scenario A scenario corresponding to the base macroeconomic assumptions provided by the Steering Committee
Capital shortfall Amount of additional capital required as of 30 June 2015 to meet the minimum Core Tier 1 ratio applicable at that time
Cap rate Capitalization rate: NOI / cost for property loans
Co-ops Co-operative credit institutions
CRE Commercial real estate
Cure rates Portion of loans that default which will eventually cure and 100% of P&I payments will be received by the PI
Defaulted loans Non-performing loans that will not cure and are assumed to be liquidated. NPLs continue to pay a portion of P&I while in default
EBITDA Earnings before interest, tax, depreciation and amortization
EBITDA margin EBITDA divided by total revenue expressed as a percentage
EL Expected loss
Forced sale discount Discount applied to the sale of a property liquidated by PI
GOP Gross operating margin
Haircut The discount applied to the valuation of a loan or the amount included within regulatory capital (e.g., haircut of 70% on newly created DTAs)
LGD Loss given default: 100 - recovery rate adjusted for liquidation period
NIM Net interest margin: Interest income less interest expense / average earning assets
NPLs Non-performing loans: Defaulted loans that are 90 days past due, irrespective of collateral amount. NPLs continue to pay a portion of P&I while in default. NPLs that do not cure are assumed to be liquidated
NOI Net operating income
OMV Open market value
The 22 financial institutions comprising domestic banks, subsidiaries of Greek banks operating in Cyprus and co-operative credit institutions selected for the due diligence by PIMCO on the Cyprus Banking System
PD Probability of default: Probability that a performing loan will become non-performing in the next time period
PI Participating Institution
Pre-tax pre-provision profits Three-year pre-tax, pre-provision earnings, including net interest income, non-interest income and non-interest expense
RWA
Risk-weighted assets: Risk weightings are based on Basel II Standardized Approach as interpreted in Annex VI by the Central Bank of Cyprus. Risk weightings increase over the forecast period due to the deterioration of the credit portfolio
A group comprising representatives from the Central Bank of Cyprus (and other Cypriot authorities), European Commission, European Central Bank, European Central Bank, European Financial Stability Facility/European Stability Mechanism, European Banking Authority, and the International Monetary Fund (as an observer)