Embed Size (px)
Citation preview

D. Peterson, “Studies of a Bulk Micromegas using the Cornell/Purdue TPC”, LCWS07, DESY, 30-05-20071
Studies of a Bulk Micromegas using the Cornell/Purdue TPC
This project is supported by the US National Science Foundation (LEPP cooperative agreement) and by the US Department of Energy (Purdue HEP group base grant) and an LCDRD consortium grant (NSF and DoE)
Cornell University Purdue University
T. Anous K. ArndtR. S. Galik G. BollaD. P. Peterson I. P. J. Shipsey
The “Bulk Micromegas”, was prepared on one of our pad boards by Paul Colas’ group.

D. Peterson, “Studies of a Bulk Micromegas using the Cornell/Purdue TPC”, LCWS07, DESY, 30-05-20072
Topics
- Description of the chamber (mostly repeat, a few updates)
- Measurements of the Bulk Micromegas , B=0, Ar-isoC4H10(7%) running conditions ( training, sparking ) anode signal width spatial resolution
- Comments on continued preparations for ion feedback measurements
Further information available at the web site: http://www.lepp.cornell.edu/~dpp/tpc_test_lab_info.html
* presentation at ECFA Valencia 07-November-2006 electron and ion transmission * presentation at ALCPG Vancouver 18-July-2006 demonstration of ion signal * presentation at Berkeley TPC Workshop 08-April-2006 Purdue-3M Micromegas * presentation at ECFA 2005 Vienna 24-November-2005 * presentation at ALCPG Snowmass 23-August-2005 * presentation at LCWS05, Stanford 21-March-2005

D. Peterson, “Studies of a Bulk Micromegas using the Cornell/Purdue TPC”, LCWS07, DESY, 30-05-20073
TPC
14.6 cm ID field cage - accommodates a 10 cm gas amplification device64 cm drift field length 22.2 cm OD outer structure (8.75 inch)
“field cage termination” and “final” return lines for the field cage HV distribution allow adjustment of the termination bias voltage with an external resistor.
Read-out end: field cage termination readout pad and gas amplification module pad biasing boards CLEO II cathode preamps
D. Peterson, “Studies of a Bulk Micromegas using the Cornell/Purdue TPC”, LCWS07, DESY, 30-05-20074
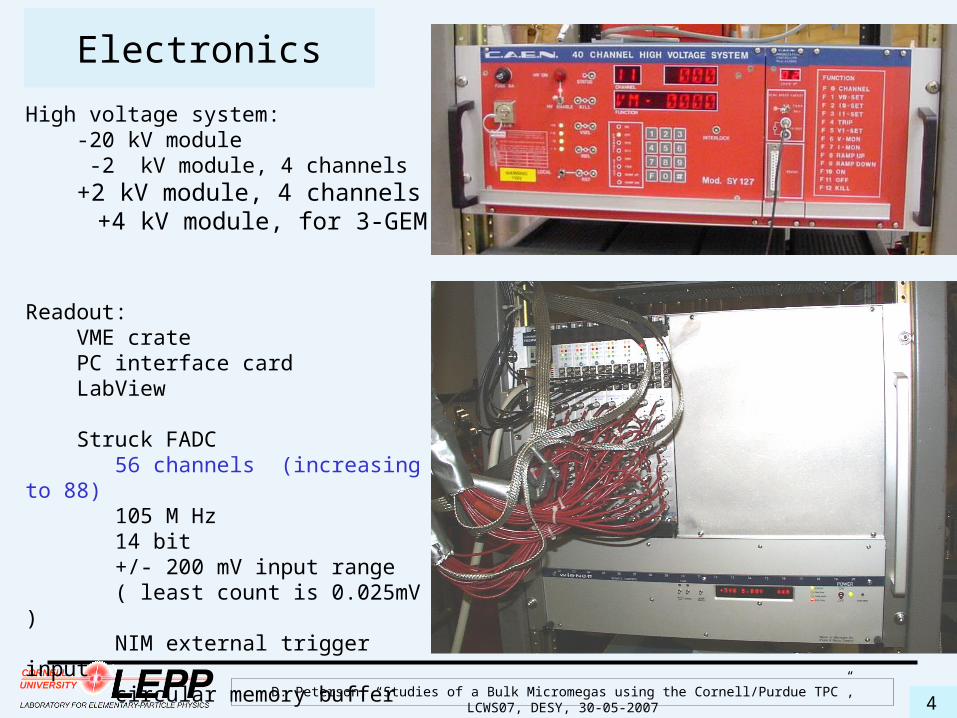
Electronics
High voltage system: -20 kV module -2 kV module, 4 channels +2 kV module, 4 channels +4 kV module, for 3-GEM
Readout: VME crate PC interface card LabView
Struck FADC 56 channels (increasing to 88) 105 M Hz 14 bit +/- 200 mV input range ( least count is 0.025mV ) NIM external trigger input circular memory buffer

D. Peterson, “Studies of a Bulk Micromegas using the Cornell/Purdue TPC”, LCWS07, DESY, 30-05-20075
TPC pad boardPad board with 2 mm pads.
80 pads on the board
4 layers of 2mm pads
5 layer of 5mm pads for track definition
For this data set, limited to 56 channels
use 6 layers: 3 @ 2 mm width 3 @ 5 mm width.
Resolution measurements are derived from the difference in residuals on adjacent 2mm pad rows.

D. Peterson, “Studies of a Bulk Micromegas using the Cornell/Purdue TPC”, LCWS07, DESY, 30-05-20076
Micromegas amplification
The “bulk Micromegas”, was prepared on one of our pad boards by Paul Colas’ group.
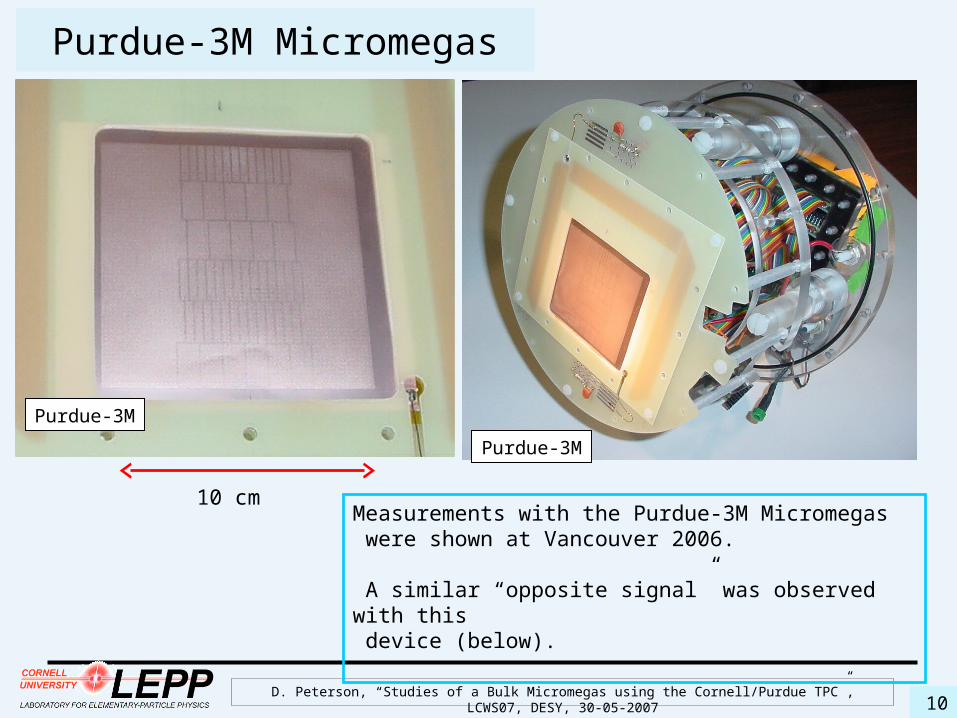
Measurements with the Purdue-3M Micromegas were shown at Vancouver 2006.
bulk
10 cm
bulk

D. Peterson, “Studies of a Bulk Micromegas using the Cornell/Purdue TPC”, LCWS07, DESY, 30-05-20077
Micromegas amplification The Micromegas is located 0.78 cm from the field cage termination.
HV is distributed to the pads; note blocking capacitors, HV resistors.
Low voltage signals routed to preamps outside (on ribbon cable).
Micromegas is at ground; pads at +410V for Ar-isoC4H10 (7%).
D. Peterson, “Studies of a Bulk Micromegas using the Cornell/Purdue TPC”, LCWS07, DESY, 30-05-20078
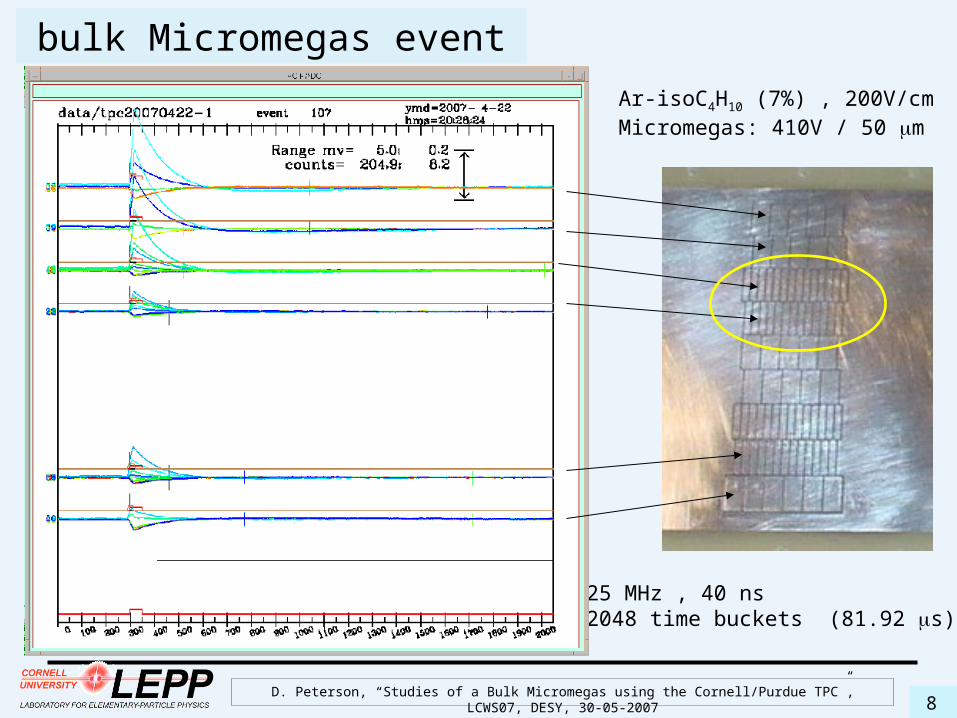
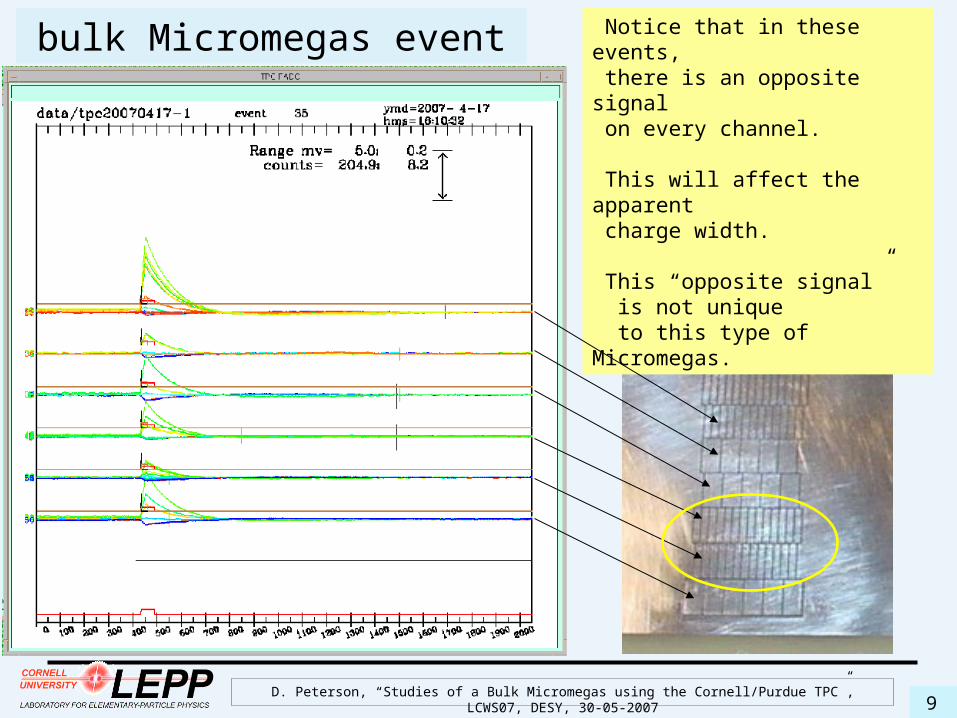
bulk Micromegas event
25 MHz , 40 ns 2048 time buckets (81.92 s)
Ar-isoC4H10 (7%) , 200V/cmMicromegas: 410V / 50 m
D. Peterson, “Studies of a Bulk Micromegas using the Cornell/Purdue TPC”, LCWS07, DESY, 30-05-20079
bulk Micromegas event Notice that in these events, there is an opposite signal on every channel.
This will affect the apparent charge width.
This “opposite signal” is not unique to this type of Micromegas.
D. Peterson, “Studies of a Bulk Micromegas using the Cornell/Purdue TPC”, LCWS07, DESY, 30-05-200710
Purdue-3M Micromegas
Measurements with the Purdue-3M Micromegas were shown at Vancouver 2006.
A similar “opposite signal” was observed with this device (below).
Purdue-3M
10 cm
Purdue-3M
D. Peterson, “Studies of a Bulk Micromegas using the Cornell/Purdue TPC”, LCWS07, DESY, 30-05-200711
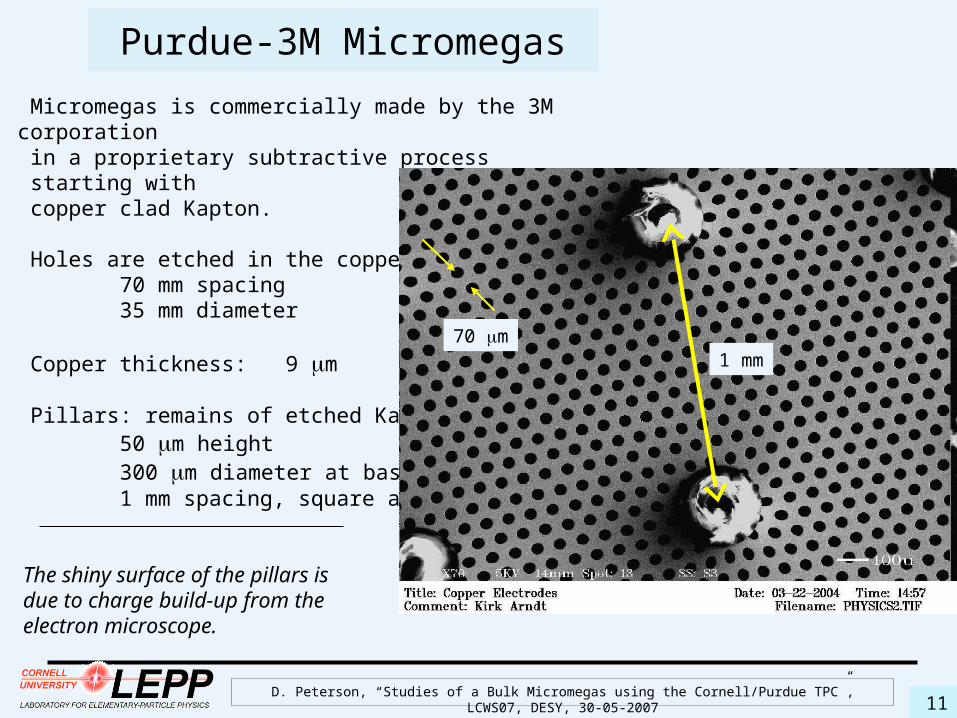
Purdue-3M Micromegas
Micromegas is commercially made by the 3M corporation in a proprietary subtractive process starting with copper clad Kapton.
Holes are etched in the copper 70 mm spacing 35 mm diameter
Copper thickness: 9 m
Pillars: remains of etched Kapton. 50 m height 300 m diameter at base 1 mm spacing, square array
The shiny surface of the pillars is due to charge build-up from the electron microscope.
1 mm70 m
D. Peterson, “Studies of a Bulk Micromegas using the Cornell/Purdue TPC”, LCWS07, DESY, 30-05-200712
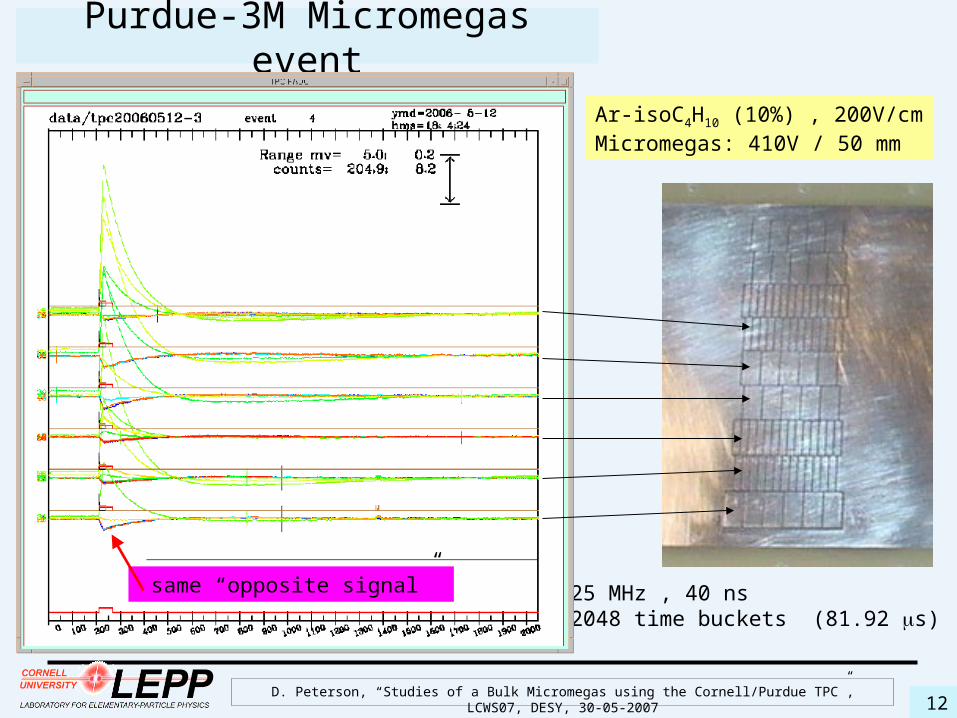
Purdue-3M Micromegas event
25 MHz , 40 ns 2048 time buckets (81.92 s)
Ar-isoC4H10 (10%) , 200V/cmMicromegas: 410V / 50 mm
same “opposite signal”
D. Peterson, “Studies of a Bulk Micromegas using the Cornell/Purdue TPC”, LCWS07, DESY, 30-05-200713
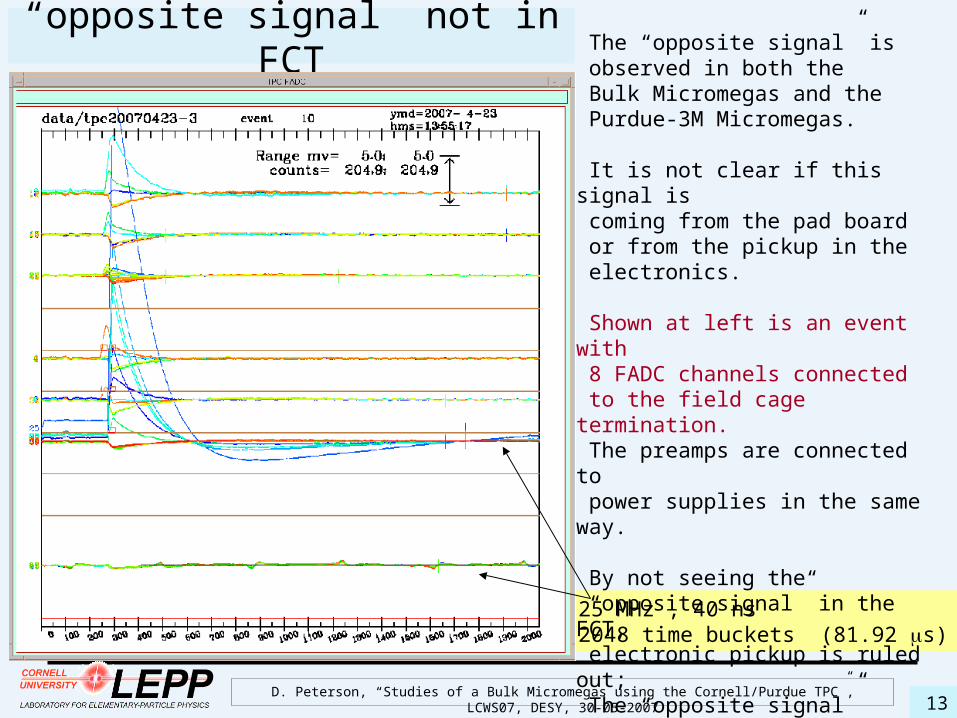
“opposite signal” not in FCT
25 MHz , 40 ns 2048 time buckets (81.92 s)
The “opposite signal” is observed in both the Bulk Micromegas and the Purdue-3M Micromegas.
It is not clear if this signal is coming from the pad board or from the pickup in the electronics.
Shown at left is an event with 8 FADC channels connected to the field cage termination. The preamps are connected to power supplies in the same way.
By not seeing the “opposite signal” in the FCT, electronic pickup is ruled out; The “opposite signal” originates at the pads.
D. Peterson, “Studies of a Bulk Micromegas using the Cornell/Purdue TPC”, LCWS07, DESY, 30-05-200714
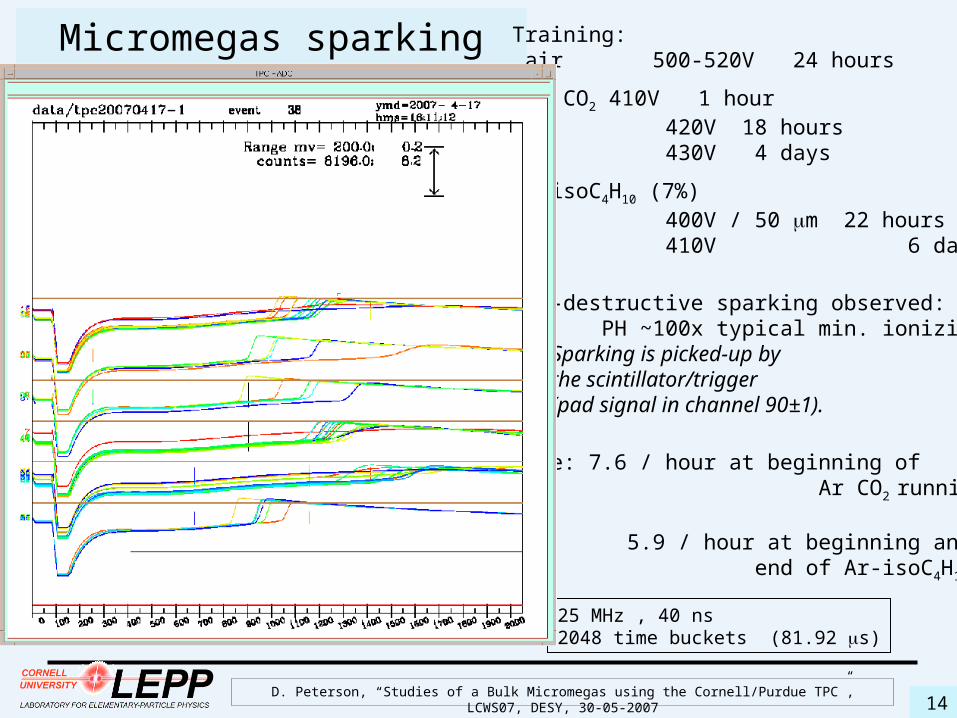
Micromegas sparking
25 MHz , 40 ns 2048 time buckets (81.92 s)
Training: air 500-520V 24 hours
Ar CO2 410V 1 hour 420V 18 hours 430V 4 days
Ar-isoC4H10 (7%) 400V / 50 m 22 hours 410V 6 days
Non-destructive sparking observed: PH ~100x typical min. ionizing. Sparking is picked-up by the scintillator/trigger (pad signal in channel 90±1).
Rate: 7.6 / hour at beginning of Ar CO2 running
5.9 / hour at beginning and end of Ar-isoC4H10 .
D. Peterson, “Studies of a Bulk Micromegas using the Cornell/Purdue TPC”, LCWS07, DESY, 30-05-200715
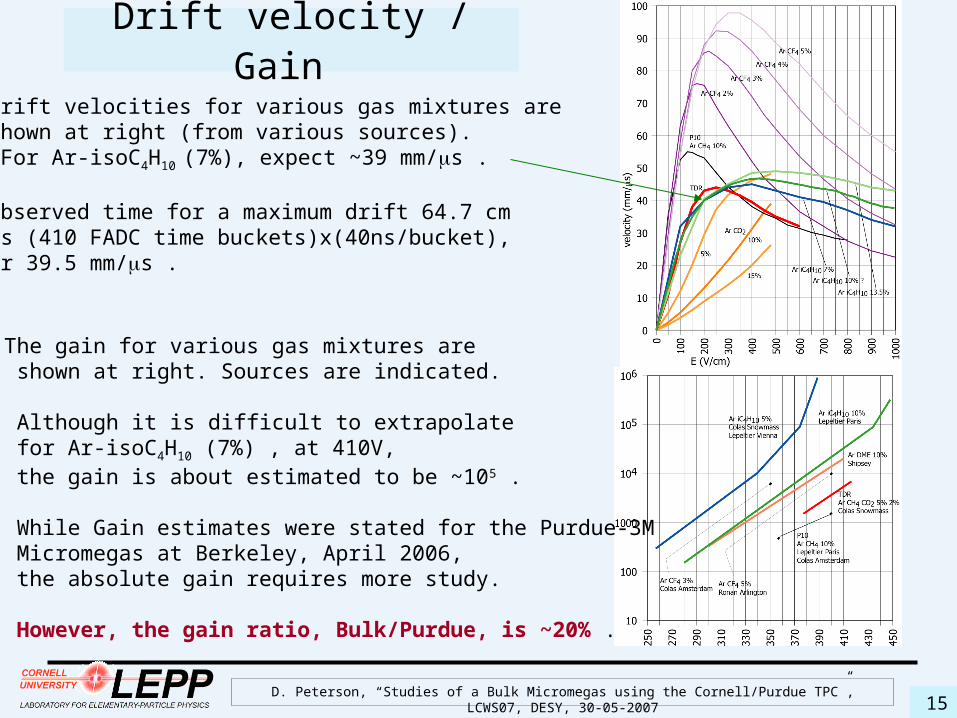
Drift velocity / Gain Drift velocities for various gas mixtures are shown at right (from various sources). For Ar-isoC4H10 (7%), expect ~39 mm/s .
Observed time for a maximum drift 64.7 cm is (410 FADC time buckets)x(40ns/bucket), or 39.5 mm/s .
The gain for various gas mixtures are shown at right. Sources are indicated.
Although it is difficult to extrapolate for Ar-isoC4H10 (7%) , at 410V, the gain is about estimated to be ~105 .
While Gain estimates were stated for the Purdue-3M Micromegas at Berkeley, April 2006, the absolute gain requires more study. However, the gain ratio, Bulk/Purdue, is ~20% .
D. Peterson, “Studies of a Bulk Micromegas using the Cornell/Purdue TPC”, LCWS07, DESY, 30-05-200716
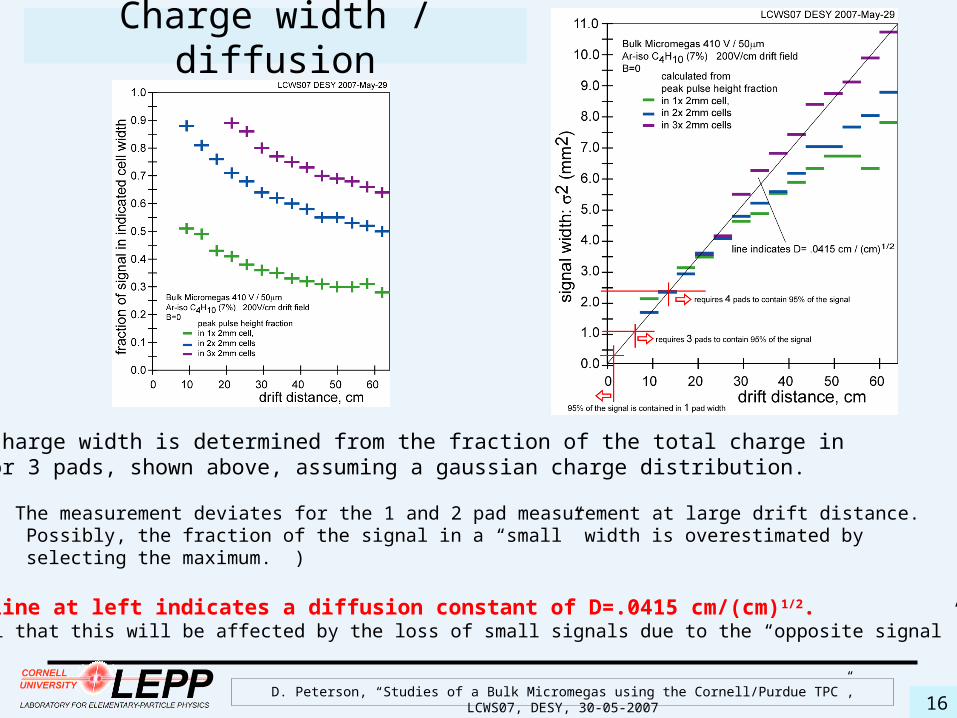
Charge width / diffusion
The charge width is determined from the fraction of the total charge in 1,2 or 3 pads, shown above, assuming a gaussian charge distribution.
( The measurement deviates for the 1 and 2 pad measurement at large drift distance. Possibly, the fraction of the signal in a “small” width is overestimated by selecting the maximum. )
The line at left indicates a diffusion constant of D=.0415 cm/(cm)1/2. (Recall that this will be affected by the loss of small signals due to the “opposite signal”.)
D. Peterson, “Studies of a Bulk Micromegas using the Cornell/Purdue TPC”, LCWS07, DESY, 30-05-200717
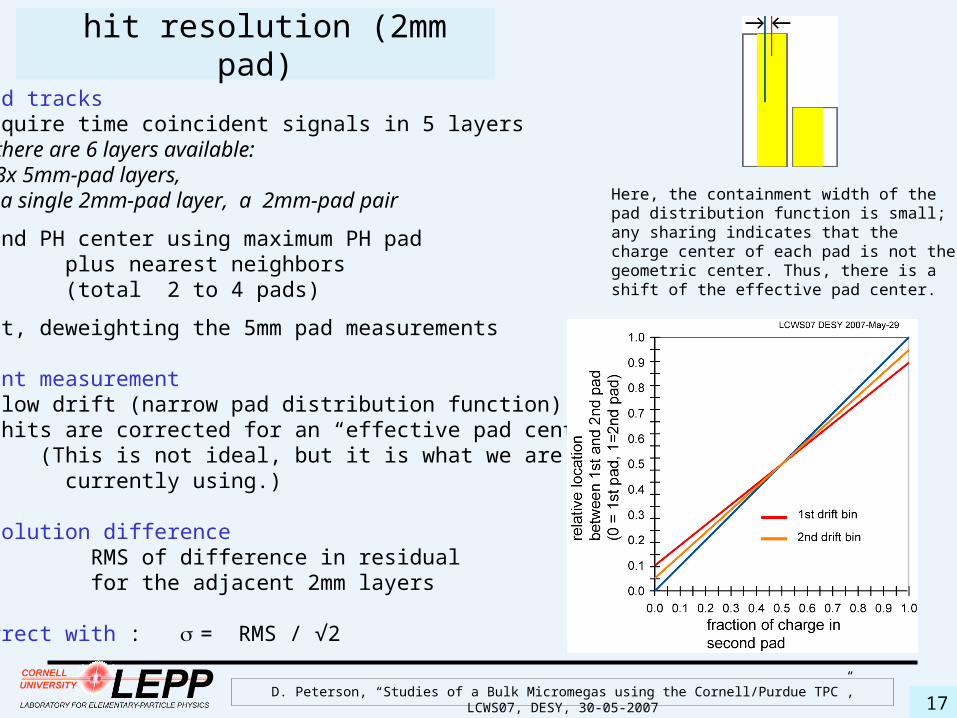
hit resolution (2mm pad)
find tracks require time coincident signals in 5 layers there are 6 layers available: 3x 5mm-pad layers, a single 2mm-pad layer, a 2mm-pad pair
find PH center using maximum PH pad plus nearest neighbors (total 2 to 4 pads)
fit, deweighting the 5mm pad measurements
point measurement low drift (narrow pad distribution function) hits are corrected for an “effective pad center” (This is not ideal, but it is what we are currently using.)
resolution difference RMS of difference in residual for the adjacent 2mm layers
correct with : = RMS / √2
Here, the containment width of the pad distribution function is small; any sharing indicates that the charge center of each pad is not the geometric center. Thus, there is a shift of the effective pad center.
D. Peterson, “Studies of a Bulk Micromegas using the Cornell/Purdue TPC”, LCWS07, DESY, 30-05-200718
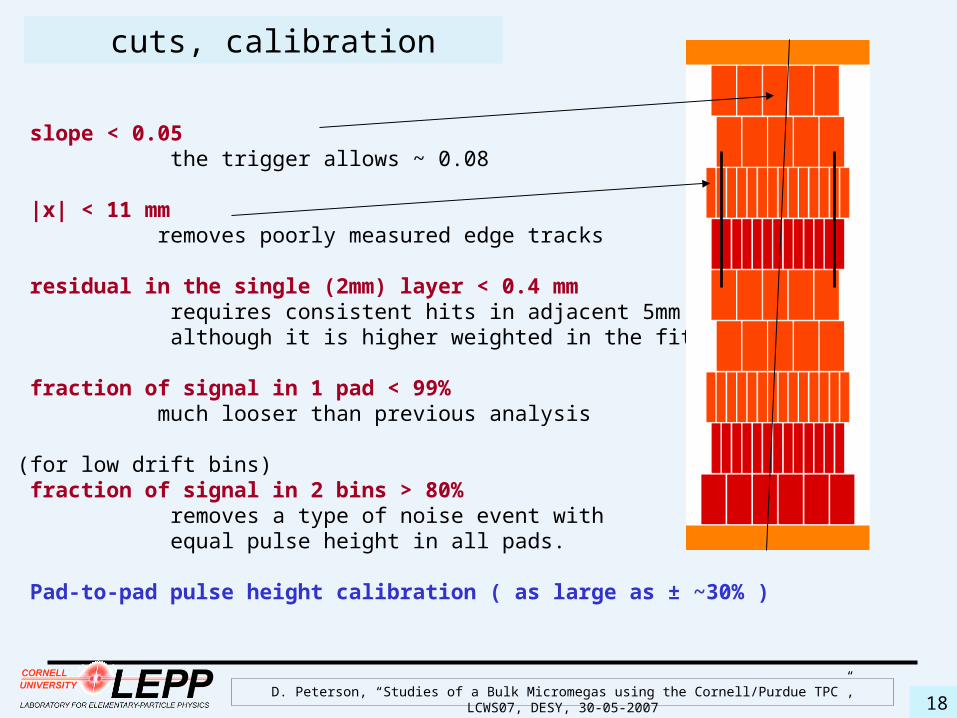
cuts, calibration
slope < 0.05 the trigger allows ~ 0.08 |x| < 11 mm removes poorly measured edge tracks
residual in the single (2mm) layer < 0.4 mm requires consistent hits in adjacent 5mm layers although it is higher weighted in the fit
fraction of signal in 1 pad < 99% much looser than previous analysis (for low drift bins) fraction of signal in 2 bins > 80% removes a type of noise event with equal pulse height in all pads.
Pad-to-pad pulse height calibration ( as large as ± ~30% )
D. Peterson, “Studies of a Bulk Micromegas using the Cornell/Purdue TPC”, LCWS07, DESY, 30-05-200719
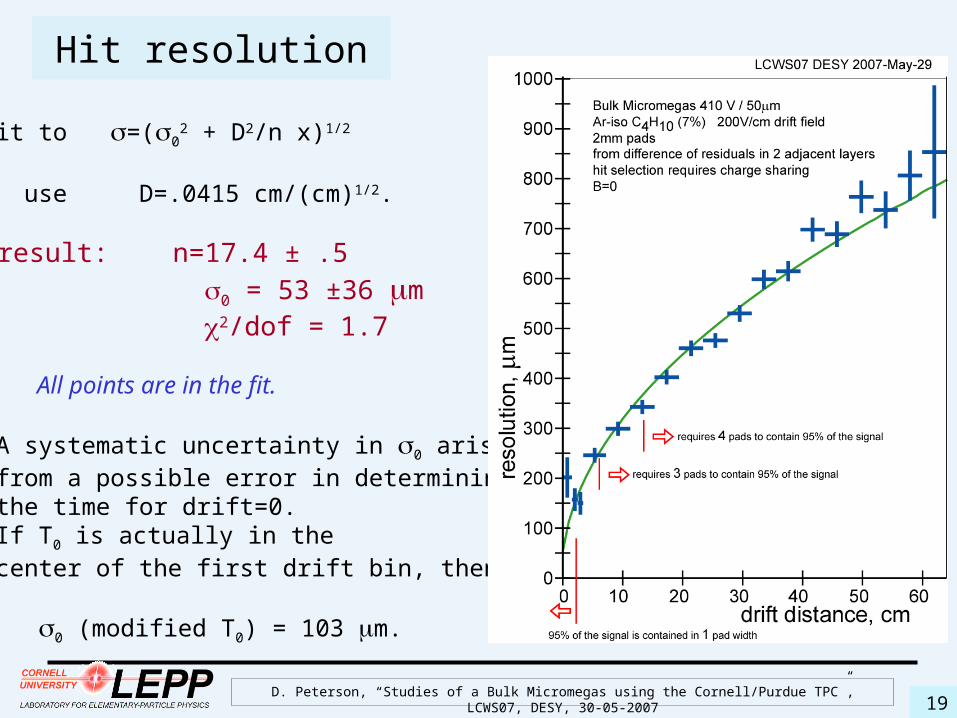
Hit resolution
Fit to =(02 + D2/n x)1/2
use D=.0415 cm/(cm)1/2.
result: n=17.4 ± .5 0 = 53 ±36 m 2/dof = 1.7
All points are in the fit. A systematic uncertainty in 0 arises from a possible error in determining the time for drift=0. If T0 is actually in the center of the first drift bin, then 0 (modified T0) = 103 m.
D. Peterson, “Studies of a Bulk Micromegas using the Cornell/Purdue TPC”, LCWS07, DESY, 30-05-200720
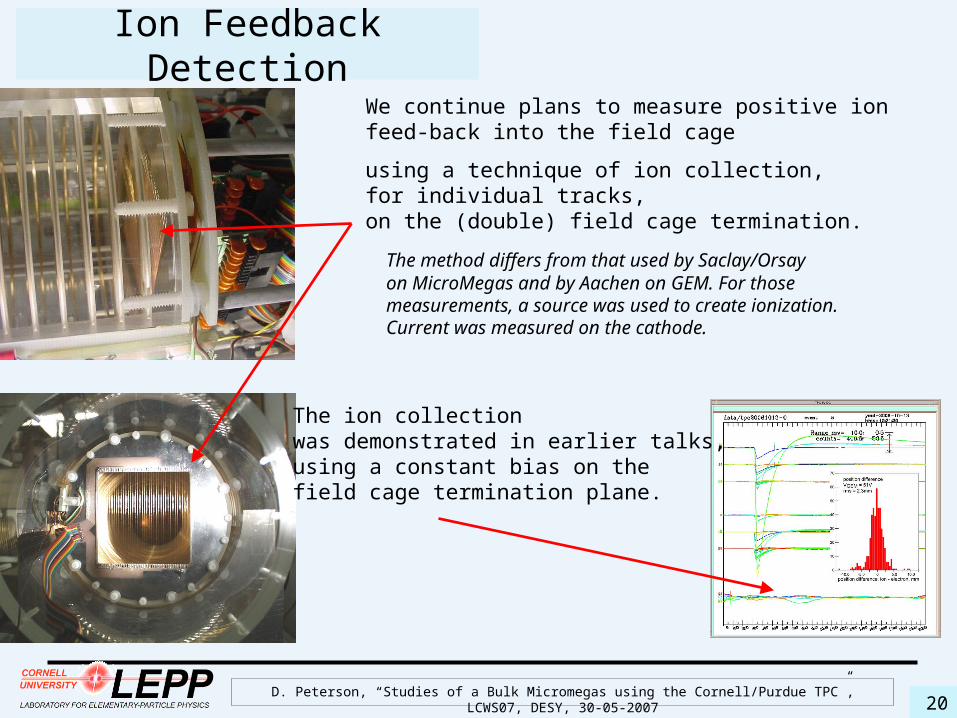
Ion Feedback Detection
We continue plans to measure positive ion feed-back into the field cage
using a technique of ion collection, for individual tracks, on the (double) field cage termination.
The method differs from that used by Saclay/Orsay on MicroMegas and by Aachen on GEM. For those measurements, a source was used to create ionization. Current was measured on the cathode.
The ion collection was demonstrated in earlier talks, using a constant bias on the field cage termination plane.
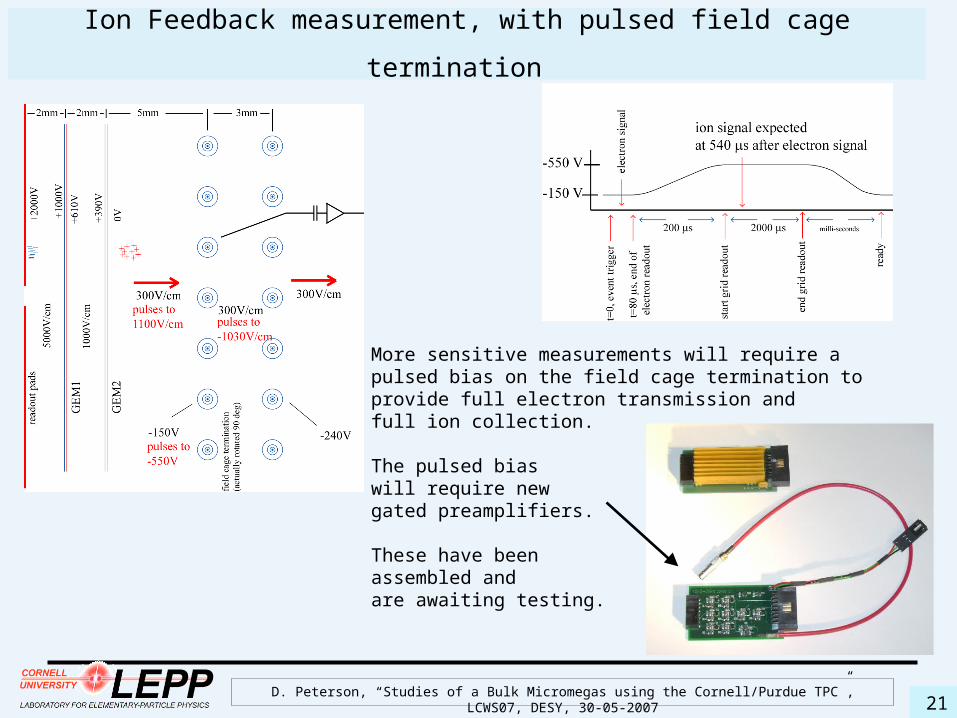
D. Peterson, “Studies of a Bulk Micromegas using the Cornell/Purdue TPC”, LCWS07, DESY, 30-05-200721
Ion Feedback measurement, with pulsed field cage termination
More sensitive measurements will require a pulsed bias on the field cage termination to provide full electron transmission and full ion collection.
The pulsed bias will require new gated preamplifiers.
These have been assembled and are awaiting testing.

D. Peterson, “Studies of a Bulk Micromegas using the Cornell/Purdue TPC”, LCWS07, DESY, 30-05-200722
Summary, outlook We have made measurements of the Bulk Micromegas.
Plan to repeat measurements of the Purdue-3M Micromegas with consistent conditions.
We plan to study a triple-GEM.
We are continuing plans for comparative measurements of ion feed-back. (graduate student) CLEO will end data taking April 2008 (after 28.5 years). Cornell proposals to reconfigure CESR for studies of a wiggler-dominated damping ring.
If this proposal is funded, the CLEO drift chamber will be removed from solenoid as part of the CESR reconfiguration. In that case, we will be able to run the small prototype in the 1.5 Tesla CLEO magnet, for resolution, and GEM ion/electron transmission studies. ( 4 weeks /year, maximum)