Embed Size (px)
Citation preview
PHENICX-WD-WP1-UPF-130315- DeliverableTemplate-1.2 Page 1 of 34 PHENICX_WD_WP1_DeliverableTemplate_20120314_MTG-UPF Page 1 of 34
D5.4 Discovery algorithms and models for social communities: Algorithms for inferring community structures and models of typical digital social communities
Grant Agreement nr 601166
Project title Performances as Highly Enriched aNd Interactive Concert
eXperiences
Project acronym PHENICX
Start date of project
(dur.)
Feb 1st, 2013 (3 years)
Document reference PHENICX-D-WP5-JKU-130731-
D5.4_DiscoveryAlgorithmsAndModelsForSocialCommunities
-03
Report availability PU - Public
Document due Date July 31th, 2014
Actual date of delivery July 31th, 2014
Leader JKU
Reply to Marko Tkalčič ([email protected])
Additional main
contributors (author’s
name / partner acr.)
Markus Schedl (JKU)
Cynthia Liem (TUD)
Mark Melenhorst (TUD)
Document status Final

PHENICX-WD-WP1-UPF-140520-DeliverableTemplate -1.2 Page 2 of 34
Project funded by ICT-7th Framework Program from the European Commission
Table of Contents
EXECUTIVE SUMMARY ......................................................................................................................... 3
1 BACKGROUND ..................................................................................................................................... 5
2 INTRODUCTION .................................................................................................................................. 6
2.1 MAIN OBJECTIVES AND GOALS .......................................................................................... 6
3 DATA ACQUISITION .......................................................................................................................... 6
4 USER CLUSTERING PROCEDURE .................................................................................................. 8
5 CLUSTERING USERS BASED ON DEMOGRAPHICS ................................................................. 8
6 CLUSTERING BASED ON MUSIC PREFERENCES .................................................................... 12
7 CLUSTERING BASED ON PREFERENCES OF SUPPORTING MULTIMEDIA MATERIAL ............................................................................................................................................... 18
8 CONCLUSION ..................................................................................................................................... 22
9 REFERENCES ...................................................................................................................................... 23
9.1 WRITTEN REFERENCES ....................................................................................................... 23
9.2 WEB REFERENCES ................................................................................................................. 23
9.3 TRADEMARKS AND COPYRIGHTS .................................................................................... 23
9.4 ACRONYMS AND ABBREVIATIONS.................................................................................. 23
10 APPENDIX ..................................................................................................................................... 24
10.1 LIST OF AUTHORS ................................................................................................................. 24
10.2 APPENDIX 2: USER STUDY SURVEY PAGES ................................................................. 25

PHENICX-WD-WP1-UPF-140520-DeliverableTemplate -1.2 Page 3 of 34
Executive Summary
This deliverable captures the work done on the segmentation of users within the WP5 work package (Profiling and personalisation). More specifically, the deliverable reflects the work done
in task T5.4 (Matching users at different levels of specificity).
The task T5.4 takes as input the data from task T5.1 (Mining user-related profile information),
where D5.2 (Standardized corpus of user profiling information) is reported, and provides part of
the inputs for the task T6.2 (Personalized multimodal information system).
This deliverable presents methods for the discovery of social communities, i.e. how user group
together based on specific properties. The clustering of users is very important for the personalization part of the project, as it will provide the basis for the development of the
personalization algorithms.
The identification of user clusters in the feature space designed for this deliverable is of paramount importance for the design and development of the personalized multi-modal
information system.
One of the demonstrators of the personalized system will be the Use Case 1 “Digital Program
Notes”. In this demonstrator, a user will get a personalized set of supporting material (in forms of additional text, images or sounds about the performer, piece or composer). In order to develop
user modeling techniques for this kind of personalization a suitable dataset is required. As D5.1
and D5.2 showed, the consumption logs on mobile devices and the huge social media streams do not contain enough useful information to perform a satisfactory modeling of users for the
specific case of the personalized multimodal information system as foreseen in the DoW.
Hence, we carried out a user study to collect the needed features and user preferences. Based
on these data we performed user-clustering techniques to identify in which aspects users can be
grouped.
Bearing in mind, that the personalization will be included in the use case “Digital Program Notes”
where a collection of personalized supporting multimedia material will be delivered to the user based on his personal profile, we carried out a user study on Amazon Mechanical Turk. The
subjects were asked three set of questions: (i) demographics (age, gender, music listening behaviours, personality), (ii) general music preferences (genre preferences) and (iii) preferences
about supporting multimedia material. Tha latter was composed of a set of 14 conditions where
users were asked to rate different aspects of supporting multimedia items of different lengths(long/short), modalities (text, images, audio) and entities (composer, piece, performer).
In order to achieve the grouping of users as requested in the DoW we performed user clustering in three types of features: demographics, general music preferences, preferences about the
supporting multimedia material.
The following steps were carried out for each type of features:
Step 1: Principal component Analysis (PCA) to identify the variables that account for most
of the variance. This step was done for two reasons (i) dimensionality reduction and (ii)
identification of the variables with the highest variance, which are the candidates for clustering
Step 2: visual inspection of the distribution of data points (single- and pair-wise) In this
step we were inspecting visually the distributions of the data points within a single feature

PHENICX-WD-WP1-UPF-140520-DeliverableTemplate -1.2 Page 4 of 34
(histograms) and pair-wise. This inspection was important to visually identify the
clustering of data points as well as possible correlations between variables
Step 3: GMM clustering on the most variable features (pair-wise) In this last step we
performed the Gaussian Mixture Model (GMM) clustering with two clusters over pairs of
features
For the demographics features, data points did not show any natural pair-wise clusters, except
for the personality factors of extraversion and agreeableness where there appear to be two distinct clusters: (i) users with high extraversion and low agreeableness and (ii) users with low
extraversion and high agreeableness.
In the general music preferences set of features some of the genre features (avant-garde, heavy metal and rap) exhibit bimodal histograms, hence suggesting clustering of users into those that
like the genre and those who don’t like the genre. When observing the genre features pairwise and perform the clustering we observed that some genre pairs tend to produce clusters (e.g. the
latin-reggae, the international-latin, the electronic-new age or the country-religious pairs).
In the feature space of preferences about the supporting multimedia material the distributions of answers to the questions for each condition follow a bell-shaped curve. Due to the large number
of possible combinations the pairwise analysis has not been concluded yet as of the writing of this deliverable.
This deliverable will be used by tasks T6.2 (Personalized multimodal information system), tasks
T7.1 and T7.2 (especially the demonstrator UC1: Digital Program Notes).
The following steps need to be taken in order to reach fully functional user models for the
personalized system:
Perform a more in-depth cluster analysis of clustering for the supporting MM material
group of features
Apply cluster quality measures (e.g. between-variance-within-variance ratio)
Perform regression analysis to develop predictive models from independent variables
(which can be acquired through initial questionnaires, past usage or cross-domain) to dependant variables (preferences about the supporting multimedia material)

PHENICX-WD-WP1-UPF-140520-DeliverableTemplate -1.2 Page 5 of 34
1 BACKGROUND
This deliverable captures the work done on the segmentation of users within the WP5 work
package (Profiling and personalisation). More specifically, the deliverable reflects the work done in task T5.4 (Matching users at different levels of specificity).
The task T5.4 takes as input the data from task T5.1 (Mining user-related profile information),
where D5.2 (Standardized corpus of user profiling information) is reported, and provides part of the inputs for the task T6.2 (Personalized multimodal information system).
This deliverable presents methods for the discovery of social communities, i.e. how user group together based on specific properties. The clustering of users is very important for the
personalization part of the project, as it will provide the basis for the development of the
personalization algorithms.
According to the description of work, this deliverable requires to address:
Relating users to each other based on differing profile attributes, such as demographics,
taste
Relating users to each other through user’s relation to musical items, which can consider
topics such as familiarity with a musical item, and general interaction information
The expected result is a multi-faceted and flexible addressing of user-user and user-item-user similarity.
As reported in the deliverable D5.1 social media streams contain little information about classical
music usage. Also, as reported in D5.2, mobile users rarely consume classical music. Hence, in addition to the corpora reported in these two deliverables, we collected additional data in order
to gain insights into users preferences and consequently be able to devise methods for the discovery and modeling of social communities.
Furthermore, the personalization process will be shown in the demonstrator “Digital Program
Notes” (UC1).
In this deliverable we report the acquisition of the required data through a user study and the
analysis of the clustering of users on this dataset.

PHENICX-WD-WP1-UPF-140520-DeliverableTemplate -1.2 Page 6 of 34
2 INTRODUCTION
2.1 Main objectives and goals
The main objective of this deliverable is to report on the data and methods employed to perform user-clustering techniques. The identification of user clusters in the feature space designed for
this deliverable is of paramount importance for the design and development of the personalized multi-modal information system.
One of the demonstrators of the personalized system will be the Use Case 1 “Digital Program Notes”. In this demonstrator, a user will get a personalized set of supporting material (in forms
of additional text, images or sounds about the performer, piece or composer). In order to develop
user modeling techniques for this kind of personalization a suitable dataset is required. As D5.1 and D5.2 showed, the consumption logs on mobile devices and the huge social media streams
do not contain enough useful information to perform a satisfactory modeling of users for the specific case of the personalized multimodal information system as foreseen in the DoW.
Hence, we carried out a user study to collect the needed features and user preferences. Based
on these data we performed user-clustering techniques to identify in which aspects users can be grouped.
In this document we first present the acquisition of the data required (Sec. 3). Then we outline
the clustering technique involved (Sec. 4). Finally, we present the outcomes of the clustering
techniques in Sects. 5, 6 and 7.
3 DATA ACQUISITION
When designing the data acquisition we had in mind the use case “Digital Program Notes” where
a collection of personalized supporting multimedia material will be delivered to the user based on
his personal profile. Hence, a user study has been conducted with 167 participants, mostly from the US. The subjects were put in a set of conditions that reflected combinations of three variables
with the following values (lengths):
- Textual information (long/short)
- Audio information (single/multiple) - Pictures (single/many)
The variables were related to the following entities:
- Composer - Orchestra
- Piece In total we had 14 conditions:

PHENICX-WD-WP1-UPF-140520-DeliverableTemplate -1.2 Page 7 of 34
condition
ID length modality entity
1 long text composer
2 short text composer
3 short image composer
4 long image composer
5 long audio composer
6 short text piece
7 long text piece
8 short image piece
9 long image piece
10 short text orchestra
11 long text orchestra
12 short image orchestra
13 long image orchestra
18 long audio piece
Furthermore we collected features that we hypothesized could be good predictors of the users'
clusters. We collected two more groups of data: (i) demographics and (ii) music preferences.
In the demographics section, we asked the users to provide us with the following information:
- Age - Gender
- Time spent listening to classical music - Time spent listening to non-classical music
- Time spent playing an instrument
- Musical education - Number of attended classical concets
- Number of attended non-classical concerts
Furthermore, we asked the subjects to fill in the Ten-Items-Personality questionnaire [tipi] to
assess their personality profiles in terms of the Five Factor Personality Model (FFM) [Gosling et al. 2003].
In the music preferences section we asked the subjects to express their preferences towards
some music genres. The set of genres was selected from the most popular genres at the Last.fm
website.
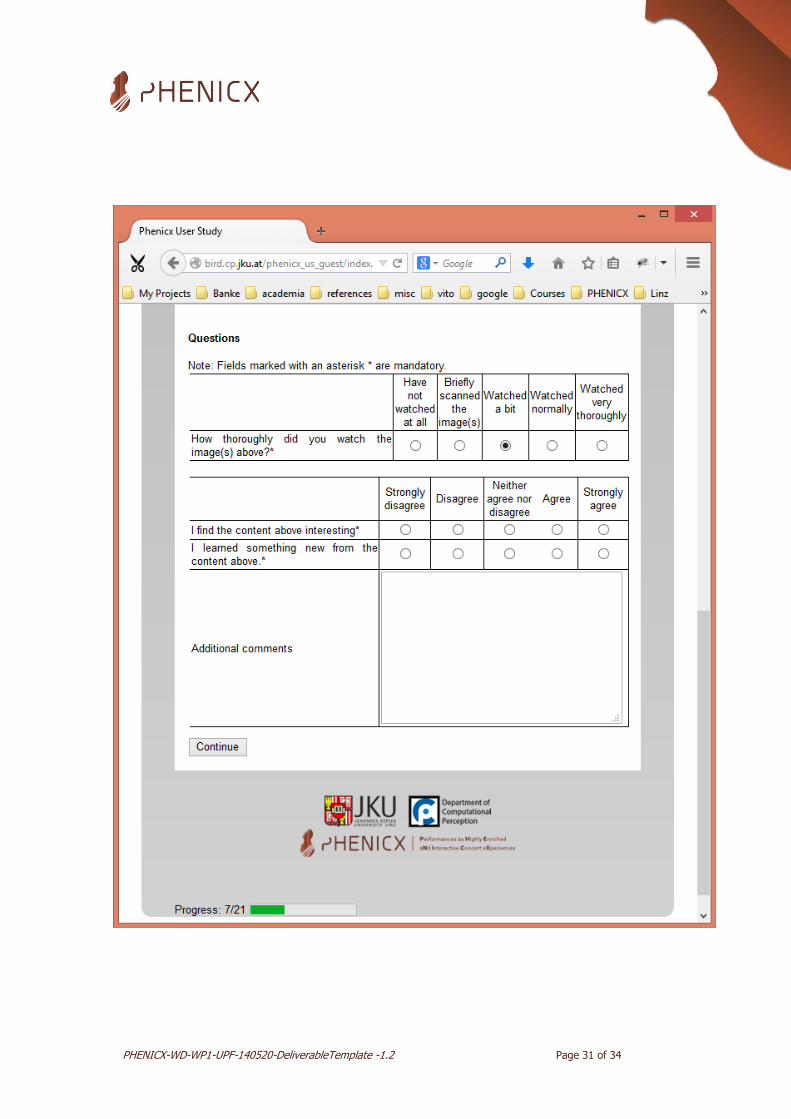
The user-study web survey is available here: http://bird.cp.jku.at/phenicx_us_guest/ [survey] Screenshots are in Appendix 10.2.
PHENICX-WD-WP1-UPF-140520-DeliverableTemplate -1.2 Page 8 of 34
4 USER CLUSTERING PROCEDURE
In order to achieve the grouping of users as requested in the DoW we performed user clustering
in three types of features: i. Demographics
ii. General music preferences
iii. Preferences about the supporting multimedia material
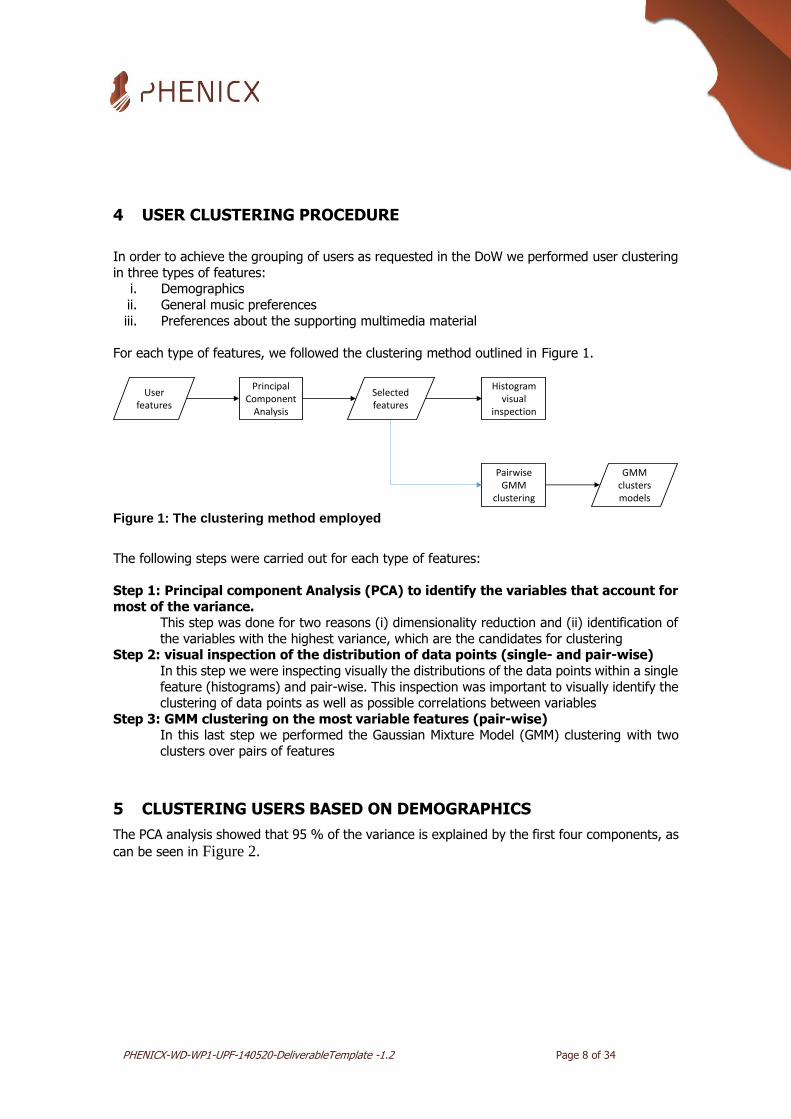
For each type of features, we followed the clustering method outlined in Figure 1.
Figure 1: The clustering method employed
The following steps were carried out for each type of features:
Step 1: Principal component Analysis (PCA) to identify the variables that account for
most of the variance. This step was done for two reasons (i) dimensionality reduction and (ii) identification of
the variables with the highest variance, which are the candidates for clustering Step 2: visual inspection of the distribution of data points (single- and pair-wise)
In this step we were inspecting visually the distributions of the data points within a single
feature (histograms) and pair-wise. This inspection was important to visually identify the clustering of data points as well as possible correlations between variables
Step 3: GMM clustering on the most variable features (pair-wise) In this last step we performed the Gaussian Mixture Model (GMM) clustering with two
clusters over pairs of features
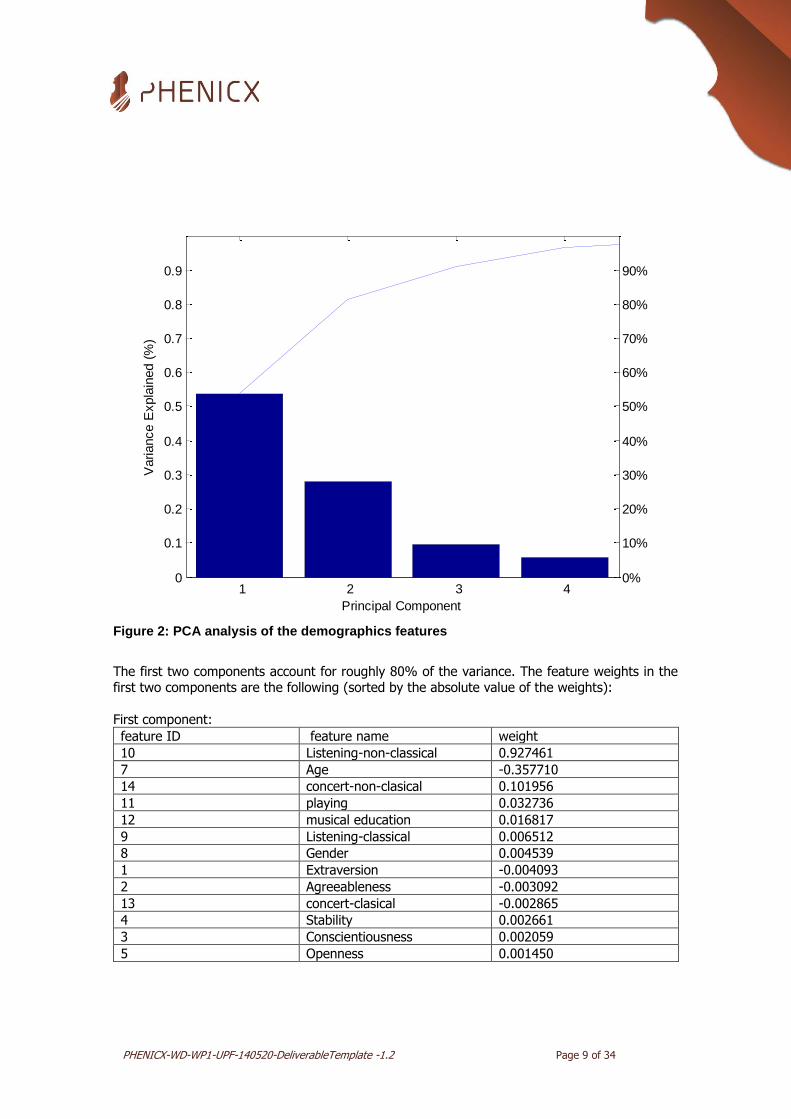
5 CLUSTERING USERS BASED ON DEMOGRAPHICS
The PCA analysis showed that 95 % of the variance is explained by the first four components, as
can be seen in Figure 2.
User features
Principal Component
Analysis
Selected features
Histogram visual
inspection
Pairwise GMM
clustering
GMM clusters models
PHENICX-WD-WP1-UPF-140520-DeliverableTemplate -1.2 Page 9 of 34
Figure 2: PCA analysis of the demographics features
The first two components account for roughly 80% of the variance. The feature weights in the first two components are the following (sorted by the absolute value of the weights):
First component:
feature ID feature name weight
10 Listening-non-classical 0.927461
7 Age -0.357710
14 concert-non-clasical 0.101956
11 playing 0.032736
12 musical education 0.016817
9 Listening-classical 0.006512
8 Gender 0.004539
1 Extraversion -0.004093
2 Agreeableness -0.003092
13 concert-clasical -0.002865
4 Stability 0.002661
3 Conscientiousness 0.002059
5 Openness 0.001450
1 2 3 40
0.1
0.2
0.3
0.4
0.5
0.6
0.7
0.8
0.9
Principal Component
Variance E
xpla
ined (
%)
0%
10%
20%
30%
40%
50%
60%
70%
80%
90%

PHENICX-WD-WP1-UPF-140520-DeliverableTemplate -1.2 Page 10 of 34
Second component:
feature ID feature name weight
7 Age 0.931621
10 Listening-non-classical 0.360512
12 musical education 0.029036
11 playing -0.026504
9 Listening-classical 0.017113
13 concert-clasical -0.011386
14 concert-non-clasical -0.008378
5 Openness -0.005510
8 Gender -0.003827
2 Agreeableness 0.003812
4 Stability 0.003533
1 Extraversion -0.001385
3 Conscientiousness 0.000743
Based on the above tables we selected those features that are present in the first two factors and have the absolute value of the weight higher than 0.1. These features are : 7 (age), 10
(listening non-classical), 14 (concert non-classical).
Furthermore, a visual inspection and the GMM clustering technique in the space of the first two
principal components suggest that users do not tend to group in clusters, as can be seen in
Figure 3.
Figure 3: GMM clustering on the first two PCA components of the demographics features
-40 -20 0 20 40 60 80 100-30
-20
-10
0
10
20
30
40
first PCA component
second P
CA
com
ponent
GMM clusters of the first two PCA components

PHENICX-WD-WP1-UPF-140520-DeliverableTemplate -1.2 Page 11 of 34
The visual inspection of the histograms of the observed features (Figure 4) suggest that the data
do not form clusters.
Figure 4: Histograms of the demographics features
A visual inspection of the pairwise plot of data points suggested that the data do not group in
clusters except for the features extraversion and agreeableness (Figure 5).
0 1 20
50
100Extraversion
0 1 20
50Agreeableness
0 0.5 1 1.50
50
100Conscientiousness
0 1 20
50
100Stability
0 1 20
50Openness
20 40 60 800
50Age
0 0.5 10
50
100Gender
0 5 100
100
200Listening-classical
5 15 253545 5565 7585950
100
200Listening-non-classical
0 10 20 300
100
200playing
0 20 400
100
200musical education
0 5 100
100
200concert-clasical
0 20 40 600
100
200concert-non-clasical

PHENICX-WD-WP1-UPF-140520-DeliverableTemplate -1.2 Page 12 of 34
Figure 5: GMM clusters in the agreeableness and extraversion features space
On our sample there appear to be two distinct clusters: users with high extraversion and low agreeableness and users with low extraversion and high agreeableness.
6 CLUSTERING BASED ON MUSIC PREFERENCES
The features used in the clustering based on music preferences are the features describing the
user preferences to various genres of music. The genres that define the features are: Avant-Garde
Blues
Classical
Country
Easy Listening
Electronic
Folk
Heavy Metal
International
Jazz
Latin
New Age
Pop/Rock
R&B
Rap
Reggae
-0.5 0 0.5 1 1.5 2
0
0.5
1
1.5
2
2.5
Extraversion
Agre
eable
ness
pdf(obj,[x,y])

PHENICX-WD-WP1-UPF-140520-DeliverableTemplate -1.2 Page 13 of 34
Religious
Vocal
As can be seen in Figure 6, the variance is more equally distributed over several components.
Figure 6: PCA of the features describing user genre preferences
PCA first component:
25 latin 0.308804
23 international 0.303600
24 jazz 0.289231
30 reggae 0.283428
16 blues 0.283175
28 rnb 0.279361
15 avant garde 0.264402
32 vocal 0.259802
29 rap 0.250575
18 country 0.247058
21 folk 0.243983
26 new age 0.205037
31 religious 0.202804
19 easy listening 0.186288
20 electronic 0.166741
17 classical 0.135895
27 pop rock 0.073136
22 heavy metal -0.000545
1 2 3 4 5 6 7 8 9 100
0.1
0.2
0.3
0.4
0.5
0.6
0.7
0.8
0.9
Principal Component
Variance E
xpla
ined (
%)
0%
10%
20%
30%
40%
50%
60%
70%
80%
90%

PHENICX-WD-WP1-UPF-140520-DeliverableTemplate -1.2 Page 14 of 34
PCA second component:
22 heavy metal 0.521260
18 country -0.391733
19 easy listening -0.375172
31 religious -0.366743
30 reggae 0.274788
20 electronic 0.274458
29 rap 0.229055
32 vocal -0.200794
16 blues 0.124734
15 avant garde 0.114366
23 international 0.099874
25 latin -0.078235
28 rnb 0.064448
24 jazz 0.054952
27 pop rock -0.046903
21 folk 0.039674
17 classical -0.012432
26 new age 0.011101
Distribution and GMM clustering of the first two PCA components reveals a tendency to cluster
into two groups, although very close, as shown in Figure 7.
Figure 7: Clustering in the space of the first two PCA components of the genre preferences space
-12 -10 -8 -6 -4 -2 0 2 4 6 8-5
-4
-3
-2
-1
0
1
2
3
4
5
first PCA component
second P
CA
com
ponent
GMM clusters of the first two PCA components

PHENICX-WD-WP1-UPF-140520-DeliverableTemplate -1.2 Page 15 of 34
The histograms are presented in Figure 8, the distributions of preferences for genres have
different patterns. While most of the genres exhibit a somewhat bell-shaped distribution, some
of the genres appear exhibit a bimodal histogram, implying that users tend to cluster into those who like the genre and those who don’t like the genre (e.g. avant-garde, heavy metal or rap).
Figure 8: Distribution of genre preferences among users
Some combinations of genre features tend to create clusters of users as can be seen in Figure
9 (latin-reggae), Figure 10 (international-latin), Figure 11 (electronic-new age) or Figure 12
(country-religious).
0 50
50
100avant garde
0 50
50
100blues
0 50
50
100classical
0 50
50country
0 50
50
100easy listening
0 50
50
100electronic
0 50
50folk
0 50
50heavy metal
0 50
50international
0 50
50
100jazz
0 50
50latin
0 50
50new age
0 50
50
100pop rock
0 50
50
100rnb
0 50
50rap
0 50
50reggae
0 50
50
100religious
0 50
50
100vocal

PHENICX-WD-WP1-UPF-140520-DeliverableTemplate -1.2 Page 16 of 34
Figure 9: Clusters in the latin-reggae feature space
Figure 10: Clusters in the international-latin feature space
-1 0 1 2 3 4 5 6-1
0
1
2
3
4
5
6
latin
reggae
-1 0 1 2 3 4 5 6-1
0
1
2
3
4
5
6
international
latin

PHENICX-WD-WP1-UPF-140520-DeliverableTemplate -1.2 Page 17 of 34
Figure 11: clusters in the elctronic-new age feature space
Figure 12: Clusters in the country-religious feature space
-1 0 1 2 3 4 5 6-1
0
1
2
3
4
5
6
electronic
new
age
-1 0 1 2 3 4 5 6-1
0
1
2
3
4
5
6
country
relig
ious

PHENICX-WD-WP1-UPF-140520-DeliverableTemplate -1.2 Page 18 of 34
7 CLUSTERING BASED ON PREFERENCES OF SUPPORTING MULTIMEDIA MATERIAL
In terms of supporting multimedia material, we want to discover how users form clusters based
on two aspects of the supporting MM item: likeness and novelty. In fact, for each of the items in the user study, we asked the users two questions:
1. »I find the content above interesting« to measure how much the user liked the item 2. »I learned something new from the content above.« to measure if the item was novel to
the user
Also for each of the items we also asked the users how much of the items did she/he consume. Hence, for each item (condition in the user study) we had therefore three features: the
consumption, the likeness and the novelty. Given 14 conditions, we had a total of 42 features.
The PCA revealed that the first component explains much more variance (more than 30%) than
the other components (each less than 10 %). The threshold of 95% of the whole variance is reached with the first ten components (out of 42 variables).
The coding of the feature names was done by merging the condition ID and the question type. For each condition, the user was asked three questions. Beside the two questions mentioned
above we also asked how much of the item the user has consumed. The conditoin ID and the question are separated by a hyphen. Hence the variable name »c5-A2« means »condition 5,
answer 2«. The coding scheme is outlined in Table 1.
1 2 3 4 5 6 7 8 9 100
0.1
0.2
0.3
0.4
0.5
0.6
0.7
0.8
0.9
Principal Component
Variance E
xpla
ined (
%)
0%
10%
20%
30%
40%
50%
60%
70%
80%
90%

PHENICX-WD-WP1-UPF-140520-DeliverableTemplate -1.2 Page 19 of 34
condition
ID length modality entity
consumption question 1
(likeness)
question 2
(novelty)
1 long text composer c1-consumption c1-A1 c1-A2
2 short text composer c2-consumption c2-A1 c2-A2
3 short image composer c3-consumption c3-A1 c3-A2
4 long image composer c4-consumption c4-A1 c4-A2
5 long audio composer c5-consumption c5-A1 c5-A2
6 short text piece c6-consumption c6-A1 c6-A2
7 long text piece c7-consumption c7-A1 c7-A2
8 short image piece c8-consumption c8-A1 c8-A2
9 long image piece c9-consumption c9-A1 c9-A2
10 short text orchestra c10-consumption c10-A1 c10-A2
11 long text orchestra c11-consumption c11-A1 c11-A2
12 short image orchestra c12-consumption c12-A1 c12-A2
13 long image orchestra c13-consumption c13-A1 c13-A2
18 long audio piece c18-consumption c18-A1 c18-A2
Table 1: Feature names coding table
The first PCA component is composed as follows:
34 c1-A1 0.236708
33 c1-consumption 0.230158
51 c7-A1 0.217614
46 c5-A1 0.203067
37 c2-A1 0.202655
63 c11-A1 0.200896
73 c18-A2 0.195757
60 c10-A1 0.193796
64 c11-A2 0.193683
50 c7-consumption 0.193269
35 c1-A2 0.192121
45 c5-A1 0.188850
52 c7-A2 0.184513
48 c6-A1 0.179007
62 c11-consumption 0.178515
40 c3-A1 0.172805
67 c12-A2 0.166570
41 c3-A2 0.165165
72 c18-A1 0.158511
38 c2-A2 0.152254
36 c2-consumption 0.137092
PHENICX-WD-WP1-UPF-140520-DeliverableTemplate -1.2 Page 20 of 34
55 c8-A2 0.130973
58 c9-A2 0.128763
43 c4-A2 0.128714
61 c10-A2 0.128081
71 c18-consumption 0.123146
39 c3-consumption 0.121113
49 c6-A2 0.120396
57 c9-A1 0.118104
42 c4-consumption 0.114457
44 c5-consumption 0.114398
65 c12-consumption 0.109351
53 c8-consumption 0.105658
70 c13-A2 0.103594
54 c8-A1 0.103187
56 c9-consumption 0.099231
66 c12-A1 0.098989
68 c13-consumption 0.094569
59 c10-consumption 0.094564
47 c6-consumption 0.087937
69 c13-A1 0.082330
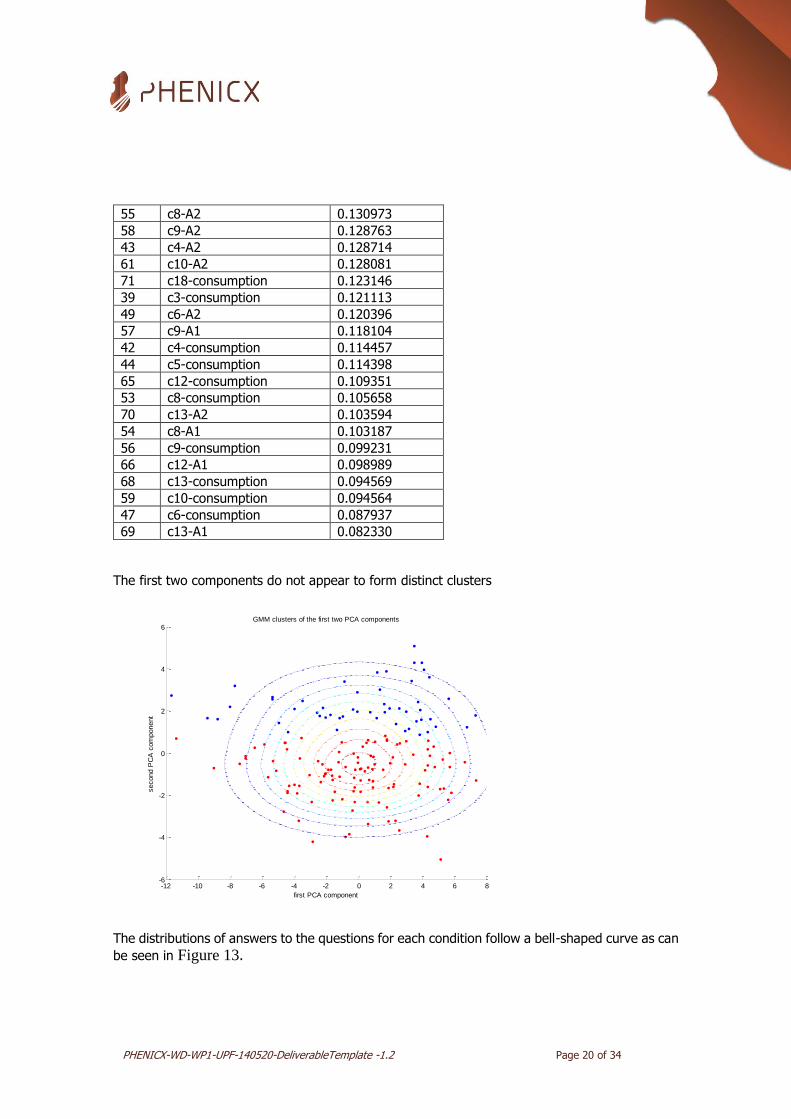
The first two components do not appear to form distinct clusters
The distributions of answers to the questions for each condition follow a bell-shaped curve as can
be seen in Figure 13.
-12 -10 -8 -6 -4 -2 0 2 4 6 8-6
-4
-2
0
2
4
6
first PCA component
second P
CA
com
ponent
GMM clusters of the first two PCA components

PHENICX-WD-WP1-UPF-140520-DeliverableTemplate -1.2 Page 21 of 34
Figure 13: Histograms of the 42 features on preferences of the supporting multimodal material
Due to the large number of possible combinations, the pairwise analysis has not been concluded
yet as of the writing of this deliverable.
0 50
50100
c1-consumption
0 50
50100
c1-A1
0 50
50100
c1-A2
0 50
100200
c2-consumption
0 50
50100
c2-A1
0 50
50100
c2-A2
0 50
50100
c3-consumption
0 50
50100
c3-A1
0 50
50100
c3-A2
0 50
50100
c4-consumption
0 50
50100
c4-A2
0 50
50100
c5-consumption
0 50
50100
c5-A1
0 50
50100
c5-A1
0 50
100200
c6-consumption
0 50
50100
c6-A1
0 50
50100
c6-A2
0 50
50100
c7-consumption
0 50
50100
c7-A1
0 50
50100
c7-A2
0 50
50100
c8-consumption
0 50
50100
c8-A1
0 50
50100
c8-A2
0 50
50100
c9-consumption
0 50
50100
c9-A1
0 50
50100
c9-A2
0 50
100200
c10-consumption
0 50
50100
c10-A1
0 50
50100
c10-A2
0 50
50100
c11-consumption
0 50
50100
c11-A1
0 50
50100
c11-A2
0 50
50100
c12-consumption
0 50
100200
c12-A1
0 50
50100
c12-A2
0 50
50100
c13-consumption
0 50
50100
c13-A1
0 50
50100
c13-A2
0 50
50100
c18-consumption
0 50
50100
c18-A1
0 50
50100
c18-A2

PHENICX-WD-WP1-UPF-140520-DeliverableTemplate -1.2 Page 22 of 34
8 CONCLUSION
In this deliverable, we presented the outcomes of the data collection and clustering of users
based on demographics, genre preferences and preferences about the supporting multimedia materials.
The analysis of user clusters, done using GMM, showed that users generally do not tend to form distinctive clusters, except for certain personality traits (extraversion-agreeableness) and genre
preferences (e.g. country-religious).
This deliverable will be used by tasks T6.2 (Personalized multimodal information system), tasks
T7.1 and T7.2 (especially the demonstrator UC1: Digital Program Notes).
The following steps need to be taken in order to reach fully functional user models for the personalized system:
Perform a more in-depth cluster analysis of clustering for the supporting MM material
group of features Apply cluster quality measures (e.g. between-variance-within-variance ratio)
Perform regression analysis to develop predictive models from independent variables
(which can be acquired through initial questionnaires, past usage or cross-domain) to
dependant variables (preferences about the supporting multimedia material)

PHENICX-WD-WP1-UPF-140520-DeliverableTemplate -1.2 Page 23 of 34
9 REFERENCES
9.1 Written references
Hu, R., & Pu, P. (2010). Using Personality Information in Collaborative Filtering for New Users. Recommender Systems and the Social Web, 17. Retrieved from
http://www.dcs.warwick.ac.uk/~ssanand/RSWeb_files/Proceedings_RSWEB-10.pdf#page=23 Koren, Y., Bell, R., & Volinsky, C. (2009). Matrix Factorization Techniques for Recommender
Systems. Computer, 42(8), 30–37. doi:10.1109/MC.2009.263 Adomavicius, G., & Tuzhilin, a. (2005). Toward the next generation of recommender systems:
a survey of the state-of-the-art and possible extensions. IEEE Transactions on Knowledge and Data Engineering, 17(6), 734–749. doi:10.1109/TKDE.2005.99
Tkalcic, M., Kunaver, M., Košir, A., & Tasic, J. (2011). Addressing the new user problem with
a personality based user similarity measure. Joint Proceedings of the Workshop on Decision Making and Recommendation Acceptance Issues in Recommender Systems (DEMRA 2011) and the 2nd Workshop on User Models for Motivational Systems: The Affective and the Rational Routes to Persuasion (UMMS 2011). Retrieved from http://ceur-ws.org/Vol-740/DEMRA_UMMS_2011_proceedings.pdf#page=106
Gosling, S. D., Rentfrow, P. J., & Swann, W. B. (2003). A very brief measure of the Big-Five personality domains. Journal of Research in Personality, 37(6), 504–528. doi:10.1016/S0092-
6566(03)00046-1
9.2 Web references
[tipi] http://homepage.psy.utexas.edu/HomePage/Faculty/Gosling/tipi%20site/tipi.htm
[survey] http://bird.cp.jku.at/phenicx_us_guest/
9.3 Trademarks and copyrights
9.4 Acronyms and abbreviations

PHENICX-WD-WP1-UPF-140520-DeliverableTemplate -1.2 Page 24 of 34
10 APPENDIX
10.1 List of authors
Complete this section with the full list of authors that have contributed to the deliverable, including
also their affiliation.
Marko Tkalčič JKU
Markus Schedl JKU
Cynthia Liem TUD
Mark Melenhorst TUD

PHENICX-WD-WP1-UPF-140520-DeliverableTemplate -1.2 Page 25 of 34
10.2 Appendix 2: User study survey pages

PHENICX-WD-WP1-UPF-140520-DeliverableTemplate -1.2 Page 26 of 34

PHENICX-WD-WP1-UPF-140520-DeliverableTemplate -1.2 Page 27 of 34

PHENICX-WD-WP1-UPF-140520-DeliverableTemplate -1.2 Page 28 of 34

PHENICX-WD-WP1-UPF-140520-DeliverableTemplate -1.2 Page 29 of 34

PHENICX-WD-WP1-UPF-140520-DeliverableTemplate -1.2 Page 30 of 34
PHENICX-WD-WP1-UPF-140520-DeliverableTemplate -1.2 Page 31 of 34

PHENICX-WD-WP1-UPF-140520-DeliverableTemplate -1.2 Page 32 of 34

PHENICX-WD-WP1-UPF-140520-DeliverableTemplate -1.2 Page 33 of 34

PHENICX-WD-WP1-UPF-140520-DeliverableTemplate -1.2 Page 34 of 34


![A survey of algorithms for dense subgraph discovery · PDF fileA Survey of Algorithms for Dense Subgraph Discovery 305 tems [26]. Much of the early motivation, research, and nomenclature](https://img.pdfslide.net/doc/110x75/5aa160657f8b9ada698b867a/a-survey-of-algorithms-for-dense-subgraph-discovery-survey-of-algorithms-for-dense.jpg)