Embed Size (px)
Citation preview
Dashboards With PROC GKPI
September 25, 2009
Barry Hong © 2009 United States Steel Corporation
Dashboards With PROC GKPI
September 25, 2009
2009 United States Steel Corporation
Dashboards With PROC GKPI
Free Training
Dashboards With PROC GKPI
2
Dashboards With PROC GKPI
Introduction
• Dashboard objects introduced in SAS 8 with BI Server
• Now available in SAS 9.2 with SAS/Graph
• Only supported output is PNG
• PNG files can be converted to GRSEG
• Used to graphically represent Key Performance Indicators
Dashboards With PROC GKPI
Dashboard objects introduced in SAS 8 with BI Server
Now available in SAS 9.2 with SAS/Graph
3
Only supported output is PNG
PNG files can be converted to GRSEG
Used to graphically represent Key Performance Indicators
Dashboards with PROC GKPI
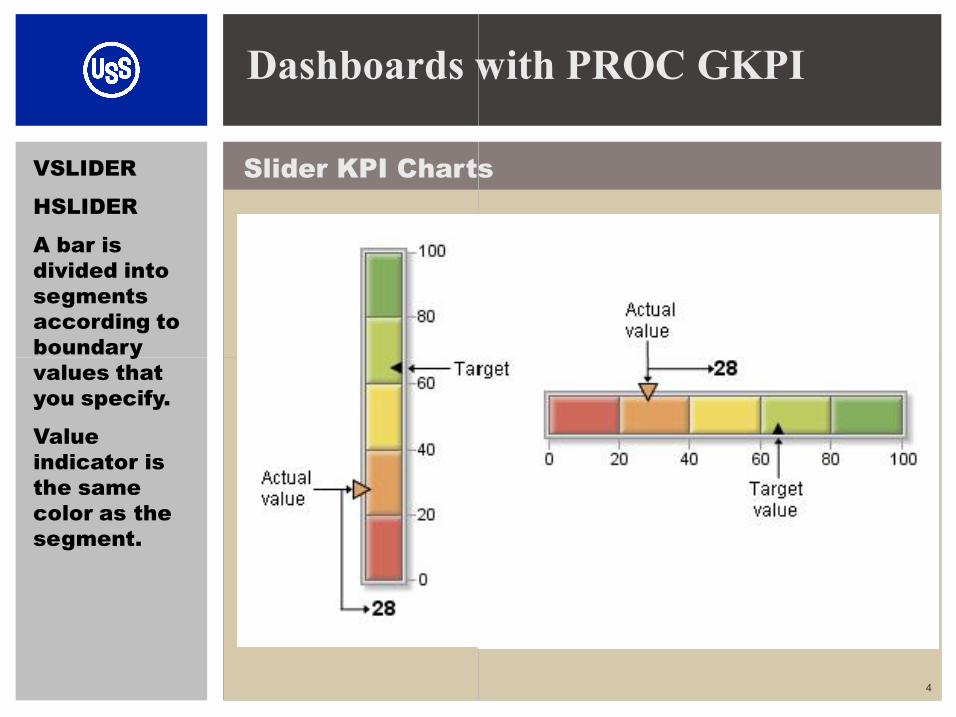
Slider KPI Charts VSLIDER
HSLIDER
A bar is divided into segments according to boundary values that boundary values that you specify.
Value indicator is the same color as the segment.
Dashboards with PROC GKPI
Slider KPI Charts
4
Dashboards with PROC GKPI
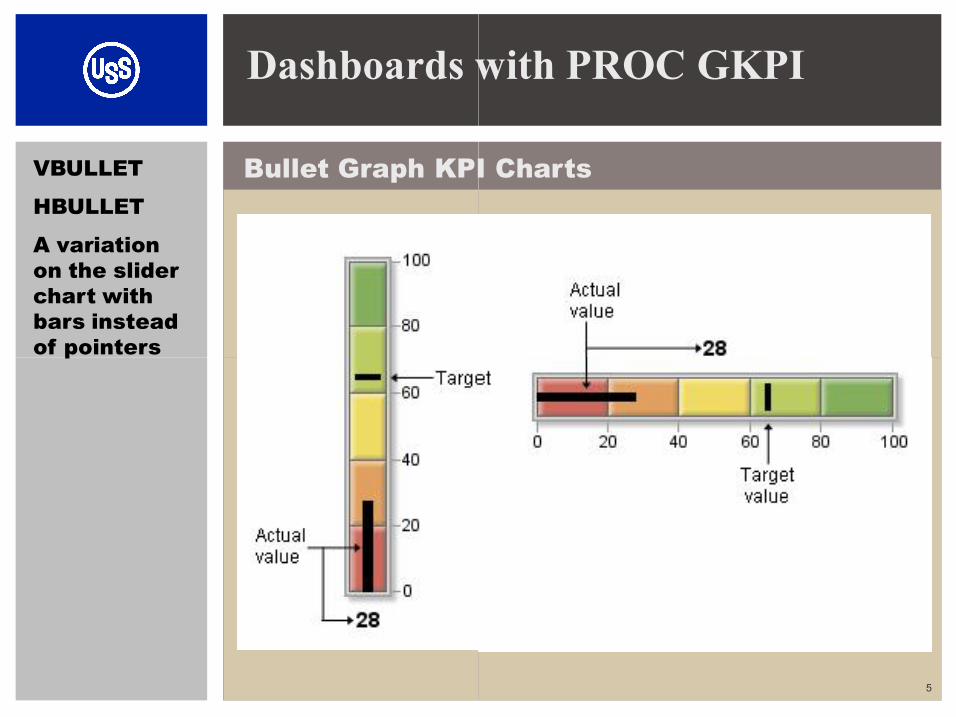
Bullet Graph KPI Charts VBULLET
HBULLET
A variation on the slider chart with bars instead of pointers of pointers
Dashboards with PROC GKPI
Bullet Graph KPI Charts
5
Dashboards with PROC GKPI
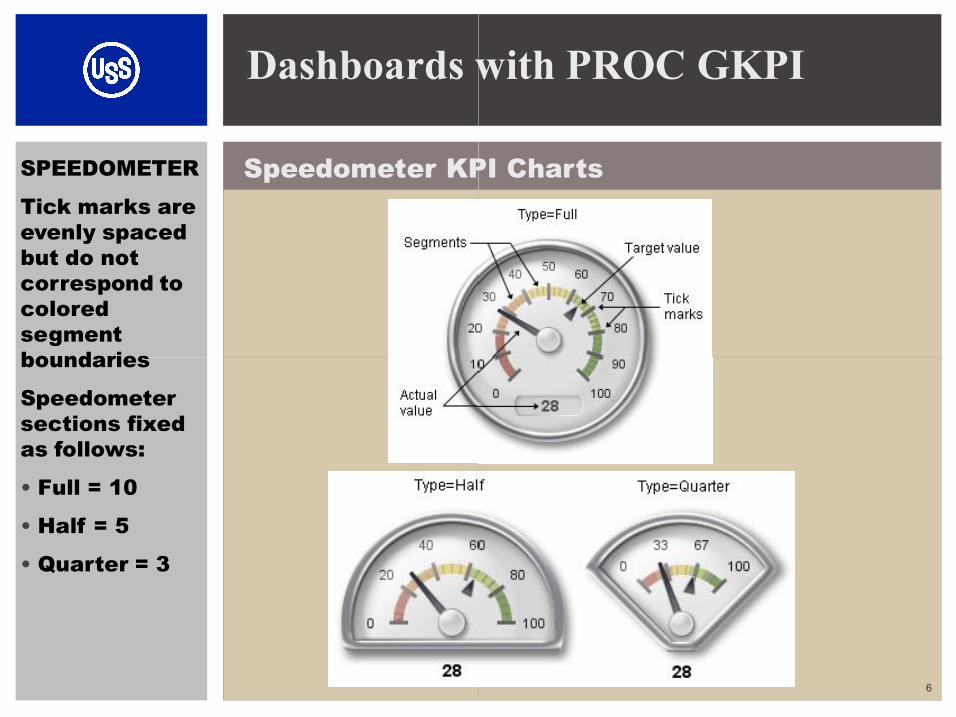
Speedometer KPI Charts SPEEDOMETER
Tick marks are evenly spaced but do not correspond to colored segment boundaries boundaries
Speedometer sections fixed as follows:
• Full = 10
• Half = 5
• Quarter = 3
Dashboards with PROC GKPI
Speedometer KPI Charts
6
Dashboards with PROC GKPI
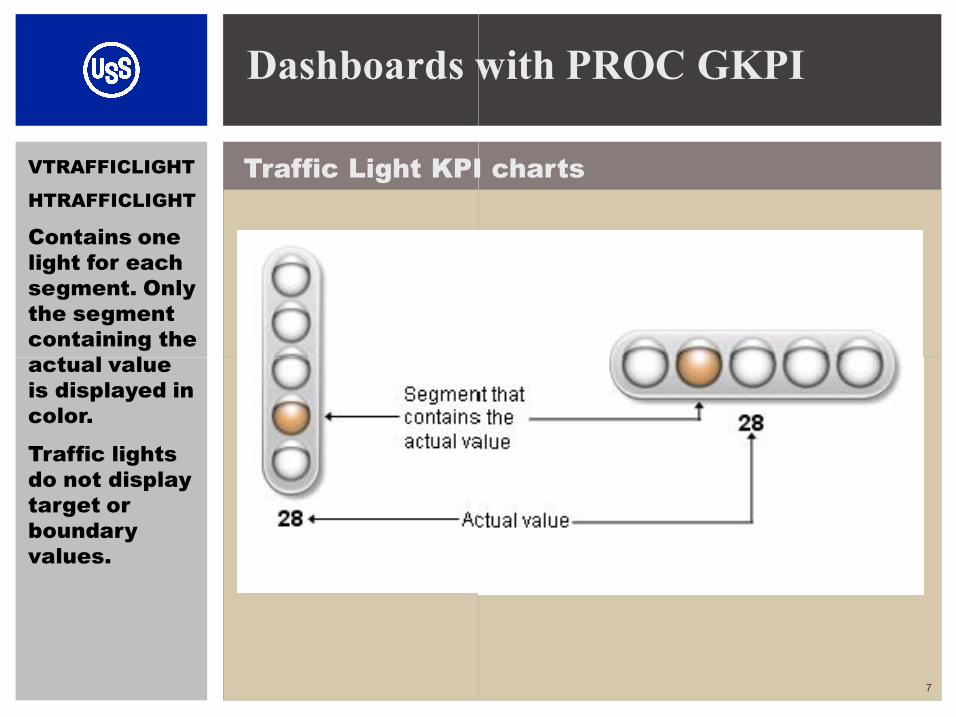
Traffic Light KPI charts VTRAFFICLIGHT
HTRAFFICLIGHT
Contains one light for each segment. Only the segment containing the actual value actual value is displayed in color.
Traffic lights do not display target or boundary values.
Dashboards with PROC GKPI
Traffic Light KPI charts
7
Dashboards with PROC GKPI
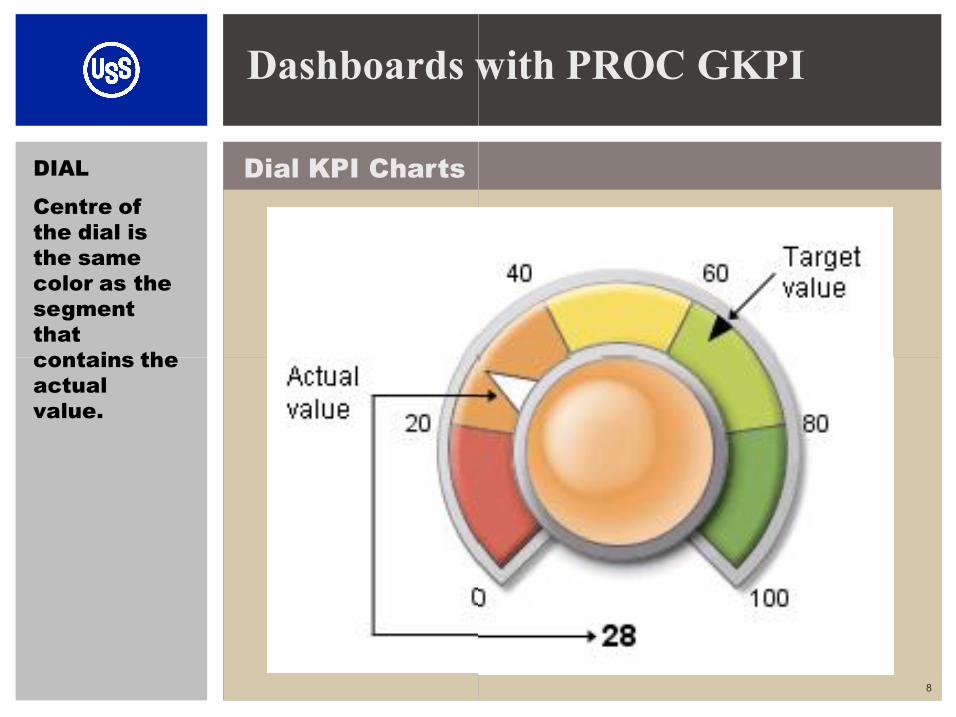
Dial KPI Charts DIAL
Centre of the dial is the same color as the segment that contains the contains the actual value.
Dashboards with PROC GKPI
8
Dashboards with PROC GKPI
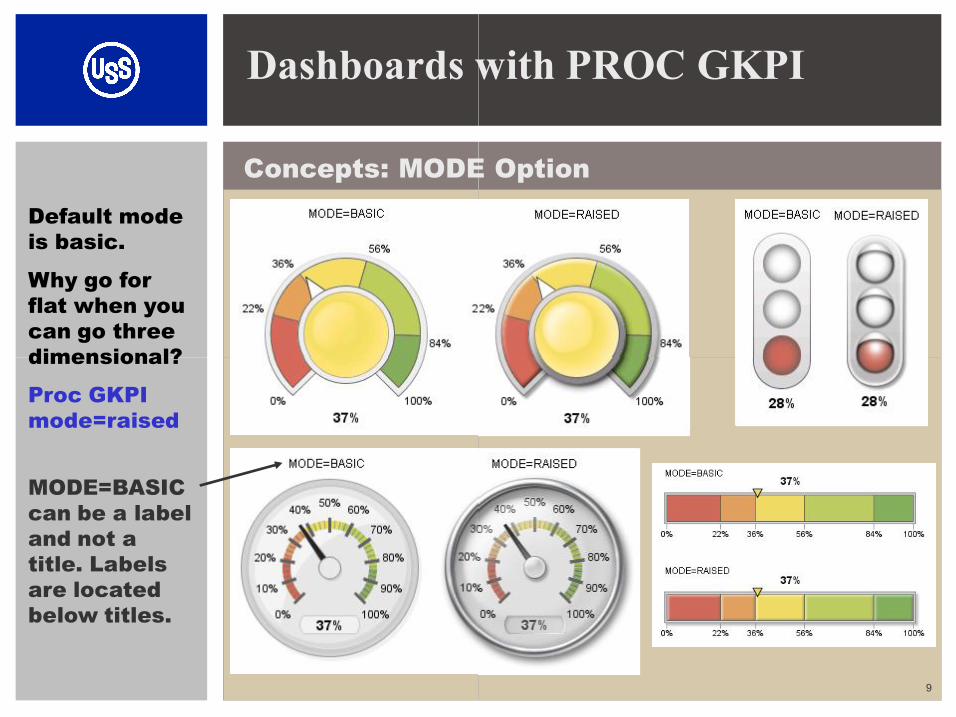
Concepts: MODE Option Default mode is basic.
Why go for flat when you can go three dimensional? dimensional?
Proc GKPI mode=raised
MODE=BASIC can be a label and not a title. Labels are located below titles.
Dashboards with PROC GKPI
Concepts: MODE Option
9
Dashboards with PROC GKPI
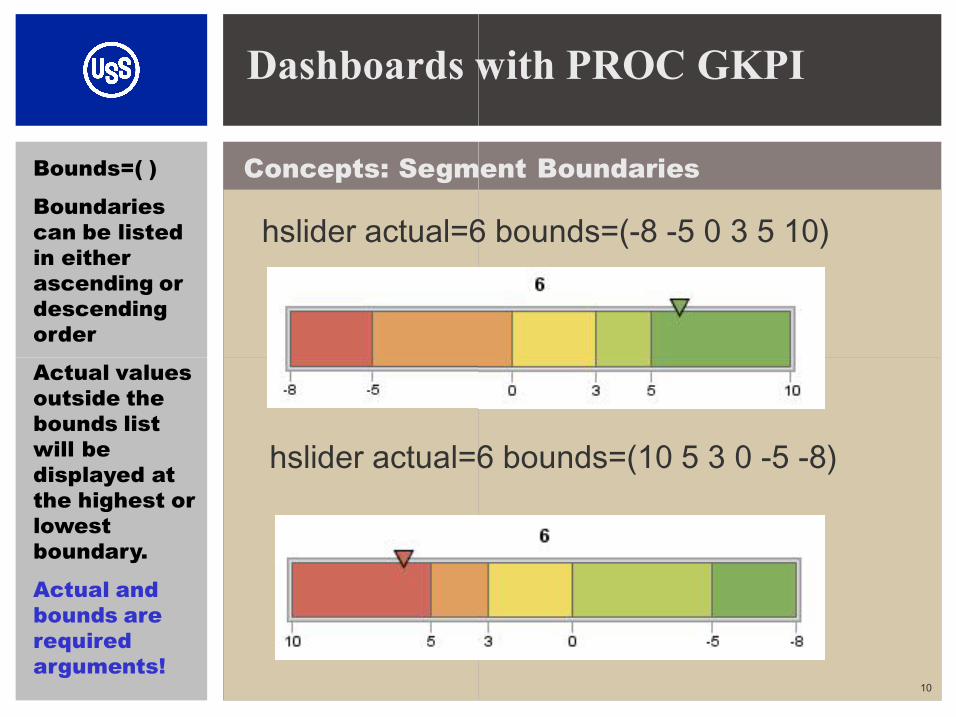
Concepts: Segment Boundaries Bounds=( )
Boundaries can be listed in either ascending or descending order
Actual values
hslider actual=6 bounds=(
Actual values outside the bounds list will be displayed at the highest or lowest boundary.
Actual and bounds are required arguments!
hslider actual=6 bounds=(10 5 3 0
Dashboards with PROC GKPI
Concepts: Segment Boundaries
hslider actual=6 bounds=(-8 -5 0 3 5 10)
10
hslider actual=6 bounds=(10 5 3 0 -5 -8)
Dashboards with PROC GKPI
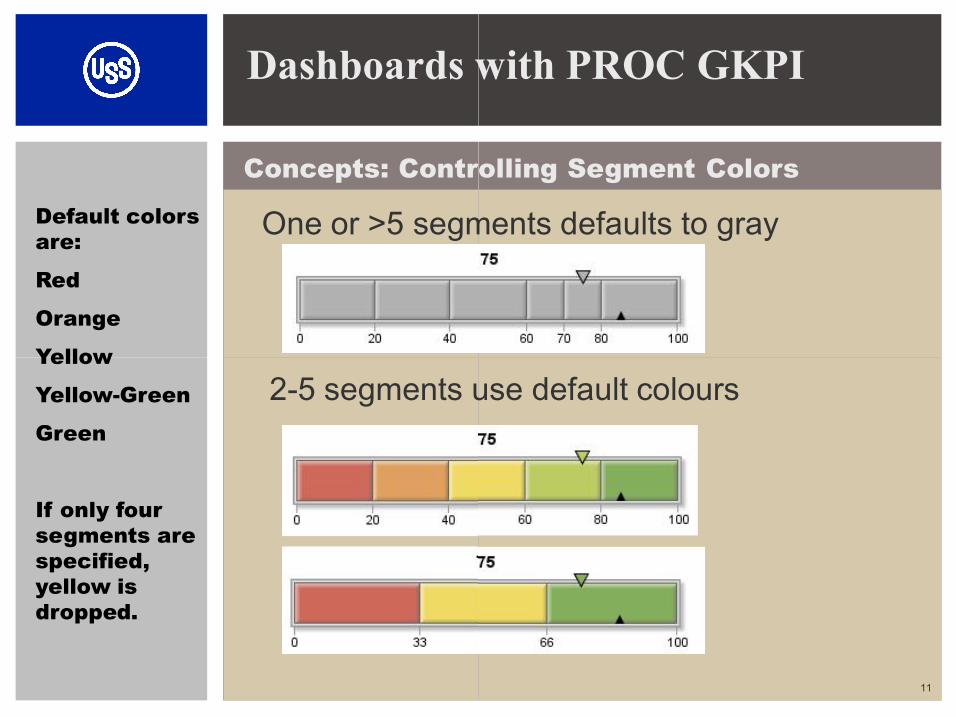
Concepts: Controlling Segment Colors Default colors are:
Red
Orange
Yellow
One or >5 segments defaults to gray
Yellow
YellowGreen
Green
If only four segments are specified, yellow is dropped.
2-5 segments use default colours
Dashboards with PROC GKPI
Concepts: Controlling Segment Colors
One or >5 segments defaults to gray
11
5 segments use default colours
Dash Boarding with PROC GKPI
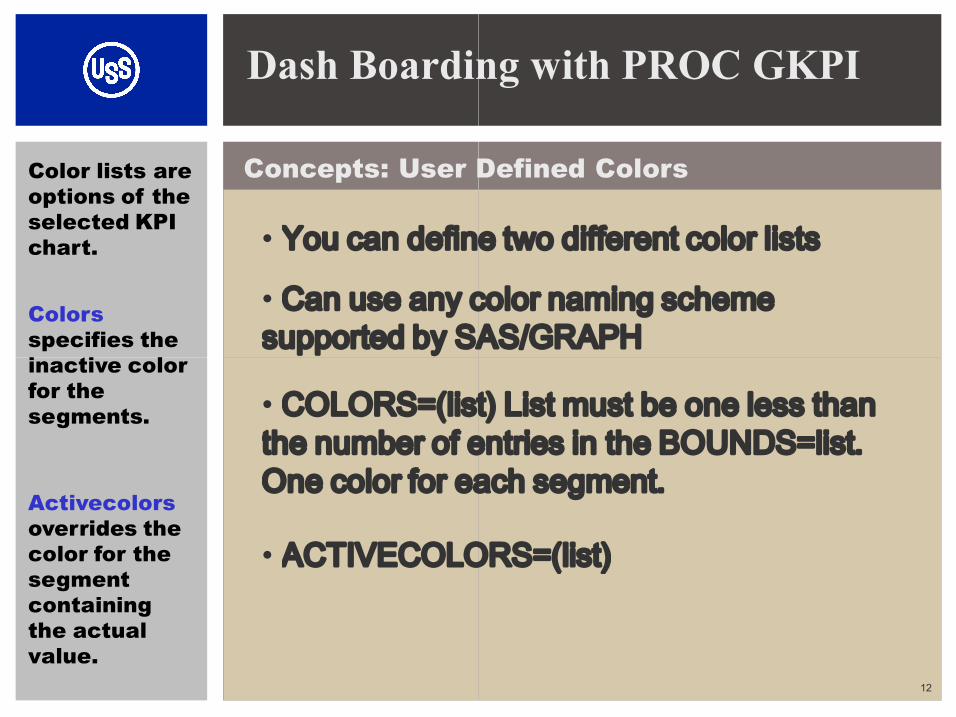
Concepts: User Defined Colors Color lists are options of the selected KPI chart. • You can define two different color lists
• Can use any color naming scheme supported by SAS/GRAPH
Colors specifies the inactive color
• ACTIVECOLORS=(list)
• COLORS=(list) List must be one less than the number of entries in the BOUNDS=list. One color for each segment.
Activecolors overrides the color for the segment containing the actual value.
inactive color for the segments.
Dash Boarding with PROC GKPI
Concepts: User Defined Colors
You can define two different color lists
Can use any color naming scheme supported by SAS/GRAPH
12
ACTIVECOLORS=(list)
COLORS=(list) List must be one less than the number of entries in the BOUNDS=list. One color for each segment.
Dash Boarding with PROC GKPI
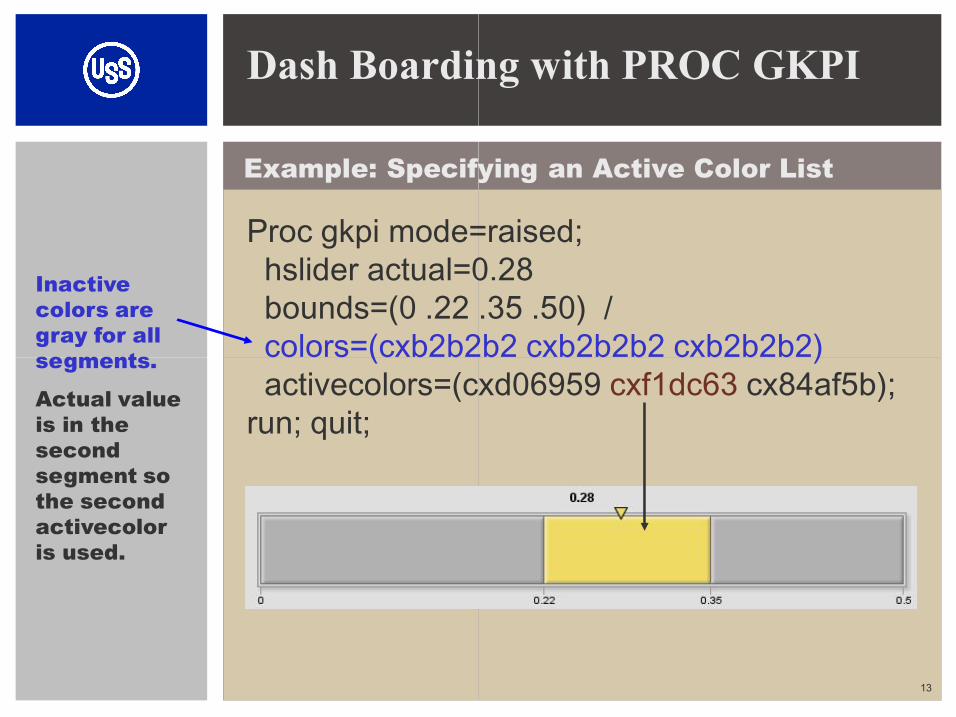
Example: Specifying an Active Color List
Inactive colors are gray for all segments.
Proc gkpi mode=raised; hslider actual=0.28 bounds=(0 .22 .35 .50) / colors=(cxb2b2b2 cxb2b2b2 cxb2b2b2) segments.
Actual value is in the second segment so the second activecolor is used.
colors=(cxb2b2b2 cxb2b2b2 cxb2b2b2) activecolors=(cxd06959
run; quit;
Dash Boarding with PROC GKPI
Example: Specifying an Active Color List
Proc gkpi mode=raised; hslider actual=0.28 bounds=(0 .22 .35 .50) / colors=(cxb2b2b2 cxb2b2b2 cxb2b2b2)
13
colors=(cxb2b2b2 cxb2b2b2 cxb2b2b2) activecolors=(cxd06959 cxf1dc63 cx84af5b);
Dashboards with PROC GKPI
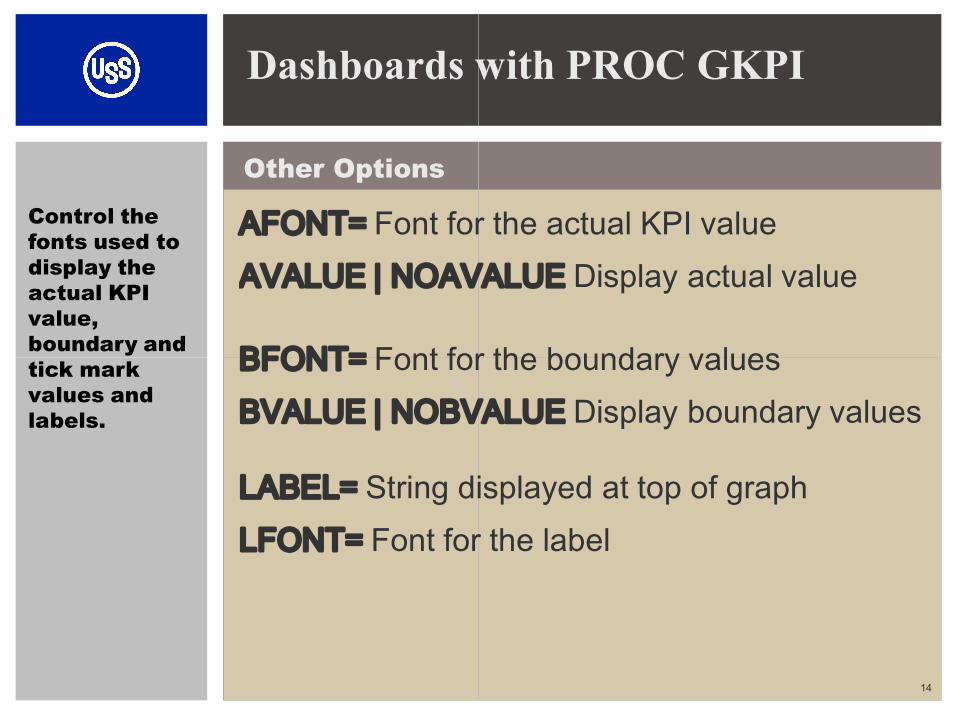
Other Options Control the fonts used to display the actual KPI value, boundary and tick mark
AFONT= Font for the actual KPI value AVALUE | NOAVALUE
BFONT= Font for the boundary values boundary and tick mark values and labels.
BFONT= Font for the boundary values BVALUE | NOBVALUE
LFONT= Font for the label LABEL= String displayed at top of graph
Dashboards with PROC GKPI
Font for the actual KPI value AVALUE | NOAVALUE Display actual value
Font for the boundary values
14
Font for the boundary values BVALUE | NOBVALUE Display boundary values
Font for the label String displayed at top of graph
Dashboards with PROC GKPI
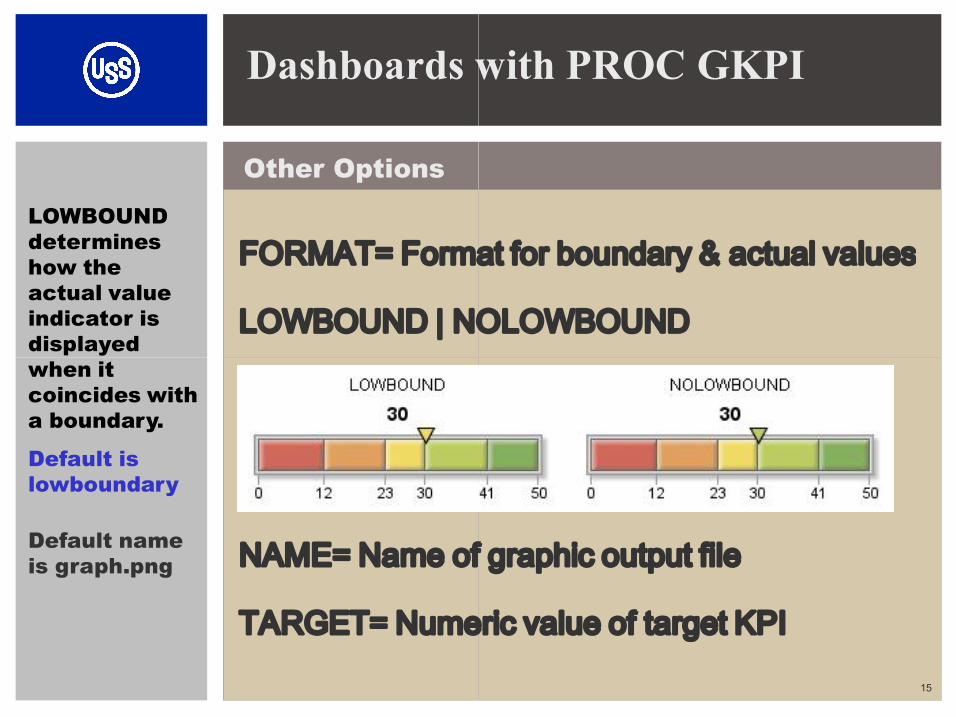
Other Options LOWBOUND determines how the actual value indicator is displayed when it
FORMAT= Format for boundary & actual values
LOWBOUND | NOLOWBOUND displayed when it coincides with a boundary.
Default is lowboundary
TARGET= Numeric value of target KPI
NAME= Name of graphic output file Default name is graph.png
Dashboards with PROC GKPI
Format for boundary & actual values
LOWBOUND | NOLOWBOUND
15
Numeric value of target KPI
Name of graphic output file
Dashboards With PROC GKPI
Dashboards Organize Information
Dashboards With PROC GKPI
Dashboards Organize Information
16
Dashboards with PROC GKPI
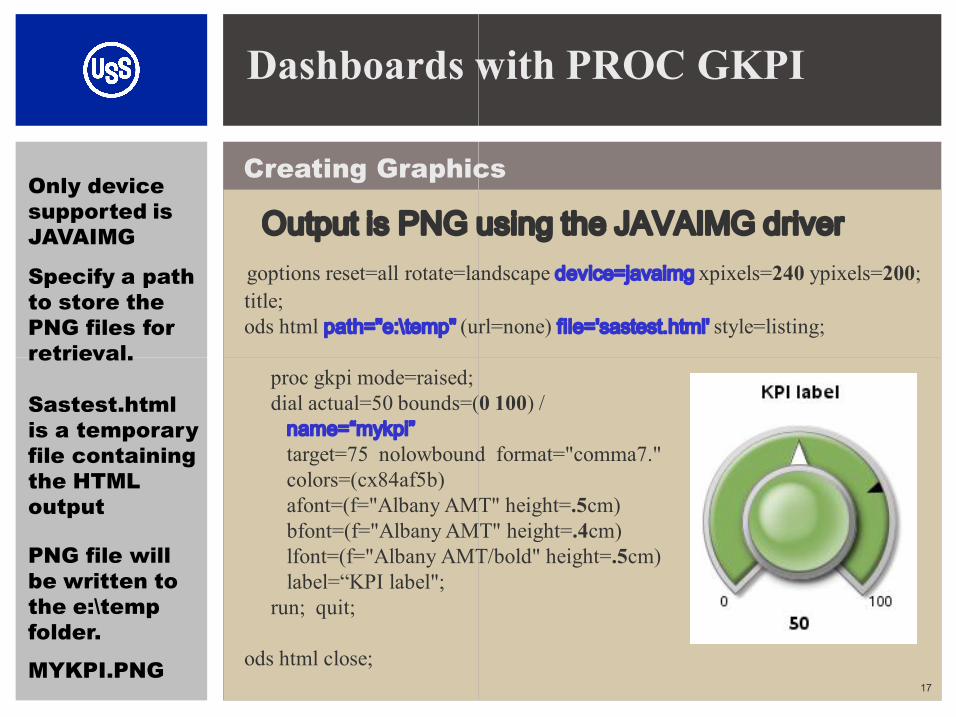
Creating Graphics Only device supported is JAVAIMG Output is PNG using the JAVAIMG driver
goptions reset=all rotate=landscape title; ods html path="e:\temp" (url=none)
Specify a path to store the PNG files for retrieval.
proc gkpi mode=raised; dial actual=50 bounds=(
name=“mykpi” target=75 nolowbound format="comma7." colors=(cx84af5b) afont=(f="Albany AMT" height= bfont=(f="Albany AMT" height= lfont=(f="Albany AMT/bold" height= label=“KPI label";
run; quit;
ods html close;
Sastest.html is a temporary file containing the HTML output
retrieval.
PNG file will be written to the e:\temp folder.
MYKPI.PNG
Dashboards with PROC GKPI
Creating Graphics
Output is PNG using the JAVAIMG driver goptions reset=all rotate=landscape device=javaimg xpixels=240 ypixels=200;
(url=none) file='sastest.html' style=listing;
17
dial actual=50 bounds=(0 100) /
target=75 nolowbound format="comma7."
afont=(f="Albany AMT" height=.5cm) bfont=(f="Albany AMT" height=.4cm) lfont=(f="Albany AMT/bold" height=.5cm)
Dashboards with PROC GKPI
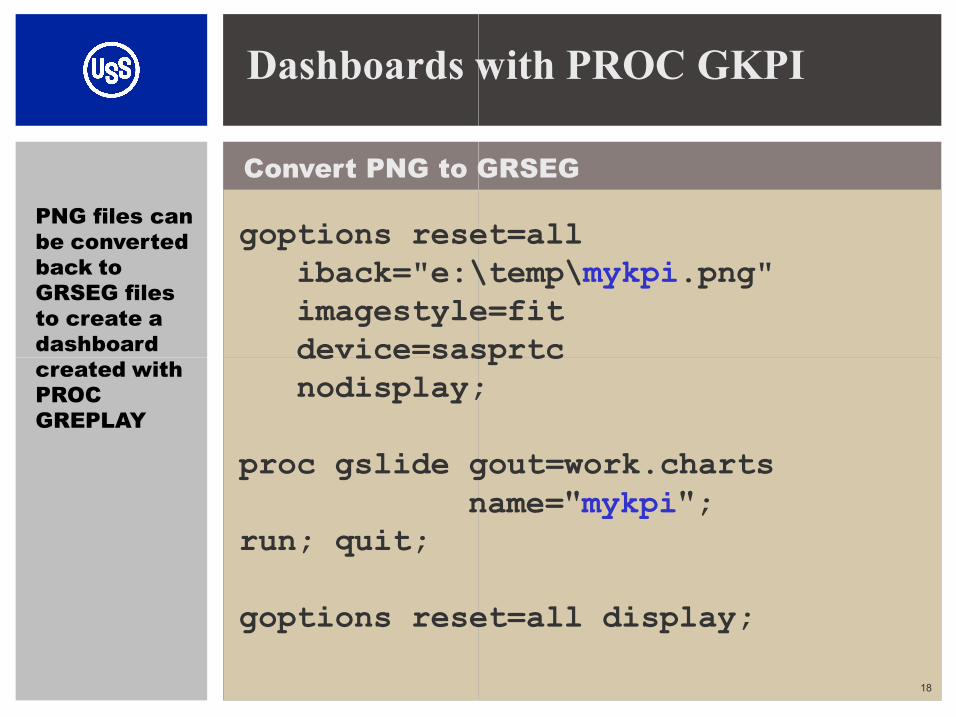
Convert PNG to GRSEG PNG files can be converted back to GRSEG files to create a dashboard created with
goptions reset=all iback="e:\ imagestyle=fit device=sasprtc dashboard
created with PROC GREPLAY
device=sasprtc nodisplay;
proc gslide gout=work.charts name=
run; quit;
goptions reset=all display;
Dashboards with PROC GKPI
Convert PNG to GRSEG
goptions reset=all \temp\mykpi.png"
imagestyle=fit device=sasprtc
18
device=sasprtc nodisplay;
proc gslide gout=work.charts name="mykpi";
goptions reset=all display;
Dashboards with PROC GKPI
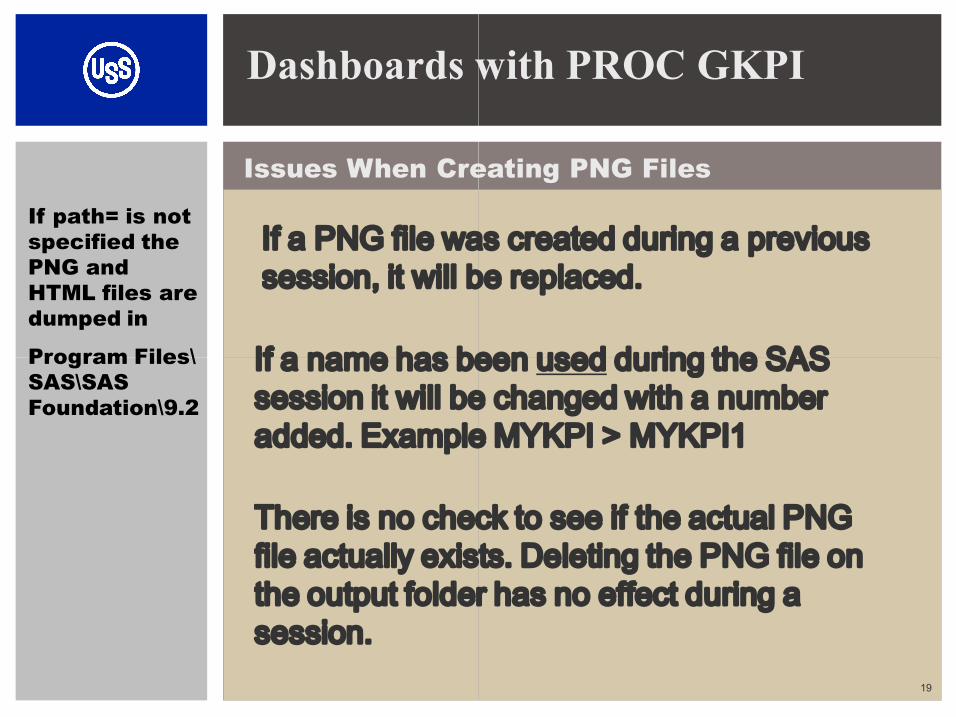
Issues When Creating PNG Files If path= is not specified the PNG and HTML files are dumped in
Program Files\ If a name has been
If a PNG file was created during a previous session, it will be replaced.
Program Files\ SAS\SAS Foundation\9.2
If a name has been session it will be changed with a number added. Example MYKPI > MYKPI1
There is no check to see if the actual PNG file actually exists. Deleting the PNG file on the output folder has no effect during a session.
Dashboards with PROC GKPI
Issues When Creating PNG Files
If a name has been used during the SAS
If a PNG file was created during a previous session, it will be replaced.
19
If a name has been used during the SAS session it will be changed with a number added. Example MYKPI > MYKPI1
There is no check to see if the actual PNG file actually exists. Deleting the PNG file on the output folder has no effect during a
Dashboards with PROC GKPI
Implementation
Advantage is that all the charts have
Recommend developing a macro that creates the KPI chart as a PNG and then creates a GRSEG file .
charts have the target and color bands in the same location.
Standardize boundaries as a percentage of the target value.
Create a graphic template to organize a number of KPI charts on a single page.
Dashboards with PROC GKPI
Recommend developing a macro that creates the KPI chart as a PNG and then creates a
20
Standardize boundaries as a percentage of the target value.
Create a graphic template to organize a number of KPI charts on a single page.
Dashboards with PROC GKPI
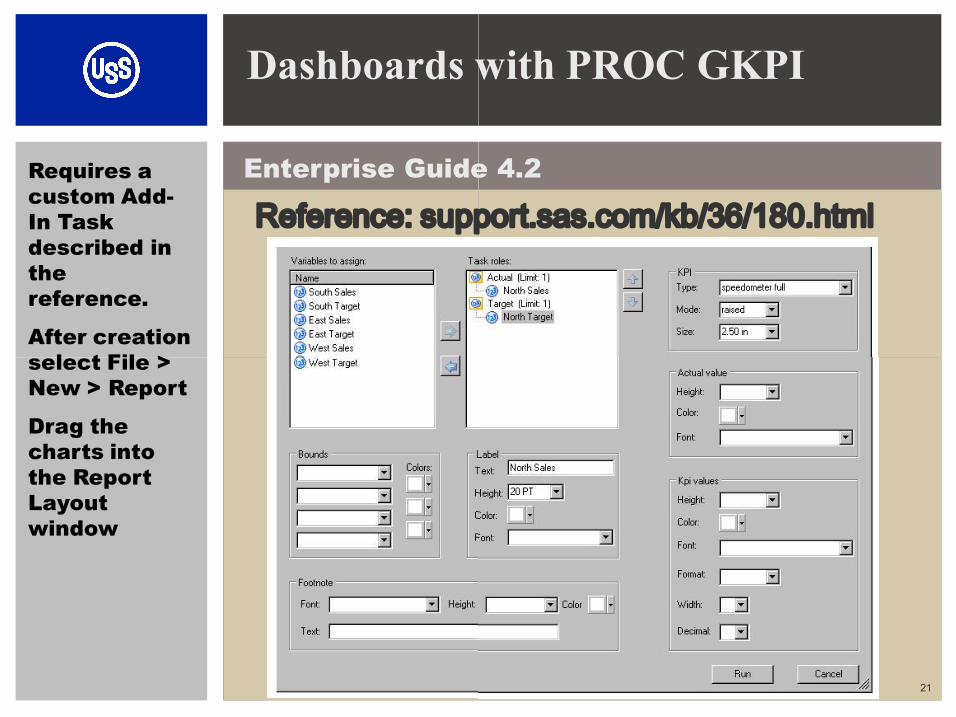
Enterprise Guide 4.2 Requires a custom Add In Task described in the reference.
After creation select File >
Reference: support.sas.com/kb/36/180.html
select File > New > Report
Drag the charts into the Report Layout window
Dashboards with PROC GKPI
Enterprise Guide 4.2
Reference: support.sas.com/kb/36/180.html
21
Dashboards With PROC GKPI
References and Contact Information
PROC GKPI online documentation at support.sas.com
Dashboards With PROC GKPI
References and Contact Information
PROC GKPI online documentation at support.sas.com
22