Embed Size (px)
Citation preview
Debugging via Intel® DCI User´s Guide
TRACE32 Online Help
TRACE32 Directory
TRACE32 Index
TRACE32 Documents ......................................................................................................................
Intel® DCI [Direct Connect Interface] ..........................................................................................
Debugging via Intel® DCI User´s Guide ................................................................................... 1
History ...................................................................................................................................... 3
Introduction ............................................................................................................................. 4
4-wire DCI OOB 4
DCI OOB Hardware 5
DCI DbC 6
Target System Requirements 7
Related Documents 7
Start a TRACE32 Session using Intel® DCI .......................................................................... 8
Prepare Your Target 8
Connecting to an Intel® SoC using DCI OOB 8
Connecting to an Intel® Client or Server System using DCI OOB 9
Connecting to an Intel® SoC using DCI DbC 10
Connecting to an Intel® Client or Server System using DCI DbC 11
Troubleshooting ...................................................................................................................... 12
DCI error: no response to connect pattern 12
Could not stop the target 12
Target Power Fail 12
Intel® DCI Specific Commands .............................................................................................. 13
DCI Commands to configure the Intel® DCI trace handler 13
DCI.DESTination Set trace destination 13
DCI.ON Enable trace handler 13
DCI.OFF Disable trace handler 14
SYStem.DCI Intel® DCI specific SYStem commands 15
SYStem.DCI.Bridge Select DCI bridge 15
SYStem.DCI.BssbClock Configure DCI OOB clock rate 15
SYStem.DCI.CKDIrouting Routing of the CK and DI signals 16
SYStem.DCI.DisCONnect Force DCI disconnect 16
SYStem.DCI.DOrouting Routing of the DO signals 17
SYStem.DCI.PortPower Configure VBUS 18
SYStem.DCI.TimeOut Configure timeouts of internal operations 19
Debugging via Intel® DCI User´s Guide 1 ©1989-2019 Lauterbach GmbH
Intel® DCI Specific Functions ................................................................................................ 20
In This Section 20
SYStem.DCI.Bridge() Currently selected DCI bridge 20
SYStem.DCI.BssbClock() Currently selected DCI OOB clock 20
SYStem.DCI.TIMEOUT() Timeouts of internal operations 21
Debugging via Intel® DCI User´s Guide 2 ©1989-2019 Lauterbach GmbH

Debugging via Intel® DCI User´s Guide
Version 06-Nov-2019
History
24-May-19 Added description of the command SYStem.CONFIG DCI.TimeOut and function SYStem.DCI.TIMEOUT().
Debugging via Intel® DCI User´s Guide 3 ©1989-2019 Lauterbach GmbH

Introduction
The Intel® Direct Connect Interface (DCI) allows debugging of Intel® targets using the USB3 port. The technology supports debugging via the USB Stack (DCI DbC) as well as a dedicated protocol using a USB3 connector only (DCI OOB).
4-wire DCI OOB
DCI OOB uses a special protocol on the USB3 pins. This makes the mode independent of the actual USB implementation on the target board. This allows debugging of cold boot scenarios, reset flows, and sleep states.
The figure above illustrates a typical setup. A Power Debug Module with a CombiProbe and a Whisker Cable DCI OOB (LA-4515) [A] is connected to the debug host running TRACE32 PowerView. On the target side the Whisker Cable DCI OOB connects to a USB port of the target system using a short USB cable [B].
TRACE32 sends DCI commands encoded in the DCI OOB protocol to the target system. In the target system the commands are decoded by the OOB module and forwarded to the DCI module where they are translated to JTAG sequences. These JTAG sequences allow to access the internal TAP of the SoC/PCH as well as externally connected JTAG devices (e.g., the CPU of a client or server system).
Trace data can be exported through the DCI module and recorded by the CombiProbe.
A B
Debugging via Intel® DCI User´s Guide 4 ©1989-2019 Lauterbach GmbH
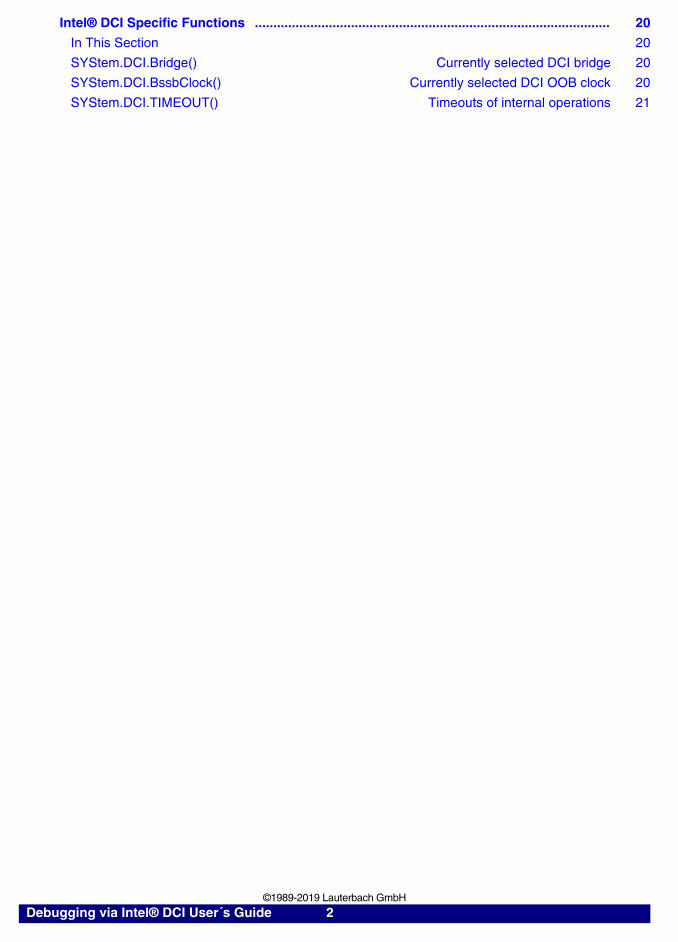
DCI OOB Hardware
In the following the available DCI OOB hardware is shown.
Whisker Cable DCI OOB for CombiProbe Version 1
Whisker Cable DCI OOB for CombiProbe Version 2
A USB cable to target system D USB connector for target system
B VBUS jumper E 34-pin expansion connector (proprietary)
C Cable to CombiProbe
A USB cable to target system D USB connector for target system
B VBUS slider E 34-pin expansion connector (proprietary)
C Cable to CombiProbe
A
B
CE
D
A
B
CD
E
Debugging via Intel® DCI User´s Guide 5 ©1989-2019 Lauterbach GmbH

DCI DbC
DCI DbC allows debugging using the OS USB stack.
The figure above illustrates a typical setup. TRACE32 only runs on the debug host. The target system connects to the debug host using a USB cable.
TRACE32 sends DCI commands encoded in the USB protocol to the target system using libusb and the USB Stack of the operating system. In the target system the commands are decoded by the USB implementation and forwarded to the DCI module where they are translated to JTAG sequences. These JTAG sequences allow to access the internal TAP of the SoC/PCH as well as externally connected JTAG devices (e.g., the CPU of a client or server system).
Trace data can be directly exported via USB and recorded by TRACE32 on the debug host. DCI DbC also provides a DMA capability for fast download of the system RAM. Support of these capabilities by TRACE32 depends on the used target system.
For using DCI DbC, please observe the “System Requirements” (usbdebug_user.pdf).
Debugging via Intel® DCI User´s Guide 6 ©1989-2019 Lauterbach GmbH

Target System Requirements
For debugging using Intel® DCI your target system must fulfill the following:
• The BIOS must enable DCI debugging or provide a user option to do so. Please contact your
BIOS manufacturer to clarify if your BIOS conforms to the Intel® BIOS Writer's Guide requirements for DCI support.
• For using DCI OOB, the USB part of your target system must be electrically designed such that DCI OOB signaling is not blocked. This is of special importance for USB Type-C solutions.
Details about these requirements can be found in the appropriate Intel® Platform Design Guide.
Related Documents
• “Intel® x86/x64 Debugger” (debugger_x86.pdf)
• “Debugging via USB User´s Guide” (usbdebug_user.pdf)
• “Intel® Trace Hub” (trace_intel_th.pdf)
Debugging via Intel® DCI User´s Guide 7 ©1989-2019 Lauterbach GmbH
Start a TRACE32 Session using Intel® DCI
Prepare Your Target
Irrespective of which DCI variant is used, debugging via DCI needs to be activated in the BIOS of the target system first. Please contact your BIOS manufacturer for instructions.
Connecting to an Intel® SoC using DCI OOB
1. Connect your TRACE32 hardware and start the TRACE32 software, as described in “Starting a TRACE32 PowerView Instance” (training_debugger_x86.pdf).
2. For SoCs configure the CPU, e.g., by executing the following command:
3. Establish the debug connection:
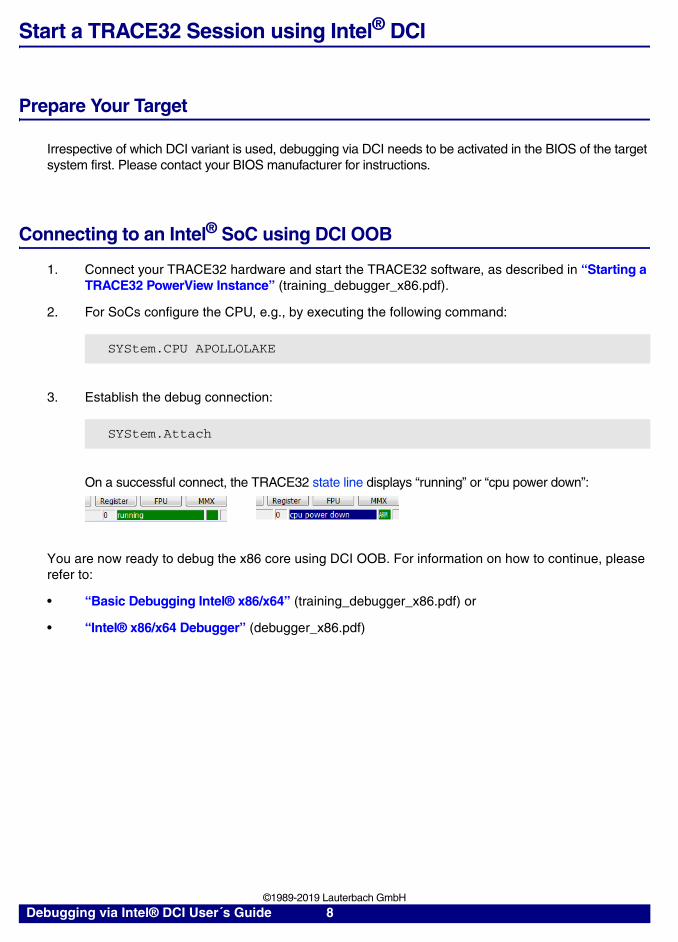
On a successful connect, the TRACE32 state line displays “running” or “cpu power down”:
You are now ready to debug the x86 core using DCI OOB. For information on how to continue, please refer to:
• “Basic Debugging Intel® x86/x64” (training_debugger_x86.pdf) or
• “Intel® x86/x64 Debugger” (debugger_x86.pdf)
SYStem.CPU APOLLOLAKE
SYStem.Attach
Debugging via Intel® DCI User´s Guide 8 ©1989-2019 Lauterbach GmbH
Connecting to an Intel® Client or Server System using DCI OOB
1. Connect your TRACE32 hardware and start the TRACE32 software, as described in “Starting a TRACE32 PowerView Instance” (training_debugger_x86.pdf).
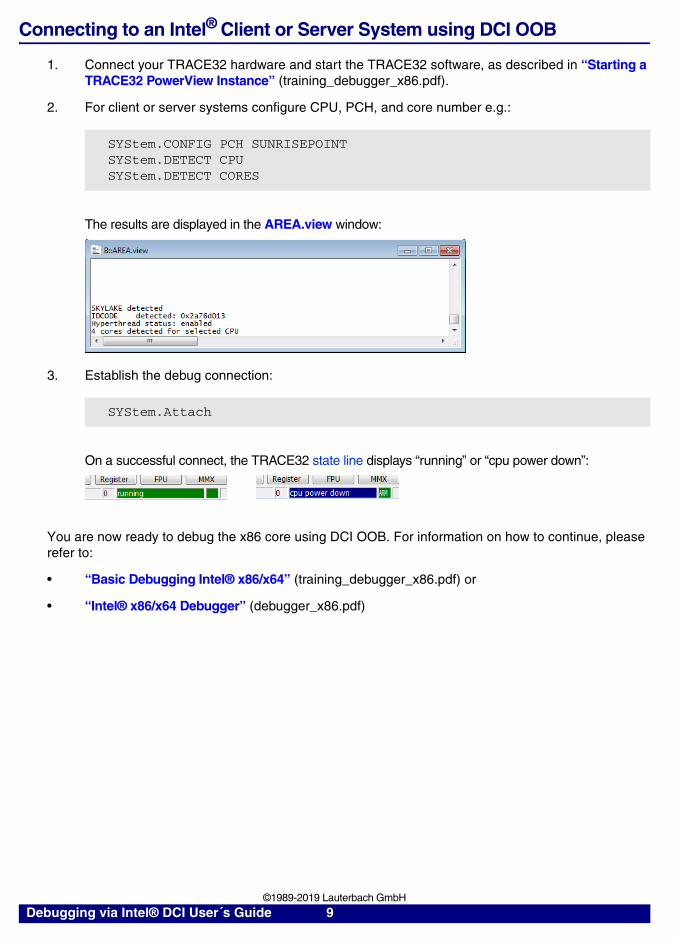
2. For client or server systems configure CPU, PCH, and core number e.g.:
The results are displayed in the AREA.view window:
3. Establish the debug connection:
On a successful connect, the TRACE32 state line displays “running” or “cpu power down”:
You are now ready to debug the x86 core using DCI OOB. For information on how to continue, please refer to:
• “Basic Debugging Intel® x86/x64” (training_debugger_x86.pdf) or
• “Intel® x86/x64 Debugger” (debugger_x86.pdf)
SYStem.CONFIG PCH SUNRISEPOINTSYStem.DETECT CPUSYStem.DETECT CORES
SYStem.Attach
Debugging via Intel® DCI User´s Guide 9 ©1989-2019 Lauterbach GmbH
Connecting to an Intel® SoC using DCI DbC
1. Install the target USB driver and start a TRACE32 session for USB debugging as described in “Debugging via USB User´s Guide” (usbdebug_user.pdf).
2. For SoCs configure the CPU, e.g., by executing the following command:
3. Select the IntelUSB0 debug port and configure the USB parameters for the debug connection, e.g., by executing the following commands:
In this example, “1.” is the number of the debug enabled interface, “0x8087” is the vendor ID of the target system and “0x0A73” is the product ID of the target system.These parameters can be determined interactively as described in “Select a USB Device via the GUI” (usbdebug_user.pdf). For details, please refer to SYStem.CONFIG.USB.
4. For tracing via DbC, add the configuration for the trace interface, e.g.:
5. For using DMA via DbC, add the configuration for the DMA interface, e.g.:
6. Establish the debug connection:
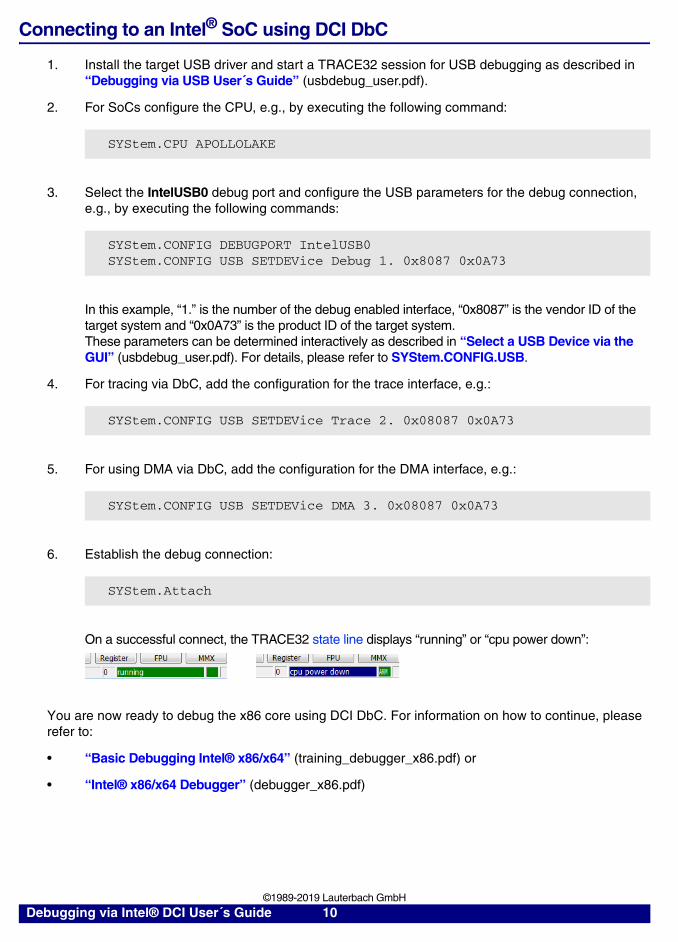
On a successful connect, the TRACE32 state line displays “running” or “cpu power down”:
You are now ready to debug the x86 core using DCI DbC. For information on how to continue, please refer to:
• “Basic Debugging Intel® x86/x64” (training_debugger_x86.pdf) or
• “Intel® x86/x64 Debugger” (debugger_x86.pdf)
SYStem.CPU APOLLOLAKE
SYStem.CONFIG DEBUGPORT IntelUSB0SYStem.CONFIG USB SETDEVice Debug 1. 0x8087 0x0A73
SYStem.CONFIG USB SETDEVice Trace 2. 0x08087 0x0A73
SYStem.CONFIG USB SETDEVice DMA 3. 0x08087 0x0A73
SYStem.Attach
Debugging via Intel® DCI User´s Guide 10 ©1989-2019 Lauterbach GmbH
Connecting to an Intel® Client or Server System using DCI DbC
1. Install the target USB driver and start a TRACE32 session for USB debugging as described in “Debugging via USB User´s Guide” (usbdebug_user.pdf).
2. Configure the PCH your board is using, e.g., by executing the following command:
3. Configure the USB parameters for the debug connection, e.g., by executing the following commands:
In this example, “1.” is the number of the debug enabled interface, “0x8087” is the vendor ID of the target system and “0x0A73” is the product ID of the target system.These parameters can be determined interactively as described in “Select a USB Device via the GUI” (usbdebug_user.pdf). For details, please refer to SYStem.CONFIG.USB.
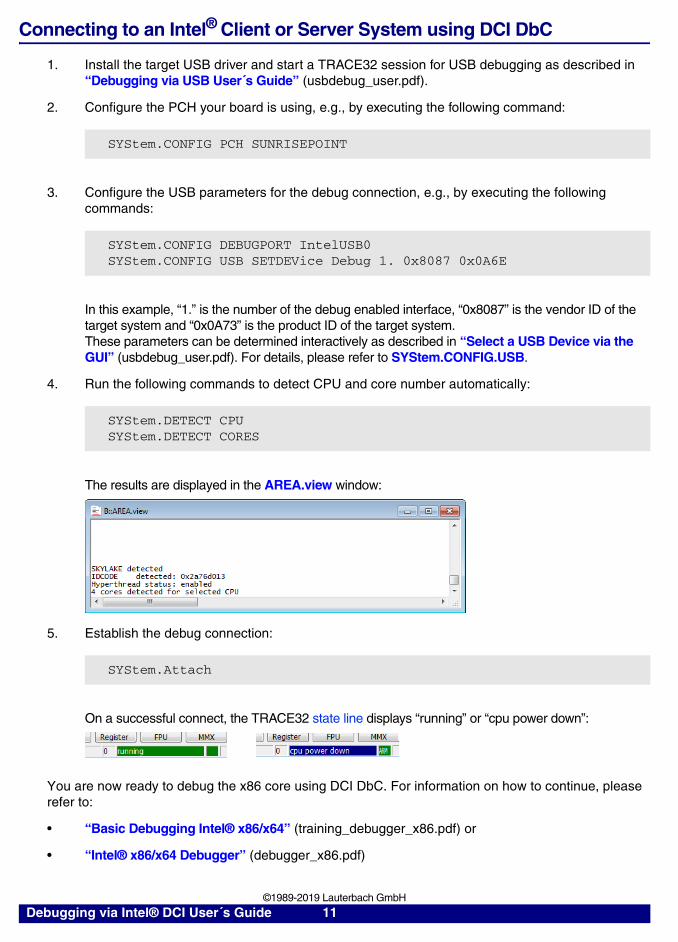
4. Run the following commands to detect CPU and core number automatically:
The results are displayed in the AREA.view window:
5. Establish the debug connection:
On a successful connect, the TRACE32 state line displays “running” or “cpu power down”:
You are now ready to debug the x86 core using DCI DbC. For information on how to continue, please refer to:
• “Basic Debugging Intel® x86/x64” (training_debugger_x86.pdf) or
• “Intel® x86/x64 Debugger” (debugger_x86.pdf)
SYStem.CONFIG PCH SUNRISEPOINT
SYStem.CONFIG DEBUGPORT IntelUSB0SYStem.CONFIG USB SETDEVice Debug 1. 0x8087 0x0A6E
SYStem.DETECT CPUSYStem.DETECT CORES
SYStem.Attach
Debugging via Intel® DCI User´s Guide 11 ©1989-2019 Lauterbach GmbH
Troubleshooting
The following describes some possible error scenarios, along with suggestions how to resolve them:
DCI error: no response to connect pattern
TRACE32 did not receive any response from the target.
• Make sure the USB cable is connected to a DCI enabled USB port.
• Make sure DCI is enabled in the BIOS of the target system.
• Configure the DO-Routing manually. For details, see SYStem.DCI.DOrouting.
• In case you are using a USB Type-C connector, try flipping the plug.
• Consider removing common mode chokes in the USB path.
Could not stop the target
TRACE32 could not halt the processor, but the DCI connection is working.
• Make sure debugging is enabled in the BIOS of the target system.
Target Power Fail
Using DCI TRACE32 cannot detect whether the target system is powered. Thus all connection losses are interpreted as power fails. In case you are encountering target power fails, but your target system is powered:
• Try a lower DCI OOB clock. For details, see SYStem.DCI.BssbClock.
• Consider removing common mode chokes in the USB path.
Debugging via Intel® DCI User´s Guide 12 ©1989-2019 Lauterbach GmbH
Intel® DCI Specific Commands
DCI Commands to configure the Intel® DCI trace handler
The Intel® DCI trace handler is a hardware module of the Intel® DCI implementation on the target system.
This module is responsible for forwarding trace data coming from the Intel® Trace Hub to a DCI transport.
The DCI command group allows expert control of this hardware module. If using the Intel® Trace Hub commands this configuration is done automatically (see ITH commands).
See also
■ DCI.DESTination ■ DCI.OFF ■ DCI.ON ■ SYStem.DCI
DCI.DESTination Set trace destination
Configures to which destination the trace data is routed.
See also
■ DCI
DCI.ON Enable trace handler
Enables the trace handler.
See also
■ DCI
Format: DCI.DESTination [OOB | DBC]
OOB (default) Stream the trace data to the Intel® DCI OOB interface.
DBC Stream the trace data to the Intel® DCI DbC interface (USB).
Format: DCI.ON
Debugging via Intel® DCI User´s Guide 13 ©1989-2019 Lauterbach GmbH
DCI.OFF Disable trace handler
Disables the trace handler.
See also
■ DCI
Format: DCI.OFF
Debugging via Intel® DCI User´s Guide 14 ©1989-2019 Lauterbach GmbH

SYStem.DCI Intel® DCI specific SYStem commands
Using the SYStem.DCI command group, you can configure target properties as well as the DCI OOB hardware.
See also
■ SYStem.DCI.Bridge ■ SYStem.DCI.BssbClock ■ SYStem.DCI.CKDIrouting ■ SYStem.DCI.DisCONnect ■ SYStem.DCI.DOrouting ■ SYStem.DCI.PortPower ■ SYStem.DCI.TimeOut ■ SYStem ■ SYStem.state ■ DCI ❏ SYStem.DCI.Bridge() ❏ SYStem.DCI.BssbClock()
▲ ’Intel® DCI Specific Functions’ in ’Debugging via Intel® DCI User´s Guide’
SYStem.DCI.Bridge Select DCI bridge
Configures TRACE32 for the specific DCI bridge implementation used in your system. For known Intel® SoCs and PCHs this setting is done automatically based on CPU/PCH settings.
See also
■ SYStem.DCI ❏ SYStem.DCI.Bridge()
SYStem.DCI.BssbClock Configure DCI OOB clock rate
Configures the operating frequency used by the TRACE32 DCI OOB hardware. The maximum frequency is 100 MHz.
Format: SYStem.DCI.Bridge <bridge_name>
Format: SYStem.DCI.BssbClock <frequency> [<slow_frequency>]
<frequency> Frequency during normal operation. Default: 100MHz.
<slow_frequency> Frequency used during connect and during low power phases. The default is based on the selected platform.
Debugging via Intel® DCI User´s Guide 15 ©1989-2019 Lauterbach GmbH
Example: Set frequency to 50 MHz.
See also
■ SYStem.DCI ❏ SYStem.DCI.BssbClock()
SYStem.DCI.CKDIrouting Routing of the CK and DI signals
Configures how the CK and DI signals are mapped to the super speed rx signals on the USB 3 connector of the target. This configuration option is available for 4-wire DCI OOB only. The configuration must be set before trying to connect.
See also
■ SYStem.DCI
SYStem.DCI.DisCONnect Force DCI disconnect
Terminates the low-level DCI connection.
SYStem.DCI.BssbClock 50.MHz
Format: SYStem.DCI.CKDIrouting [STRAIGHTthrough | CROSSover]
STRAIGHTthrough The signals CK and DI are routed in compliance with the Intel DCI specification. Set if the rx signals are connected one-to-one from the chip to the USB port.
CROSSover The signals CK and DI are routed contrary to the Intel DCI specification. Set if the rx signals are connected cross-over from the chip to the USB port.
Format: SYStem.DCI.DisCONnect
Debugging via Intel® DCI User´s Guide 16 ©1989-2019 Lauterbach GmbH

Normally TRACE32 will manage the connect and disconnect of the DCI connection used for the debug session automatically. However, in some cases explicit termination of the DCI connection is required, e.g., when TRACE32 is used together with the T32 Remote API.
See also
■ SYStem.DCI
SYStem.DCI.DOrouting Routing of the DO signals
Configures how the DO signal pair is mapped to the super speed tx signals on the USB 3 connector of the target. This configuration option is available for 4-wire DCI OOB only. The configuration must be set before trying to connect.
See also
■ SYStem.DCI
NOTE: SYStem.DCI.DisCONnect will not care about the overall state of your debug session before disconnecting.To avoid problems, execute SYStem.Down on all TRACE32 instances before executing this command.
Format: SYStem.DCI.DOrouting [AUTO | STRAIGHTthrough | CROSSover]
AUTO (default) TRACE32 tries to detect the routing automatically.
STRAIGHTthrough The signals DO+ and DO- are routed in compliance with the Intel DCI specification. Set if the tx signals are connected one-to-one from the chip to the USB port.
CROSSover The signals DO+ and DO- are routed opposed to the Intel DCI specification. Set if the tx signals are connected cross-over from the chip to the USB port.
Debugging via Intel® DCI User´s Guide 17 ©1989-2019 Lauterbach GmbH
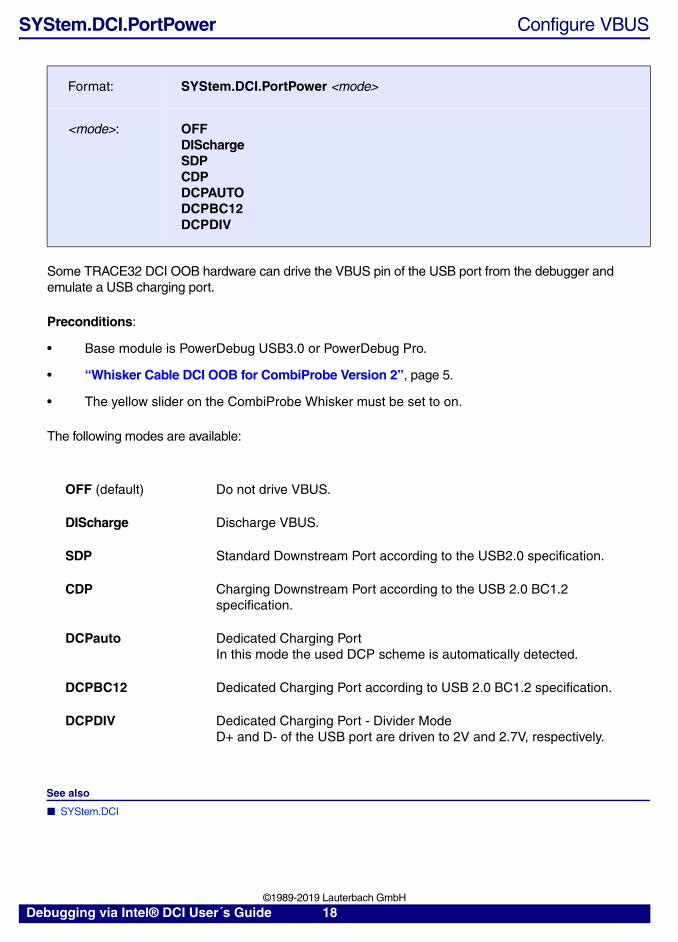
SYStem.DCI.PortPower Configure VBUS
Some TRACE32 DCI OOB hardware can drive the VBUS pin of the USB port from the debugger and emulate a USB charging port.
Preconditions:
• Base module is PowerDebug USB3.0 or PowerDebug Pro.
• “Whisker Cable DCI OOB for CombiProbe Version 2”, page 5.
• The yellow slider on the CombiProbe Whisker must be set to on.
The following modes are available:
See also
■ SYStem.DCI
Format: SYStem.DCI.PortPower <mode>
<mode>: OFFDISchargeSDPCDPDCPAUTODCPBC12DCPDIV
OFF (default) Do not drive VBUS.
DIScharge Discharge VBUS.
SDP Standard Downstream Port according to the USB2.0 specification.
CDP Charging Downstream Port according to the USB 2.0 BC1.2 specification.
DCPauto Dedicated Charging PortIn this mode the used DCP scheme is automatically detected.
DCPBC12 Dedicated Charging Port according to USB 2.0 BC1.2 specification.
DCPDIV Dedicated Charging Port - Divider ModeD+ and D- of the USB port are driven to 2V and 2.7V, respectively.
Debugging via Intel® DCI User´s Guide 18 ©1989-2019 Lauterbach GmbH

SYStem.DCI.TimeOut Configure timeouts of internal operations
Configure the timeout for certain internal operations. Do not change unless instructed to do so by the Lauterbach support.
The current value can be obtained using the SYStem.DCI.TimeOut() function.
See also
■ SYStem.DCI ❏ SYStem.DCI.TIMEOUT()
Format: SYStem.DCI.TimeOut <operation> <time>
<operation>: SETtingsJTAGPMChandshake
Debugging via Intel® DCI User´s Guide 19 ©1989-2019 Lauterbach GmbH
Intel® DCI Specific Functions
In This Section
See also
■ SYStem.DCI ❏ SYStem.DCI.Bridge() ❏ SYStem.DCI.BssbClock() ❏ SYStem.DCI.TIMEOUT()
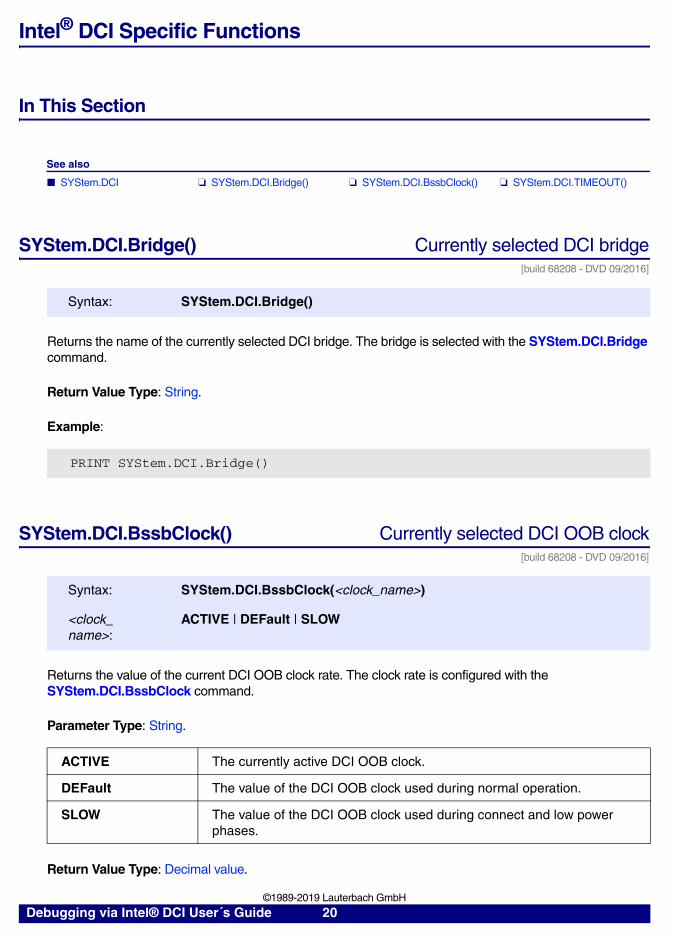
SYStem.DCI.Bridge() Currently selected DCI bridge[build 68208 - DVD 09/2016]
Returns the name of the currently selected DCI bridge. The bridge is selected with the SYStem.DCI.Bridge command.
Return Value Type: String.
Example:
SYStem.DCI.BssbClock() Currently selected DCI OOB clock[build 68208 - DVD 09/2016]
Returns the value of the current DCI OOB clock rate. The clock rate is configured with the SYStem.DCI.BssbClock command.
Parameter Type: String.
Return Value Type: Decimal value.
Syntax: SYStem.DCI.Bridge()
PRINT SYStem.DCI.Bridge()
Syntax: SYStem.DCI.BssbClock(<clock_name>)
<clock_name>:
ACTIVE | DEFault | SLOW
ACTIVE The currently active DCI OOB clock.
DEFault The value of the DCI OOB clock used during normal operation.
SLOW The value of the DCI OOB clock used during connect and low power phases.
Debugging via Intel® DCI User´s Guide 20 ©1989-2019 Lauterbach GmbH
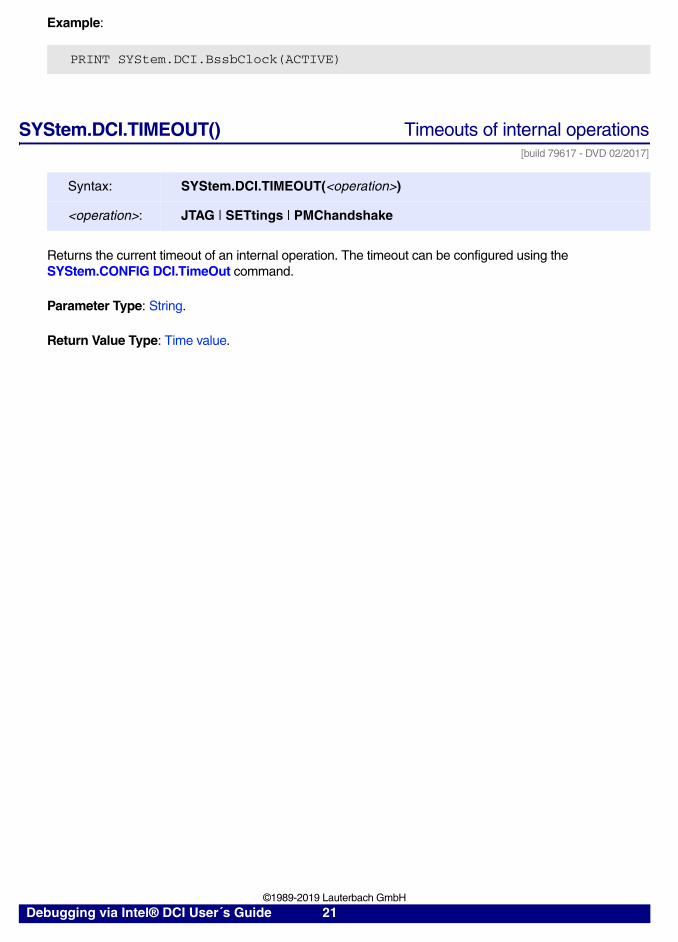
Example:
SYStem.DCI.TIMEOUT() Timeouts of internal operations[build 79617 - DVD 02/2017]
Returns the current timeout of an internal operation. The timeout can be configured using the SYStem.CONFIG DCI.TimeOut command.
Parameter Type: String.
Return Value Type: Time value.
PRINT SYStem.DCI.BssbClock(ACTIVE)
Syntax: SYStem.DCI.TIMEOUT(<operation>)
<operation>: JTAG | SETtings | PMChandshake
Debugging via Intel® DCI User´s Guide 21 ©1989-2019 Lauterbach GmbH


![Motor MTR-DCI - Festo · Descripción MTR-DCI-...-CO Descripción 539631 es 1209a [763214] Motor MTR-DCI](https://img.pdfslide.net/doc/110x75/5f777c2db26ccf0a2d169545/motor-mtr-dci-festo-descripcin-mtr-dci-co-descripcin-539631-es-1209a-763214.jpg)