Embed Size (px)
Citation preview
© 2012 Experian Information Solutions, Inc. All rights reserved. Experian and the marks used herein are service marks or registered trademarks of Experian Information Solutions, Inc.
Other product and company names mentioned herein are the trademarks of their respective owners. No part of this copyrighted work may be reproduced, modified,
or distributed in any form or manner without the prior written permission of Experian.
Experian Public.
Decisions vs. data points — A more intelligent trigger to reduce exposure and increase balance build
Eric Aston | Wells Fargo Credit Card
Jon Bailey | Experian
© 2012 Experian Information Solutions, Inc. All rights reserved.
Experian Public. 2
In a “big data” world
Colin Powell
Experts often possess
more data, than judgment. “ ”

© 2012 Experian Information Solutions, Inc. All rights reserved.
Experian Public. 3
© 2012 Experian Information Solutions, Inc. All rights reserved.
Experian Public. 4
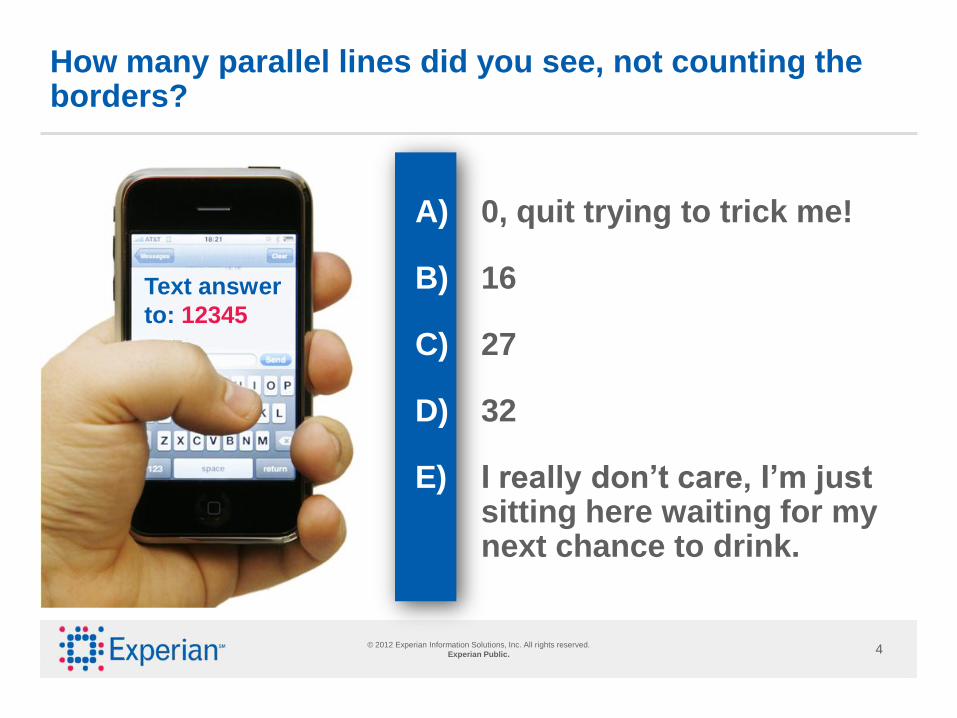
How many parallel lines did you see, not counting the borders?
Text answer
to: 12345
A) 0, quit trying to trick me!
B) 16
C) 27
D) 32
E) I really don’t care, I’m just sitting here waiting for my next chance to drink.
© 2012 Experian Information Solutions, Inc. All rights reserved.
Experian Public. 5
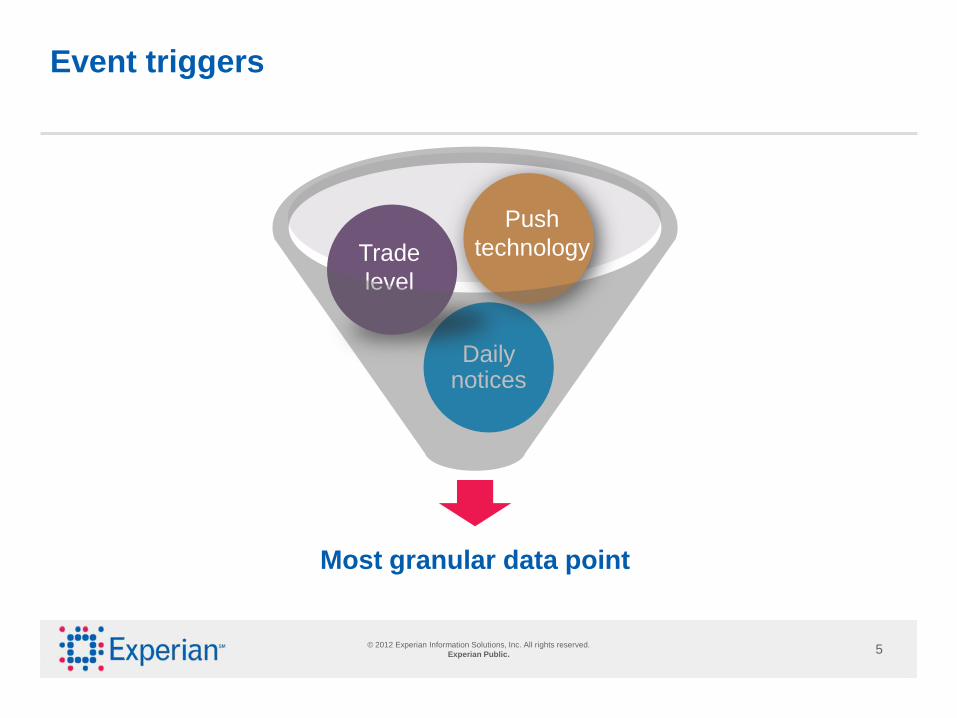
Event triggers
Most granular data point
Daily notices
Push
technology Trade
level

© 2012 Experian Information Solutions, Inc. All rights reserved.
Experian Public. 6
Most common trigger uses
Prospecting / cross-sell
New trade, inquiries
Direct mail, OBTM, email
Risk
Delinquencies, bankruptcies, public records
Line and authorization strategies
Retention
New trade, inquiries
Phone call followed by mail
Recovery
New contact information, positive improvement
Phone call

© 2012 Experian Information Solutions, Inc. All rights reserved.
Experian Public. 7
Why do you think some have chosen NOT to use triggers today?
Text answer
to: 12345
A) With so many triggers, how do I know which ones to use?
B) I already use credit triggers in my strategies today.
C) The false positives are just too high.
D) I can’t implement the dang things.
E) I really don’t care, I’m just sitting here waiting for my next chance to drink.

© 2012 Experian Information Solutions, Inc. All rights reserved.
Experian Public. 8
Dispelling the Triggers myth
Too many triggers –
which ones matter?
False positives are a problem.
I love the concept,
but implementation?

© 2012 Experian Information Solutions, Inc. All rights reserved.
Experian Public. 9
Pattern for success
Analysis Deployment
Treatments Monitor
Hosted vs. non-hosted options
Identify most predictive triggers and
the appropriate population to monitor
Measure success and improve when needed
Incorporate triggers into current strategies
© 2012 Experian Information Solutions, Inc. All rights reserved.
Experian Public. 10
Wells Fargo case study
© 2012 Experian Information Solutions, Inc. All rights reserved.
Experian Public. 10
Eric Aston
Vice President | Wells Fargo Credit Card
© 2012 Experian Information Solutions, Inc. All rights reserved.
Experian Public. 11
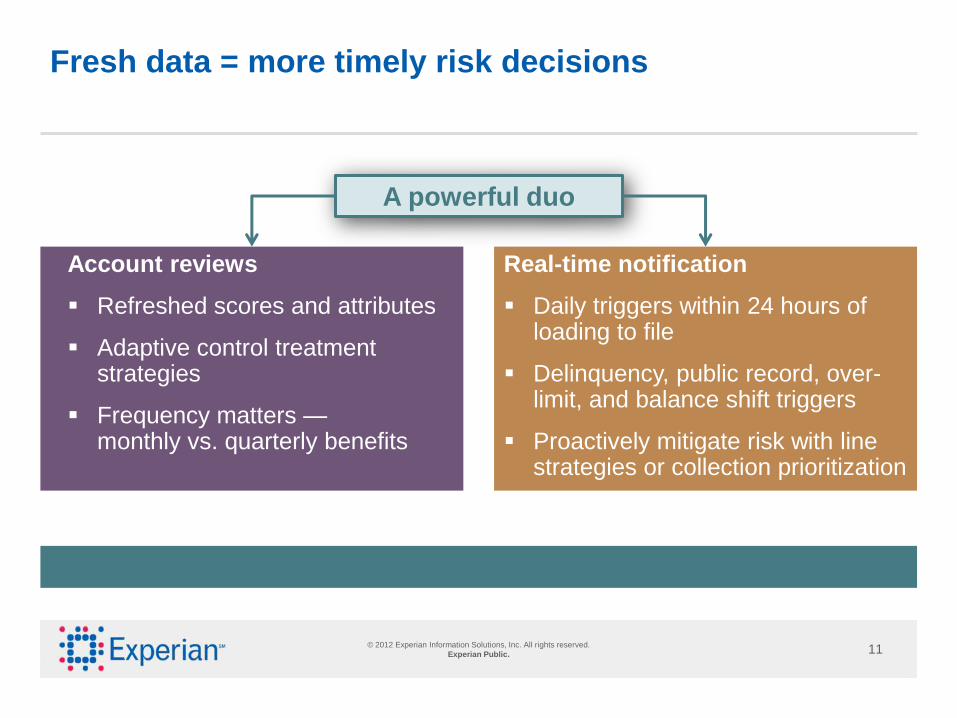
Fresh data = more timely risk decisions
Account reviews
Refreshed scores and attributes
Adaptive control treatment strategies
Frequency matters — monthly vs. quarterly benefits
Real-time notification
Daily triggers within 24 hours of loading to file
Delinquency, public record, over-limit, and balance shift triggers
Proactively mitigate risk with line strategies or collection prioritization
A powerful duo
© 2012 Experian Information Solutions, Inc. All rights reserved.
Experian Public. 12
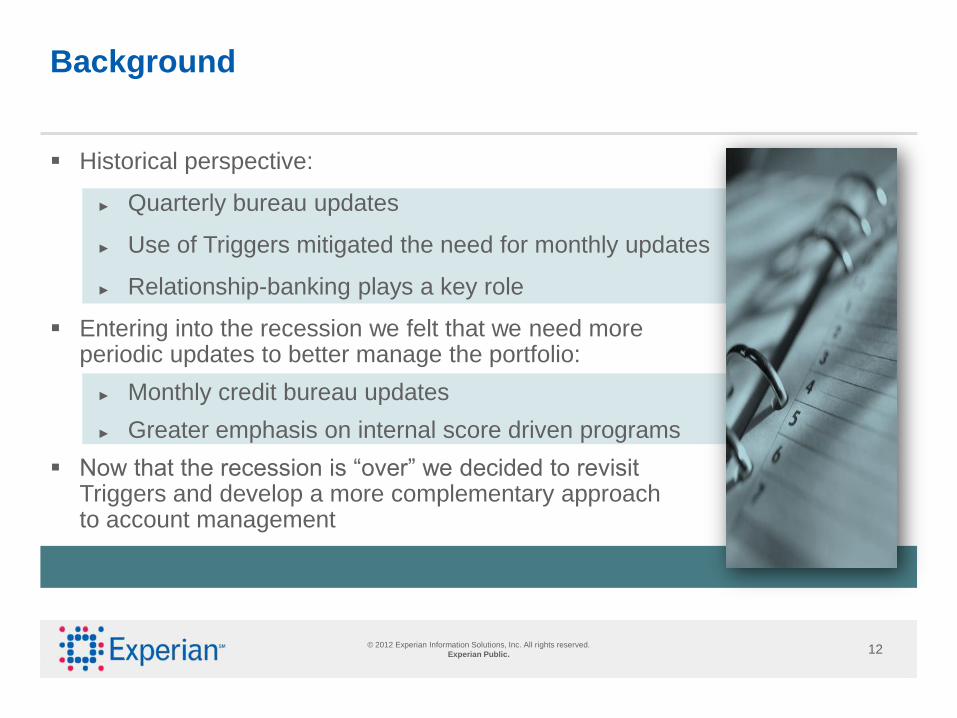
Background
Historical perspective:
► Quarterly bureau updates
► Use of Triggers mitigated the need for monthly updates
► Relationship-banking plays a key role
Entering into the recession we felt that we need more periodic updates to better manage the portfolio:
► Monthly credit bureau updates
► Greater emphasis on internal score driven programs
Now that the recession is “over” we decided to revisit Triggers and develop a more complementary approach to account management
© 2012 Experian Information Solutions, Inc. All rights reserved.
Experian Public. 13
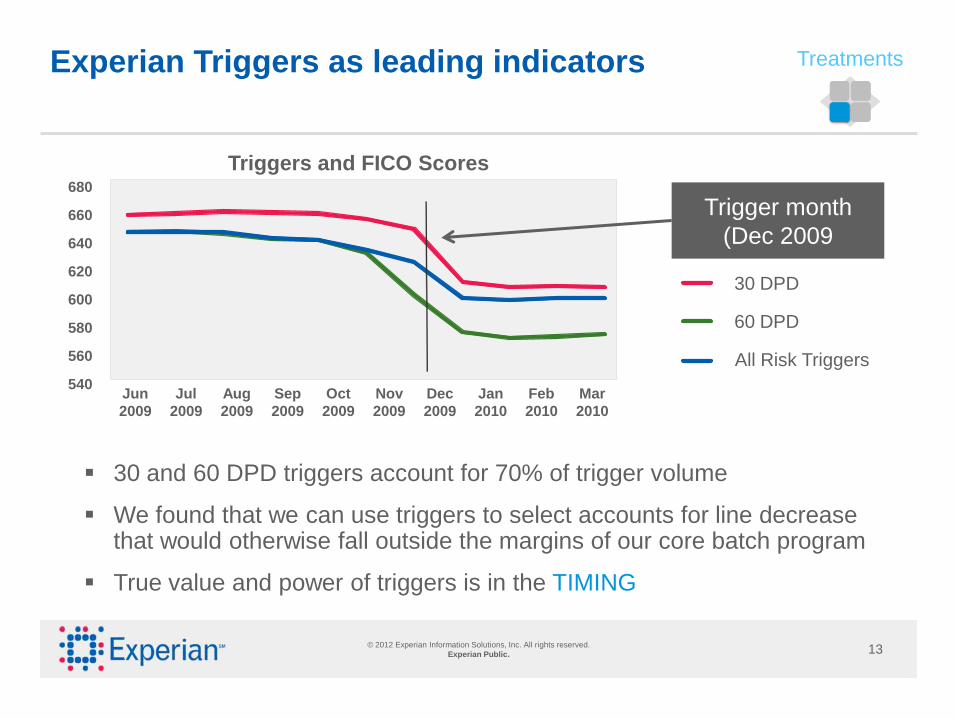
Experian Triggers as leading indicators
30 and 60 DPD triggers account for 70% of trigger volume
We found that we can use triggers to select accounts for line decrease that would otherwise fall outside the margins of our core batch program
True value and power of triggers is in the TIMING
540
560
580
600
620
640
660
680
Triggers and FICO Scores
30 DPD
60 DPD
All Risk Triggers
Jun
2009
Jul
2009
Aug
2009
Sep
2009
Oct
2009
Nov
2009
Dec
2009
Jan
2010
Feb
2010
Mar
2010
Trigger month
(Dec 2009
Treatments
© 2012 Experian Information Solutions, Inc. All rights reserved.
Experian Public. 14
Methodology
Evaluate risk triggers (delinquency, major derogatory, public record, etc.) within the context of our core high risk programs
Assess overlap and incremental value of triggers
Obtain retro file to evaluate new triggers such as over limit, credit inquiries, new trade, and CLUB – TBD
Analysis design:
► Three months stacked trigger data
► 20 months performance
► Develop credit criteria – Decision Tree, etc.
► Evaluate performance
► Financial considerations
Analysis

© 2012 Experian Information Solutions, Inc. All rights reserved.
Experian Public. 15
Triggered account performance
Comparing the number of bad rates and dollar amount of bad rates (charge-off or three or more delinquencies) of the triggered population to the overall portfolio we observed the following lifts:
Number of bad rates percentage: 356%
Dollar amount of bad rates percentage: 206%
Monitor
© 2012 Experian Information Solutions, Inc. All rights reserved.
Experian Public. 16
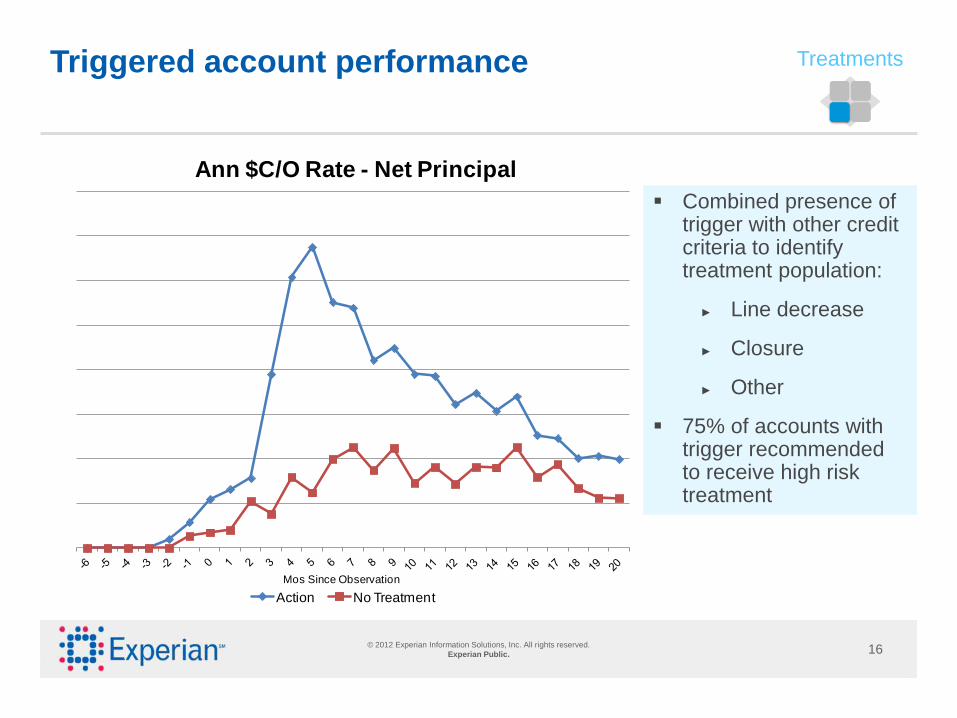
Triggered account performance
Combined presence of trigger with other credit criteria to identify treatment population:
► Line decrease
► Closure
► Other
75% of accounts with trigger recommended to receive high risk treatment
Mos Since Observation
Ann $C/O Rate - Net Principal
Action No Treatment
Treatments
© 2012 Experian Information Solutions, Inc. All rights reserved.
Experian Public. 17
Deployment
Historically, we managed our triggers strategy on a platform imbedded on a third party processing system
This time around, we opted to go with an “in-house” platform:
► Worked with technology counterparts to build out infrastructure
► Flexibility, better audit capability, production data, expense reduction, test / control capabilities
► Daily triggers transmission from Experian
► Apply segmentation and credit criteria to assign a proposed treatment:
● Line decrease
● Account closure
● Other
● No action
► Post treatment to the account with supporting memo
Deployment
© 2012 Experian Information Solutions, Inc. All rights reserved.
Experian Public. 18
Incremental value of triggers
Experian triggers added value to high risk account management for two primary reasons (from a purely line decrease perspective):
Deployment
Incremental population
Majority of triggered accounts would not have otherwise been picked up by our core line decrease program
Triggers allowed us to select accounts outside the margins
Accounts that would have qualified at a later date from a score perspective no longer had sufficient open to buy for treatment
Earlier detection of high risk accounts:
Minority of triggered accounts would have been selected by our core line decrease batch program
Ability to treat accounts sooner on average
Mitigate additional bad balance build
© 2012 Experian Information Solutions, Inc. All rights reserved.
Experian Public. 19
Analysis summary
Triggers allow us to make more timely risk decisions and provide incremental value to high risk account management strategy through:
► Identification of incremental high risk population
► Earlier treatment of accounts where internal scores do not yet pick up on the risk due to data latency
Accounts that receive high risk triggers exhibit substantially higher credit risk in the multiple
© 2012 Experian Information Solutions, Inc. All rights reserved.
Experian Public. 20
New trigger concepts
© 2012 Experian Information Solutions, Inc. All rights reserved.
Experian Public. 20
© 2012 Experian Information Solutions, Inc. All rights reserved.
Experian Public. 21
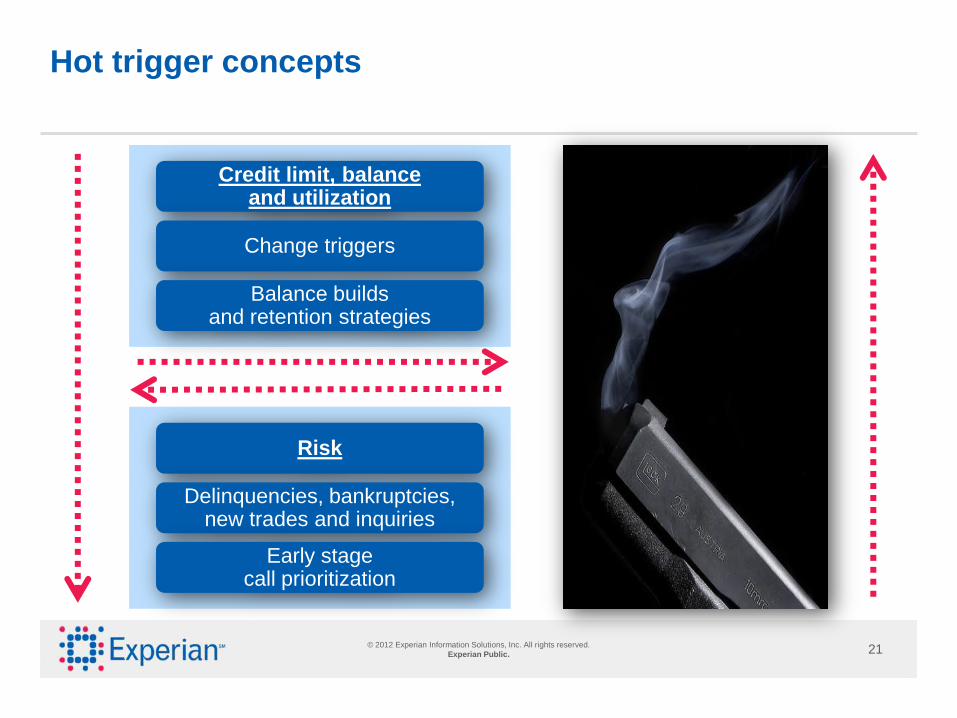
Hot trigger concepts
Credit limit, balance and utilization
Change triggers
Balance builds and retention strategies
Risk
Delinquencies, bankruptcies, new trades and inquiries
Early stage call prioritization

© 2012 Experian Information Solutions, Inc. All rights reserved.
Experian Public. 22
Data overview Balance growth
Starting population: Open with a balance and not worse than 60+ DPD
as of January 2010
Jan 2010
Observation period
12-month performance window
Aug 2011
Feb 2010
Triggers simulated
Aug 2010
July 2010
Performance period
Performance
definitions:
Bad:
Balance between Aug. 2010
and Aug. 2011 is less than
50% of the balance from
Jan. 2010
Good:
Balance between Aug. 2010 and
Aug. 2011 is 50%+ compared to Jan.
2010 balance AND never worse than
30 days late after Aug. 2010
Ind:
Not bad or good,
as described
previously
Analysis

© 2012 Experian Information Solutions, Inc. All rights reserved.
Experian Public. 23
Balance decrease Top-10 (10.5% bad rate)
Trigger type % Bad % Lift
1. Chapter 11 - PETITION 100% 852.3%
2. Chapter 7 - PETITION 86.5% 723.6%
3. Chapter 13 - PETITION 84.2% 701.9%
4. Business new loan 33.3% 217.4%
5. Recreational loan 21.4% 104.1%
6. Mortgage new loan 20.4% 94.1%
7. 60 DPD trade 19.6% 86.2%
8. Voluntary surrender 19.4% 85.2%
9. Closed with $0 balance 18.2% 73.1%
10. 90 DPD trade 18% 71.6%
14. Bankcard new trade 16.7% 58.9%
Balance decrease results Analysis
© 2012 Experian Information Solutions, Inc. All rights reserved.
Experian Public. 24
Treatment strategies
Risk management actions for bankruptcies, delinquencies, voluntary surrenders
Courtesy call after a new trade trigger
► Spend to get incentives
► Rewards and rate plays to most profitable consumers
Utilize triggers with additional data
► Behavioral score
► Spend models
► Profitability metric
Intra-cycle decision capabilities
Treatments

© 2012 Experian Information Solutions, Inc. All rights reserved.
Experian Public. 25
Data overview Risk
Starting population: Open and not worse than 60+ DPD as of January 2010
Performance
definitions:
Bad:
90+ days late over the
performance period
Good:
No worse than 30 days late
over the performance period
Ind:
60 days late, but never
worse, over the performance
period
Jan 2010
Observation period
19-month performance window
Aug 2011
Feb 2010
Triggers simulated
Performance period
Analysis

© 2012 Experian Information Solutions, Inc. All rights reserved.
Experian Public. 26
Risk Top-10 (5.27% bad rate)
Trigger type % Bad % Lift
1. Chapter 11 - PETITION 100% 1797%
2. 60 DPD trade 32.9% 525%
3. Repossession 32.6% 518%
4. 90 DPD trade 30.1% 471%
5. Closed $0 bal, was 120 29.4% 458%
6. 120 DPD trade 28.9% 448%
7. Closed $0 bal, was 180 28.1% 435%
8. 30 DPD trade 27.8% 428%
9. 150 DPD trade 27.4% 420%
10. Charge-off 26.9% 410%
Risk results Analysis

© 2012 Experian Information Solutions, Inc. All rights reserved.
Experian Public. 27
Trigger performance Do multiple triggers increase benefit?
0%
10%
20%
30%
40%
50%
Number of trigger events
Overall 1 2 3 4 5
Analysis
© 2012 Experian Information Solutions, Inc. All rights reserved.
Experian Public. 28
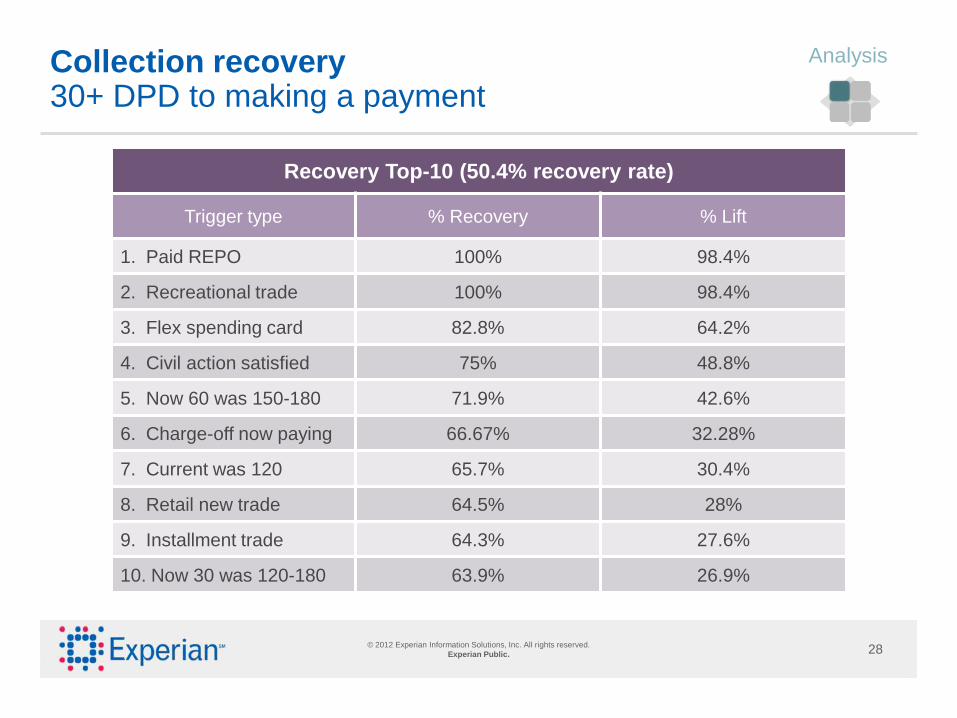
Recovery Top-10 (50.4% recovery rate)
Trigger type % Recovery % Lift
1. Paid REPO 100% 98.4%
2. Recreational trade 100% 98.4%
3. Flex spending card 82.8% 64.2%
4. Civil action satisfied 75% 48.8%
5. Now 60 was 150-180 71.9% 42.6%
6. Charge-off now paying 66.67% 32.28%
7. Current was 120 65.7% 30.4%
8. Retail new trade 64.5% 28%
9. Installment trade 64.3% 27.6%
10. Now 30 was 120-180 63.9% 26.9%
Collection recovery 30+ DPD to making a payment
Analysis
© 2012 Experian Information Solutions, Inc. All rights reserved.
Experian Public. 29
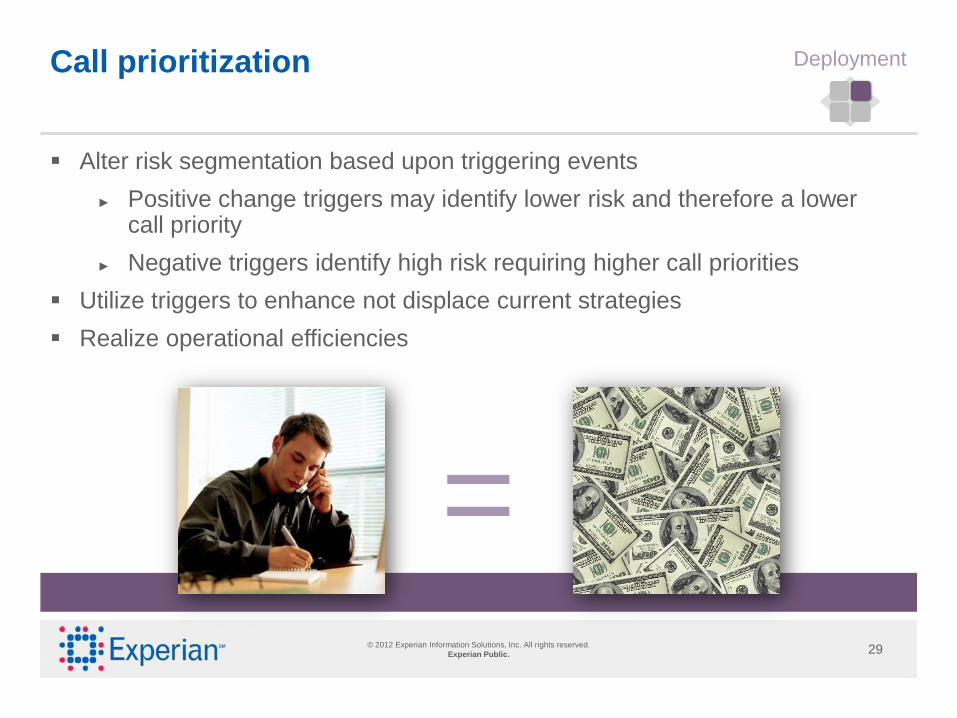
Call prioritization
Alter risk segmentation based upon triggering events
► Positive change triggers may identify lower risk and therefore a lower call priority
► Negative triggers identify high risk requiring higher call priorities
Utilize triggers to enhance not displace current strategies
Realize operational efficiencies
=
Deployment
© 2012 Experian Information Solutions, Inc. All rights reserved.
Experian Public. 30
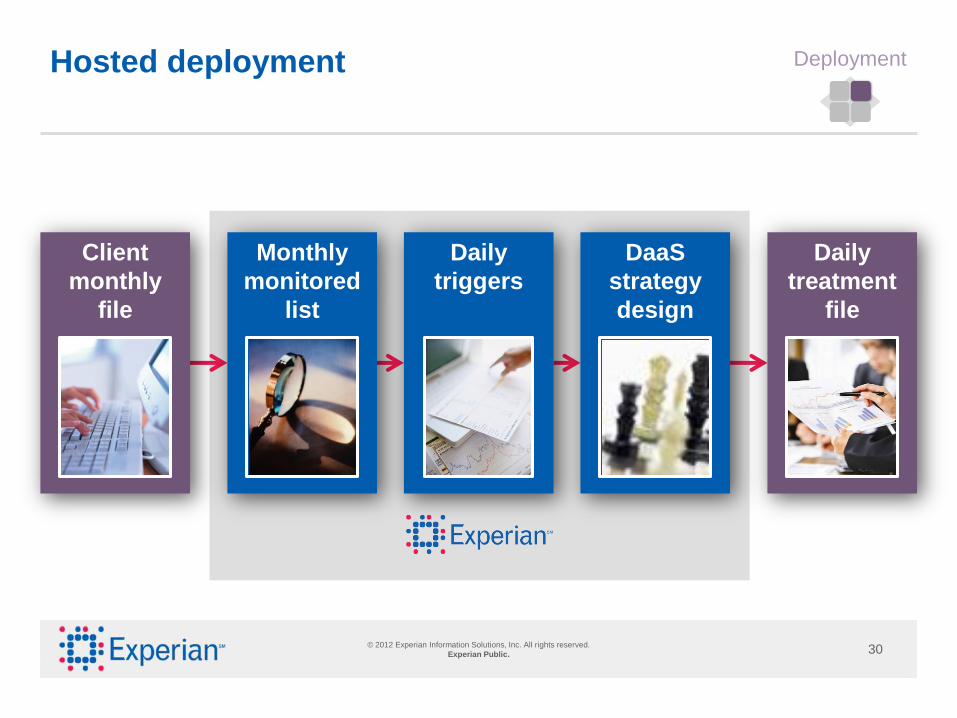
Hosted deployment Deployment
Client
monthly
file
Daily
triggers
DaaS
strategy
design
Monthly
monitored
list
Daily
treatment
file

© 2012 Experian Information Solutions, Inc. All rights reserved.
Experian Public. 31
When correctly deployed, a typical trigger program return on investment is….?
Text answer
to: 12345
A) 3:1
B) 5:1
C) 10+:1
D) Again, I really don’t care. Where’s my drink?
© 2012 Experian Information Solutions, Inc. All rights reserved.
Experian Public. 32
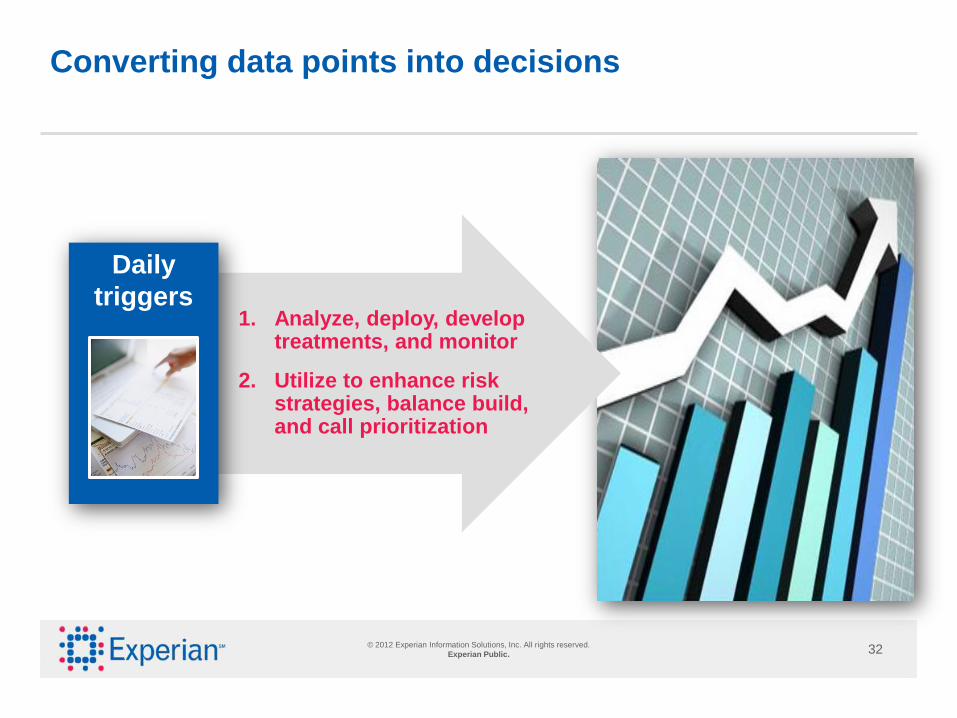
Converting data points into decisions
1. Analyze, deploy, develop treatments, and monitor
2. Utilize to enhance risk strategies, balance build, and call prioritization
Daily
triggers

© 2012 Experian Information Solutions, Inc. All rights reserved.
Experian Public. 33
Questions and answers
© 2012 Experian Information Solutions, Inc. All rights reserved.
Experian Public. 33
© 2012 Experian Information Solutions, Inc. All rights reserved.
Experian Public. 34
The time is now
David Letterman
Next in importance to
having a good aim is to
recognize when to pull
the trigger.
“
”

© 2012 Experian Information Solutions, Inc. All rights reserved.
Experian Public. 35
For additional information, please contact:
Vision Expert Annex Open every morning, afternoon and during session breaks
Meet session speakers
Gather information on Experian products and services
Request research and complimentary materials
Schedule one-on-one meetings with Experian experts

May 6–9 • The Phoenician • Scottsdale, Ariz.
© 2012 Experian Information Solutions, Inc. All rights reserved.
Experian Public.