Embed Size (px)
Citation preview

Deep Learning 1
Running head: DEEP LEARNING
Deep Learning and College Outcomes: Do Fields of Study Differ?
Thomas F. Nelson Laird Research Analyst
Indiana University Center for Postsecondary Research 1900 East Tenth Street
Eigenmann Hall, Suite 419 Bloomington, IN 47406-7512
[email protected] Phone: 812.856.6056
Rick Shoup
Research Analyst Indiana University Center for Postsecondary Research
George D. Kuh
Chancellor’s Professor and Director Indiana University Center for Postsecondary Research
Paper presented at the Annual Meeting of the Association for Institutional Research, May 29 – June 1, 2005
San Diego, CA

Deep Learning 2
Abstract
Deep Learning and College Outcomes: Do Fields of Study Differ?
Students have more learning potential than traditional pedagogical methods often tap. To more fully develop student talents, many campuses are shifting from a passive, instructor-dominated pedagogy to active, learner-centered activities. This study uses data from the National Survey of Student Engagement to assess a proxy for deep learning and to examine the relationships between deep learning and selected educational outcomes. The results indicate that students who engage more frequently in deep learning behaviors report greater educational gains, higher grades, and are more satisfied with college. However, these patterns vary by disciplinary area.

Deep Learning 3
Deep Learning and College Outcomes: Do Fields of Study Differ?
Students have more learning potential than traditional pedagogical methods often tap.
With this in mind, colleges and universities are devoting significant effort to redesigning
teaching and learning environments. Findings from the National Survey of Student Engagement
(2000, 2001, 2002, 2003, 2004) suggest that these efforts are paying off in that the vast majority
of students at least “sometimes” engage in various forms of active and collaborative learning
activities during a given academic year. This shift from passive, instructor-dominated pedagogy
to active, learner-centered activities promises to take students to deeper levels of understanding
and meaning as they apply what they are learning to real life examples in the company of others
(Lave & Wegner, 1991, Tagg, 2003).
Students take different approaches to learning, with the outcomes of learning closely
associated with the chosen approaches (Ramsden, 2003). The phrase “deep learning” is
attributed to Marton and Säljö (1976) who discerned qualitative distinctions in the ways students
responded to various learning tasks that were linked to certain approaches to processing
information. Students using “surface-level processing” focus on the substance of information
and emphasize rote learning and memorization techniques (Biggs, 1989; Tagg, 2003). The goal
of studying for a test or exam is to avoid failure, instead of grasping key concepts and
understanding their relation to other information and how the information applies in other
circumstances (Bowden & Marton, 1998).
In contrast, students using “deep-level processing” focused not only on substance but also
the underlying meaning of the information. Scholars (Biggs, 1987, 2003; Entwistle, 1981;
Ramsden, 2003; Tagg, 2003) generally agree that deep learning is represented by a personal
commitment to understand the material which is reflected in using various strategies such as

Deep Learning 4
reading widely, combining a variety of resources, discussion ideas with others, reflecting on how
individual pieces of information relate to larger constructs or patterns, and applying knowledge
in real world situations (Biggs, 1989). Also characteristic of deep learning is integrating and
synthesizing information with prior learning in ways that become part of one’s thinking and
approaching new phenomena and efforts to see things from different perspectives (Ramsden,
2003; Tagg, 2003). As Tagg (2003, p. 70) put it, “Deep learning is learning that takes root in our
apparatus of understanding, in the embedded meanings that define us and that we use to define
the world.”
The reason deep learning is important is because students who use such an approach tend
to earn higher grades, and retain, integrate and transfer information at higher rates (Biggs 1988,
1989; Entwistle & Ramsden, 1983; Prosser & Millar, 1989; Ramsden, 2003; Van Rossum &
Schenk, 1984; Whelan, 1988). Additionally, deep learning is associated with an enjoyable
learning experience while the surface approach tends to be less satisfying (Tagg, 2003).
Surface and deep approaches to learning are not unalterable behaviors, though they may
be influenced by personal characteristics such as ability (Biggs, 1987). But using one or the
other approach is also affected in part by the learning task itself and the conditions under which
the task is performed (Biggs, 1987; Ramsden, 2003). Thus, students may use both surface and
deep approaches at different points in their studies. Although students may adopt different
approaches in different situations, the general tendency is to adopt a particular approach and
stick with it (Biggs, 1987; Entwistle, 1981; Ramsden, 2003).
In addition, the learning context seems to have a substantial effect on how students
approach learning tasks (Beatie, Collins, & McInnes, 1997; Biggs, 1978; Biggs & Moore, 1993;
Eley 1992; Gow, Kember & Cooper, 1994; Ramsden 2003; Tagg, 2003; Zeegers, 2001). That is,
Deep Learning 5
the interaction between a student and the course structure, curriculum content, and methods of
teaching and assessment shape whether a student will gravitate toward a surface or deep
approach (Biggs, 1989; Entwistle & Ramsden, 1983).
If the teaching context influences the chosen learning approach, it is possible that the
learning approaches students use vary in systematic ways between fields of study as does the
content of these fields (National Research Council, 1999; Zeegers, 2001). That is, because
academic tasks differ from one discipline to another, perhaps the patterns of learning approaches
students use will vary in similar ways (Ramsden, 2003).
For example, accounting students are more likely to use surface learning approaches
compared with other students (Booth, Luckett, & Mladenovic, 1999; Eley, 1992, Gow, Kember
& Cooper, 1994). Until recently, surface learning tended to dominate in engineering (Myer,
Parsons & Dunne, 1990), as Felder and Brent (2005, p. 57) noted: “A single approach has
dominated engineering education since its inception: the professor lectures and the students
attempt to absorb the lecture content and reproduce it in examinations. That particular size fits
almost nobody: it violates virtually every principle of effective instruction established by
modern cognitive science and educational psychology.” Other studies examined deep learning in
chemistry (Zeegers & Martin, 2001), geography (Hill & Woodland, 2002), health sciences
(Newble & Clarke, 1985), and physics (Prosser & Millar, 1989).
Measuring Deep Learning
The two most widely used assessments of deep learning are Bigg’s Study Process
Questionnaire (SPQ) and Entwistle and Ramsden’s Approaches to Study Inventory (ASI) (Biggs,
1987, Ramsden & Entwistle, 1981, Entwistle & Ramsden, 1983). Both inventories were
designed for use in higher education (Entwistle & McCune, 2004) and have been revised in

Deep Learning 6
recent years to update wording, reduce items, and incorporate new research on learning (Biggs,
Kember & Leung, 2001; Gibbs, Habeshaw, & Habeshaw, 1989; Entwistle & Tait, 1994). The
SPQ consists of 42 items, with three “main approach” scales (deep, surface, and achieving) and
six sub-scales that divide the core scales into motives and strategies. SPQ scores are indicators
of the preferred, ongoing, and contextual approaches to learning (Biggs, Kember & Leung,
2001). SPQ items address higher-order learning (e.g., “While I am studying, I often think of real
life situations to which the material that I am learning would be useful”), integration (e.g., “I try
to relate what I have learned in one subject to that in another”) and reflection (e.g., “In reading
new material I often find that I’m continually reminded of material I already know and see the
latter in a new light”). Similar to the SPQ in design, the ASI contains 64 items and 16 subscales
that contribute to three main factors: reproducing orientation, meaning orientation, and achieving
orientation (Entwistle & McCune, 2004).
Purpose of the Study
The purpose of this study is twofold. First, we examine how the amount students engage in
a deep approach to learning varies by disciplinary area. To what extent do college students
engage in deep learning behaviors? Does the preference for deep learning approaches vary
systematically by field of study? Because most students report participating in active and
collaborative learning activities, it is likely that we will find many students engaging in deep
learning. At the same time, deep learning practices will likely vary across major fields, as
suggested by previous research.
The second purpose of the study is to examine whether deep learning approaches are linked
with student self-reported gains in personal and intellectual development, satisfaction with

Deep Learning 7
college, and self-reported grades. We are also interested in whether the patterns of the
relationships between deep learning and student outcomes vary by disciplinary area.
Methods
Data Source
The data for this study come from the 2004 administration of the National Survey of
Student Engagement (NSSE), an annual survey of college students at four-year institutions that
measures students’ participation in educational experiences that prior research has connected to
valued outcomes (Chickering & Gamson, 1987; Kuh, 2001, 2003; Pascarella & Terenzini, 2005).
About 500,000 first-year students and seniors were randomly selected from files provided by the
473 participating colleges and universities. The standard NSSE sampling scheme draws equal
numbers of first-year and senior students, with the size determined by the number of
undergraduate students enrolled at the institution. Students at about two-fifths (42%) of the
institutions had the option of responding either via a traditional paper questionnaire or online.
Slightly fewer of the colleges and universities (37%) opted to administer only online, where
students received an introduction letter through the mail and all further contact was online. The
remaining institutions opted to administer primarily online with a paper survey being sent to non-
responders.
Sample
The sample for this study, after deletion for missing data, consists of 51,233 seniors from
439 four-year colleges and universities across the country. Given our focus on disciplinary area,
seniors were selected because they have the most experience in their chosen fields. Of the seniors
in the sample, 16% were in the arts and humanities, 7% were in a biological science, 18% were
in business, 10% were in education, 6% were in engineering, 4% were in a physical science

Deep Learning 8
(including mathematics), 6% were in a professional field such as architecture, urban planning or
nursing, 15% were in a social science, and the remaining 18% were in other fields such as public
administration, kinesiology, and criminal justice.
Out of the total number of respondents, approximately 62% were female, 81% were white
(5% African American, 5% Asian, 3% Hispanic, 1% Native American, < 1% other racial/ethnic
background, and 5% multi-racial or ethnic), and 31% were first generation college students. In
addition, 33% transferred from another institution, 51% lived on or near campus, about 14%
were members of a social fraternity or sorority, and 89% are full-time students.
All of the students in this study completed the online version of the NSSE survey, since the
experimental items, including the reflective learning items, are only administered online. Online
completers differ in some ways from those students who fill out the paper survey. For example,
a larger percentage of women and students of certain racial/ethnic groups (African American,
Latino/a, and American Indian) fill out the paper version of the survey. Also, paper completers
are more likely to be older, part-time, live off campus, have parents with less formal education,
and have transferred from a different institution. However, after controlling for these
differences, online and paper completers do not appear to engage in effective educational
practices at appreciably different levels (Carini, Hayek, Kuh, Kennedy, & Ouimet, 2003).
Response rates at the participating institutions ranged from 9% to 89% with an average
institutional response rate for NSSE 2004 of 40%. Although response rates varied by institution,
the average for paper schools (institutions where students had the option of completing either the
paper or the Web version of the survey) was nearly identical to that of Web-only schools
(institutions where students only had the option of completing the survey online), about 40% and

Deep Learning 9
41%, respectively. In 2004, about 22% of the respondents completed the paper version of the
survey and approximately 78% completed it using the Web.
Measures
The survey itself, The College Student Report, focuses on student participation in effective
educational practices. For example, students are asked to identify how often they make class
presentations, participate in a community-based project as a part of a course, and work with
faculty members on activities other than coursework. In addition, students identify the degree to
which their courses emphasize different mental processes (e.g., memorizing, evaluating,
synthesizing), how many hours per week they spend studying, working, or participating in co-
curricular activities, as well as how they would characterize their relationships with people on
campus. The survey is available at the NSSE website, www.iub.edu/~nsse.
Each year, NSSE tests new survey items. In 2004, based on growing interest in deep
learning, a set of items about reflective learning were included at the end of the online NSSE
survey to augment core survey questions about higher order learning and integrative learning.
Taken together, the items in Table 1 are reliable proxy measures of student participation in
activities that represent a deep approach to learning (α = 0.89). These behaviors are divided into
three sub-scales—higher order learning, integrative learning, and reflective learning—that reflect
areas tapped by other measures of deep learning (Biggs, 1987, Ramsden & Entwistle, 1981,
Entwistle & Ramsden, 1983). The higher order learning subscale (α = 0.82) focuses on the
amount students believe that their courses emphasize advanced thinking skills such as analyzing
the basic elements of an idea, experience, or theory and synthesizing ideas, information, or
experiences into new, more complex interpretations. The integrative learning subscale (α = 0.71)
contains items that center around the amount students participate in activities that require

Deep Learning 10
integrating ideas from various sources, including diverse perspectives in their academic work,
and discussing ideas with others outside of class.
The reflective learning sub-scale (α = 0.89) was developed for the 2004 administration of
NSSE to complement the higher order and reflective learning items that have been on the core
survey for several years. Central to the reflective learning behaviors is the notion that students
can learn and expand their understanding by investigating their own thinking and then applying
their new knowledge to their lives. The items ask, for example, how often students examined the
strengths and weaknesses of their own views, learned something that changed their
understanding, and applied what they learned in a course to their personal life of work.
The three outcome measures are (Appendix B):
(1) student gains in personal and intellectual development, a 16-item scale (α = 0.91) that
measures how much students believe they have gained in areas such as acquiring a
broad general education, writing clearly and effectively, thinking critically and
analytically, learning effectively on their own, understanding themselves, and solving
complex real-world problems.
(2) Grades, a single self-reported item that ranges from C- or lower to A. Self-reported
grades correlate well (.8 or so) with actual grades (Olsen et al., 1998).
(3) Satisfaction, a two-item measure of students’ satisfaction with their collegiate
experience (α = 0.79) represented by students’ rating of their entire educational
experience at an institution and the likelihood that they would attend the same
institution if they were to start over again.
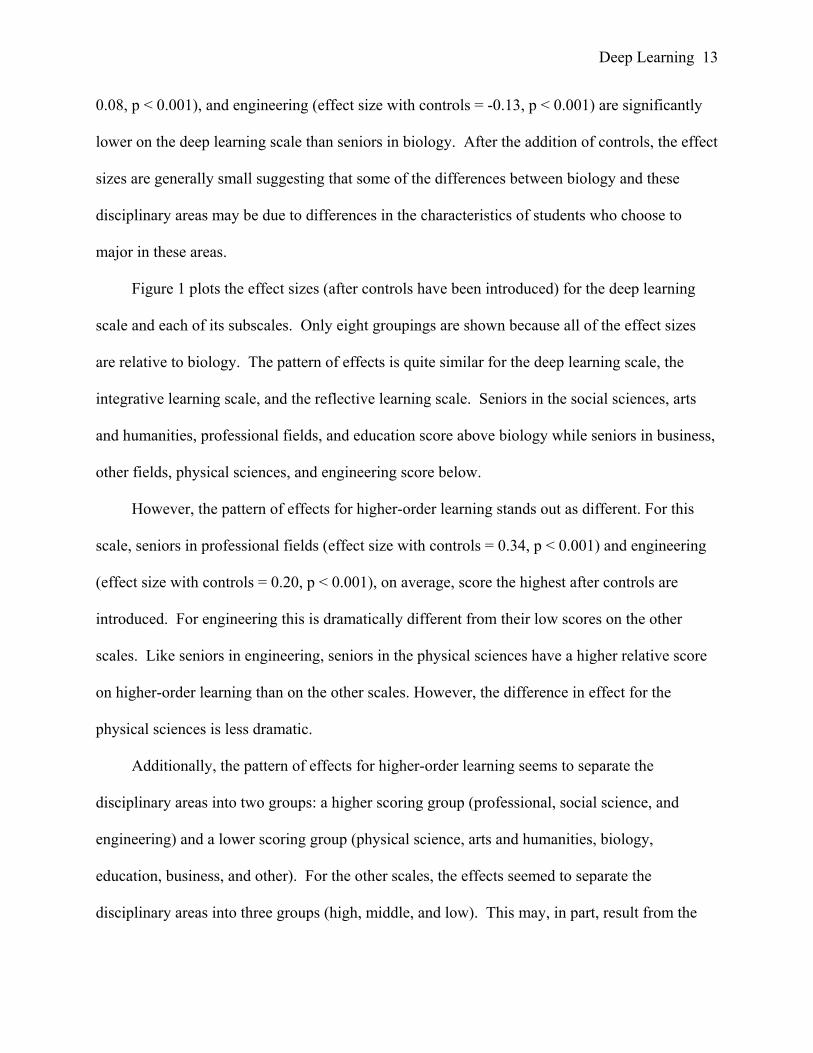
Control variables include student characteristics such as gender, race, and first generation
college student status (Appendix A).

Deep Learning 11
Data Analyses
For our analyses, we divide students into nine disciplinary areas based on the primary
major they indicated on the survey: arts and humanities, biological sciences, business, education,
engineering, physical sciences, professional, social sciences, and other. The first eight categories
reflect groups of fields and disciplines common on college campuses. The “other” category
contains those fields or disciplines that were not easily categorized, such as family studies,
criminal justice, and military science.
To examine disciplinary differences in the amount students engage in a deep approach to
learning, we conducted three analyses. First, the means for each group are calculated and a mean
difference is computed between each disciplinary area and the biological sciences. Biology was
selected as the comparison group because the mean of biology students across the four deep
learning scales (the total scale, higher order learning, integrative learning, and reflective
learning) was consistently middling. Consequently, we could test to see whether students in
other areas scored significantly above or below this middle group.
To test the significance of differences between disciplinary areas and to gauge how
meaningful the differences were, we calculated effect sizes for the mean difference both with and
without the addition of control variables such as gender, race, and full-time/part-time status (see
Appendix A for all control variables used). To calculate the effect sizes, regression analyses
were run, first without controls and then with controls, on each deep learning scale. In the
regression models, all non-dichotomous variables were standardized prior to entry. As a result,
in each model, the unstandardized coefficient is an estimate of the effect size.
The relationships between the deep learning scales and the three student outcomes (see
Appendix B) are explored using partial correlations that control for the same variables used in

Deep Learning 12
the regression analyses. Partial correlations were computed for each of the nine disciplinary
groupings to determine if the strength of the relationships varied by discipline.
Results
Tables 2 through 5 contain the results of the mean comparisons for the deep learning scale
and its subscales by disciplinary area. In each table, disciplinary groupings are listed in rank
order according to their mean on the corresponding deep learning scale. The results suggest that,
on average, seniors “frequently” (often or very often) engage in deep approaches to learning as
the means for all seniors range from 2.80 to 3.15 where 1 is either “never” or “very little” and 4
is either “very often” or “very much”.
Deep learning varies across disciplines. The difference of the means for the lowest scoring
group and the highest scoring group is about two-thirds of a standard deviation for each scale.
While these are appreciable differences, they are not so large so as to indicate that some fields
are essentially void of such activities. In fact, many seniors in every area use deep learning
approaches at least some of the time.
For the deep learning scale (Table 2), seniors in the social sciences have the highest
average score even after controlling for student characteristics (effect size with controls = 0.26, p
< 0.001), Carnegie classification, and institutional control (public or private). Not far behind are
seniors from the arts and humanities (effect size with controls = 0.23, p < 0.001) and seniors
from professional fields (effect size with controls = 0.18, p < 0.001). The effect size calculations
suggest that seniors in these disciplinary areas score moderately higher than seniors in biology
(the reference group), a group that ranks in the middle of the nine disciplinary areas.
Senior averages in the physical sciences (effect size with controls = -0.11, p < 0.001),
business (effect size with controls = -0.07, p < 0.001), other fields (effect size with controls = -
Deep Learning 13
0.08, p < 0.001), and engineering (effect size with controls = -0.13, p < 0.001) are significantly
lower on the deep learning scale than seniors in biology. After the addition of controls, the effect
sizes are generally small suggesting that some of the differences between biology and these
disciplinary areas may be due to differences in the characteristics of students who choose to
major in these areas.
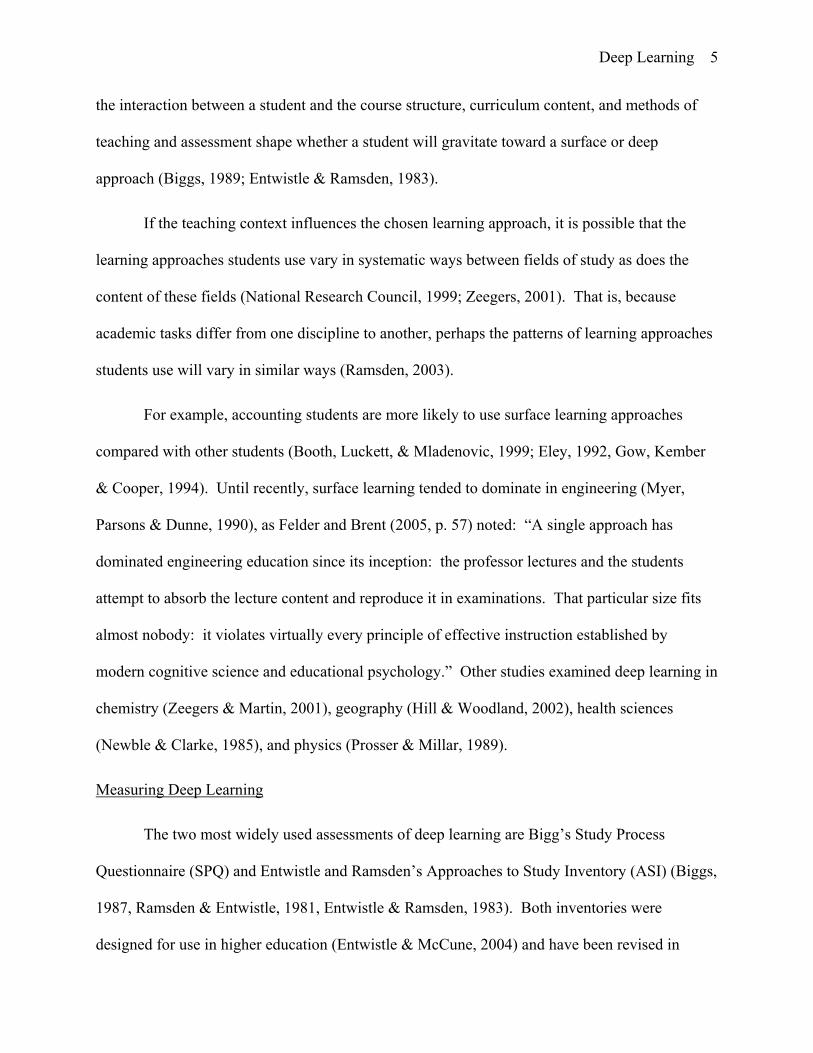
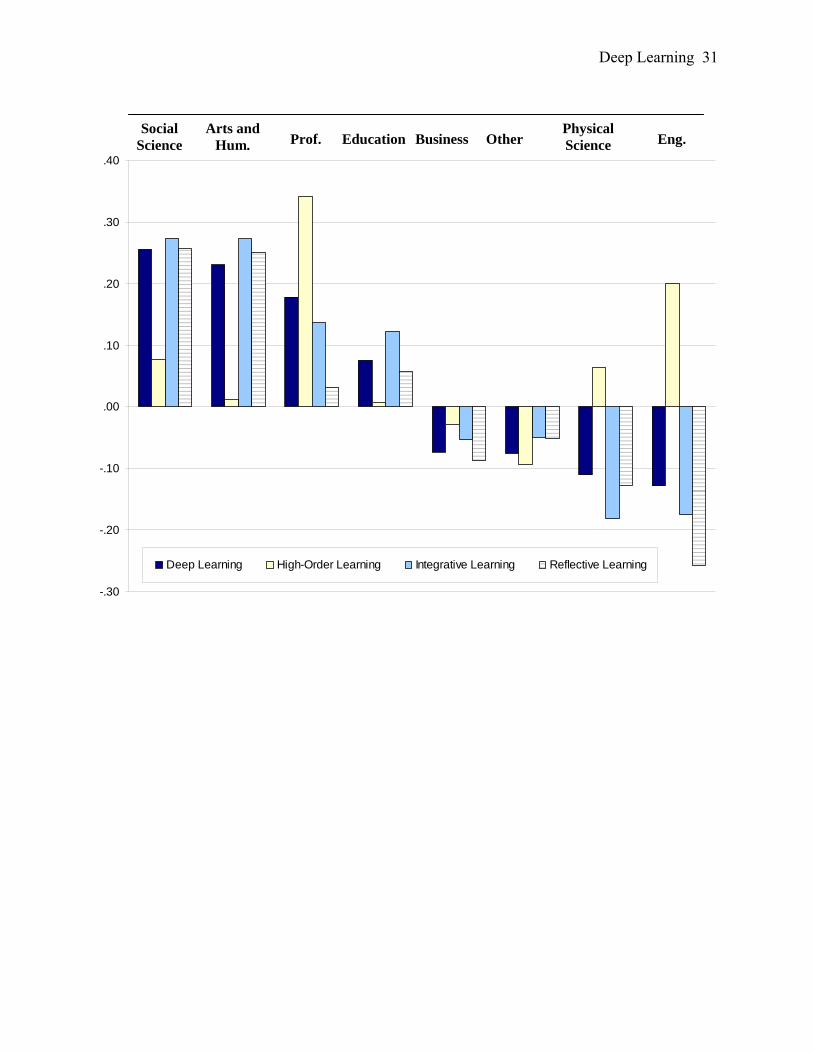
Figure 1 plots the effect sizes (after controls have been introduced) for the deep learning
scale and each of its subscales. Only eight groupings are shown because all of the effect sizes
are relative to biology. The pattern of effects is quite similar for the deep learning scale, the
integrative learning scale, and the reflective learning scale. Seniors in the social sciences, arts
and humanities, professional fields, and education score above biology while seniors in business,
other fields, physical sciences, and engineering score below.
However, the pattern of effects for higher-order learning stands out as different. For this
scale, seniors in professional fields (effect size with controls = 0.34, p < 0.001) and engineering
(effect size with controls = 0.20, p < 0.001), on average, score the highest after controls are
introduced. For engineering this is dramatically different from their low scores on the other
scales. Like seniors in engineering, seniors in the physical sciences have a higher relative score
on higher-order learning than on the other scales. However, the difference in effect for the
physical sciences is less dramatic.
Additionally, the pattern of effects for higher-order learning seems to separate the
disciplinary areas into two groups: a higher scoring group (professional, social science, and
engineering) and a lower scoring group (physical science, arts and humanities, biology,
education, business, and other). For the other scales, the effects seemed to separate the
disciplinary areas into three groups (high, middle, and low). This may, in part, result from the

Deep Learning 14
averages across disciplinary areas being relatively high on this subscale (means range from 3.05
to 3.35) compared to the others (means on the other subscales range from 2.60 to 3.13).
Table 6 contains partial correlations between the deep learning scales and three student
outcome variables (gains in personal and intellectual development, grades, and satisfaction)
calculated within each of the disciplinary areas. We were primarily interested in determining if
the relationships between deep approaches to learning and student outcomes were consistent with
scores on the deep learning scales. If this were the case, one could argue that students are less
likely to use deep approaches to learning in certain areas because of the nature of the field of
study and may not have a dampening influence on desired educational outcomes. We did not,
however, find such a pattern.
Overall, we found that deep approaches to learning are positively related to our educational
outcomes and that the relationship is strongest for gains in personal and intellectual development,
moderate in strength for satisfaction, and relatively week for grades. In addition, there appears to
be no relationship between students’ average score on a deep learning scale within a disciplinary
area and the relative strength of the relationship between deep learning and the outcomes within
that area.
For gains in personal and intellectual development, the partial correlations suggest that
there is a strong connection between using deep approaches to learning more frequently and
reporting higher scores on this outcome (partial correlations range from 0.58 to 0.63 for the deep
learning scale). The relationships between students’ grades and the deep learning scales are
relatively weak (partial correlations range from 0.09 to 0.20 for the deep learning scale). In fact,
for the physical sciences and professional fields, the relationship was indistinguishable from zero
for higher-order learning. Satisfaction appears to be moderately related to deep approaches to

Deep Learning 15
learning (partial correlations range from 0.28 to 0.37 for the deep learning scale). For each of the
outcomes, the strength of the relationships differed little by disciplinary area for all four deep
learning scales.
Limitations
The primary limitations of this study pertain to the sample of students used in the study
and to the disciplinary groupings created for the analyses. Only students who completed the
NSSE 2004 survey online were given the reflective learning items. This led us to limit our
sample to web completers only. However, the odds of being a web completer vary by
disciplinary area. For example, 89% of engineering seniors completed the survey online while
only 63% of seniors majoring in professional fields did so. These differences have the potential
to introduce bias into our estimates of the differences between disciplinary areas on the deep
learning scale and its sub-scales. However, for the higher-order and integrative learning
subscales, we found that only very small differences existed between web and paper completers
and that, in most cases, the differences that exist would not change or would accentuate the
results we report.
The disciplinary categories we use are those used by NSSE in reporting results to
participating institutions. The goal is to represent common groupings found on college campuses
at the school and college-level or, in the case of colleges of liberal arts, major sub-groupings
(e.g., social science). Although these groupings are useful, they are neither theoretically nor
empirically derived. As a result, perhaps some differences or similarities related to discipline
were masked within these categories. For example, music seniors have deep learning scores
closer to seniors in the biological sciences than to seniors in philosophy, another arts and

Deep Learning 16
humanities field. However, our analyses suggest it is much more frequently the case that
averages within disciplinary groupings are similar.
In addition, institutions choose to participate in NSSE and then students are randomly
selected from the student populations at those institutions. Although NSSE institutions mirror all
four-year institutions on most institutional characteristics (National Survey of Student
Engagement, 2004), the fact that college and universities volunteer to participate requires that
some caution be used when generalizing the results to students at other four-year institutions.
Discussion and Implications
Across disciplines, seniors are using deep approaches to learning, at least some of the time,
and use of these approaches is related to self-reports of personal and intellectual gains during
college. This finding confirms something we already know—if we structure students’
educational experiences to induce them to invest more energy in taking responsibility for their
learning and reflecting on what they are learning, students benefit more from the college
experience (Pascarella & Terenzini, 2005).
In addition, seniors who use deep approaches to learning are more satisfied with their
collegiate experience, which is in line with the notion that deep learning is more personally
rewarding than surface learning (Tagg, 2003). Admittedly, satisfaction is affected by many
aspects of college life. Nonetheless, this finding suggests that, at least in part, student
satisfaction is based on intellectual experiences that are rigorous in nature and not routine or
easy. In other words, student satisfaction is not all about their social life and academic work that
is easy to master.
Interestingly, only a weak relationship exists between grades and student uses of deep
approaches to learning. Should this relationship be stronger? If we believe that grades should

Deep Learning 17
reflect the type of learning students are participating in, then yes. What can be done to make
grades better indicators of deep learning? One place to start is to make sure that the activities
and assignments upon which we base students’ grades require students to employ higher-order,
reflective, and integrative thinking skills.
To some degree, the findings from this study corroborate previous research showing that
students majoring in engineering and the physical sciences use deep approaches to learning less
frequently than students from other fields (Myer, Parsons & Dunne, 1990; Felder & Brent, 2005;
Zeegers & Martin, 2001; Prosser & Millar, 1989). However, there are also aspects of deep
learning on which students in these fields perform relatively well, suggesting that any field holds
the promise for deep learning. By looking at different aspects of deep learning, each disciplinary
area can identify places for improvement. So, for engineering and physical science, increased
emphasis on activities that require reflective and integrative learning could yield improvement in
student outcomes while in the arts and humanities a greater emphasis on higher-order learning
could produce educational improvement.
Conclusion
Are all college students learning as deeply as we would hope? Probably, not. However, the
results of this study suggest that many students are engaged in deep approaches to learning and
that such engagement is associated with higher levels of personal and intellectual development as
well as general satisfaction with college. Overall, it appears that most college and university
seniors are being exposed to and benefiting from pedagogies that encourage deep learning.
Are there ways to improve? Absolutely. By examining the patterns of deep learning
behaviors by disciplinary area, we found that no disciplines score at the top in all aspects of deep
learning and there are none always at the bottom. Consequently, there are aspects of deep

Deep Learning 18
learning upon which each disciplinary area can improve. In addition, the relatively high scores
across disciplines suggest that there are probably good examples of how to improve both within
one’s discipline as well as in other disciplinary areas.

Deep Learning 19
References
Beatie, V., Collins, B., & McInnes, B. (1997). deep and surface learning: A simple or simplistic dicotomy? Accounting Education, 6(1), 1-12.
Biggs, J.B. (1978). Individual and group differences in study process. British Journal of
Educational Psychology, 48, 266-279. Biggs, J.B. (1987). Student approaches to learning and studying. Hawthorn, Victoria:
Australian Council for Educational Research. Biggs, J.B. (1988). Approaches to learning and to essay writing. Buckingham: Open
University Press. In R.R. Schmeck (ed.) Learning Strategies and Learning Styles. New York, NY: Plenum.
Biggs, J.B. (1989). Approaches to the enhancement of tertiary teaching. Higher Education
Research and Development, 8, 7-25. Biggs, J.B. (2003). Teaching for quality learning at university. Buckingham: Open University
Press. Biggs, J.B., Kember, D., & Leung, D.Y.P. (2001). The revised two-factor Study Process
Questionnaire: R-SPQ-2F. British Journal of Educational Psychology, 71, 133-149. Biggs, J.B., & Moore, P.J. (1993). The process of learning. New York: Prentice Hall. Booth, P., Luckett, P., & Mladenovic, R. (1999). The quality of learning in accounting
education: The impact of approaches to learning on academic performance. Accounting Education, 8(4), 277-300.
Bowden, J., & Marton, F. (1998). The university of learning. London, England: Kogan Page. Carini, R.M., Hayek, J.H., Kuh, G.D., Kennedy, J.M., & Ouimet, J.A. (2003). College student
responses to web and paper surveys: Does mode matter? Research in Higher Education, 44, 1-19.
Chickering, A. W. & Gamson, Z. F. (1987). Seven principles for food practice in undergraduate
education. AAHE Bulletin 39(7), 3-7. Eley, M.G. (1992). Differential adoption of study approaches within individual students. Higher
Education, 23, 231-254. Entwistle, N.J (1981). Styles of learning and teaching: An integrated outline of educational
psychology for students, teachers and lecturers. Chichester: Wiley.

Deep Learning 20
Entwistle, N.J. & McCune, V. (2004). The conceptual bases of study strategy inventories. Educational Psychology Review, 16(4), 325-345.
Entwistle, N.J, & Ramsden, P. (1983). Understanding student learning. London: Croom Helm. Entwistle, N.J., & Tait, H. (1994). The revised Approaches to Study Inventory. Edinburgh:
Centre for Research into Learning and Instruction, University of Edinburgh.. Felder, R., & Brent, R. (2005). Understanding Student Differences. Journal of Engineering
Education, 94(1), 57-72. Gibbs, G., Habeshaw, S., & Habeshaw, T. (1989). 53 interesting ways to appraise your teaching.
Bristol: Technical and Educational Services. Gow, L., Kember, D., & Cooper, B. (1994). The taching context and approaches to study of
accountancy students. Issues in Accounting Education, 9(1), 118-130. Hill, J., & Woodland, W. (2002). An evaluation of foreign fieldwork in promoting deep
learning: A preliminary invstigation. Assessment and Evaluation in Higher Education, 27(6), 539-555.
Kuh, G. D. (2001). Assessing What Really Matters to Student Learning: Inside the National
Survey of Student Engagement. Change 33(3), 10-17, 66. Kuh, G. D. (2003). What we’re learning about student engagement from NSSE. Change 35(2),
24-32. Lave, J., & Wegner, E. (1991). Situated learning: Legitimate peripheral participation. New
York, NY: Cambridge University Press. Marton, F., & Säljö, R. (1976). On qualitative differences in learning I: Outcome and process.
British Journal of Educational Psychology, 46, 4-11. Myer, J.H.F., Parsons, P., & Dunne, T.T. (1990). Individual study orchestrations and their
association with learning outcomes. Higher Education, 20, 67-89. National Research Council (1999). How people learn: Brain, mind, experience, and school.
Washington, DC: National Academy Press. National Survey of Student Engagement (2000). The NSSE 2000 report: National benchmarks
of effective educational practice. Bloomington, IN: Indiana University Center for Postsecondary Research.
National Survey of Student Engagement (2001). Improving the college experience: National
benchmarks of effective educational practice. Bloomington, IN: Indiana University Center for Postsecondary Research.

Deep Learning 21
National Survey of Student Engagement (2002). From promise to progress: How colleges and
universities are using student engagement results to improve collegiate quality. Bloomington, IN: Indiana University Center for Postsecondary Research.
National Survey of Student Engagement (2003). Converting data into action: Expanding the
boundaries of institutional improvement. Bloomington, IN: Indiana University Center for Postsecondary Research.
National Survey of Student Engagement (2004). Student Engagement: Pathways to collegiate
success. Bloomington, IN: Indiana University Center for Postsecondary Research. Newble, D. & Clarke, R.M. (1985). The approaches to learning of students in a traditional and
in innovative problem-based medical school. Medical Education, 20, 267-273. Olsen, D., Kuh, G. D., Schilling, K. M., Schilling, K., Connolly, M., Simmons, A., & Vesper, N.
(1998, November). Great expectations: What first-year students say they will do and what they actually do. Paper presented at the Annual Meeting of the Association for the Study of Higher Education, Miami, FL.
Pascarella, E. T. & Terenzini, P. T. (2005). How college affects students: A third decade of
research. San Francisco: Jossey-Bass. Prosser, M., & Millar, R. (1989). The “how” and “why” of learning physics. European Journal
of Psychology of Education, 4, 513-528. Ramsden, P. (2003). Learning to teach in higher education. London: RoutledgeFalmer. Ramsden, P., & Entwistle, N.J. (1981). Effects of academic departments on students’
approaches to studying. British Journal of Educational Psychology, 51, 368-383. Tagg, J. (2003). The learning paradigm college. Boston, MA: Anker. Van Rossum, E.J., & Schenk, S.M. (1984). The relationship between learning conception, study
strategy and learning outcome. British Journal of Educational Psychology, 54, 73-83. Whelan, G. (1988). Improving medical students’ clinical problem-solving. In P. Ramsden (ed.)
Improving learning: New perspectives. London, England: Korgan Page. Zeegers, P. (2001). Approaches to learning in science: A longitudinal study. British Journal of
Educational Psychology, 71, 115-132. Zeegers, P., & Martin, L. (2001). A learning-to-learn program in a first-year chemistry class. Higher Education Research and Development, 20, 35-52.
Deep Learning 22
Appendix A Control Variables
Name Description Majora Arts and Humanities, Biology, Business, Education,
Engineering, Physical Science, Professional, Social Science, Other
Gender 0 = Male; 1 = Female Age 0 = 24 or over, 1 = 23 or younger Ethnicityb African American, American Indian, Asian American, White,
Hispanic, Other, Multiple Ethnic Identifications Parent’s Education Level 0 = Either father or mother completed at least an associate’s
degree, 1 = Neither father nor mother complete an associate’s degree or higher
International Status 0 = US National, 1 = International student or foreign national Transfer Status 0 = Did not transfer; 1 = Tranfered Enrollment Status 0 = Part-time; 1 = Full-time Live on campus 0 = Live off campus; 1 = Live on or near campus Fraternity or Sorority Membership
0 = Non-member; 1 = Member of a social fraternity or sorority
Student Athlete 0 = Non-athlete; 1 = Student athlete on a team sponsored by the institution’s athletic department
Carnegie Classificationc Doctoral - Extensive, Doctoral - Intensive, Master’s Colleges and Universities I & II, Baccalaureate - Liberal Arts, Baccalaureate - General, Other classification
Institutional control 0 =Public; 1 = Private a Coded dichotomously (0 = not in group, 1 = in group), Biology was the reference group
b Coded dichotomously (0 = not in group, 1 = in group), White was the reference group
c Coded dichotomously (0 = not in group, 1 = in group), Baccalaureate - Liberal Arts was the reference group

Deep Learning 23
Appendix B Outcomes Scales and Component Items
Gains in Personal and Intellectual Development (16 items; α = .91)
Developing a personal code of values and ethics
Contributing to the welfare of your community
Developing a deepened sense of spirituality
Understanding yourself
Understanding people of other racial and ethnic backgrounds
Solving complex real-world problems
Voting in local, state, or national elections
Learning effectively on your own
Working effectively with others
Writing clearly and effectively
Speaking clearly and effectively
Thinking critically and analytically
Acquiring a broad general education
Acquiring job or work-related knowledge and skills
Analyzing quantitative problems
Using computing and information technology
Grades What have most of your grades been up to now at this institution?a
Satisfaction (2 items; α = .79)
How would you evaluate your entire educational experience at this institution?b
If you could start over again, would you go to the same institution you are now attending?c
Note: Except where noted, variables were measured on a 4-point scale (1=Very Little, 2=Some, 3=Quite a Bit, 4=Very Much) a Responses for this item were 1=C- or lower, 2=C, 3=C+, 4=B-, 5=B, 6=B+, 7=A-, 8=A b Responses for this item were 1=Poor, 2=Fair, 3=Good, 4=Excellent
c Responses for this item were 1=Definitely No, 2=Probably No, 3=Probably Yes, 4=Definitely Yes

Deep Learning 24
Table 1. Deep Learning Scale, Subscales, and Component Items Deep Learning (15-item scale; α = .89)
Scale consists of all 15 items listed below
Higher-Order Learninga (α = .82) Analyzed the basic elements of an idea, experience, or theory, such as examining a
particular case or situation in depth and considering its components? Synthesized and organized ideas, information, or experiences into new, more complex
interpretations and relationships? Made judgments about the value of information, arguments, or methods, such as
examining how others gathered and interpreted data and assessing the soundness of their conclusions?
Applied theories or concepts to practical problems or in new situations?
Integrative Learning (α = .71)
Worked on a paper or project that required integrating ideas or information from various sources?
Included diverse perspectives (different races, religions, genders, political beliefs, etc.) in class discussions or writing assignments?
Put together ideas or concepts from different courses when completing assignments or during class discussions?
Discussed ideas from your readings or classes with faculty members outside of class?
Discussed ideas from your readings or classes with others outside of class (students, family members, co-workers, etc.)?
Reflective Learningb (α = .89)
Learned something from discussing questions that have no clear answers?
Examined the strengths and weaknesses of your own views on a topic or issue?
Tried to better understand someone else's views by imagining how an issue looks from his or her perspective?
Learned something that changed the way you understand an issue or concept?
Applied what you learned in a course to your personal life or work?
Enjoyed completing a task that required a lot of thinking and mental effort?
Note: Except where noted, variables were measured on a 4-point scale (1=Never, 2=Sometimes, 3=Often, 4=Very Often) a Responses for this item were 1=Very little, 2=Some, 3=Quite a bit, 4=Very much b These were experimental items on the 2004 survey.

Deep Learning 25
Table 2. Deep Learning Differences by Discipline
N Mean SD
Mean Difference
From BiologyEffect Size w/o
Controls Effect Size with
Controls
Social Science 7837 3.09 0.51 0.14 0.27 *** 0.26 ***
Arts and Humanities 8054 3.07 0.54 0.12 0.23 *** 0.23 ***
Professional 3041 3.01 0.49 0.06 0.11 *** 0.18 ***
Education 5223 2.96 0.52 0.01 0.02 0.08 **
Biology 3480 2.95 0.51 reference group
Physical Science 1921 2.88 0.52 -0.07 -0.13 *** -0.11 **
Business 9406 2.88 0.51 -0.07 -0.14 *** -0.07 ***
Other 9029 2.86 0.53 -0.09 -0.17 *** -0.08 ***
Engineering 3242 2.79 0.49 -0.16 -0.30 *** -0.13 ***
Total 51233 2.95 0.53
*p<.05, **p<.01, ***p<.001

Deep Learning 26
Table 3. Higher-Order Learning Differences by Discipline
N Mean SD
Mean Difference
From BiologyEffect Size w/o
Controls Effect Size with
Controls
Professional 3041 3.35 0.62 0.19 0.29 *** 0.34 ***
Social Science 7837 3.22 0.64 0.06 0.09 *** 0.08 ***
Engineering 3242 3.20 0.62 0.04 0.06 ** 0.20 ***
Physical Science 1921 3.19 0.63 0.03 0.04 0.06 *
Arts and Humanities 8054 3.16 0.67 0.00 0.00 0.01
Biology 3480 3.16 0.63 reference group
Education 5223 3.14 0.65 -0.02 -0.04 0.01
Business 9406 3.11 0.64 -0.05 -0.07 *** -0.03
Other 9029 3.05 0.66 -0.11 -0.17 *** -0.09 ***
Total 51233 3.15 0.65
*p<.05, **p<.01, ***p<.001

Deep Learning 27
Table 4. Integrative Learning Differences by Discipline
N Mean SD
Mean Difference
From BiologyEffect Size w/o
Controls Effect Size with
Controls
Social Science 7837 2.95 0.56 0.16 0.29 *** 0.27 ***
Arts and Humanities 8054 2.94 0.58 0.16 0.27 *** 0.27 ***
Professional 3041 2.83 0.55 0.05 0.09 *** 0.14 ***
Education 5223 2.83 0.56 0.04 0.08 *** 0.12 ***
Biology 3480 2.78 0.56 reference group
Business 9406 2.73 0.55 -0.06 -0.10 *** -0.05 **
Other 9029 2.71 0.57 -0.07 -0.12 *** -0.05 **
Physical Science 1921 2.67 0.59 -0.11 -0.20 *** -0.18 ***
Engineering 3242 2.60 0.55 -0.18 -0.32 *** -0.17 ***
Total 51233 2.80 0.57
*p<.05, **p<.01, ***p<.001

Deep Learning 28
Table 5. Reflective Learning Differences by Discipline
N Mean SD
Mean Difference
From BiologyEffect Size w/o
Controls Effect Size with
Controls
Social Science 7837 3.13 0.64 0.18 0.26 *** 0.26 ***
Arts and Humanities 8054 3.12 0.67 0.16 0.25 *** 0.25 ***
Biology 3480 2.95 0.65 reference group
Education 5223 2.95 0.66 0.00 0.00 0.06 *
Professional 3041 2.93 0.64 -0.02 -0.04 0.03
Other 9029 2.86 0.67 -0.09 -0.14 *** -0.05 **
Business 9406 2.85 0.64 -0.10 -0.15 *** -0.09 ***
Physical Science 1921 2.85 0.66 -0.10 -0.15 *** -0.13 ***
Engineering 3242 2.68 0.64 -0.27 -0.40 *** -0.26 ***
Total 51233 2.95 0.67
*p<.05, **p<.01, ***p<.001

Deep Learning 29
Table 6. Partial Correlations between Deep Learning Scales and Educational Outcomes
Scales Deep
Learning Higher-Order
Learning Integrative Learning
Reflective Learning
Gains in Personal and Intellectual Development Arts and Humanities 0.59 0.47 0.46 0.55 Biology 0.60 0.45 0.45 0.55 Business 0.63 0.48 0.49 0.57 Education 0.59 0.45 0.45 0.55 Engineering 0.59 0.45 0.44 0.52 Physical Science 0.61 0.45 0.44 0.58 Professional 0.58 0.43 0.45 0.52 Social Science 0.60 0.47 0.46 0.56 Other 0.62 0.49 0.48 0.55
Grades Arts and Humanities 0.18 0.11 0.18 0.17 Biology 0.18 0.07 0.17 0.17 Business 0.14 0.08 0.13 0.14 Education 0.13 0.08 0.12 0.12 Engineering 0.09 0.05 0.08 0.08 Physical Science 0.12 0.04* 0.11 0.12 Professional 0.11 0.02* 0.12 0.11 Social Science 0.20 0.11 0.19 0.18 Other 0.13 0.09 0.12 0.12
Satisfaction Arts and Humanities 0.35 0.27 0.28 0.33 Biology 0.34 0.23 0.26 0.32 Business 0.36 0.27 0.26 0.34 Education 0.34 0.25 0.26 0.32 Engineering 0.34 0.25 0.25 0.31 Physical Science 0.34 0.24 0.23 0.33 Professional 0.28 0.17 0.23 0.26 Social Science 0.37 0.28 0.28 0.34 Other 0.37 0.29 0.27 0.34
Note: Partial correlations calculated controlling for gender, race, age, parents' education, transfer status, living on campus, international student status, social fraternity/sorority membership, participation in athletics, full-time/part-time status, Carnegie classification, and institutional control (public or private). *Not significant, all other correlations significant at p<.01

Deep Learning 30
Figure Caption
Figure 1. Disciplinary Effect Sizes With Controls
Deep Learning 31
Social Science
Arts and Hum. Prof. Education Business Other
Physical Science Eng.
-.30
-.20
-.10
.00
.10
.20
.30
.40
Deep Learning High-Order Learning Integrative Learning Reflective Learning