Embed Size (px)
Citation preview
UNCLASSIFIED
Defense Technical Information CenterCompilation Part Notice
ADP012355TITLE: Transport Properties and Thermodynamic Processes for LiquidFuels and Gas Mixtures of N2, 02, H2 and H20
DISTRIBUTION: Approved for public release, distribution unlimited
This paper is part of the following report:
TITLE: 2nd International Workshop on Rocket Combustion Modeling:Atomization, Combustion and Heat Transfer held in Lampoldshausen,Germany on 25-27 Mar 2001
To order the complete compilation report, use: ADA402618
The component part is provided here to allow users access to individually authored sectionsf proceedings, annals, symposia, etc. However, the component should be considered within
[he context of the overall compilation report and not as a stand-alone technical report.
The following component part numbers comprise the compilation report:ADP012355 thru ADP012373
UNCLASSIFIED
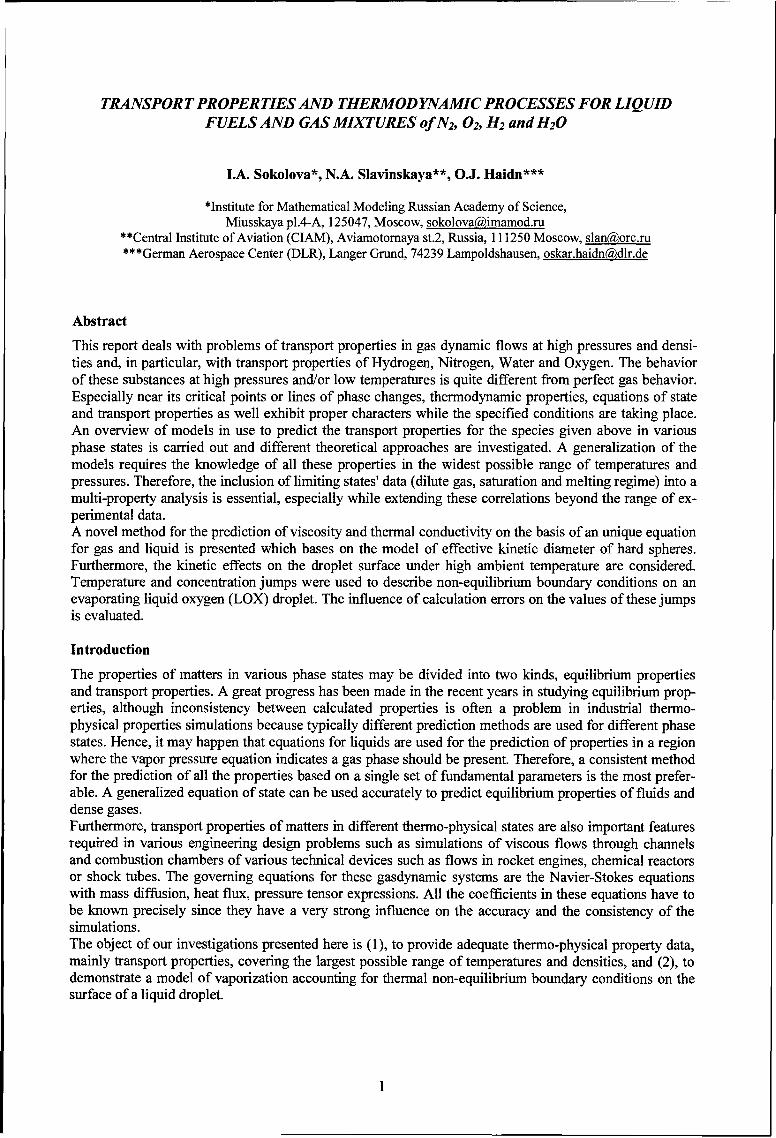
TRANSPORT PROPERTIES AND THERMODYNAMIC PROCESSES FOR LIQUIDFUELS AND GAS MIXTURES of N2, 02, H2 and H 20
I.A. Sokolova*, N.A. Slavinskaya**, O.J. Haidn***
*Institute for Mathematical Modeling Russian Academy of Science,Miusskaya pl.4-A, 125047, Moscow, sokolova(ibimamod.ru
"**Central Institute of Aviation (CLAM), Aviamotornaya st.2, Russia, 111250 Moscow, slan(aorc.ru***German Aerospace Center (DLR), Langer Grund, 74239 Lampoldshausen, oskar.haidn(idlr.de
Abstract
This report deals with problems of transport properties in gas dynamic flows at high pressures and densi-ties and, in particular, with transport properties of Hydrogen, Nitrogen, Water and Oxygen. The behaviorof these substances at high pressures and/or low temperatures is quite different from perfect gas behavior.Especially near its critical points or lines of phase changes, thermodynamic properties, equations of stateand transport properties as well exhibit proper characters while the specified conditions are taking place.An overview of models in use to predict the transport properties for the species given above in variousphase states is carried out and different theoretical approaches are investigated. A generalization of themodels requires the knowledge of all these properties in the widest possible range of temperatures andpressures. Therefore, the inclusion of limiting states' data (dilute gas, saturation and melting regime) into amulti-property analysis is essential, especially while extending these correlations beyond the range of ex-perimental data.A novel method for the prediction of viscosity and thermal conductivity on the basis of an unique equationfor gas and liquid is presented which bases on the model of effective kinetic diameter of hard spheres.Furthermore, the kinetic effects on the droplet surface under high ambient temperature are considered.Temperature and concentration jumps were used to describe non-equilibrium boundary conditions on anevaporating liquid oxygen (LOX) droplet. The influence of calculation errors on the values of these jumpsis evaluated.
Introduction
The properties of matters in various phase states may be divided into two kinds, equilibrium propertiesand transport properties. A great progress has been made in the recent years in studying equilibrium prop-erties, although inconsistency between calculated properties is often a problem in industrial thermo-physical properties simulations because typically different prediction methods are used for different phasestates. Hence, it may happen that equations for liquids are used for the prediction of properties in a regionwhere the vapor pressure equation indicates a gas phase should be present. Therefore, a consistent methodfor the prediction of all the properties based on a single set of fundamental parameters is the most prefer-able. A generalized equation of state can be used accurately to predict equilibrium properties of fluids anddense gases.Furthermore, transport properties of matters in different thermo-physical states are also important featuresrequired in various engineering design problems such as simulations of viscous flows through channelsand combustion chambers of various technical devices such as flows in rocket engines, chemical reactorsor shock tubes. The governing equations for these gasdynamic systems are the Navier-Stokes equationswith mass diffusion, heat flux, pressure tensor expressions. All the coefficients in these equations have tobe known precisely since they have a very strong influence on the accuracy and the consistency of thesimulations.The object of our investigations presented here is (1), to provide adequate thermo-physical property data,mainly transport properties, covering the largest possible range of temperatures and densities, and (2), todemonstrate a model of vaporization accounting for thermal non-equilibrium boundary conditions on thesurface of a liquid droplet.
Thermodynamic properties
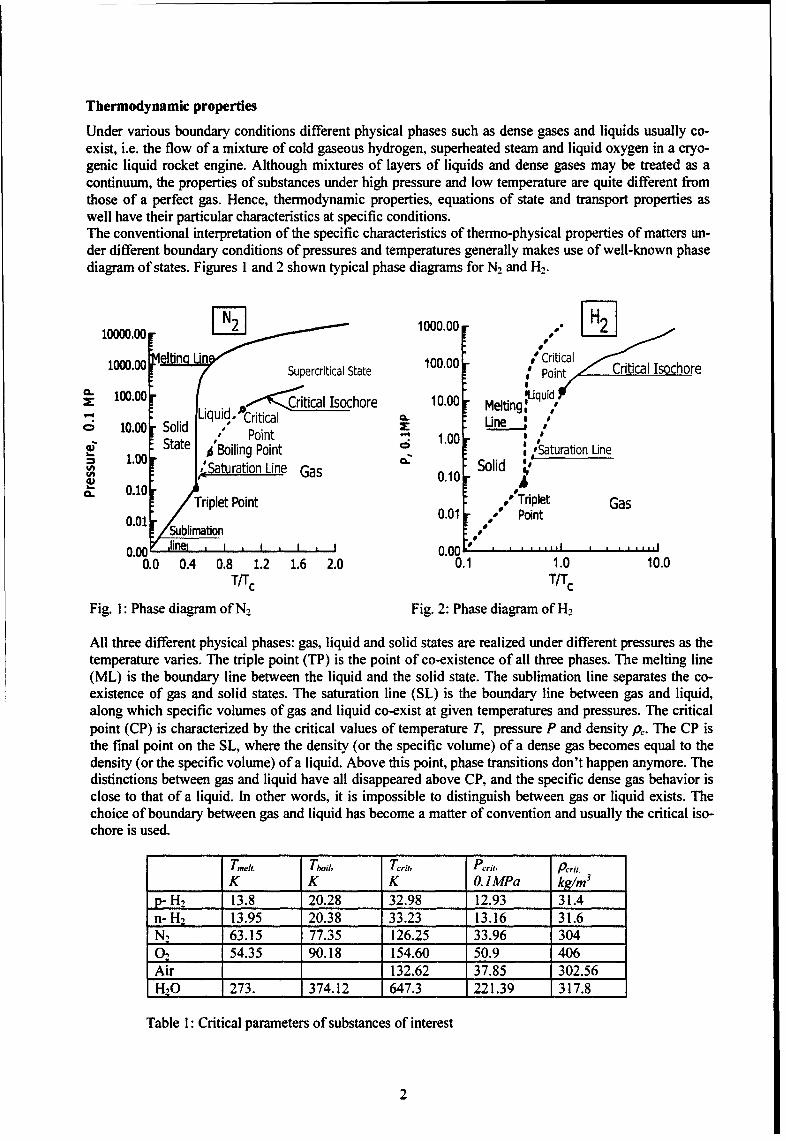
Under various boundary conditions different physical phases such as dense gases and liquids usually co-exist, i.e. the flow of a mixture of cold gaseous hydrogen, superheated steam and liquid oxygen in a cryo-genic liquid rocket engine. Although mixtures of layers of liquids and dense gases may be treated as acontinuum, the properties of substances under high pressure and low temperature are quite different fromthose of a perfect gas. Hence, thermodynamic properties, equations of state and transport properties aswell have their particular characteristics at specific conditions.The conventional interpretation of the specific characteristics of thermo-physical properties of matters un-der different boundary conditions of pressures and temperatures generally makes use of well-known phasediagram of states. Figures 1 and 2 shown typical phase diagrams for N2 and H2.
10000.00 F 1000.00 F 2
1000.00 4e t n :I L n100 .0 0 C rt ca I rt ca so h r
Supercritical State 100.00aloCinticalQ.100.00 kqi
uL P-ointical Isohore 10C00 Me~-' • i c ~ ~ s ~ o r eM elting , ,,,- ^ Liquid, CEritical -- .,
10.00 Solid 10. 0 Line ,1 100
State , Boiling Point 'Saturation Line1.00 iSauainLe
'Saturation Line Gas 0.10 SolidCL 0.10 / Triplet Point ," rpe a
Sui~blirmmatiorn 0.01 Pointa- 41
0.00 ,ine i . I , I 1 0.00 " Point
0.0 0.4 0.8 1.2 1.6 2.0 0.1 1.0 10.0T/Tc T/Tc
Fig. 1: Phase diagram of N, Fig. 2: Phase diagram of H2
All three different physical phases: gas, liquid and solid states are realized under different pressures as thetemperature varies. The triple point (TP) is the point of co-existence of all three phases. The melting line(ML) is the boundary line between the liquid and the solid state. The sublimation line separates the co-existence of gas and solid states. The saturation line (SL) is the boundary line between gas and liquid,along which specific volumes of gas and liquid co-exist at given temperatures and pressures. The criticalpoint (CP) is characterized by the critical values of temperature T, pressure P and density p,. The CP isthe final point on the SL, where the density (or the specific volume) of a dense gas becomes equal to thedensity (or the specific volume) of a liquid. Above this point, phase transitions don't happen anymore. Thedistinctions between gas and liquid have all disappeared above CP, and the specific dense gas behavior isclose to that of a liquid. In other words, it is impossible to distinguish between gas or liquid exists. Thechoice of boundary between gas and liquid has become a matter of convention and usually the critical iso-chore is used.
T4e1. Tbhil, Tcrit, Pcr,, Pcrit,.
K K K O. 1MPa kg/rn3
p- H2 13.8 20.28 32.98 12.93 31.4n- H, 13.95 20.38 33.23 13.16 31.6N, 63.15 77.35 126.25 33.96 304O1 54.35 90.18 154.60 50.9 406Air 132.62 37.85 302.56H2O 273. 374.12 647.3 221.39 317.8
Table 1: Critical parameters of substances of interest
2
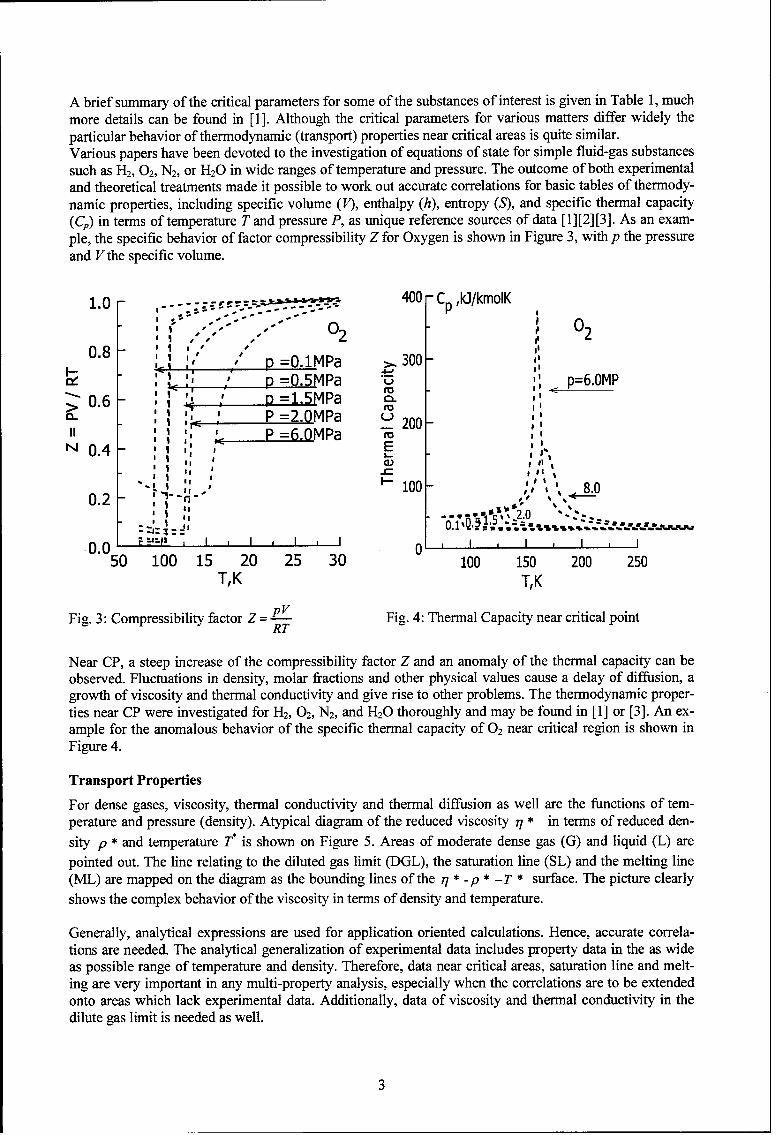
A brief summary of the critical parameters for some of the substances of interest is given in Table 1, muchmore details can be found in [1]. Although the critical parameters for various matters differ widely theparticular behavior of thermodynamic (transport) properties near critical areas is quite similar.Various papers have been devoted to the investigation of equations of state for simple fluid-gas substancessuch as H2, 02, N2, or H 20 in wide ranges of temperature and pressure. The outcome of both experimentaland theoretical treatments made it possible to work out accurate correlations for basic tables of thermody-namic properties, including specific volume (F), enthalpy (h), entropy (S), and specific thermal capacity(Cp) in terms of temperature T and pressure P, as unique reference sources of data [1] [2] [3]. As an exam-ple, the specific behavior of factor compressibility Z for Oxygen is shown in Figure 3, with p the pressureand V the specific volume.
1.0 , 400 ,CPkJ/kmolK
, ,- -,,- 02
0.8 : -, , ,,g =0.1MPa > 300 ,
p =0.5MPa ., p=6.OMP0.6 ', ' p =I.5MPa C-
,P =2.0MPa _U20
a~ :~ ~ 200-ai ', P =6.0MPa
N0.4 E
0- 8.0
0.0 I I 1 1
50 100 15 20 25 30 0 0 150 200 250T,K T, K
Fig. 3: Compressibility factor Z L- Fig. 4: Thermal Capacity near critical pointRT
Near CP, a steep increase of the compressibility factor Z and an anomaly of the thermal capacity can beobserved. Fluctuations in density, molar fractions and other physical values cause a delay of diffusion, agrowth of viscosity and thermal conductivity and give rise to other problems. The thermodynamic proper-ties near CP were investigated for H2, 02, N2, and H2 0 thoroughly and may be found in [1] or [3]. An ex-ample for the anomalous behavior of the specific thermal capacity Of 02 near critical region is shown inFigure 4.
Transport Properties
For dense gases, viscosity, thermal conductivity and thermal diffusion as well are the functions of tem-perature and pressure (density). Atypical diagram of the reduced viscosity q~ * in terms of reduced den-
sity p * and temperature Tf is shown on Figure 5. Areas of moderate dense gas (G) and liquid (L) are
pointed out. The line relating to the diluted gas limit (DGL), the saturation line (SL) and the melting line(ML) are mapped on the diagram as the bounding lines of the q * - p * -T * surface. The picture clearly
shows the complex behavior of the viscosity in terms of density and temperature.
Generally, analytical expressions are used for application oriented calculations. Hence, accurate correla-tions are needed. The analytical generalization of experimental data includes property data in the as wideas possible range of temperature and density. Therefore, data near critical areas, saturation line and melt-ing are very important in any multi-property analysis, especially when the correlations are to be extendedonto areas which lack experimental data. Additionally, data of viscosity and thermal conductivity in thedilute gas limit is needed as well.
3
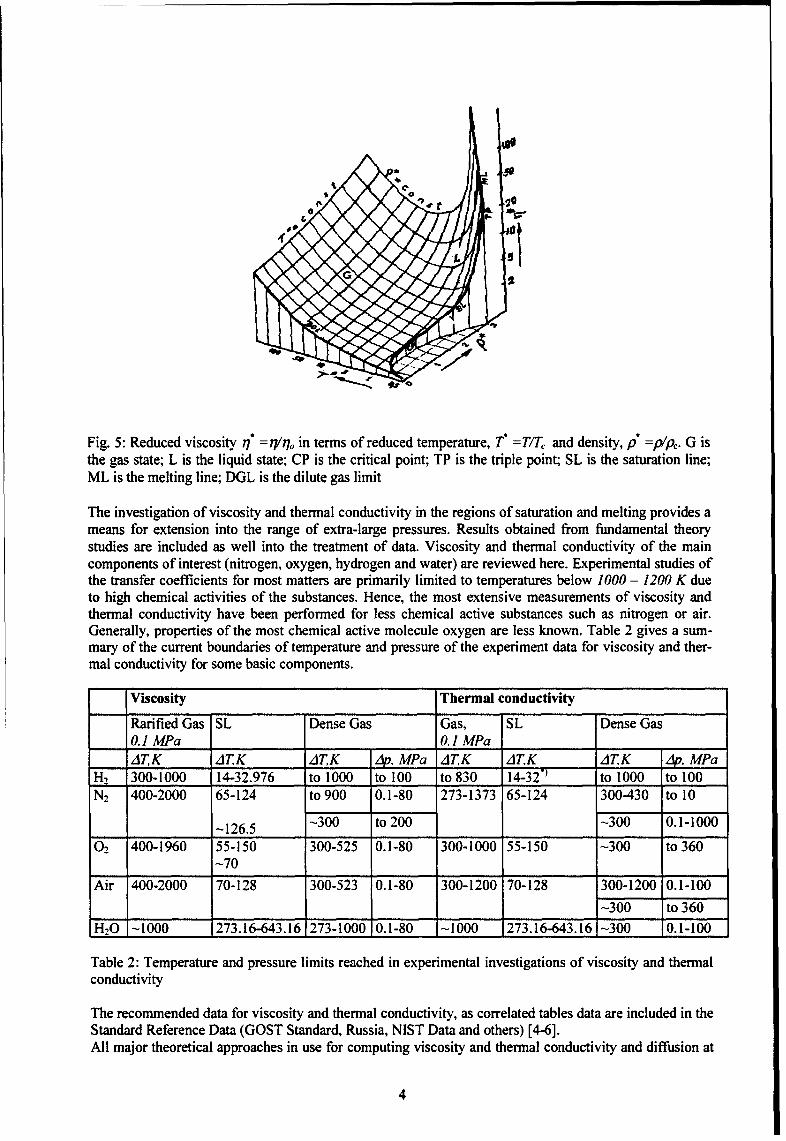
Fig. 5: Reduced viscosity 17* =q//ro in terms of reduced temperature, T' =TIT, and density, p" =P'Pc. G isthe gas state; L is the liquid state; CP is the critical point; TP is the triple point; SL is the saturation line;ML is the melting line; DGL is the dilute gas limit
The investigation of viscosity and thermal conductivity in the regions of saturation and melting provides ameans for extension into the range of extra-large pressures. Results obtained from fundamental theorystudies are included as well into the treatment of data. Viscosity and thermal conductivity of the maincomponents of interest (nitrogen, oxygen, hydrogen and water) are reviewed here. Experimental studies ofthe transfer coefficients for most matters are primarily limited to temperatures below 1000 - 1200 K dueto high chemical activities of the substances. Hence, the most extensive measurements of viscosity andthermal conductivity have been performed for less chemical active substances such as nitrogen or air.Generally, properties of the most chemical active molecule oxygen are less known. Table 2 gives a sum-mary of the current boundaries of temperature and pressure of the experiment data for viscosity and ther-mal conductivity for some basic components.
Viscosity Thermal conductivity
Rarified Gas SL Dense Gas Gas, SL Dense Gas0.1 MPa 0.1 MPaATK AT.K AT,K 4p, MPa ATK AT.K ATK AP. MPa
H2 300-1000 14-32.976 to 1000 to 100 to 830 14-32' to 1000 to 100N2 400-2000 65-124 to 900 0.1-80 273-1373 65-124 300-430 to 10
-126.5 -300 to 200 -300 0.1-1000
02 400-1960 55-150 300-525 0.1-80 300-1000 55-150 -300 to 360-70
Air 400-2000 70-128 300-523 0.1-80 300-1200 70-128 300-1200 0.1-100
-300 to 360H20 -1000 273.16-643.16 273-1000 0.1-80 -1000 273.16-643.16 -300 0.1-100
Table 2: Temperature and pressure limits reached in experimental investigations of viscosity and thermalconductivity
The recommended data for viscosity and thermal conductivity, as correlated tables data are included in theStandard Reference Data (GOST Standard, Russia, NIST Data and others) [4-6].All major theoretical approaches in use for computing viscosity and thermal conductivity and diffusion at
4
high pressures are quasi-empirical. Due to the specific behavior of the transport properties at high densi-ties it is recommended to perform predictions based on theoretical approaches only when experimentaldata is missing. Viscosity and thermal conductivity coefficients in the limiting case of zero density may becalculated applying Boltzmann equation and Chapman-Enskog method [7] using potential functions toaccount for particle interaction. Such data are suitable for comparison in wide ranges of temperature atlow densities. The complementary data in the limit of the saturation line and the melting area may be im-portant for correlation at high density.
Quasi-theoretical approaches
One of the wide-spread methods for the prediction of transport properties at high densities is a particularmethod of excess functions. Usually, the excess of viscosity and thermal conductivity is represented by apower low [8,9]. The main suggestion is that the expression for the viscosity or thermal conductivity coef-ficient consists of the two terms, with one of them a function of temperature and the other a function ofdensity:
77 (T, p9) = qio (T) + A 17 (p)(1
A (T, p) = Ao (T) + AA (p) (2)
The usual practice is to express the excessive values of Ai/ (p) and A/1 (p) in terms of a serial expan-sion of density:
Ai(p) = alp + a2 p2 + a3 p3 + a4 p4 + a5 P,5 (3)
A2A(p) = blp+ b2 p 2 + b3 p 3 + b4 p 4 + b5p 5 (4)
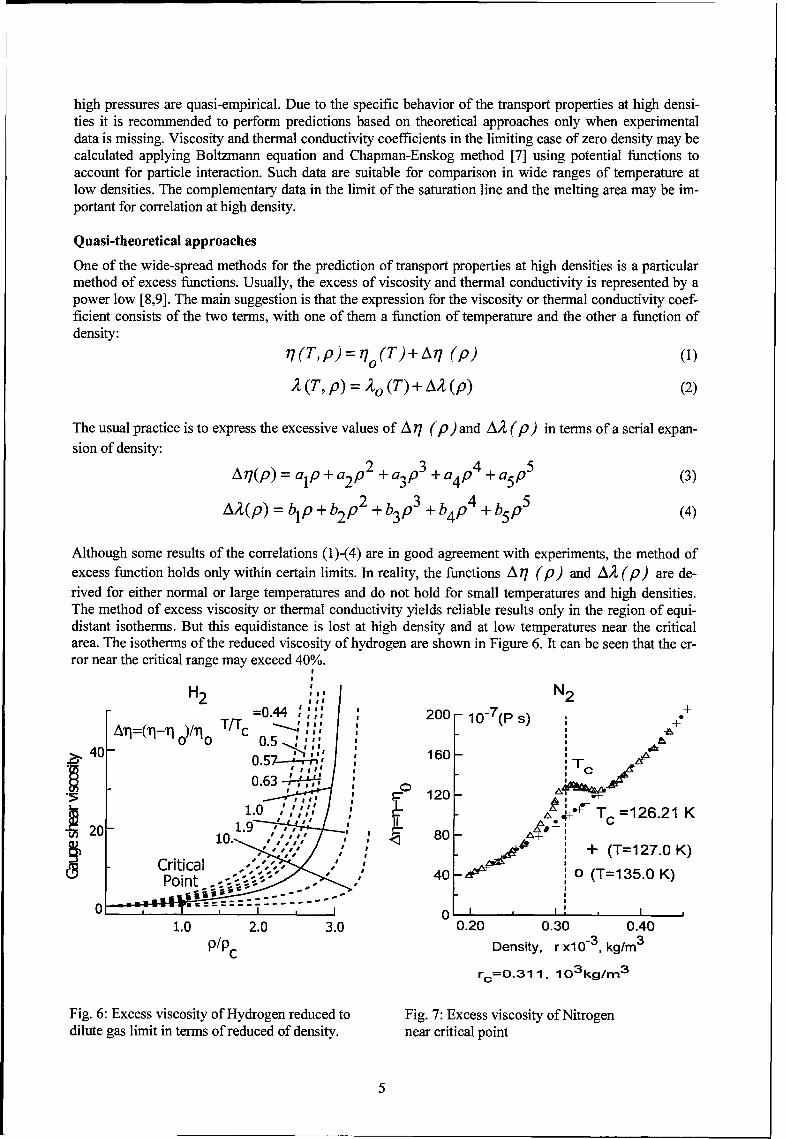
Although some results of the correlations (1)-(4) are in good agreement with experiments, the method ofexcess function holds only within certain limits. In reality, the functions AT7 (p) and AA (p) are de-rived for either normal or large temperatures and do not hold for small temperatures and high densities.The method of excess viscosity or thermal conductivity yields reliable results only in the region of equi-distant isotherms. But this equidistance is lost at high density and at low temperatures near the criticalarea. The isotherms of the reduced viscosity of hydrogen are shown in Figure 6. It can be seen that the er-ror near the critical range may exceed 40%.
H-• ,, IN 2H2 N2
=0.44 : :,, 200 -10- 7 (P s)T/Tc (--- , +_
A'9=T'-"d~o 05 oil'40- 0 - 160" 1
4
0.63 0 1
1. 0 :: :TC =126.21 K
Crtca 0. "" / 80- +201 .1.9 ,,0+ (T=127.0 K)Critcal ...Point X. - -, 40 0 (T=135.0 K)
0 o1.0 2.0 3.0 0.20 0.30 0.40
P/PC Density, r x10-3 , kg/m3
r,=0.311, 10 3 kg/m 3
Fig. 6: Excess viscosity of Hydrogen reduced to Fig. 7: Excess viscosity of Nitrogendilute gas limit in terms of reduced of density. near critical point
5
The behavior of the excess viscosity of nitrogen near the critical area is shown in Figure 7. The enhance-ment of the viscosity along the critical isotherm above the regular part is about 37%. Despite these short-comings, it is obvious that the method of excess functions is quite useful in some cases.
Generalization on the base of Enskog equation
There are a variety of models proposed in the form of reduced density and reduced temperature. The mostreasonable equations for the prediction of properties in wide areas of temperatures and pressures usuallybase on modifications of Enskog kinetic theory for hard spheres. Among them a unique equation for vis-cosity has been proposed [10,11]. This single equation describes the viscosity of both diluted gases andliquids. The fitting parameters of the equation have been derived using the most recent data of viscosity ofdiluted gases, of the two phases on saturation line, near the melting line and for dense states. Details ofstudy are omitted here.The quasi-theoretical equation of viscosity includes two terms, a kinetic part and a collision part, as
Y ='2 kin + Jcol' (5)
with .km the kinetic part and #,,o the collision part of the viscosity taking into account the different mecha-nisms of impulse transfer. These parts are functions of reduced temperature and density ( p / Ps ) with ps
the density of the dense gas on the line of melting.
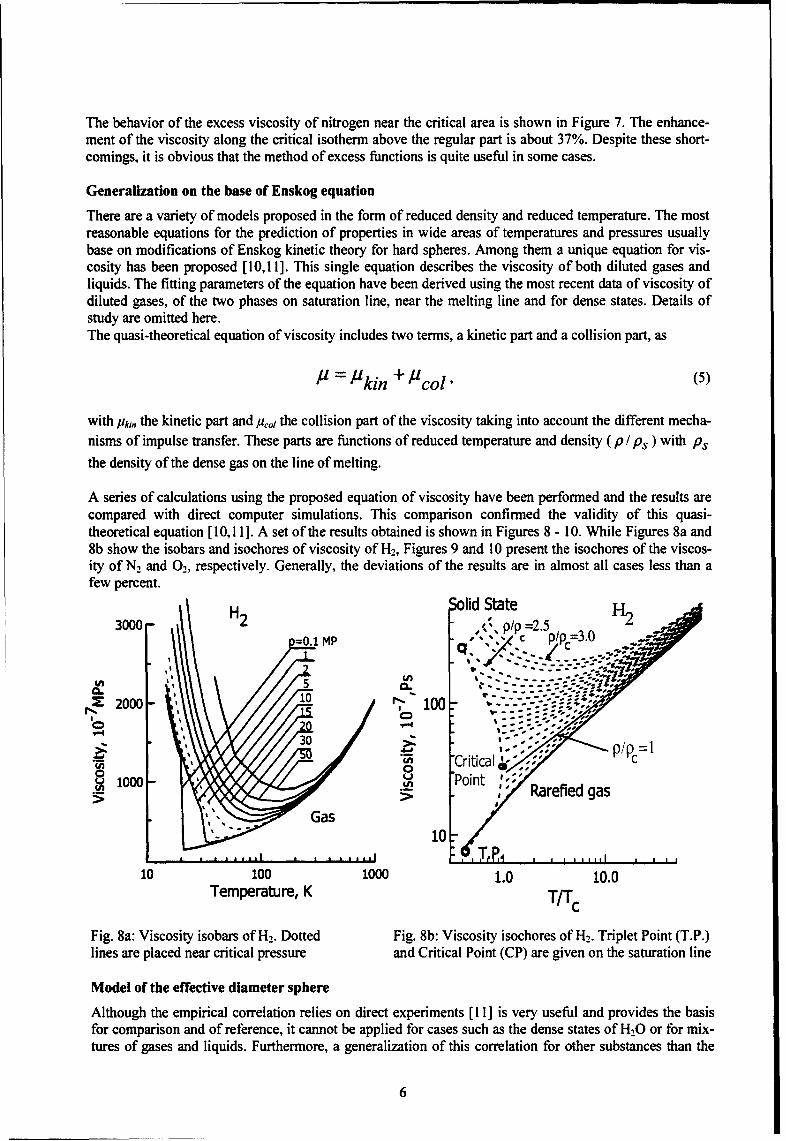
A series of calculations using the proposed equation of viscosity have been performed and the results arecompared with direct computer simulations. This comparison confirmed the validity of this quasi-theoretical equation [10,11]. A set of the results obtained is shown in Figures 8 - 10. While Figures 8a and8b show the isobars and isochores of viscosity of H2, Figures 9 and 10 present the isochores of the viscos-ity of N2 and 02, respectively. Generally, the deviations of the results are in almost all cases less than afew percent.
H000 2 lid te,00 , p/p =2.5%=0.1 MP c pp =3.0
= 0. M P '-
CL /- - - - - -
2000-~~ 1 10
"Critical'- , ' 'c0 U0M 1000- ( Point :
> > Rarefied gas
10F, el
10 100 1000 1.0 10.0Temperature, K TrTc
Fig. 8a: Viscosity isobars of H2. Dotted Fig. 8b: Viscosity isochores of H2. Triplet Point (T.P.)lines are placed near critical pressure and Critical Point (CP) are given on the saturation line
Model of the effective diameter sphere
Although the empirical correlation relies on direct experiments [11] is very useful and provides the basisfor comparison and of reference, it cannot be applied for cases such as the dense states of H20 or for mix-tures of gases and liquids. Furthermore, a generalization of this correlation for other substances than the
6
experimentally investigated ones is questionable. Therefore, the only way of overcome these kind of diffi-culties is to predict the transport properties on the basis of kinetic theory.
Solid State N2 Solid State 0210000--7Critical o:: 1 / =1.9S•'-'. .-.-...•=... "'" p/pc-3.2 pp=.
8 Pin Critical • •100pPoint =2 7/ 1
SD•ilute Gas Limit 5 100 T.P. Dilute Gas Limit
I I M iill I I li
1 .0 1 0 .0 . . . ..i i I . . . . . . .m IiT/Tc 1.0 10.0
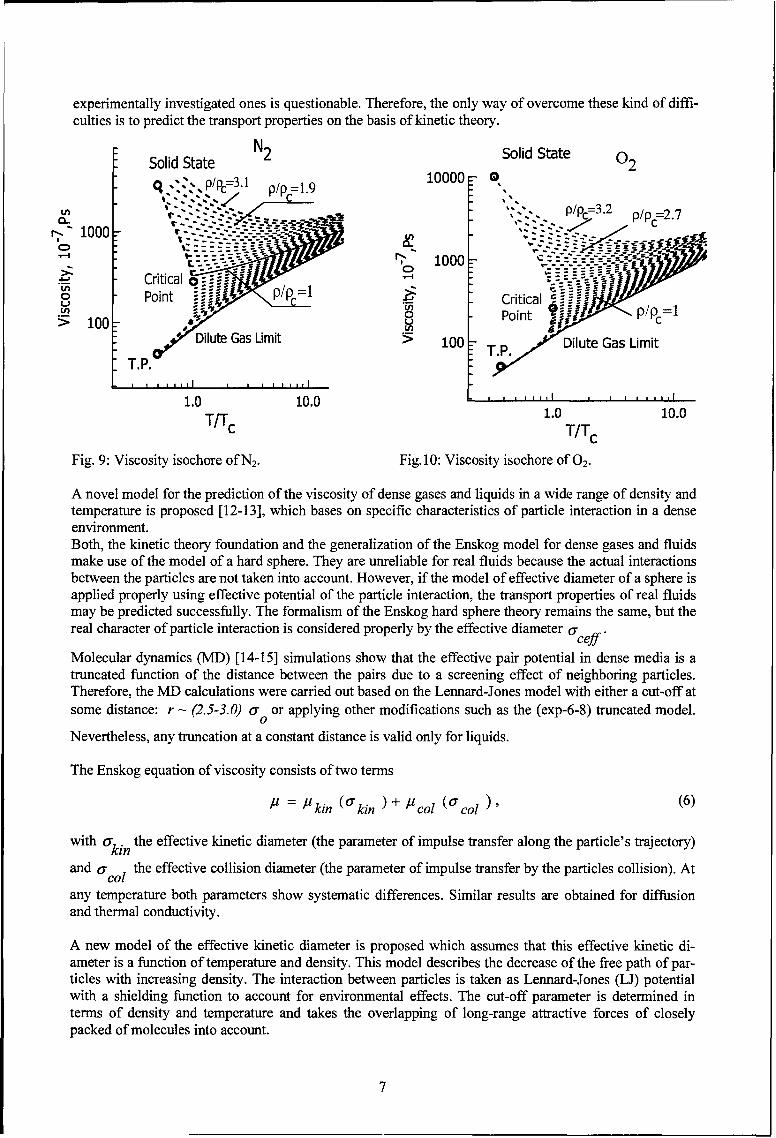
Fig. 9: Viscosity isochore of N2. Fig. 1O: Viscosity isochore of 0z.
A novel model for the prediction of the viscosity of dense gases and liquids in a wide range of density andtemperature is proposed [12-13], which bases on specific characteristics of particle interaction in a denseenvironment.Both, the kinetic theory foundation and the generalization of the Enskog model for dense gases and fluidsmake use of the model of a hard sphere. They are unreliable for real fluids because the actual interactionsbetween the particles are not taken into account. However, if the model of effective diameter of a sphere isapplied properly using effective potential of the particle interaction, the transport properties of real fluidsmay be predicted successfully. The formalism of the Enskog hard sphere theory remains the same, but thereal character of particle interaction is considered properly by the effective diameter taceff.
Molecular dynamics (MD) [14-15] simulations show that the effective pair potential in dense media is atruncated function of the distance between the pairs due to a screening effect of neighboring particles.Therefore, the MD calculations were carried out based on the Lennard-Jones model with either a cut-off atsome distance: r (2.S-3. 0) ar or applying other modifications such as the (exp-6-8) truncated model.
0
Nevertheless, any truncation at a constant distance is valid only for liquids.
The Enskog equation of viscosity consists of two terms
/. =/1kin (or kin ) +/. co (a7 coli) (6)
with arki the effective kinetic diameter (the parameter of impulse transfer along the particle's trajectory)
and aco the effective collision diameter (the parameter of impulse transfer by the particles collision). At
any temperature both parameters show systematic differences. Similar results are obtained for diffusionand thermal conductivity.
A new model of the effective kinetic diameter is proposed which assumes that this effective kinetic di-ameter is a function of temperature and density. This model describes the decrease of the free path of par-ticles with increasing density. The interaction between particles is taken as Lennard-Jones (LJ) potentialwith a shielding function to account for environmental effects. The cut-off parameter is determined interms of density and temperature and takes the overlapping of long-range attractive forces of closelypacked of molecules into account.
7
We will describe the interaction of particles taking into account the overlapping of distance fields due toclose molecular packing at higher densities taking the effective potential in form of a reference potentialmodel with an exponential screening function
U(r) [Urep (r)+Uatt (r) (exp b--ut(7)
with but the cut-off parameter, which accounts for screening interaction of the particles. The mean dis-tance between the particles s = n -1/3 is taken as a screening parameter. Thus,
* r3-1/3 ( -"bcut = S or bcut I ao = bcut = (n ) () n 1/3
cu ct, (8)
with n the number density, O"0 the parameter of the potential function (LJ in this case). In the case of low
density the potential is transformed into the reference potential function.
The results of numerical simulation using the effective kinetic diameter coincide with the results of MDcalculations for the limit of high density states as well as with kinetic diameter simulations of a dilute gasin the limiting case of DGL. For dense gases the effective kinetic diameter results show excellent agree-ment with results determined from viscosity experiments for argon, nitrogen and other gases.
For a given density, the effective kinetic diameter is derived from relation
a. (T =F221/2 F(2,2)***1)/ 2p-ln 9akin (T ,bp) j2(2,2)(T,bcut ) = Oo [ , (T*,n ) 3 '
with j(2,2) the Q -collision integrals of Cowling, b the volume of hard spheres.
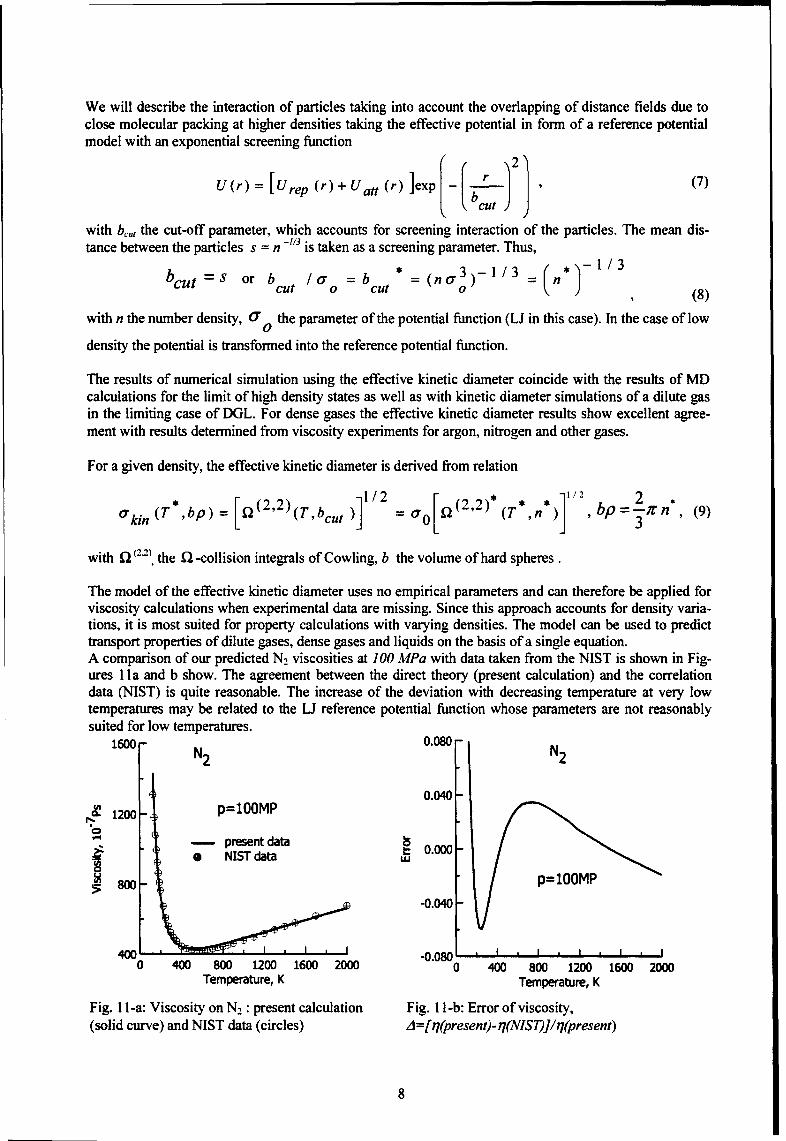
The model of the effective kinetic diameter uses no empirical parameters and can therefore be applied forviscosity calculations when experimental data are missing. Since this approach accounts for density varia-tions, it is most suited for property calculations with varying densities. The model can be used to predicttransport properties of dilute gases, dense gases and liquids on the basis of a single equation.A comparison of our predicted N2 viscosities at 100 MPa with data taken from the NIST is shown in Fig-ures I a and b show. The agreement between the direct theory (present calculation) and the correlationdata (NIST) is quite reasonable. The increase of the deviation with decreasing temperature at very lowtemperatures may be related to the LI reference potential function whose parameters are not reasonablysuited for low temperatures.
1600 N2 0.080 N2
0.040--1200 p=10OMP
" -1 present data
P= 100n 0.000-* NIST data uiS800 p=100MP
~8M-0.040-
40 0 400-012010020.080 ., 1 , * 1 , 1.0 400 800 1200 1600 2000 0 400 800 1200 1600 2000
Temperature, K Temperature, K
Fig. I 1-a: Viscosity on N2 : present calculation Fig. 11 -b: Error of viscosity,(solid curve) and NIST data (circles) 4=[rq(present)-qr(NIST)]/q(present)
8
Thermal non-equilibrium processes
The main processes in cryogenic liquid rocket engine systems are droplet vaporization and spray combus-tion including liquid jet atomization, spray formation, vaporization, multiphase flow mixing, ignition andcombustion in a high pressure high temperature environment. The time scales of liquid jet atomization,evaporation, convection and mixing are such that oxygen droplets may penetrate into the flame front andenter the reactant which is mainly superheated steam for the propellant combination LOX/GH 2.
Any evaporation process involves heat and mass transfer from the hot surrounding gases to the dropletsurface and vice versa. For an accurate prediction of these fluxes transport coefficients and thermody-namic properties of both fluids are needed. However, investigations have shown that not only conservationequations, equation of state (EQS), transport and thermodynamic properties must be modeled accurately,but also interface processes have to be taken into account. Typically, thermal equilibrium conditions onthe droplet interface is assumed which may not hold at very large temperature and concentration gradients.Therefore, a model, which accounts for thermal non-equilibrium at the droplet surface, is necessary.
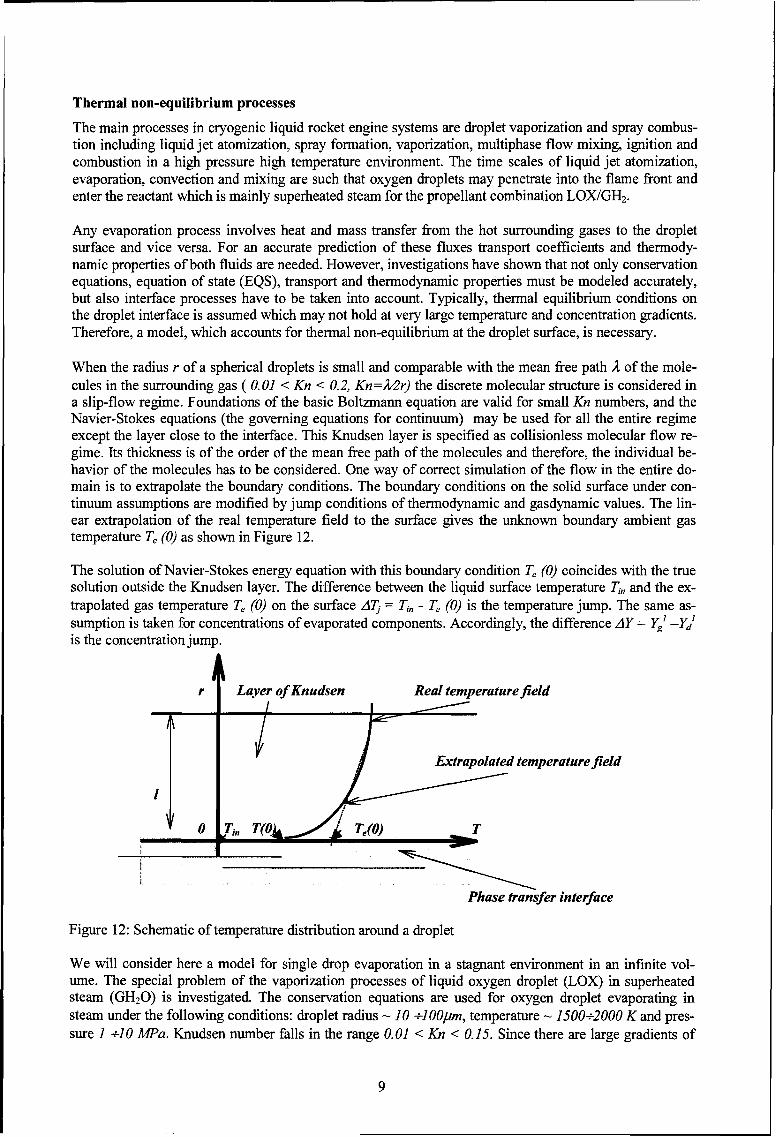
When the radius r of a spherical droplets is small and comparable with the mean free path 2 of the mole-cules in the surrounding gas ( 0.01 < Kn < 0.2, Kn=2v2r) the discrete molecular structure is considered ina slip-flow regime. Foundations of the basic Boltzmann equation are valid for small Kn numbers, and theNavier-Stokes equations (the governing equations for continuum) may be used for all the entire regimeexcept the layer close to the interface. This Knudsen layer is specified as collisionless molecular flow re-gime. Its thickness is of the order of the mean free path of the molecules and therefore, the individual be-havior of the molecules has to be considered. One way of correct simulation of the flow in the entire do-main is to extrapolate the boundary conditions. The boundary conditions on the solid surface under con-tinuum assumptions are modified by jump conditions of thermodynamic and gasdynamic values. The lin-ear extrapolation of the real temperature field to the surface gives the unknown boundary ambient gastemperature Te (0) as shown in Figure 12.
The solution of Navier-Stokes energy equation with this boundary condition Te (0) coincides with the truesolution outside the Knudsen layer. The difference between the liquid surface temperature Ti, and the ex-trapolated gas temperature Te (0) on the surface ATj = Tim - T, (0) is the temperature jump. The same as-sumption is taken for concentrations of evaporated components. Accordingly, the difference AY = ygl yd1
is the concentration jump.
r Layer of Knudsen Real temperaturefield
Extrapolated temperature field
I
Phase transfer interface
Figure 12: Schematic of temperature distribution around a droplet
We will consider here a model for single drop evaporation in a stagnant environment in an infinite vol-ume. The special problem of the vaporization processes of liquid oxygen droplet (LOX) in superheatedsteam (GH20) is investigated. The conservation equations are used for oxygen droplet evaporating insteam under the following conditions: droplet radius - 10 -lO0.um, temperature - 1500-2000 K and pres-sure 1 -10 MPa. Knudsen number falls in the range 0.01 < Kn < 0.15. Since there are large gradients of
9
temperature and concentrations on the droplet surface, the boundary conditions for conservation equationsmust be investigated.
Droplet evaporation modeling of LOX in water steam (GHO) has some specific characters. The criticalparameters of H20 are considerable higher as compared to 0. If surface temperature of the droplet islower than 100 K then according to the phase-equilibrium concept, the water vapor around the dropletcondenses and freezes at its surface. However, an ice layer on a LO2 droplet has never been observed sofar in experiments. Evidently, the processes in the ultimate boundary layer of L0 2 and GH2O may be inthermal non-equilibrium [16-18].
Model of quasi steady - state vaporization
If the characteristic time of molecular transfer is smaller than characteristic time of droplet evaporation,than the fields of temperature and concentration are invariant at constant droplet radius, and the quasisteady - state vaporization model may be used. It includes the following assumptions:
"* the temperature of droplet is constant, uniform and equal to the wet-bulb temperature, i.e. dropletheating is neglected;
"• the ambient gas has negligible solubility in the liquid and only oxygen diffuses from the surface;"* the radial motion of the liquid surface is assumed to be small;"• the pressure is equal to the ambient pressure everywhere;"* radiation, Dufour and Soret effects are negligible;"• density of gas phase is constant.
The governing system of equations is simplified further neglecting diffusion of the gas into the liquiddroplet, chemical reactions and viscous dissipation. To determine the temperature and concentrationjumps, Yalamov's approach is applied [19- 21].
The resulting simplified system of equations is as follows [22 - 23]
RuT = P+ (T))J(V -b), (10)
Y d d2S= .•pm12•TI), (11)dr r2 pmd(pmD12r dr
I -0 , (12)
ad = I a(r+( p., at p d (r2 v) (13)pddr r" dr + dr dr r 2 dr "
The boundary conditions for the gas phase are as follows:
For r = rd.
pmv= 12 -= J (14)dr P.
dT.1 - jl, (15)tm dr
10
S(T) g +1 d(Tee -Td•) Ir-d =KT I 00r"T dr I(T~g -d 1,=r Ir rd
K ) (T) (16)(yeg- yd) rndYrIr=d + KT rdT' Ir=rdi r d K n ~ r d T d r
For r = 00:
T=T 0 ,Y1=Y y.Y•= P__-, P =P +P2,R=YIR1+(1-Y,)R,,Cv=YCv,+(1-YI)Cv,. (17)Pm
Te, Yg are temperature and concentration of oxygen in the gas phase on the droplet surface; Td, Y! aretemperature and concentration of oxygen in the liquid on the droplet surface. pm is the mass density of
the mixture, v the radial velocity; Y,, D12 are the mass fraction and the binary diffusion coefficients foreach species, S, is a term which stands for different effects, for example, Dufour, Soret effects, inertiasource term ,etc..; hm, hi are the mixture and the specific enthalpies, A m is the thermal conductivity of the
mixture; AH = T' - "-1q is the specific enthalpy of vaporization of species ; K7", " are coefficients
of temperature and concentration jumps, K,'"', K7" cross coefficients.
Furthermore, we will introduce the following the non - dimensional parameters:
rp 0= T 8=p L 1 A= _m D12
r0 To 0 L-R 0r0' pR- D1 ' D-
__ R. CpI p
R0 =(1-Yo)R2 + Y10 R,, R,=--L Cp /0 , Cp =-, p P (18)-0 ' R' RO PO
- 1Cv =Cp -kR r17• Re =(1 - Ye)A2 +- YgR1
After integration of the system of governing equation and some additional mathematical simplifications ananalytical solution of the steady - state evaporation problem is derived. The equations for the temperature
A(1-0)+rB+-LA In YO-Y" =701R, (19)Y 7O ) 709-71
Y.=o (cv+R-), =o-9 LJ, (20)
A =AT+B. (21)
and concentration distributions
D dYI 1-Y(RA ~ = (C, + -o)-L (22)
can be integrated analytically for D = const:
11
1 [YA, +(I-Y)1 W, +I) A
- 7;7 , 1("19 r 2 + (2 , + 1 ( l _0)+ Q, L + B In YO (23)YOv yo A0) yo (0y, V o A) 7oO- y,
For the power dependence of D on temperature, the analytical solution depends on the power of tem-
perature. For D = _L - ,70 the equation for concentration distribution can be written as
I..In [YA +(1-(YI'1-Y Y) + 4•- Y4arctg
(24)with
CV= oo c - RI(25)
This system of the algebraic equations for the temperature and concentration fields in the neighborhood ofthe droplet is closed by the expressions forOe , Y,9 which are determined from the temperature and jumpsconditions.
Finally the system of algebraic equations for determination T', Y', Q' is the following
(Tg -T ),Ir=rd =- ( "IT'jQ ) r + /K()T' 41mp ))
(26)
(yg yd) K(')r QM( 0 f' K(T) (Qi -. Qm h,g4)- pDj) T, 4)zd2'e )
S4•u B T(T )) + A (Tg2 )] o
QM =(tr, -o.TT -e o0 QT =lQm , (27)Q(-h,)[B2 2 7)]1
with Q M, QT, the integral mass and heat fluxes and I the heat of evaporation.
To calculate the concentration and temperature jumps according to Yalamov and co-workers [211 we sim-plify the jumps coefficients, as given below:
1
2 (T 12kT (28)
12
~2~ Y D2 n(+i2 r '•.=•:o• Do2 -• 0V m2• - x (mn - ) 12 1,04
n01n02 Lk To 4po ro (FkTO) Y~ )llI 2r
(29)
0 • +4no(m, +r22) mMK T(a) no mI OY2D + 4n +M2 Mn() = 3 nO 2 2kTo0 1 5potol,.O 2kTo
no- D[1]
X (D12 12 (30)
K(T) -T (a) 2 • 26 no2 (MI+ M 2)(M 2 m -)X2kTA 1 2kTo 25 po ky 0 [2rkT0
2 ( KD12)- 2 n (m )
2 1
(31)
M 2 +2 02 mi2 o =0 _1 2 Q(I._2) -1A_ l n2 ' n1 2 2 no I n 2 5 KY12'1) (32)
no00 12
T, +1 52 ( 52no]nm-m, (33)-' 2 25z •.25z') p.2 -•, m2
( 5) 4 2 po/ (34)2)4,_. IY 5 p, ý;- '
T11 =(2- _ 85) _m + 2 2po +I , (35)2 8nA_. m11/ -I~r 5jpo-.I )'r
3 52 52 ) nonno2 , (mr-_ 4nora-TIl = +-+ ( A (36)
4 25z 25pz) ',Fm7m2 5 p0o (Y3
with no - molecular mixture concentration, noi - molecular concentration of jth component, no no, + no2,
mi - mass of a molecule; D12 - coefficient of binary diffusion, D12[I - coefficient of binary diffusion first
approach; k - Boltzmann constant; To - temperature of a droplet and Q(") - collision integrals.
The radius of evaporating droplet is determined by equation
r2 dr Q Qn (37)dt 4;p
After integrating
13
dr -_+-t__ (38)
rdt (l-h1 )p1r:-r"[(Tg -T -(T! - At (39)r:Qf (- h, )p,
follows.
Numerical results
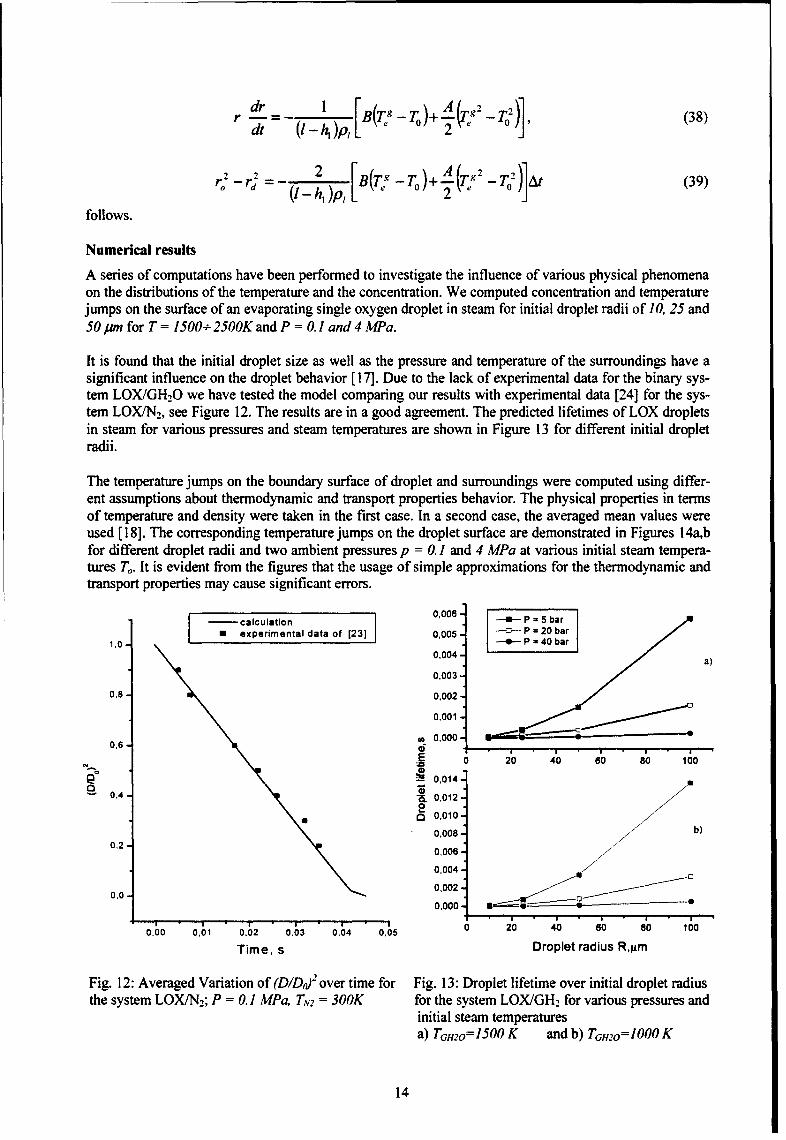
A series of computations have been performed to investigate the influence of various physical phenomenaon the distributions of the temperature and the concentration. We computed concentration and temperaturejumps on the surface of an evaporating single oxygen droplet in steam for initial droplet radii of 10, 25 and50,um for T = 1500÷ 2500K and P = 0. 1 and 4 MPa.
It is found that the initial droplet size as well as the pressure and temperature of the surroundings have asignificant influence on the droplet behavior [ 17]. Due to the lack of experimental data for the binary sys-tem LOX/GHO we have tested the model comparing our results with experimental data [24] for the sys-tem LOX/N2, see Figure 12. The results are in a good agreement. The predicted lifetimes of LOX dropletsin steam for various pressures and steam temperatures are shown in Figure 13 for different initial dropletradii.
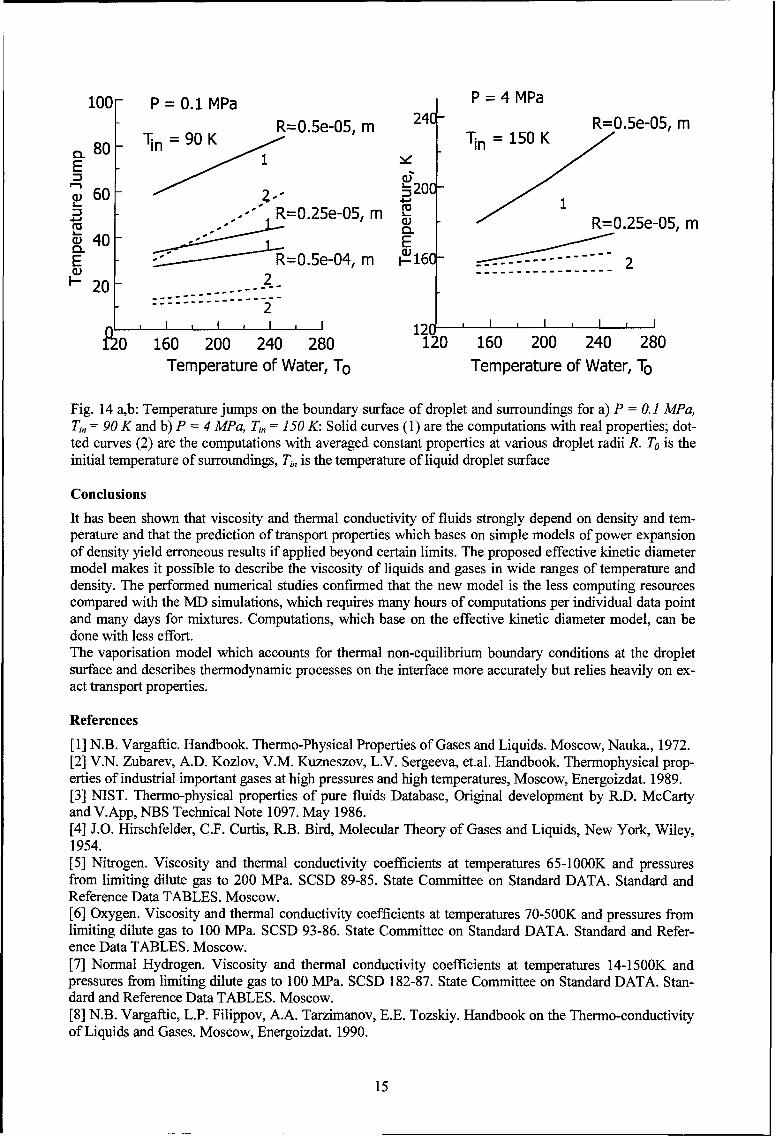
The temperature jumps on the boundary surface of droplet and surroundings were computed using differ-ent assumptions about thermodynamic and transport properties behavior. The physical properties in termsof temperature and density were taken in the first case. In a second case, the averaged mean values wereused [ 18]. The corresponding temperature jumps on the droplet surface are demonstrated in Figures 14abfor different droplet radii and two ambient pressures p = 0. 1 and 4 MPa at various initial steam tempera-tures To. It is evident from the figures that the usage of simple approximations for the thermodynamic andtransport properties may cause significant errors.
calculation I000, I I* experimental data of [231 0,005 I W P =20bar j1,0 0.0 -- -- -4bar a)
0,004- a)
0,003
0,8 0,002
0,001
S0,0000.6-
E 0 20 40 60 80 100
S0,014o 0.,4- 0,012-
0,00
0,2 - 0,0 108- b)
0,008-o,2 o0,06 7 /
0,004
0,0020,0- 0,0 s
0 20 40 60 80 1000,00 0,01 0.02 0,03 0,04 0.05
Time, s Droplet radius R,pm
Fig. 12: Averaged Variation of (DID0)2 over time for Fig. 13: Droplet lifetime over initial droplet radiusthe system LOX/N2; P = 0. 1 MPa, TN2 = 300K for the system LOX/GH2 for various pressures and
initial steam temperaturesa) TgH2o= 1500 K and b) TGH2o=1000 K
14
100- P = 0.1 MPa P =4 MPaR=0.5e-05, m 240- R=0.5e-05, m
~80- in 9 KT~= 5E1
rn "~20CSoooo° . R=0.25e-05, m ,5•.40J °E"-.--R=0"25e-05' m
E - R=0.5e-04, m i-16C ...- 220 2.. . . . . . . .U20 2::::-----------.------- ----------
2
1I I I I I 12 I I
'20 160 200 240 280 120 160 200 240 280Temperature of Water, To Temperature of Water, To
Fig. 14 ab: Temperature jumps on the boundary surface of droplet and surroundings for a) P = 0.1 MPa,T,, = 90 K and b) P = 4 MPa, T = 150 K: Solid curves (1) are the computations with real properties; dot-ted curves (2) are the computations with averaged constant properties at various droplet radii R. To is theinitial temperature of surroundings, Ti, is the temperature of liquid droplet surface
Conclusions
It has been shown that viscosity and thermal conductivity of fluids strongly depend on density and tem-perature and that the prediction of transport properties which bases on simple models of power expansionof density yield erroneous results if applied beyond certain limits. The proposed effective kinetic diametermodel makes it possible to describe the viscosity of liquids and gases in wide ranges of temperature anddensity. The performed numerical studies confirmed that the new model is the less computing resourcescompared with the MD simulations, which requires many hours of computations per individual data pointand many days for mixtures. Computations, which base on the effective kinetic diameter model, can bedone with less effort.The vaporisation model which accounts for thermal non-equilibrium boundary conditions at the dropletsurface and describes thermodynamic processes on the interface more accurately but relies heavily on ex-act transport properties.
References
[1 ] N.B. Vargaftic. Handbook. Thermo-Physical Properties of Gases and Liquids. Moscow, Nauka., 1972.[2] V.N. Zubarev, A.D. Kozlov, V.M. Kuzneszov, L.V. Sergeeva, et.al. Handbook. Thermophysical prop-erties of industrial important gases at high pressures and high temperatures, Moscow, Energoizdat. 1989.[3] NIST. Thermo-physical properties of pure fluids Database, Original development by R.D. McCartyand V.App, NBS Technical Note 1097. May 1986.[4] J.O. Hirschfelder, C.F. Curtis, R.B. Bird, Molecular Theory of Gases and Liquids, New York, Wiley,1954.[5] Nitrogen. Viscosity and thermal conductivity coefficients at temperatures 65-1000K and pressuresfrom limiting dilute gas to 200 MPa. SCSD 89-85. State Committee on Standard DATA. Standard andReference Data TABLES. Moscow.[6] Oxygen. Viscosity and thermal conductivity coefficients at temperatures 70-500K and pressures fromlimiting dilute gas to 100 MPa. SCSD 93-86. State Committee on Standard DATA. Standard and Refer-ence Data TABLES. Moscow.[7] Normal Hydrogen. Viscosity and thermal conductivity coefficients at temperatures 14-1500K andpressures from limiting dilute gas to 100 MPa. SCSD 182-87. State Committee on Standard DATA. Stan-dard and Reference Data TABLES. Moscow.[8] N.B. Vargaftic, L.P. Filippov, A.A. Tarzimanov, E.E. Tozskiy. Handbook on the Thermo-conductivityof Liquids and Gases. Moscow, Energoizdat. 1990.
15
[9] R.C. Reid, J.M. Prausnitz, B.E. Poling. The Properties of Gases and Liquids. 4h Ed. McGraw Hill,New York, 1987.[101 E. Liousternik, M.P.Voronin. Universal equation for viscosity of liquids and gases. Thermo-Physicsof High Temperatures, V.2 1, N3, 1983.[11] M.P. Voronin. Mathematical description diagram of viscosity. Ph.D. Thesis, IHT, Moscow, 1984.[12] I.A. Sokolova, V.E. Liousternik. Model and Simulation Method for Study of Dense Fluids. ShockCompression of Condensed Matters - 1995. Proceedings of the Conference of the APS Topical Group onShock Compression of Condense Matters. Seattle, Washington, 1995. Ed. S.C. Shmidt. W.C. Tao. AIPConference Proceedings. 370. Part 1., 1996., p. 16 7 -170 .[13] I.A. Sokolova, V.E. Lusternik. Numerical analysis of density dependence for effective transport ki-netic diameter for real fluids. Lecture Notes in Computer Science. V.1196, Springer-Verlag, 1997. Eds:L.Vulkov, J.Wasniewski, P.Ya., p. 474-481.[14] M. Schoen, C. Hoheisel. The shear viscosity of a Lennard-Jones fluid calculated by equilibrium MD.Molec. Physics. 1985. V.53, N3., p.653[15] J.J. Erpenbeck. Transport coefficients of hard-sphere mixtures. III. Diameter ratio 0.4 and mass ratio0.03 at high fluid density. Physical Review E. V. 1993. 48, NI, p.223-232.[16] Slavinskaya N.A., Haidn 0. J., O -H20 vapor-liquid phase equilibria, Proc. of Spray 99, Bremen,1999.[17] N.A. Slavinskaya, O.J. Haidn. Numerical modeling of isolated oxygen droplet evaporation in steam:A First approach, Proc. of 16'h ILASS Europe, Darmstadt, Germany, 2000.[ 18] N.A. Slavinskaya, O.J. Haidn. Numerical modeling of liquid oxygen evaporation in steam using non-equilibrium boundary conditions, AIAA 2001-0335, 2001.[19] S.K. Loaylka. Temperature jump in a gas mixture. Phys. of Fluids, 1974, vol. 17, No. 15, p.8 97 .[20] C. Shen. The concentration -jump coefficient in a rarefied binary gas mixture. J. Fluid Mech., 1983,vol. 137, pp. 221-23 1.[21] I.Y. Yalamov, V.S. Galojan. The droplet's dynamic in azeotropic viscosity medium. Erevan, Luis,1985.[22] I.K. Rakhmatulina. The investigation of non - steady heat transfer under evaporation, condensationand burning of drops. Ph.D., Institute of Mechanics of Lomonosov Univ., 1977.[23] T. Elperin, B. Krasovitov. Radiation, thermal diffusion and kinetic effects in evaporation and com-bustion of large and moderate size fuel droplets, Int. J. Mass Transfer, 1995, Vol. 38, N 3, pp. 409-418[24] X. Chesneau, C. Chauveau, I. G6kalp. Experiments on high pressure vaporization of liquid oxygendroplets. AIAA-94-0688, 1994.
16


![Defense Technical Information Center Compilation Part Notice · Capabilities of Military Aircraft, ... des vehicules terrestres et des vehicules maritimes] To order the complete compilation](https://img.pdfslide.net/doc/110x75/5b2560117f8b9a26578b485b/defense-technical-information-center-compilation-part-notice-capabilities-of.jpg)