Embed Size (px)
Citation preview
Demographic Factors and the Pattern of Household Expenditures in the United States
SUHAS L. KETKAR AND WHEWON CHO*
I. Introduction
Future trends in the growth and distribution of the U.S. population are of considerable economic significance because of their impact on relative numbers of persons of dependent and working age, capacity for work, productiv- ity, income distribution, consumption patterns, attitude towards investment, and so on. From among these several effects, this paper singles out for consideration the impact of population characteristics on the pattern of household expenditures. The next section briefly discusses the relevance of demographic characteristics in determining the pattern of household expendi- tures. In the subsequent section first the house- hold survey data used in this paper are des- cribed and thereafter expenditure functions are specified to include the economic and demographic characteristics of households as independent variables.
In particular, five demographic characteris- tics; viz. household's age, its size, its geographic location, its education attainment, and finally its labor force participation status are highlighted in the study. The penultimate section presents econometric results on several categories of expenditures. The paper concludes with a brief summary of the findings of the study.
II. Demographic Characteristics as Determinants of Household Expenditures
It is the authors' hypothesis that demographic characteristics of households are as important determinants of their expenditures as are price and income variables. In contrast, according to the economic models of consumer behavior,
I III
*Tennessee Tech University. An earlier version of this paper was presented at the 1979 Annual Meeting of the Atlantic Economic Society, October 10-12, 1979, Washington, D.C. The authors would like to thank Mr. Lee Grimes of the Computer Center at Tennessee Tech for many hours of patient help.
all individuals are "economic men," i.e., they maximize their utility subject only to relative prices and the constraints of their incomes. To obtain a reconciliation between the authors' hypothesis and the received economic theory of consumer behavior, one or both of the fol- lowing two propositions can be postulated: that demographic factors play a crucial role in shaping consumer preferences and/or that demographic factors affect the "true" prices of various goods and services on which indi- viduals spend as well as the "'permanent" in- come levels of households.
Both of these propositions have been ad- vanced in the literature. In a recent paper, Robert A. Pollak and Terence J. Wales [1978] begin by abandoning the assumption that all households have identical tastes. Instead, they assumed that only those with the same demo- graphic profiles have the same demand func- tions. Using British data from two sample surveys, they estimate linear and quadratic expenditure systems. The general procedure of translating is used by them to incorporate the demographic variable family size in the estimated demand systems.
The proposition that demographic character- istics affect the "true" prices and "permanent" income faced by households may be appealing to those who believe that tastes neither change nor differ importantly between people. George J. Stigler and Gary S. Becker [1977] make this point and argue that many differences among men and periods conventionally at- tributed to differences in tastes may be ex- plainable in terms of subtle differences in prices and incomes. Using this line of thought, it is possible to claim that the observed dif- ferences in the expenditure patterns of house- holds with differing demographic profiles result from differences in prices and incomes faced by them.
16
KETKAR AND CHO: HOUSEHOLD EXPENDITURES 17
Although a priori the authors accept both of the above propositions, it is their belief that the second proposition is potentially a vastly superior tool of economic analysis. Since economic theory does not explain the formulation of tastes, heavy reliance on pre- sumed differences in tastes while explaining differences in consumer behavior is likely to rob the theory of much of its predictive power [Becker, 1971]. Hence, the role of various demographic characteristics of households in affecting the true prices and incomes faced by them is emphasized in this paper. A generaliza- tion of the approach used by Van der Gaag and Smolensky [t980] is used for this purpose. Their principal objective is to derive true household equivalence scales by estimating functions dual to the Stone-Geary utility function.
In the basic version of the Gaag-Smolensky model, household expenditure on the i th com- modity is specified to depend upon the prices of various goods and services, the household's permanent income, and a vector (hi) of its demographic characteristics. Furthermore, the "permanent" income of a household is speci- fied as a function of a vector (h2) of its demo- graphic characteristics. Thus, the demographic characteristics of households are brought to bear on their expenditure patterns in two ways -some demographic factors are thought to af- fect expenditures directly, others via their impact on "permanent" incomes. The various households are believed to face identical price vectors in the empirical part of the Gaag- Smolensky study which is based on consumer expenditure survey data.
In generalizing their model, the present study postulates that the. "true" prices faced by var- ious households depend upon a vector (h3) of their demographic characteristics. Consequently, this last group of demographic characteristics are brought to influence expenditures via their impact on "true" prices.
The household's age, size, and location are believed to influence expenditure patterns di- rectly. Its educational attainment and the em- ployment status of the household head and the spouse are expected to influence expenditure
pattern through their impact on "true" prices and "permanent" incomes. The age of the household is expected to determine the pattern of its expenditures due to the stage of an indi- vidual's life cycle. Average consumption is known to decline and its composition known to change as individuals enter their later years. The physical demands of some forms of con- sumption (e.g., some forms of recreation) limit their use thereby reducing expenditures devoted to them. On the other hand, expen- ditures on drugs, and health and medical ex- penditures are expected to rise with age [Clark and Spengler, 1980]. The relevance of the geographic location of a household, including its urban versus rural base, as a determinant of the pattern of consumption expenditures de- rives from the climatic and cultural differences among various regions of the country. The ef- fect of family size on the pattern of expendi- tures is so obvious as not to warrant further elaboration.
The hypothesis on the impact of education on expenditure pattern is based on the so-caUed home production models of behavior pioneered by Gary Becket [1965] and Theodore Schultz [1974]. In these home production models, female valuation of time is introduced as a crucial variable affecting family decisions. Households are postulated to produce "basic goods" such as good health, nutrition, enter- tainment and the hke by combining market purchased goods and services with the time of various members of the household. As time, especially housewife's time, becomes more expensive, production of all basic goods will become less time-intensive. Moreover, the rela- tive prices of time-intensive basic goods (such as children) will rise, thereby causing a decline in the quantities demanded of such products. This will introduce changes in the way house- holds spend their incomes on market purchased goods and services. Thus, any changes in the educational attainment that influence valuation of time can be expected to alter the pattern of household expenditures.
The empirical investigation of household ex- penditures in the United States has mostly used time-series observations. Perhaps the most ex-
18 ATLANTIC ECONOMIC JOURNAL
haustive research in the area was undertaken by Houthakker and Taylor [1970]. Using annual data on 84 different categories of personal con- sumption expenditures from 1929 to 1964, they fitted linear expenditure functions with relative prices and total consumption expendi- tures as the independent variables. Their objec- tive was to estimate short-run and long-run elasticities of demand with respect to relative prices and total expenditure so as to make de- mand projections for the future. The various demographic characteristics were not incor- porated in any systematic fashion in this analysis on the ground that these demographic factors are likely to vary little from year to year.
More recently, Thomas Espenshade [1978] has analyzed the consumption of 11 categories of goods and services for the 38 years between 1929 and 1970, excluding the war years 1942- 1945. Alternative measures of age structure which he used included the proportion of the population under age 5, under age 10, under age 15, and 65 years and older. Total personal consumption expenditures per head, and rela- tive prices were the economic variables in his analysis. To assess the importance of these economic and demographic factors he com- puted least-squares regression for each of the 11 consumption categories.
In general, his results show that demographic variables exert a statistically significant influ- ence on spending for consumption; an aging of the population causes the per head consumption of some items to increase (for example, food and drink) and of others to decline (automo- biles and parts, gasoline and oil). Per capita expenditure on medical care is also known to depend on age. For instance, Cooper and Piro [1974] have calculated the per head medical expenditures in 1973 at $167 for individuals under the age of 19, $384 for those between 19 and 64 years in age, and $1,052 for persons over 65 years in age.
Empirical support for the belief that con- sumption patterns do differ among different regions within a country comes from Canadian evidence. K. S. Palda [1967] found such dif- ferences in fitting Engel curves to 1959 survey
data for I1 expenditure categories between two Canadian provinces. In a more extensive study for Canada, W. J. Gillen and A. Guccione [1970] also found that the time-series consump- tion functions for a number of provinces were different. Regional disparities in per capita household consumption expenditures have also been discovered to exist in India [N. Bhatta- charya and B. Mahalanobis, 1967].
The impact educational attainment and labor force participation status have on house- hold behavior has begun to receive systematic attention only in recent years. For instance, the effect education has on desired and realized fertility is vigorously researched only since the early 1970's [Willis, 1973]. With regards to employment status, the research has focused on the impact of female labor force participa- tion on the pattern of household expenditures. The significant contributions in this area are those of Strober [1977] and Vickery [1979]. Of these, the Strober contribution is aggrega- tire in the sense that she has analyzed the im- pact of female labor force participation on the total family expenditure and on expenditure on durables.
The Vickery study is more detailed. Using the 1972/73 Consumer Expenditure Survey data on the United States, she has estimated regression equations for several items of ex- penditures. For ten of these items-transporta- tion, social security and pensions, clothing, food, dry cleaning, insurance, personal care, domestic services and materials, education, and shelter-the wife's work status is found to be statistically significant. However, expenditure differences among working-wife and non-work- ing-wife households are found to be sizable only for transportation, social security and pensions, clothing, and shelter.
From the preceding discussion it would seem that each one of the demographic variables that the present authors would like to highlight has been included in the past studies on the specification and estimation of expenditure functions in the United States. However, this has been done in a haphazard and piecemeal fashion. The distinctive feature of the present study is that it attempts to include simultan-
KETKAR AND CHO: HOUSEHOLD EXPENDITURES 19
eously all of the demographic characteristics of households to explain their consumption expenditure patterns.
III. Specification of Expenditure Functions
The specification of expenditure functions is dictated by both economic theory and data availability. The paper uses household survey data to estimate the impact of the U.S. popu- lation's age structure, geographic distribution, and some other demographic characteristics on the pattern of consumer expenditures. This kind of cross-section data is superior to time-series observations for several reasons. First, demographic characteristics such as age, education, job status, etc., show greater variation across households than at the ag- gregate level over time. Secondly, region of location can be explicitly considered only when household level data are used. Thirdly, household survey data is likely to provide a much greater degree of detail in the pattern of expenditures than would time-series data.
The household surveys normally under- taken every 10 years by the Bureau of Labor Statistics (BLS) constitute a valuable body of information on the consumption expenditures of American people. The most recent BLS survey was made in 1972-73. For the purpose of the survey, the nation was divided into four geographical regions: Northeast, North- central, South and West. Over 20,000 sample families participated in the survey, either during the t972 or 1973 calendar years. In addition to expenditures on all goods and services and in- come from all sources, the survey also collected information on a variety of socioeconomic and demographic characteristics of the sampled households. Some selected family characteris- tics of the sampled households. Some selected family characteristics covered in the survey include family size, race, family income before and after taxes, ages of household head and spouse, their educational attainments and their employment status.
The full tabulation of survey results became available in 1978. These tabulations are for 12 income groups cross-classified on the basis of geographic location. The demographic charac-
teristics of every income group from each region and their average expenditures on a large num- ber of commodities are reported in the Con- sumer Expenditure Survey: Interview Survey, 1972-73, Volume 2: Regional Tables (Families Classified by Income for Four Regions), U.S. Department of Labor, 1978. Although these tabulations are quite detailed, both at the national and regional levels, it is even more useful that the Bureau of Labor Statistics provides copies of a tape with details of income and expenditures for each and every household in the sample. This is the Interview Survey Detailed Public Use Tape No. 2 issued by the Branch of Consumer Expenditures in the BLS. The empirical results presented in the next section are based on the data from this public use tape.
Turning to the specification of expenditure functions, it is clear that the household survey data that are used in this study are unsuited to estimate the apparent price effects. In any case the price effects will be negligible because among the households participating in a survey there is generally not enough variation in measured prices. In addition much of the appar- ent price variation may be attributable to quality differences [Prais and Houthakker, 1955]. Al- though unsuitable to study the price effects, cross-section data are eminently suited to study the effects of variations in income, regional location and other demographic characteristics.
In this paper, household expenditure on any given product is specified as a linear function of the level of household income (Y) and a number of relevant demographic characteristics of the family. More specifically, household expenditure on the i th commodity, EXi, is specified as a function of household income (_Y), its region of location (L) and race (R), the number of persons in the family (F) and the urban vs. rural base of the household (U..R), and finally the age of the household head (_A), his/her educational attainment or schooling status (_S), and his/her and the spouse's employment status (ESH and ESS respectively). Thus,
EXi = f ( Y_ , L, _R, _F, UR, A, S_, ES;!t, ESS). . .
20 ATLANTIC ECONOMIC JOURNAL
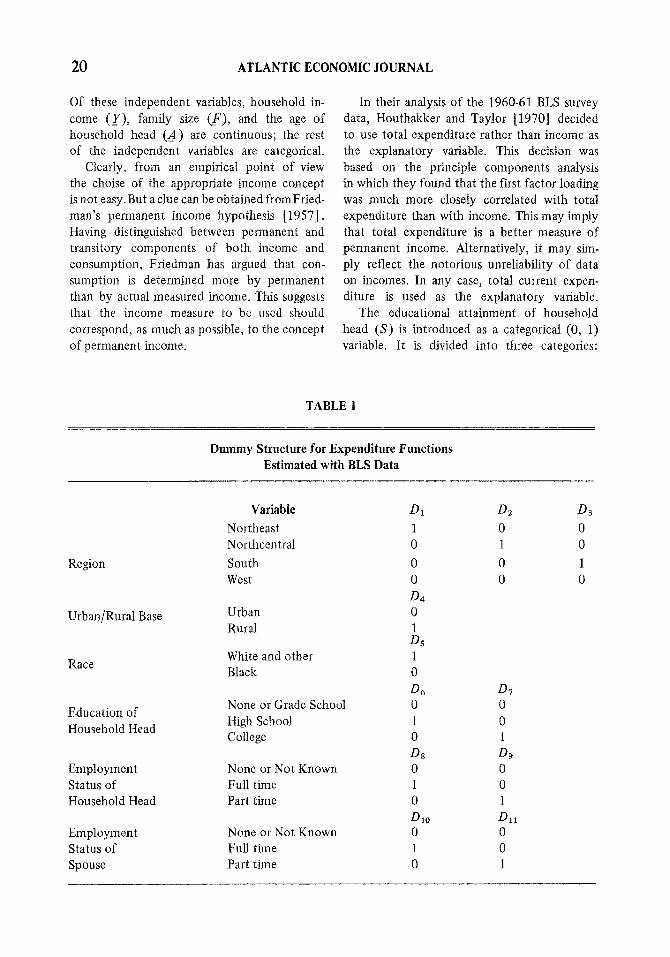
Of these independent variables, household in- come (_Y), family size (_F), and the age of household head (A) are continuous; the rest of the independent variables are categorical.
Clearly, from an empirical point of view the choise of the appropriate income concept is not easy. But a clue can be obtained fromFried- man's permanent income hypothesis [1957]. Having distinguished between permanent and transitory components of both income and consumption, Friedman has argued that con- sumption is determined more by permanent than by actual measured income. This suggests that the income measure to be used should correspond, as much as possible, to the concept of permanent income.
In their analysis of the 1960-61 BLS survey data, Houthakker and Taylor [1970] decided to use total expenditure rather than income as the explanatory variable. This decision was based on the principle components analysis in which they found that the first factor loading was much more closely correlated with total expenditure than with income. This may imply that total expenditure is a better measure of permanent income. Alternatively, it may sim- ply reflect the notorious unreliability of data on incomes. In any case, total current expen- diture is used as the explanatory variable.
The educational attainment of household head (S) is introduced as a categorical (0, 1) variable. It is divided into three categories:
TABLE 1
Dummy Structure for Expenditure Functions Estimated with BLS Data
Region
Urban/Rural Base
Race
Education of Household Head
Employment Status of Household Head
Employment Status of Spouse
Variable D1 D2 Northeast 1 0 Northcentral 0 1
South 0 0 West 0 0
D4 Urban 0 Rural 1
D5 White and other 1 Black 0
D6 D7 None or Grade School 0 0 High School 1 0 College 0 1
D8 D9 None or Not Known 0 0 Full time 1 0 Part time 0 1
Dlo Dll None or Not Known 0 0 Full thne 1 0 Part time 0 1
03 0 0
1 0
KETKAR AND CHO: HOUSEHOLD EXPENDITURES 21
none or grade school, high school and college. All households with high school education are assigned a value of 1 with all other households being assigned a value of zero. Thus, the educa- tional attainment variable is used in the form of two intercept dummy variables. Other categori- cal variables are also introduced in similar fashion so as to allow the intercept of the expenditure functions to change. The entire dummy structure is presented in Table 1.
The expenditure functions for various items of household consumption are estimated using the method of ordinary least squares. Clearly, expenditures on several products are determined jointly by households. Therefore, it would seem that the two-stage ~ind the three-stage techniques of simultaneous estimation ought to be used. But since the same "income" and demographic variables appear on the right hand side of all equations, the two and three stage least squares techniques collapse to ordinary least squares [Zellner, 1962]. Hence, the use of ordinary least squares technique is justifiable.
IV. Empirical Results
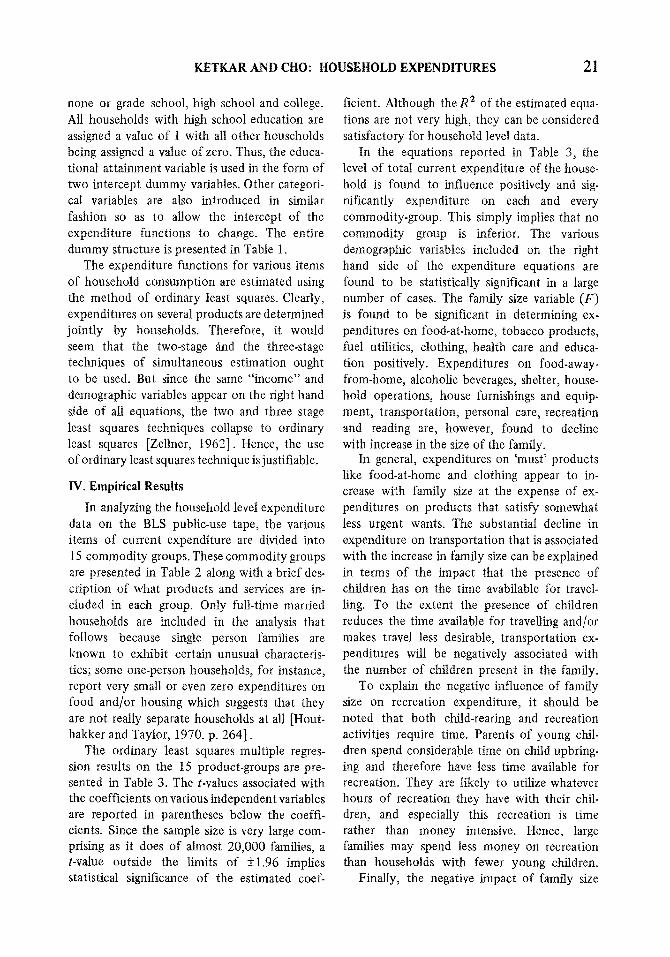
In analyzing the household level expenditure data on the BLS public-use tape, the various items of current expenditure are divided into 15 commodity groups. These commodity groups are presented in Table 2 along with a brief des- cription of what products and services are in- cluded in each group. Only full-time married households are included in the analysis that follows because single person families are known to exhibit certain unusual characteris- tics; some one-person households, for instance, report very small or even zero expenditures on food and/or housing which suggests that they are not really separate households at all [Hout- hakker and Taylor, 1970. p. 264].
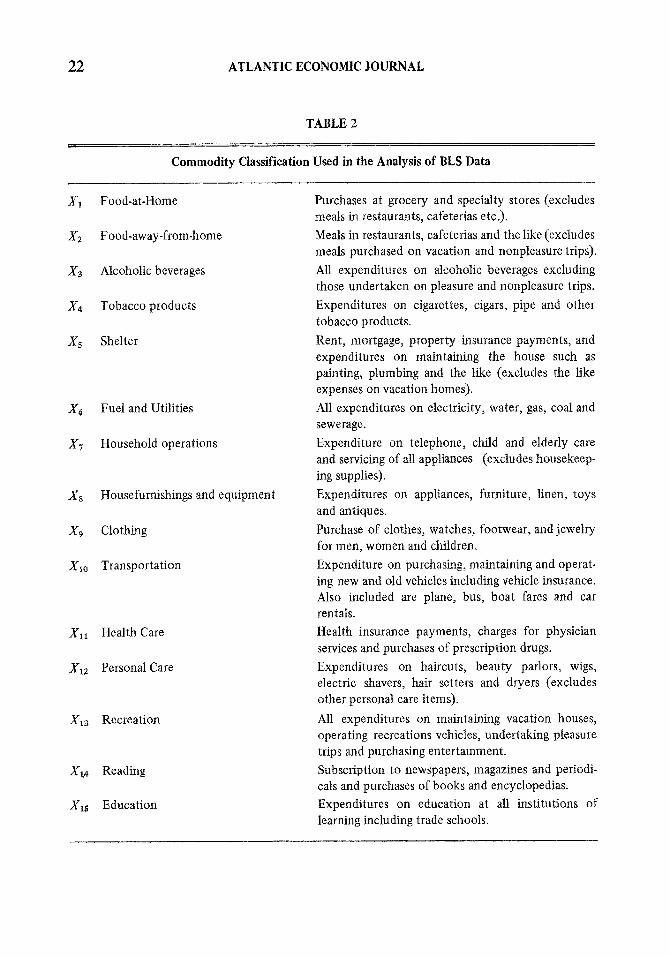
The ordinary least squares multiple regres- sion results on the 15 product-groups are pre- sented in Table 3. The t-values associated with the coefficients on various independent variables are reported in parentheses below the coeffi- cients. Since the sample size is very large com- prising as it does of almost 20,000 families, a t-value outside the limits of +t.96 implies statistical significance of the estimated coef-
ficient. Although the R 2 of the estimated equa- tions are not very high, they can be considered satisfactory for household level data.
In the equations reported in Table 3, the level of total current expenditure of the house- hold is found to influence positively and sig- nificantly expenditure on each and every commodity-group. This simply implies that no commodity group is inferior. The various demographic variables included on the right hand side of the expenditure equations are found to be statistically significant in a large number of cases. The family size variable (F) is found to be significant in determining ex- penditures on food-at-home, tobacco products, fuel utilities, clothing, health care and educa- tion positively. Expenditures on food-away- from-home, alcoholic beverages, shelter, house- hold operations, house furnishings and equip- ment, transportation, personal care, recreation and reading are, however, found to decline with increase in the size of the family.
In general, expenditures on 'must' products like food-at-home and clothing appear to in- crease with family size at the expense of ex- penditures on products that satisfy somewhat less urgent wants. The substantial decline in expenditure on transportation that is associated with the increase in family size can be explained in terms of the impact that the presence of children has on the time avabilable for travel- ling. To the extent the presence of children reduces the time available for travelling and/or makes travel less desirable, transportation ex- penditures will be negatively associated with the number of children present in the family.
To explain the negative influence of family size on recreation expenditure, it should be noted that both child-rearing and recreation activities require time. Parents of young chil- dren spend considerable time on child upbring- ing and therefore have less time available for recreation. They are likely to utilize whatever hours of recreation they have with their chil- dren, and especially this recreation is time rather than money intensive. Hence, large families may spend less money on recreation than households with fewer young children.
Finally, the negative impact of family size
22 ATLANTIC ECONOMIC JOURNAL
TABLE 2
Commodity Classification Used in the Analysis of BLS Data
X1 Food-at-Home
X2 Food-away-from-home
X3 Alcoholic beverages
X4 Tobacco products
Xs Shelter
X6 Fuel and Utilities
X7 Household operations
Xs Housefurnishings and equipment
X9 Clothing
Xlo Transportation
X11 Health Care
XI~ Personal Care
X~3 Recreation
Xt4 Reading
Xls Education
Purchases at grocery and specialty stores (excludes meals in restaurants, cafeterias etc.).
Meals in restaurants, cafeterias and the like (excludes meals purchased on vacation and nonpleasure trips).
All expenditures on alcoholic beverages excluding those undertaken on pleasure and nonpleasure trips.
Expenditures on cigarettes, cigars, pipe and other tobacco products.
Rent, mortgage, property insurance payments, and expenditures on maintaining the house such as painting, plumbing and the like (excludes the like expenses on vacation homes). All expenditures on electricity, water, gas, coal and sewerage. Expenditure on telephone, child and elderly care and servicing of all appliances (excludes housekeep- ing supplies). Expenditures on appliances, furniture, hnen, toys and antiques. Purchase of clothes, watches, footwear, and jewelry for men, women and children. Expenditure on purchasing, maintaining and operat- ing new and old vehicles including vehicle insurance. Also included are plane, bus, boat fares and car rentats. Health insurance payments, charges for physician services and purchases of prescription drugs. Expenditures on haircuts, beauty parlors, wigs, electric shavers, hair setters and dryers (excludes other personal care items).
All expenditures on maintaining vacation houses, operating recreations vehicles, undertaking pleasure trips and purchasing entertainment. Subscription to newspapers, magazines and periodi- cals and purchases of books and encyclopedias. Expenditures on education at all institutions of learning including trade schools.
Tabl
e 3:
Reg
ress
ion
Res
ults
on
Exp
endi
ture
Fun
ctio
ns
Bas
ed o
n th
e 19
7217
3 B
LS C
onsu
mer
Exp
endi
ture
Sur
vey
Dat
a
Cur
rent
Exp
endi
ture
(Y)
Fam
ily S
ize
(F)
Age
of
Hea
d (A
)
NE
D~
NC
D~
S D
~
Rur
al R
egio
n D
4
Rac
e W
hite
D~
Edu
catio
n H
igh
Sch
ool O
,
Edu
catio
n C
olle
ge D
,
Ful
l-tim
e E
mpl
oym
ent
Hou
seho
ld H
ead
D,
Par
t-tim
e E
mpl
oym
ent
Hou
seho
ld H
ead
D=
Ful
l-tim
e E
mpl
oym
ent
Spo
use
D,0
Par
t-tim
e E
mpl
oym
ent
Spo
use
D,
R'
F Ave
rage
Hou
seho
ld E
xpen
. 13
16+2
8 N
umbe
r of
Hou
seho
lds
19,9
70
Hou
se
Furn
ish-
Fo
od
Food
Aw
ay
Alc
ohol
ic
Toba
cco
Fuel
and
Hou
seho
ld
ings
and
Tr
ans-
H
ealth
P
erso
nal
at H
ome
from
Hom
e B
ever
ages
P
rodu
cts
Shel
ter
Util
ities
O
pera
tions
Equ
ipm
ent
Clo
thin
g po
rtat
ion
Car
e C
are
Rec
reat
ion
Rea
ding
Ed
ucat
ion
X+
X~
X+
X 4
X+
X~
X,
X,
X,
X++
X+ ~
X+~
X,~
X,,
X,~
0.07
54
0.05
09
0.01
16
0.00
61
0.13
56
0.02
17
0.04
49
0.06
99
0,07
96
0+27
35
0.04
77
0.01
09
0.13
16
0.00
46
0.03
43
(58.
5305
) (7
3.17
05)
(40.
9621
) (2
2.32
06)
(82
.18
75
) (5
3.44
15)
(71.
5253
) (7
5.20
29)
(106
,114
4)
(114
.879
7)
(53.
8840
) (5
7.9
15
7)
(93.
6172
) (4
1.12
26)
(44.
9543
) 24
9.76
94
- 24
.889
0 -
13
.48
01
7.
6735
-8
0.93
91
43.3
998
- 22
.051
4 -
25.3
089
25.2
693
- 10
5.64
47
6.17
14
- 1.
5098
-6
9.04
96
- 1,
0157
14
.067
8 (7
3.32
90)
(13.
5499
) (1
8.0
54
6)
(10.
5435
) (1
8.56
73)
(40.
4593
) (1
3.28
59)
(10.
3067
) (1
2,74
96)
(16.
7680
) (2
.637
0)
(3.0
48
9)
(18.
5866
) (3
.431
4)
(6.9
772)
11
.956
3 -
0.18
72
- 0.
7369
-
0.49
85
- 13
.408
9 3,
6777
0.
5057
-
3.38
07
- 0.
4188
-
6.40
55
5.94
07
1.76
46
- 0.
7186
0.
0969
8 1.
9089
(3
1.59
85)
(0.9
176)
(8
.884
7)
(6.1
40
8)
(27.
6896
) (3
0.86
35)
(2.7
426)
(1
2.39
35)
(1.8
924)
(9
.163
1)
(22+
8509
) (3
2.07
63)
(1.7
143)
(2
.949
2)
(8.5
224)
94
.754
6 -1
0.2
41
5
-22.
8476
55
,185
2 -3
8.53
60
t03,
9962
-6
.31
28
3.
9472
32
,205
0 -1
31.0
033
-35.
1935
-4
.299
1 -1
04.4
940
-14
.42
50
73
.017
6 (5
.845
4)
(1.1
717)
(6
.430
0)
(15.
9329
) (1
.857
4)
(20.
3716
) (0
.799
4)
(0.3
376)
(3
,414
4)
(4.3
744)
(3
.159
9)
(1.8
243)
(5
.910
9)
(10.
2399
) 7.
6096
) -
47.4
794
-3.3
95
8
- 16
.020
6 27
.477
2 -
199.
5158
96
.208
6 -
3.88
35
23.3
400
26,0
068
111.
6659
-
3,57
67
6.24
16
- 59
.270
4 -
9.36
16
52.6
334
(3.0
553)
(,
4049
) (4
.703
0)
(8,2
752)
(1
0.0
31
8)
(19,
6587
) (0
.512
8)
(2.0
833)
(2
.876
1)
(3.8
693)
(0
.334
7)
(2.7
626)
(3
.497
3)
(6,g
321)
5.
7218
) -
13
.91
87
26
.561
6 -
42
.91
91
31
,269
8 -
296.
4586
69
.541
4 36
.550
8 2
4.7
33
1
46,3
764
82.0
976
52,2
507
15.2
634
- 72
.326
4 -
4.76
32
46.3
433
(0.8
955)
(3
.169
3)
(12
.59
89
) (9
+4
16
9)
(14.
9054
) (1
4.20
90)
(4.8
266)
(2
.207
5)
(5,1
285)
(2
.659
4)
(4.8
934)
(6
.755
4)
(4.2
674)
(3
.562
9)
5.03
78)
- 62
.077
5 -4
5.55
96
-9.6
95
8
-11.
4493
-2
67.1
505
50,9
341
-14.
4492
14
.141
8 -2
9,16
21
344.
8064
4
7+
00
65
-1
5.31
12
2.34
54
-1.5
90
4
-5.8
71
9
(4.1
663)
(5
.672
8)
(2.9
701)
(3
,59
8()
) (1
4.01
65)
(10.
8601
) (1
.991
0)
(1.3
172)
(3
.365
3)
(12.
5320
) (4
.594
0)
(7.0
716)
(0
.144
9)
(1.2
288)
0.
6663
) 8,
0552
47
,259
6 3.
2065
2
1+
83
21
-9
.55
05
39
.971
4 -3
9.5
41
2
-91
.86
45
-1
25.3
412
-59.
8965
11
9.01
93
-1.9
08
2
98
+3
73
2
12.1
117
-16.
2906
(.
4382
) (4
,772
6)
(0.7
966)
(5
.564
6)
(.40
62)
(6.9
123)
(4
.419
3)
(6.9
397)
(1
1,73
11)
(1.7
655)
(9
,433
8)
(0.7
148)
(4
.912
5)
(7.5
901)
1.
4987
) 35
.444
7 25
.915
8 -6
.40
25
2+
9916
38
.844
0 45
,334
6 18
.533
3 -3
.86
06
-0
+698
3 -1
60.7
398
20.8
608
19.6
955
-15.
9607
6.
4569
-2
1.5
50
0
(2.5
774)
(3
,494
5)
(2.1
23
9)
(1.0
183)
(2
.207
0)
(10.
4679
) (2
.765
7)
(0.3
899)
(0
.089
4)
(6.3
266)
(2
.20
77
) (9
.850
9)
(1.0
644)
(7
.076
4)
2.64
73)
-81.
0236
36
.374
9 -8
.68
79
-4
9,54
38
288.
5966
50
.414
4 95
.989
3 16
.026
6 77
,494
8 -6
3t.
77
52
39
.528
5 14
.004
3 73
.910
2 33
.895
6 54
.026
9 (4
.986
8)
(4.1
515)
(2
.439
4)
(14.
2710
) (1
3.87
66)
(9,8
527)
(1
2.12
41)
(1.3
682)
(8
.196
8)
(21.
0467
) (3
.54
09
) (5
.928
5)
(4.1
712)
(2
4.00
58)
(5.6
175)
67
.679
6 70
.608
0 14
.055
2 26
,910
6 -2
11.2
757
31.2
908
-69.
0899
-2
9.88
08
18.5
307
77.0
593
15.9
943
24.4
143
-42,
4179
1.
8912
-9
.09
92
(4
.281
7)
(8.2
833)
(4
.056
5)
(7+
96
78
) (1
0.44
39)
(6+
28
59
) (8
+g
70
0)
(2.6
222)
(2
,014
7)
(2.6
387)
(1
.472
8)
(10.
6238
) (2
.460
7)
(1.3
770)
(0
.972
6)
22.7
073
31+
6754
5
.53
61
10
+38
00
- 70
.691
0 9.
3279
-
38.6
939
- 50
.047
0 -
3+31
82
22.0
427
- 1.
2233
12
.195
0 -
24.4
959
2.55
12
58.4
515
(0.9
628)
(2
.490
5)
(1.0
709)
(2
.059
8)
(2.3
420)
(I
.255
6)
(3.3
669)
(2
.943
5)
(0.2
408)
(0
.506
0)
(0.0
775)
(3
.556
5)
(0,9
524)
(1
.244
6)
(4.1
669)
-53.
0779
36
.885
4 -1
3.25
71
18,3
847
-169
.444
0 4,
3473
-1
1.15
22
6.55
51
14
.40
31
19
6.75
50
7.05
83
17.6
613
-47.
3684
-0
.42
43
-1
6.29
58
(4.0
597)
(5
.231
4)
(4.6
25
7)
(6,5
810)
(1
0.12
65)
(1.0
559)
(1
.750
4)
(0.9
077)
(1
.893
1)
(8.1
456)
(0
.78
55
) (9
.291
3)
(3.3
222)
(0
.372
8)
(2.1
057)
18.1
301
- 19
.506
9 -
9.18
67
5,48
51
- 11
7.32
45
28.8
487
- 39
.888
4 -
31.3
624
- 6.
3019
75
.241
9 43
.685
9 7.
2997
31
.875
6 2.
4863
4.
2632
(1
.036
3)
(2.0
878)
(2
.39
58
) (1
,467
3)
(5.2
404)
(5
.236
5)
(4.6
794)
(2
.486
8)
(0,6
189)
(2
.328
1)
(3,6
346)
(2
.87
02
) (1
,670
9)
(1.2
789)
(0
.411
1 ) .4
664
.315
8 .1
231
.107
7 .3
948
,358
7 .2
725
.302
2 .5
173
.479
6 .2
118
.252
7 .3
892
.193
3 .1
585
1247
.625
7 65
9,31
15
201.
1471
17
3.18
76
931.
4888
1
98
+9
34
9
535.
2931
61
8.60
61
1529
.780
2 13
15.2
607
384+
1841
48
3.36
56
90
9+
83
40
34
2.76
11
269.
6795
37
2.55
76
.39
128.
35
1315
.96
409,
60
301.
41
467.
63
567.
16
1604
.39
474+
74
101.
64
649.
48
48.9
1 10
9.34
19
,970
19
,970
19
,970
19
,970
19
,970
19
,970
19
,970
19
,970
19
,970
19
,970
19
,970
19
,970
19
,970
19
,970
¢3
:=
O
+. O
C
:=
O F=
X t'J
L
~
24 ATLANTIC ECONOMIC JOURNAL
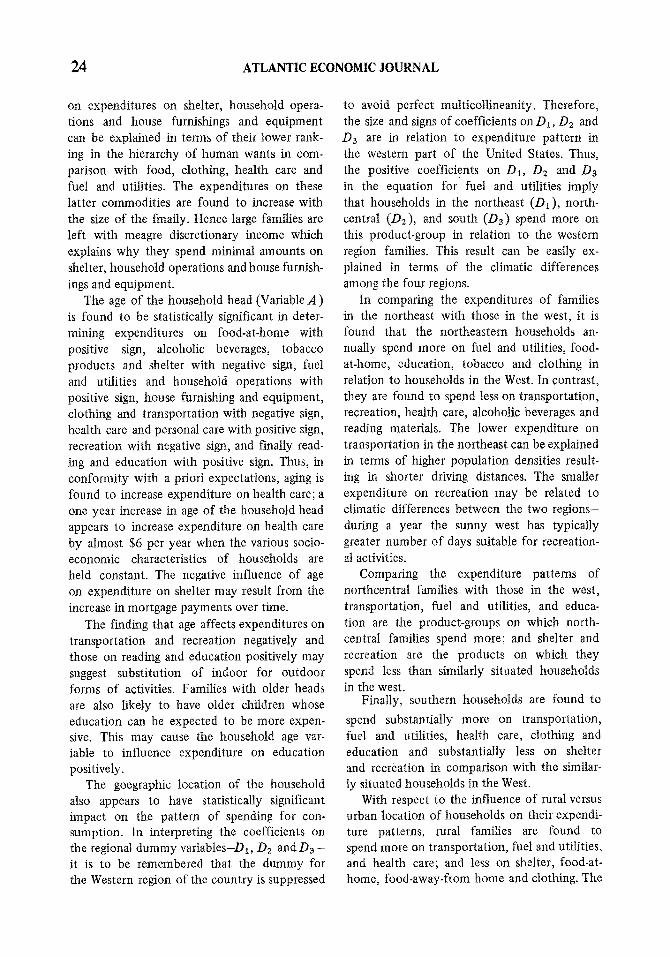
on expenditures on shelter, household opera- tions and house furnishings and equipment can be explained in terms of their lower rank- ing in the hierarchy of human wants in com- parison with food, clothing, health care and fuel and utilities. The expenditures on these latter commodities are found to increase with the size of the fmaily. Hence large families are left with meagre discretionary income which explains why they spend minimal amounts on shelter, household operations and house furnish- ings and equipment.
The age of the household head (Variable A ) is found to be statistically significant in deter- mining expenditures on food-at-home with positive sign, alcoholic beverages, tobacco products and shelter with negative sign, fuel and utilities and household operations with positive sign, house furnishing and equipment, clothing and transportation with negative sign, health care and personal care with positive sign, recreation with negative sign, and finally read- ing and education with positive sign. Thus, in conformity with a priori expectations, aging is found to increase expenditure on health care; a one year increase in age of the household head appears to increase expenditure on health care by almost $6 per year when the various socio- economic characteristics of households are held constant. The negative influence of age on expenditure on shelter may result from the increase in mortgage payments over time.
The finding that age affects expenditures on transportation and recreation negatively and those on reading and education positively may suggest substitution of indoor for outdoor forms of activities. Families with older heads are also likely to have older children whose education can be expected to be more expen- sive. This may cause the household age var- iable to influence expenditure on education positively.
The goegraphic location of the household also appears to have statistically significant impact on the pattern of spending for con- sumption. In interpreting the coefficients on the regional dummy variables-D1, D2 a n d D 3 - it is to be remembered that the dummy for the Western region of the country is suppressed
to avoid perfect multicollineanity. Therefore, the size and signs of coefficients on D1, D2 and D3 are in relation to expenditure pattern in the western part of the United States. Thus, the positive coefficients on D1, D2 and D3 in the equation for fuel and utilities imply that households in the northeast (D1), north- central (D2), and south (D3) spend more on this product-group in relation to the western region families. This result can be easily ex- plained in terms of the climatic differences among the four regions.
In comparing the expenditures of families in the northeast with those in the west, it is found that the northeastern households an- nually spend more on fuel and utilities, food- at-home, education, tobacco and clothing in relation to households in the West. In contrast, they are found to spend less on transportation, recreation, health care, alcoholic beverages and reading materials. The lower expenditure on transportation in the northeast can be explained in terms of higher population densities result- ing in shorter driving distances. The smaller expenditure on recreation may be related to climatic differences between the two regions- during a year the sunny west has typically greater number of days suitable for recreation- al activities.
Comparing the expenditure patterns of northcentral families with those in the west, transportation, fuel and utilities, and educa- tion are the product-groups on which north- central families spend more; and shelter and recreation are the products on which they spend less than similarly situated households in the west.
Finally, southern households are found to
spend substantially more on transportation, fuel and utilities, health care, clothing and education and substantially less on shelter and recreation in comparison with the similar- ly situated households in the West.
With respect to the influence of rural versus urban location of households on their expendi- ture patterns, rural families are found to spend more on transportation, fuel and utilities, and health care; and less on shelter, food-at- home, food-away-from home and clothing. The
KETKAR AND CHO: HOUSEHOLD EXPENDITURES 25
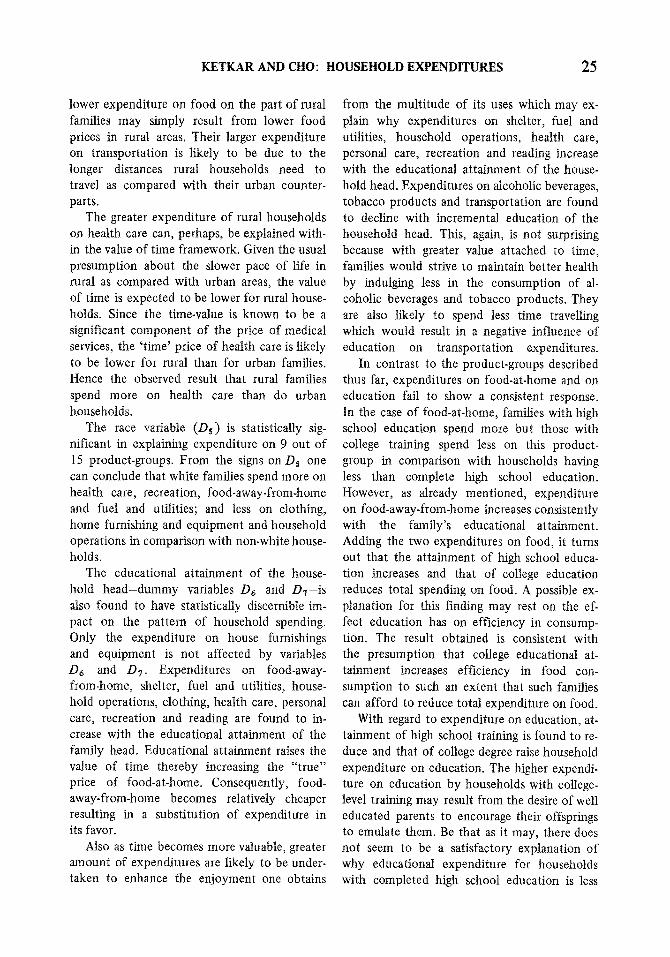
lower expenditure on food on the part of rural families may simply result from lower food prices in rural areas. Their larger expenditure on transportation is likely to be due to the longer distances rural households need to travel as compared with their urban counter- parts.
The greater expenditure of rural households on health care can, perhaps, be explained with- in the value of time framework. Given the usual presumption about the slower pace of life in rural as compared with urban areas, the value of time is expected to be lower for rural house- holds. Since the time-value is known to be a significant component of the price of medical services, the 'time' price of health care is likely to be lower for rural than for urban families. Hence the observed result that rural families spend more on health care than do urban households.
The race variable (Ds) is statistically sig- nificant in explaining expenditure on 9 out of 15 product-groups. From the signs on D5 one can conclude that white families spend more on health care, recreation, food-away-from-home and fuel and utilities; and tess on clothing, home furnishing and equipment and household operations in comparison with non-white house- holds.
The educational attainment of the house- hold head-dummy variables D6 and DT-is also found to have statistically discernible im- pact on the pattern of household spending. Only the expenditure on house furnishings and equipment is not affected by variables D6 and DT. Expenditures on food-away- from-home, shelter, fuel and utilities, house- hold operations, clothing, health care, personal care, recreation and reading are found to in- crease with the educational attainment of the family head. Educational attainment raises the value of time thereby increasing the "true" price of food-at-home. Consequently, food- away-from-home becomes relatively cheaper resulting in a substitution of expenditure in its favor.
Also as time becomes more valuable, greater amount of expenditures are likely to be under- taken to enhance the enjoyment one obtains
from the multitude of its uses which may ex- plain why expenditures on shelter, fuel and utilities, household operations, health care, personal care, recreation and reading increase with the educational attainment of the house- hold head. Expenditures on alcoholic beverages, tobacco products and transportation are found to decline with incremental education of the household head. This, again, is not surprising because with greater value attached to time, families would strive to maintain better health by indulging less in the consumption of al- coholic beverages and tobacco products. They are also hkely to spend less time travelling which would result in a negative influence of education on transportation expenditures.
In contrast to the product-groups described thus far, expenditures on food-at-home and on education fail to show a consistent response. In the case of food-at-home, families with high school education spend more but those with college training spend less on this product- group in comparison with households having less than complete high school education. However, as already mentioned, expenditure on food-away-from-home increases consistently with the family's educational attainment. Adding the two expenditures on food, it turns out that the attainment of high school educa- tion increases and that of college education reduces total spending on food. A possible ex- planation for this finding may rest on the ef- fect education has on efficiency in consump- tion. The result obtained is consistent with the presumption that college educational at- tainment increases efficiency in food con- sumption to such an extent that such families can afford to reduce total expenditure on food.
With regard to expenditure on education, at- tainment of high school training is found to re- duce and that of college degree raise household expenditure on education. The higher expendi- ture on education by households with college- level training may result from the desire of well educated parents to encourage their offsprings to emulate them. Be that as it may, there does not seem to be a satisfactory explanation of why educational expenditure for households with completed high school education is less
26 ATLANTIC ECONOMIC JOURNAL
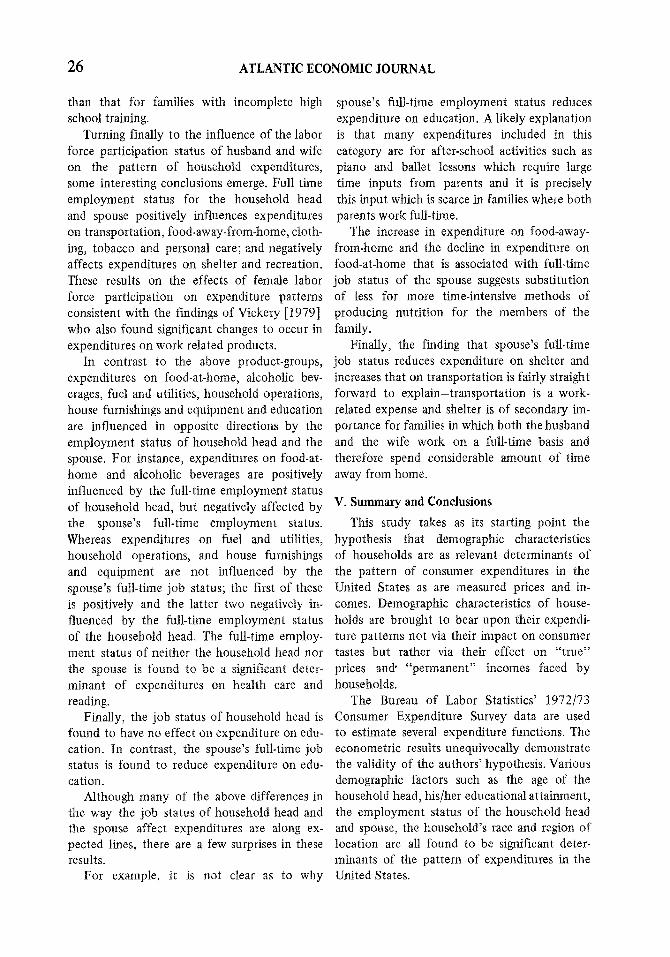
than that for families with incomplete high school training.
Turning finally to the influence of the labor force participation status of husband and wife on the pattern of household expenditures, some interesting conclusions emerge. Full time employment status for the household head and spouse positively influences expenditures on transportation, food-away-from-home, cloth- ing, tobacco and personal care; and negatively affects expenditures on shelter and recreation. These results on the effects of female labor force participation on expenditure patterns consistent with the findings of Vickery [1979] who also found significant changes to occur in expenditures on work related products.
In contrast to the above product-groups, expenditures on food-at-home, alcoholic bev- erages, fuel and utilities, household operations, house furnishings and equipment and education are influenced in opposite directions by the employment status of household head and the spouse. For instance, expenditures on food-at- home and alcoholic beverages are positively influenced by the full-time employment status of household head, but negatively affected by the spouse's full-time employment status. Whereas expenditures on fuel and utilities, household operations, and house furnishings and equipment are not influenced by the spouse's full-time job status; the first of these is positively and the latter two negatively in- fluenced by the full-time employment status of the household head. The full-time employ- ment status of neither the household head nor the spouse is found to be a significant deter- minant of expenditures on health care and reading.
Finally, the job status of household head is found to have no effect on expenditure on edu- cation. In contrast, the spouse's full-time job status is found to reduce expenditure on edu- cation.
Although many of the above differences in the way the job status of household head and the spouse affect expenditures are along ex- pected lines, there are a few surprises in these results.
For example, it is not clear as to why
spouse's full-time employment status reduces expenditure on education. A likely explanation is that many expenditures included in this category are for after-school activities such as piano and ballet lessons which require large time inputs from parents and it is precisely this input which is scarce in families where both parents work full-time.
The increase in expenditure on food-away- from-home and the decline in expenditure on food-at-home that is associated with full-time job status of the spouse suggests substitution of tess for more time-intensive methods of producing nutrition for the members of the family.
Finally, the finding that spouse's full-time job status reduces expenditure on shelter and increases that on transportation is fairly straight forward to explain-transportation is a work- related expense and shelter is of secondary im- portance for families in which both the husband and the wife work on a full-time basis and therefore spend considerable amount of time away from home.
V. Summary and Conclusions
This study takes as its starting point the hypothesis that demographic characteristics of households are as relevant determinants of the pattern of consumer expenditures in the United States as are measured prices and in- comes. Demographic characteristics of house- holds are brought to bear upon their expendi- ture patterns not via their impact on consumer tastes but rather via their effect on "true" prices and" "permanent" incomes faced by households.
The Bureau of Labor Statistics' 1972/73 Consumer Expenditure Survey data are used to estimate several expenditure functions. The econometric results unequivocally demonstrate the validity of the authors' hypothesis. Various demographic factors such as the age of the household head, his/her educational attainment, the employment status of the household head and spouse, the household's race and region of location are all found to be significant deter- minants of the pattern of expenditures in the United States.
KETKAR A N D CHO: HOUSEHOLD EXPENDITURES 27
REFERENCES
G. S. Becker, "A Theory of the Allocation of Time," Economic Journal, Vol. 75, September 1965, pp. 493-517.
_ _ , Economic Theory, New York: Alfred A. Knopf, 1971.
_ _ and G. J. Stigler, "De Gustibus Non Est Disputandum," American Economic Review, Vot. 67, No. 2, March 1977, pp. 76-90.
N. Bhattacharya and B. Mahalanobis, "Regional Disparities in Household Consumption in India," Journal of American Statistical Association, Vol. 62, March 1967, pp. 143-161.
R. L Clark and J. J. Spengler, The Economics of Individual and Population Aging, New York: Cam- bridge University Press, 1980.
B. Cooper and P. A. Piro, "Age Differences in Medical Care Spending, Fiscal Year 1973," Social Security Bulletin, Vol. 37, No. 5, May 1974, pp. 3-14.
T. J. Espenshade, "How a Trend Towards a Sta- tionary Population Affects Consumer Demand," Population Studies, Vol. 32, No. 1, March 1978, pp. 147-158.
M. Friedman, A Theory of the Consumption Function, Princeton, N.J.: Princeton University Press, 1957.
W. J. Gillen and A. Guccione, "The Estimation of Postwar Regional Consumption Function in Canada," Canadian Journal of Economics, Vol. 3, May 1970, pp. 276-90.
H. S. Houthakker and L. D. Taylor, Consumer Demand in the United States: Analysis and Projec- tions, Cambridge, Massachusetts: Harvard Univezsity Press, 1970.
K. S. Palda, "Comparison of Consumer Expendi- tnres in Quebec and Ontario," Canadian Journal of Economics and Political Science, Vol. 33, February 1967, pp. 16-26.
R. A. Pollak and T. J. Wales, "Estimation of Com- plete Demand Systems from Household Budget Data," American Economic Review, Vol. 68, No. 3, June 1978, pp. 348-59.
S. J. Prais and H. S. Houthakker, The Analysis of Family Budgets, Cambridge University Press, 1955.
T. W. Schultz, "The High Value of Human Time: Population Equilibrium," Journal of Political Econ- omy, Vol. 82, March/April 1974, Supplement, pp. $2-S10.
E. Smolensky and J. Van der Gaag, "Income, Con- sumption, True Household Equivalence Scales and Characteristics of the Poor in the United States," Paper presented at the World Meeting of the Econo- metric Society, Aix-en-Provence, September 1980.
Myra H. Strober, "Wives' Labor Force Behavior and Family Consumption Patterns," American Eco- nomic Review (Papers and Proceedings of the 89th Annual Meeting of AEA), Vol. 67, No. 1, February 1977, pp. 410-17.
U. S. Department of Labor, Consumer Expendi- ture Survey: Interview Survey, 1972-73. Vol. 2: Regional Tables, Washington, D.C., 1978, Bureau of Labor Statistics.
C. Vickery, "Women's Economic Contribution to the Family," in The Subtle Revolution, Ralph E. Smith (editor), Washington, D.C., The Urban Insti- tute, 1979.
Robert Willis, "A New Approach to the Economic Theory of FertJ~ty,'" Journal of Political Economy, Vol. 81, March/April 1973, Supplement: S14-$65.
A. Zellner, "An Efficient Method of Estimating Seemingly Unrelated Regressions and Tests for Ag- gregation Bias," Journal of the American Statistical Association, VoL 57, No. 298, June 1962, pp. 348-68.