Embed Size (px)
Citation preview

Demographics and Neighborhoods
page 4-101
Access and security impacts would not change from those noted for the full BRT, except that theportion of the ROW between Woodman Avenue and Lankershim Boulevard would not beutilized. The on-street alignment is therefore judged to be compatible with surroundingneighborhood uses.
e. Minimum Operable Segment (MOS)
The impacts associated with the MOS would be the same as those noted for the Full BRT, but allimpacts (except noise) between Owensmouth Avenue and Balboa Boulevard, and WoodmanAvenue and Lankershim Boulevard would be eliminated. The project is judged to be compatiblewith the adjacent neighborhood.
4-3.3.3 Environmental Justice
This topic is required by NEPA only; hence, only NEPA language is used.
With the exception of the No Build Alternative, all other alternatives would improve transitservice and therefore would benefit minority and low-income populations.
The data used to evaluate environmental justice impacts are stated in section 4-3.1d. Overall, thestudy area has a smaller minority population than the City of Los Angeles. The only part of thestudy area that approaches the City of Los Angeles in the size of its minority community is theVan Nuys/Oxnard Station Influence Area, which has a minority population of 58 percent. Thesame pattern holds true for average per capita income, and the number of people living below thepoverty line. The population characteristics indicative of transit dependency are also generallyhigher in the City of Los Angeles than in the study area.
Based on the above-mentioned statistics, there is no minority, low-income, or transit-dependenttarget population in the project study area which is substantially higher than in the City of LosAngeles as a whole. In fact, in almost every demographic category analyzed for environmentaljustice issues, the population of the project study area had percentages equal to or often lowerthan the City of Los Angeles.
In addition, there is no evidence that the minority and low-income populations present in theentire study area are disproportionately located in areas directly adjacent to the SP MTA ROW,where the majority of the adverse effects associated with the proposed project (almost entirelytemporary and associated with construction [see Section 5-4]) are likely to occur. These adverseeffects would also be of equal magnitude along the entire corridor, and would notdisproportionately affect a single area or group of areas along the corridor. Equally, no singletype of adverse effect would disproportionately affect a minority or low-income community.This judgement is supported by the fact that no concerns regarding environmental justice or theracial, ethnic, or income characteristics of the affected population have been raised during theongoing public outreach program (see Section 4-3.3a, below).
Once the San Fernando Valley East-West Transit Corridor is operating, the effect would belargely beneficial, in the form of improved access via public transit. Low-income and minoritypopulations, particularly those living in close proximity to the corridor, would be beneficiaries.

Demographics and Neighborhoods
page 4-102
Potential adverse operational effects such as noise and safety and security would be effectivelymitigated for all users and nearby residents, including minority and low-income persons.
In light of the aforementioned facts, it is judged that no disproportionately high and adversehuman health or environmental effects would occur to minority or low-income populations,within the meaning of Executive Order 12898.
a. Public Participation
Efforts have been and will continue to be made to ensure meaningful opportunities for publicparticipation during the project development and review process. In May of 2000, two openhouse information sessions were held, one in the East Valley and one in the West Valley.Notification of these sessions was given two weeks in advance, through bilingual notices mailedto certain area residents, notices placed in newspapers, and through a press release. The purposeof these meetings was to receive comments from the community regarding their concerns andfeelings about the San Fernando Valley East-West Transit Corridor, and to incorporate thesecomments in the environmental document. In addition, there have been ongoing meetings withstakeholders along the route in order to inform the community of the BRT alternative in the East-West Transit Corridor. No environmental justice concerns have been raised, pursuant to theexecutive order.
4-3.4 Mitigation Measures
4-3.4.1 Demographics
No mitigation is required.
4-3.4.2 Neighborhoods
For the No Build alternative, mitigation measures are not required.
For the TSM alternative, mitigation measures are not required.
D&N-1: For the BRT alternative, mitigation would be desirable in areas where the proposedalignment may permit new views into residential neighborhoods. This includes areaswhere the alignment does not follow the alignment of an existing roadway, and abutsresidences that do not have sufficient landscaping to block views of the property andresidential structure. The most effective mitigation would be to fill in the gaps invegetation so that backyards and second stories are shielded from the alignment bytrees or shrubs. This measure would eliminate new views created by the proposedalignment.
4-3.4.3 Environmental Justice
No mitigation is required.

Community Facilities and Services
page 4-103
4-4 COMMUNITY FACILITIES AND SERVICES
4-4.1 Existing Facilities and Services
Community facilities and services which that are located within ¼ mile of the proposed projector their whose service areas falls within ¼ mile of the proposed project are listed in Table 4-9and shown on Figure 4-27.
4-4.1.1 Fire and Police Protection Services
Police protection services for the City of Los Angeles are provided by the Los Angeles PoliceDepartment (LAPD). The proposed project would be located entirely within the jurisdiction ofthe Valley Bureau of the LAPD. Three community police stations within the Valley Bureauwould provide service in the proposed project area:
• North Hollywood Community Police Station11640 Burbank BoulevardNorth Hollywood
• Van Nuys Community Police Station6240 Sylmar AvenueVan Nuys
• West Valley Community Police Station19020 Vanowen StreetReseda
Fire protection services for the City of Los Angeles are provided by the Los Angeles FireDepartment (LAFD). The proposed project would be located entirely within Division 3 of theLAFD and would be served by Battalions 10, 14, and 17. The fire stations that would potentiallyprovide service in the proposed project area are:
• Fire Station 605320 Tujunga AvenueNorth Hollywood
• Fire Station 10213200 Burbank BoulevardNorth Hollywood
• Fire Station 897063 Laurel Canyon BoulevardNorth Hollywood


b


Community Facilities and Services
page 4-107
Table 4-9: Community Facilities Located (or with Service Areas) within Study Area
Type ofFacility
MapNo. Name of Facility Location
Fire Stations F1 Fire Station #39 14415 Sylvan StreetF2 Fire Station #60 5320 Tujunga AvenueF3 Fire Station #72 6811 De Soto AvenueF4 Fire Station #73 7419 Reseda BoulevardF5 Fire Station #83 5001 Balboa BoulevardF6 Fire Station #84 5340 Canoga AvenueF7 Fire Station #86 4305 Vineland AvenueF8 Fire Station #88 5101 North Sepulveda BoulevardF9 Fire Station #89 7063 Laurel Canyon Boulevard
F10 Fire Station #93 19059 Ventura BoulevardF11 Fire Station #100 6751 Louise AvenueF12 Fire Station #102 13200 Burbank BoulevardF13 Fire Station #105 6345 Fallbrook Avenue
Police Stations PS1 North Hollywood Police Station 11640 Burbank BoulevardPS2 Van Nuys Police Station 6240 Sylmar AvenuePS3 West Valley Police Station 19020 Vanowen Street
Schools S1 Adat Ari El Day School 12020 Burbank BoulevardS2 Birmingham High School 17000 Hayes StreetS3 Burbank Boulevard Elementary 12215 Albers StreetS4 Calvert Elementary 19850 Delano StreetS6 Colfax Avenue Elementary 11724 Addison StreetS7 Country School 5243 Laurel Canyon BoulevardS8 Emek Hebrew Academy Pre-School 12732 Chandler BoulevardS9 Emelita Elementary School 17931 Hatteras Street
S10 French American School 5657 Lindley AvenueS11 Independence Continuation School 6501 Balboa BoulevardS12 Kadima Hebrew Academy 5717 Rudnick AvenueS13 Lankershim Elementary 5250 Bakman AvenueS14 Laurel Hall School 6020 Radford AvenueS15 Lindley Avenue Baptist School 5901 Lindley AvenueS16 Los Angeles Valley College 5800 Fulton AvenueS17 Monlux Elementary 6051 Bellaire AvenueS18 Mullholland Middle School 17120 Vanowen StreetS19 North Hollywood Christian School 5616 Farmdale AvenueS20 North Hollywood High School 5231 Colfax AvenueS21 Oakwood Secondary Private High
School11600 Magnolia Boulevard
S22 Pierce College 6201 Winnetka AvenueS23 Pinecrest School 5975 Shoup AvenueS24 Pixieland School and Kindergarten 5944 Woodman AvenueS25 Valley Hillel School Corner of Chandler and Alcove AvenueS26 Reseda High School 18230 Kittridge StreetS27 Saint Paul's First Lutheran School 11330 McCormick StreetS28 Sherman Oaks Center for Enriched
Studies School of Choice18605 Erwin Street
S29 Stone Ridge Preparatory School 5955 Lindley AvenueS30 Sylvan Park Elementary 6238 Noble AvenueS31 Tarzana Elementary 5726 Topeka DriveS32 Ulysses Grant High School 13000 Oxnard StreetS33 Valley Alternative School of Choice 6701 Balboa BoulevardS34 Van Nuys Senior High School 6535 Cedros AvenueS35 Vanalden Elementary 19019 Delano Street
Community Facilities and Services
page 4-108
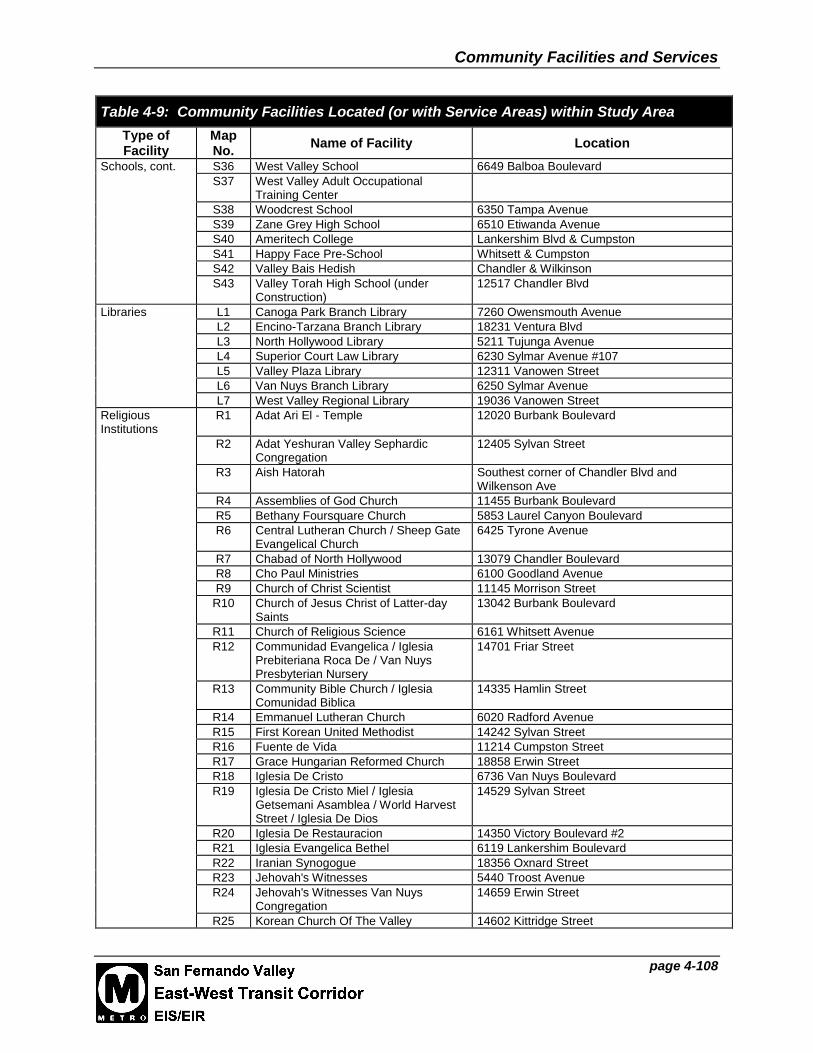
Table 4-9: Community Facilities Located (or with Service Areas) within Study Area
Type ofFacility
MapNo. Name of Facility Location
Schools, cont. S36 West Valley School 6649 Balboa BoulevardS37 West Valley Adult Occupational
Training CenterS38 Woodcrest School 6350 Tampa AvenueS39 Zane Grey High School 6510 Etiwanda AvenueS40 Ameritech College Lankershim Blvd & CumpstonS41 Happy Face Pre-School Whitsett & CumpstonS42 Valley Bais Hedish Chandler & WilkinsonS43 Valley Torah High School (under
Construction)12517 Chandler Blvd
Libraries L1 Canoga Park Branch Library 7260 Owensmouth AvenueL2 Encino-Tarzana Branch Library 18231 Ventura BlvdL3 North Hollywood Library 5211 Tujunga AvenueL4 Superior Court Law Library 6230 Sylmar Avenue #107L5 Valley Plaza Library 12311 Vanowen StreetL6 Van Nuys Branch Library 6250 Sylmar AvenueL7 West Valley Regional Library 19036 Vanowen Street
ReligiousInstitutions
R1 Adat Ari El - Temple 12020 Burbank Boulevard
R2 Adat Yeshuran Valley SephardicCongregation
12405 Sylvan Street
R3 Aish Hatorah Southest corner of Chandler Blvd andWilkenson Ave
R4 Assemblies of God Church 11455 Burbank BoulevardR5 Bethany Foursquare Church 5853 Laurel Canyon BoulevardR6 Central Lutheran Church / Sheep Gate
Evangelical Church6425 Tyrone Avenue
R7 Chabad of North Hollywood 13079 Chandler BoulevardR8 Cho Paul Ministries 6100 Goodland AvenueR9 Church of Christ Scientist 11145 Morrison Street
R10 Church of Jesus Christ of Latter-daySaints
13042 Burbank Boulevard
R11 Church of Religious Science 6161 Whitsett AvenueR12 Communidad Evangelica / Iglesia
Prebiteriana Roca De / Van NuysPresbyterian Nursery
14701 Friar Street
R13 Community Bible Church / IglesiaComunidad Biblica
14335 Hamlin Street
R14 Emmanuel Lutheran Church 6020 Radford AvenueR15 First Korean United Methodist 14242 Sylvan StreetR16 Fuente de Vida 11214 Cumpston StreetR17 Grace Hungarian Reformed Church 18858 Erwin StreetR18 Iglesia De Cristo 6736 Van Nuys BoulevardR19 Iglesia De Cristo Miel / Iglesia
Getsemani Asamblea / World HarvestStreet / Iglesia De Dios
14529 Sylvan Street
R20 Iglesia De Restauracion 14350 Victory Boulevard #2R21 Iglesia Evangelica Bethel 6119 Lankershim BoulevardR22 Iranian Synogogue 18356 Oxnard StreetR23 Jehovah's Witnesses 5440 Troost AvenueR24 Jehovah's Witnesses Van Nuys
Congregation14659 Erwin Street
R25 Korean Church Of The Valley 14602 Kittridge Street

Community Facilities and Services
page 4-109
Table 4-9: Community Facilities Located (or with Service Areas) within Study Area
Type ofFacility
MapNo. Name of Facility Location
ReligiousInstitutions, cont.
R26 Kosher Information Bureau KosherHotline
12753 Chandler Boulevard
R27 Mission Evangelica Hispana 14528 1/2 Hamlin StreetR28 Namaste Interfaith Center 6020 1/2 Woodman AvenueR29 Ohel Rachel Synagogue 18750 Oxnard StreetR30 Ohr Hatorah Synagogue 12410 Burbank BoulevardR31 Ohr Simcha Congregation 12436 Oxnard StreetR32 Redeemer Orthodox Presbyterian/
St. Mary Assyrian Church5955 Lindley Avenue
R33 Salvation Army 14917 Victory BoulevardR34 Shaarey Zedek Congregation 12800 Chandler Boulevard
R34a St. David’s Church 11605 Magnolia Avenue
R34b David Familian Chapel Laurel Canyon BoulevardR35 St. John's Lutheran Church 6220 Corbin AvenueR36 Summit Lighthouse Study Group 14549 Archwood StreetR37 Tara Center 6536 Sepulveda Boulevard #4R38 Tarzana Baptist Chapel 5701 Topeka DriveR39 Trinity Chapel/Fountain Spring
Foursquare Church18730 Erwin Street
R40 United Pentacostal Church/Iglesia deDios 7 Dia Buenas Nuevas
6150 Tyrone Avenue
R41 Valley Baptist Church/ Lindley Church& Academy
5901 Lindley Avenue
R41a Valley Jewish Learning Center 12800 Chandler Boulevard
R42 Van Nuys First Korean UnitedMethodist Church Korean UnitedMethodist
6260 Tyrone Avenue
R43 Van Nuys Korean United MethodistChurch
14255 Erwin Street
R44 Victory Center Church of Christ 6226 Colfax AvenueR45 Valley Cities Jewish Community Center 13164 Burbank Boulevard
R46 Familian Family Chapel Laurel Canyon Blvd & Albers St
R47 Toras Hashem Chandler Blvd & Whitsett
R48 Yad Avraham (under construction) Chandler Blvd & Whitsett
Health CareFacilities
H1 Chandler Convalescent Hospital andResidential Care Facility
5335 Laurel Canyon Boulevard
H2 Crossroads School 6305 Woodman Avenue / 6843 Lennox AveH3 H.E.L.P. Group 13130 Burbank BoulevardH4 Hollywood Community Hospital of Van
Nuys14433 Emmelita Street
H5 Laurelwood Convalescent Hospital 13000 Victory BoulevardH5a Laurel Canyon Retirement Community 5527 Laurel Canyon Boulevard
H5b Royal Bellingham Retirement Home 12229 Chandler BoulevardH6 Kaiser Foundation Hospital-
Woodland Hills5601 De Soto Avenue
H7 Encino-Tarzana Regional MedicalCenter
18321 Clark Street

Community Facilities and Services
page 4-110
Table 4-9: Community Facilities Located (or with Service Areas) within Study Area
Type ofFacility
MapNo. Name of Facility Location
Parks orRecreationalFacilities
P1 North Hollywood Park / RecreationCenter
5301 Tujunga Avenue
P2 Valley Plaza Park 12200 Erwin StreetP3 Erwin Park 13100 Erwin StreetP4 Delano Park 15100 Erwin StreetP5 Van Nuys Golf Course 6550 Odessa AvenueP6 Reseda Park / Recreation Center 18411 Victory BoulevardP7 Warner Ranch Park 5800 Topanga Canyon BoulevardP8 Sepulveda Basin Recreation Area and
Wildlife Reserve6100 Woodley Avenue
P9 Sepulveda Basin Cricket Fields 6300 Woodley AvenueP10 Japanese Gardens 6300 Woodley AvenueP11 Woodley Avenue Park 6350 Woodley AvenueP12 Woodley Lakes Golf Course 6331 Woodley AvenueP13 Anthony C. Beilensen (Lake Balboa)
Park6200 Balboa Boulevard
P14 Little League Complex 17000 Oxnard StreetSource: Myra L. Frank & Associates, Inc., 2000.
• Fire Station 3914415 Sylvan StreetVan Nuys
• Fire Station 885101 Sepulveda BoulevardSherman Oaks
• Fire Station 835001 Balboa BoulevardEncino
• Fire Station 1006751 Louise AvenueVan Nuys
• Fire Station 737419 Reseda BoulevardReseda
• Fire Station 9319059 Ventura BoulevardTarzana
• Fire Station 726811 De Soto AvenueWarner Center
Community Facilities and Services
page 4-111
• Fire Station 845340 Canoga AvenueWarner Center
• Fire Station 1056345 Fallbrook AvenueWoodland Hills
4-4.1.2 Schools and Libraries
The Los Angeles Unified School District (LAUSD) serves the City of Los Angeles, all orportions of 16 other cities in Los Angeles County, and numerous unincorporated areassurrounding the City of Los Angeles, comprising an area of approximately 700 square miles.
As of Fall of 1999, LAUSD’s total K-12 enrollment was an estimated 711,187 students.Approximately 41 percent attended the middle/junior and high school levels, and 8 percentattended magnet schools and centers throughout the District (See Table 4-10).
Table 4-10: LAUSD K-12 Enrollment, Fiscal Year 1999/2000
Grade Level 1999/2000Enrollment
Percent ofTotal
Senior High School 151,030 21%
Middle Schools 139,249 20%
Elementary School 363,029 51%
Magnet Schools, Centers, and Other Facilities 57,879 8%
Total (K-12) Enrollment 711,187 100%
Source: LAUSD Enrollment Statistics, 1999/2000
The schools, public and private, located within ¼ mile of the proposed bus alternatives andalignments are listed in Table 4-9. The TSM, BRT, and MOS would be adjacent to two LAUSDschools (North Hollywood and Birmingham High Schools) and three six non-LAUSD schools(Emek Hebrew Academy, Los Angeles Valley College, and Pierce College, Woodcrest School,Valley Torah High School, and Valley Hillel School). The Lankershim/Oxnard On-StreetAlignment would be adjacent to two LAUSD schools (Ulysses Grant High School andBirmingham High School) and three non-LAUSD schools (Laurel Hall School, Los AngelesValley College, and Pierce College).
Libraries in the vicinity of the proposed alternatives and alignments are managed by the EastValley and West Valley regional offices of the Los Angeles Public Library. One library, theVan Nuys Branch Library at 6250 Sylmar Avenue, is located approximately 0.3 miles from theproposed bus alignments. The North Hollywood Regional Library at 5211 Tujunga Avenue, islocated approximately 0.2 miles from the proposed bus alignments.

Community Facilities and Services
page 4-112
4-4.1.3 Parks and Recreational Facilities
A total of 14 parks or recreational facilities are located within the study area (See Table 4-9).Nearly all of these facilities are operated by the City of Los Angeles Department of Recreationand Parks. The Sepulveda Basin Wildlife Reserve is managed by the City of Los AngelesDepartment of Recreation and Parks with the assistance of an advisory board composed ofrepresentatives of the Audubon Society, Canada Goose Project, California Native Plant Society,Friends of the L.A. River, Resource Conservation District of the Santa Monica Mountains, andSierra Club.
The City of Los Angeles Bike Plan (1996) identifies a total of fifteen existing or plannedbikeways located in the study area. The bikeways are a part of the transportation system, but arealso assumed to serve a recreational purpose.
Additional information on parks and recreational facilities is provided in Section 4-15 (DraftSection 4(f) Evaluation).
4-4.2 Impact Analysis Methodology and Evaluation Criteria
Community facilities and services adjacent to each alternative of the project were identifiedduring field surveys using conceptual engineering plans. The locations and types of facilitiesadjacent to the proposed alternatives and alignments were mapped and tabulated, and aqualitative assessment of the project’s impact to each facility was made. The potential impactsresulting from the project would vary depending upon the characteristics and proximity of thealternative or alignment selected. These impacts would be considered adverse impacts underNEPA (significant impacts under CEQA) if: (1) community service facilities were to beacquired or (2) the use of facilities would be substantially impaired as a result of impacts such asnoise, air quality, safety, or impaired access.
Facilities that are within private residences or that do not provide public signage are not listed.However, it is recognized that many facilities exist within the ¼-mile study area and these aresubject to the same impacts as the listed facilities. The same mitigation measures apply to allfacilities and services.
4-4.3 Impacts on Community Facilities and Services
4-4.3.1 Fire and Police Protection
Potential impacts to police and fire protection services from the proposed build alternativeswould be related to the effects of traffic and access disruptions on emergency response time, andthe demand for additional services.
The response time for emergency services depends in part on the distance from police and firestations to the areas served. The LAFD’s minimum distance criteria for availability of first-due

Community Facilities and Services
page 4-113
emergency fire response is 0.75 mile for an engine company and 1 mile for a truck company.The fire stations identified in the vicinity of the proposed project are within this range and areevenly distributed along the length of the study area.
Traffic congestion on local streets, particularly at intersections, may also affect emergencyresponse times. The LAFD considers intersections that operate at level of service (LOS) E or F(i.e., 90 percent of capacity or greater) as limiting factors on fire protection and emergencyservices. According to traffic analyses of the proposed project, 13 of 53 intersections studiedwould operate at LOS E or worse in 2020 under the No Build or TSM Alternative. For the FullBRT Alternative, a total of 17 of 53 study intersections would operate at LOS E or worse in2020. For the Lankershim/Oxnard On-Street Alignment, 17 of 53 study intersections wouldoperate at LOS E or worse in 2020. For the MOS, 14 of 53 study intersections would operate atLOS E or worse in 2020.
Potential access disruptions could also affect emergency response times. The TSM Alternativewould have no substantial effect on access to and from police and fire stations since the onlychange from existing conditions would an slight increase in the number and frequency of busesin mixed-flow traffic. For the build alternatives, two fire stations, Fire Station 60 and FireStation 102, are located immediately adjacent to portions of the SP MTA ROW that would beutilized for the full BRT Alternative. No police stations are located adjacent to any of the buildalternative alignments. Only incidental disruption to access in and out of these stations would belikely to occur in the rare event that buses were passing the station at the same time as anemergency call. In addition, station platforms and park and ride lots would be designed and sitedin a way that avoids conflicts between busway patrons’ access and emergency services’ access.These types of potential access disruptions would be further minimized through adequateplanning and consultation with the LAFD. There is a very low likelihood that emergencyservices’ access across the corridor would be substantially impaired once a busway isoperational. The buses would travel primarily on an exclusive right-of-way and, as describedmore fully in the transportation and traffic analysis in Chapter 3, would be subject to the samesignalized intersections at cross streets as is traffic on the parallel streets. Thus, the ability ofemergency service vehicles to cross the corridor should not be substantially different than atpresent.
Existing and planned service levels for fire protection and police protection are expected to beadequate with or without the proposed project.
4-4.3.2 Schools and Libraries
a. Schools
The TSM Alternative would result in an increase in the number of buses in service and would,thus, improve transit access to schools and libraries along the proposed bus routes. This wouldhave a beneficial effect.

Community Facilities and Services
page 4-114
The proposed BRT Alternative and alignments would not result in increased student enrollmentin the vicinity of the project, since it would not result in increased residential population. Thus,school student capacities would be unaffected by the project. However, other impacts may occurdue to the project’s proximity to individual schools along the proposed routes.
Schools located within ¼ mile of the proposed bus alternatives and alignment would have safetyconcerns for students walking to and from school. These safety issues, and schools affected bythe project, are addressed in Section 4-13 Safety and Security.
As discussed in Section 4-9, potential noise impacts could occur at schools adjacent to theproposed bus alternatives and alignments due to buses being located at-grade. The TSMAlternative would add buses in mixed-flow traffic on many arterials in the street system, whichwould marginally increase noise levels at some schools. With regard to North Hollywood HighSchool, Birmingham High School, Los Angeles Valley College, and Emek Hebrew Academy,under the BRT Alternative, it is projected that a minor impact (on the order of a one decibelincrease–not requiring mitigation) would be experienced at North Hollywood High School andEmek Hebrew Academy, that no impact would be experienced at Birmingham High School, andthat no impact would be experienced after mitigation at Valley College. (At Valley Collegethere would likely not be an impact on classrooms due to sufficient separation distances, butsoundwall noise barriers are proposed on the diagonal portion of the corridor to mitigate noiseimpacts on adjacent homes.) The Lankershim/Oxnard On-Street Alignment would result in onlya marginal increase in noise levels (see Section 4-2) at adjacent schools. The MOS alignmentwould not affect noise at adjacent schools.
Accessibility to schools within ¼ mile of the proposed alternatives and alignments would beimproved due to the new transit routes.
TSM Alternative
The TSM alternative would utilize existing bus stops and accessibility to adjacent schools wouldincrease due to the increased transit service under this alternative. Students who need to walk acertain distance from the nearest bus stop would continue to use the same intersection crossings.The TSM alternative would have no adverse impacts under NEPA (significant impacts underCEQA) on access to these schools.
BRT Alternative
The BRT alternative would be adjacent to the following schools:
• Pierce College at 6201 Winnetka Avenue
• Birmingham High School at 17000 Hayes Street
• Los Angeles Valley College at 5800 Fulton Avenue
• Emek Hebrew Academy at 12732 Chandler Boulevard
• North Hollywood High School at 5231 Colfax Avenue

Community Facilities and Services
page 4-115
• Woodcrest School at 6350 Tampa Avenue
• Valley Torah High School at 12517 Chandler Boulevard
• Valley Hillel School at corner of Chandler Boulevard and Alcove Avenue
Pierce College students using the BRT would have a bus stop at either Mason Avenue orWinnetka Avenue and would gain access to the college across the Victory Boulevard and MasonAvenue intersection or the Victory Boulevard and Winnetka Avenue intersection. Studentswalking to or from the college from north of Victory Boulevard would have to cross the BRTcorridor at either Mason Avenue or Winnetka Avenue. Mason Avenue and Winnetka Avenueare the only existing cross streets for pedestrian access to Pierce College and, therefore, walkingdistances would not be lengthened for the community college students.
Birmingham High School students utilizing the BRT would have a bus stop at the BalboaBoulevard and Victory Boulevard intersection (south side of Victory Boulevard) and studentswould access the school via this intersection crossing. Students walking to or from the southside of Victory Boulevard would need to walk across the BRT corridor on Balboa Boulevard andthen across the Victory Boulevard and Balboa Boulevard intersection. This would notsubstantially lengthen walking time to and from the school and would not have an adverseimpact under NEPA (significant impact under CEQA).
Students of Los Angeles Valley College arriving from the west utilizing the BRT would have abus stop on the southeast corner of Burbank Boulevard and Fulton Avenue. Students arrivingfrom the east would have a bus stop on the northwest corner of Burbank and Fulton Avenue.Students would cross the corridor at the Burbank Boulevard and Fulton Avenue intersection.This would not substantially lengthen walking distances and, therefore, would have no adverseimpacts under NEPA (significant impacts under CEQA) on student accessibility.
Emek Hebrew Academy Pre-School is located on the south side of Chandler Boulevard, east ofColdwater Canyon Avenue. Parents walking from the north side of Chandler Boulevard to pickup or drop off their pre-school children could walk to Coldwater Canyon Avenue or BellaireAvenue to cross the alignment, or could use a new mid-block crossing at Goodland Avenue,which would improve access. These cross streets are currently the only signalized pedestriancrossings over Chandler Boulevard from the north and are used presently by parents with theirchildren. In addition, new pedestrian pathways will be provided in areas where there arepresently no sidewalks, thereby improving access for students. These pedestrian pathwayswould be provided on the north side of the busway in the median from Bellaire Avenue toGoodland Avenue, on the south side of the busway in the median from Coldwater CanyonAvenue to Ethel Avenue, and on the north side of Chandler Boulevard adjacent to the Chabad.The BRT would not create any additional blockages to the pre-school; therefore, walkingdistances would not be lengthened and no impacts to school access would result.
North Hollywood High School students using the BRT would depart at the Laurel Canyon busstop, cross the corridor at Laurel Canyon Boulevard, and walk ½ mile east to the school.Students walking to the high school from the north side of Chandler Boulevard would need towalk to Laurel Canyon Boulevard or Colfax Avenue to cross the corridor. Laurel CanyonBoulevard and Colfax Avenue are the existing pedestrian crossings to the high school, and
Community Facilities and Services
page 4-116
therefore, the BRT would not lengthen walking distances to gain access to North HollywoodHigh School, and consequently the project would have no adverse impacts under NEPA(significant impacts under CEQA) on student accessibility.
Woodcrest School students using the BRT would have a bus stop at Tampa Avenue and wouldgain access to the school across the Tampa Avenue and Topham Street intersection. Studentswalking to or from the school from north of Topham Street would have to cross the BRTcorridor at Tampa Avenue. Walking distances would not be lengthened for these students.
Valley Torah High School students using the BRT would have a bus stop at Laurel CanyonBoulevard and would gain access to the high school by crossing the BRT corridor at LaurelCanyon Boulevard and then travelling west along the south side of Chandler Boulevard.Students walking to or from the high school would have to cross the BRT corridor at WhitsettAvenue and then travel west one block to the high school. Walking distances would not belengthened for these students.
Valley Hillel School students using the BRT would have a bus stop at Laurel Canyon Boulevardand would gain access to the school by crossing the BRT corridor at Laurel Canyon Boulevardand then travelling west along the south side of Chandler Boulevard. Students walking to orfrom the school would have to cross the BRT corridor at Coldwater Canyon Avenue and thentravel east one block to the school. Walking distances would not be lengthened for thesestudents.
Lankershim/Oxnard On-Street Alignment
The Lankershim/Oxnard On-Street segment of the alignment would consist of three bus on-streetstops: (1) Metro Red Line North Hollywood Station (2 1) Oxnard Street and Laurel CanyonBoulevard, and (3 2) Oxnard Street and Fulton Avenue, and Woodman Avenue and OxnardStreet. The Fulton Avenue/Oxnard stop is immediately adjacent to Los Angeles Valley Collegeand within ¼ mile of Ulysses Grant High School. Students using this transportation route wouldutilize intersection crossings at Fulton Avenue or Coldwater Canyon Avenue to cross the transitcorridor, which are currently the closest pedestrian crossings to both schools. Access would beimproved to the Laurel Hall School, located on Oxnard Boulevard at Radford Avenue. Walkingdistances would not be substantially increased and therefore the BRT would not have an adverseimpact under NEPA (significant impact under CEQA) on these schools. The remainder of theBRT Alignment would have effects identical to those discussed above.
MOS
The MOS alignment would be adjacent to one school: Birmingham High School at 17000 HayesStreet. Birmingham High School students utilizing the MOS would have a bus stop at theBalboa Boulevard and Victory Boulevard intersection (south side of Victory Boulevard).Students would reach the school via the intersection crossing. Students walking to or from thesouth side of Victory Boulevard would need to walk across the MOS corridor on BalboaBoulevard an then across the Victory Boulevard and Balboa Boulevard intersection. This would

Community Facilities and Services
page 4-117
not substantially lengthen walking time to and from the school and would not have an adverseimpact under NEPA (significant impact under CEQA).
b. Libraries
Eight libraries are located (or have service areas) within ¼ mile of the proposed alternatives oralignments. None of the libraries are located immediately adjacent to any of the alternatives oralignments, and therefore, there would be no adverse effect under NEPA (significant effect underCEQA) on access to the libraries. However, transit access to the North Hollywood Library, VanNuys Branch Library, and the Superior Court Library (see Figure 4-27) would be improved bythe BRT Alternative and the Lankershim/Oxnard On-Street Alignment, and therefore beneficialeffects would result.
4-4.3.3 Religious Institutions
The TSM Alternative would result in an increase in transit service and would, thus, improvetransit access to most religious institutions along the proposed bus routes. No adverse impactsunder NEPA (significant impacts under CEQA) would be associated with the increased service.
Religious institutions adjacent to the BRT alternative include:
• St. John’s Lutheran Church at 6220 Corbin Avenue• Aish Hatorah at Southeast corner of Chandler Boulevard and Wilkenson Avenue• Chabad of North Hollywood at 13079 Chandler Boulevard• Jehovah’s Witnesses at 5440 Troost Avenue• Shaarey Zedek Congregation at 12800 Chandler Boulevard• Ohel Rachel Synagogue at 18750 Oxnard Street• Iranian Synagogue at 18356 Oxnard Street• Namaste Interfaith Center at 6020½ Woodman Avenue• Yad Avraham Sephardic Synagogue at Chandler Boulevard and Whitsett Avenue• Valley Jewish Learning Center at 12800 Chandler Boulevard
St. John’s Lutheran Church at 6220 Corbin Avenue and Jehovah’s Witnesses at 5440 TroostAvenue are both located along streets where the bus corridor would be located on the oppositeside of the roadway. The corridor would not interfere with accessibility to the religiousinstitution, and could result in beneficial transit access. Therefore, these institutions would notexperience adverse impacts under NEPA (significant impacts under CEQA) as a result of theBRT alternative.
Chabad of North Hollywood would potentially be a full acquisition under the BRT alternativeand, therefore, impacts on this facility (under this alternative) are not addressed. For detailedinformation regarding acquisitions please see Section 4-2. Currently, there are no sidewalksnorth and south of Chandler Boulevard near the Chabad of North Hollywood. Pedestrian accessto the Chabad of North Hollywood would be improved as a new sidewalk would be constructedon the north side of North Chandler Boulevard adjacent to the Chabad and a new pedestrian pathwould be constructed in the median from Ethel Avenue to Coldwater Canyon Avenue.Pedestrians would continue to cross the MTA ROW at Ethel and Coldwater Canyon Avenues.
Community Facilities and Services
page 4-118
Walking time to and from the Chabad would not be substantially increased and therefore therewould not be a significant impact under CEQA (adverse impact under NEPA) on access.
Pedestrian access to Aish Hatorah and Shaarey Zedek Congregation are of particular concern tothe people along this segment of the BRT. Due to particular aspects of their religious faith,community members who attend these facilities would be able to utilize two new mid-blockaccess routes (see Section 4-13 for detailed descriptions) that cross Chandler Boulevard (east andwest bound) and the BRT corridor. These mid-block crossings would be placed at GoodlandAvenue and Agnes Avenue. These crossings would provide two additional crossings for thecommunities north and south of Chandler Boulevard. Persons walking from the north side ofChandler Boulevard to Aish Hatorah or Shaarey Zedek Congregation would need to walk to across street between Coldwater Canyon Boulevard and Laurel Canyon Boulevard or use one ofthe two mid-block crossings. This would not substantially lengthen walking time to and fromthese institutions and therefore would not have an adverse impact under NEPA (significantimpact under CEQA) on access. Members of Ohel Rachel Synagogue and the IranianSynagogue walking to the religious institutions from the north side of Oxnard Street would needto walk to Reseda Boulevard to cross the bus corridor. Reseda Boulevard is currently thepedestrian crossing closest to both synagogues, therefore, walking distances would not belengthened as a result of the BRT and consequently these religious facilities would experience noadverse impacts under NEPA (significant impacts under CEQA).
The Lankershim/Oxnard On-Street Alignment portion of the BRT would be adjacent to tworeligious institutions: St. John’s Lutheran Church at 6220 Corbin Avenue and the EmmanuelLutheran Church at 6060 Radford Avenue. St. John’s Church is located on the south side ofTopham Street, and the bus corridor is on north side. Therefore, the corridor would not blockaccess to the church, and would actually increase transit access for those seeking to attend thefacility. The Emmanuel Lutheran Church would be located along the On-Street segment of thetransit way and would potentially benefit from the transit access. Both institutions wereidentified by the noise analysis as having no impacts from the proposed alignment (see Section4-9, Noise and Vibration).
The exclusive right-of-way portion of the MOS alignment would not be located immediatelyadjacent to any religious institutions, and therefore, no adverse impacts under NEPA (significantimpacts under CEQA) would be associated with the increased service.
4-4.3.4 Health Care Facilities
The TSM Alternative would result in an increase in transit service and would, thus, improvetransit access to health care facilities along proposed bus routes. No adverse impacts underNEPA (significant impacts under CEQA) would be associated with the increased service.
The proposed alternatives and alignments (BRT, MOS, and Lankershim/Oxnard On-Street)would improve transit access and benefit health care facilities located in the vicinity of thealignment. Convalescent hospitals such as the Chandler Convalescent Hospital and ResidentialCare Facility and the Laurelwood Convalescent Hospital would particularly profit from thenearby transit facilities. since a large number of the persons served by these hospitals may not becapable of driving. Staff members and volunteers would have access to a convenient

Community Facilities and Services
page 4-119
transportation line to work and visitors (some of whom may not be able to drive) would have ameans to travel to the hospitals and care facilities to see friends and/or family.
The BRT Alternative and Lankershim/Oxnard On-Street Alignment would be adjacent to theTarzana Treatment Center at 18646 Oxnard Street. The bus corridor is located on the north sideof Oxnard Street and the Tarzana Treatment Center is located on the south side of the roadway.The bus corridor would not interfere with access to the facility and therefore no adverse impactsunder NEPA (significant impacts under CEQA) would result.
The exclusive right-of-way portion of the MOS alignment is not adjacent to a hospital or healthcare facility and is not expected to result in adverse impacts under NEPA (significant impactsunder CEQA).
Though there are no hospitals within the ¼ mile vicinity of the proposed alternatives oralignments, many of them do exist and provide services to the community. Due to the hospitaldistances from the alternatives or alignments and the availability of alternative streets (inemergency rescue situations) no adverse impacts under NEPA (significant impacts under CEQA)to emergency vehicle access or vehicular access to the hospitals are expected. Additionally, thehospitals are located far enough away from any of the proposed routes that there would be noadverse noise impacts under NEPA (significant noise impacts under CEQA) on the hospitals.
4-4.3.5 Parks and Recreational Facilities
No parks or recreational facilities or portions thereof would be acquired under any of thealternatives.
The TSM Alternative would add to the number of buses in service and would, therefore, improvetransit access to parks and recreational facilities. This would be considered a beneficial effect.
The BRT Alternative, including the Lankershim/Oxnard On-Street Alignment and the MOS,would also provide improved transit access to parks and recreational facilities. Pedestrian andautomobile access to parks and recreational facilities should not be negatively affected since nobusway improvements (e.g., station platforms, park and ride lots) would obstruct the points ofaccess to and from these facilities.
Although several parks and recreational facilities (e.g., North Hollywood Park/RecreationCenter, Sepulveda Basin facilities) would be located adjacent to a busway alignment, nonewould experience adverse indirect impacts under NEPA (significant indirect impacts underCEQA) with respect to noise, vibration, air quality, or visual impacts. Potential proximityimpacts at each facility are described more fully in Section 4-15 (Draft Section 4(f) Evaluation).
Existing and planned capacity and service levels for parks and recreational facilities are expectedto be adequate with or without the proposed project.

Community Facilities and Services
page 4-120
4-4.4 Mitigation Measures
Under the BRT alternative, as previously discussed, pedestrian accessibility to religiousinstitutions would not be reduced along Chandler Boulevard, due to new mid-block crossingsand pedestrian paths that would be incorporated into the project design. Under all of thealternatives and alignments, pedestrian safety would be maintained at intersections and/orcorridor crossings by installing fencing, proper signalization, pedestrian gates, and signage (seeChapter 2). Other safety measures are discussed in Section 4-13. Mitigation measures for noiseimpacts, discussed in Section 4-9, would reduce noise impacts to below the levels ofsignificance. No other mitigation is required.

Fiscal and Economic Conditions
page 4-121
4-5 4-5 4-5 4-5 FISCAL AND ECONOMIC CONDITIONS
4-5.1 Setting
a. Introduction
The setting describes baseline fiscal and economic conditions (i.e., local and regionalemployment levels and property tax revenues) by which the project alternatives are assessed inthe impacts section. Data for the setting were obtained from the Southern California Associationof Governments (SCAG), County and City of Los Angeles, U.S. Census Bureau, and the StateBoard of Equalization.
b. Employment and Economic Activity
Regional Economy
The study area for the San Fernando Valley East-West Transit Corridor is a part of the largerSouthern California Association of Governments region (SCAG region) which encompasses LosAngeles, Orange, Imperial, Riverside, San Bernardino, and Ventura counties. However, most ofthe economic effects (e.g. property tax revenue losses) of the project would occur within the Cityof Los Angeles where the project would be located.
The SCAG region experienced a loss of 466,000 jobs during the 1990-1993 recession. However,since its lowest level in the first quarter of 1994, total payroll employment in the region hasrisen. In 1998, there were an estimated 6,368,600 jobs in the Southern California basin, anincrease of 555,300 jobs, or 9.6 percent.4
This tourism and entertainment industry has been especially strong in the SCAG region. Whileall other major industry groups lost jobs during the 1990-1993 recession, the tourism andentertainment industry actually gained jobs during this period. The only other industry thatrivals the tourism and entertainment industry in economic strength is the transportation andwholesale trade industry, which has recovered to well above its pre-recession levels (see Table4-11).
Employment in the Los Angeles metro area also increased, although not as rapidly as in theSCAG region as a whole. In 1994, there were approximately 3,701,900 non-agricultural wageand salary jobs in the Los Angeles metro area, and by 1998 there were 3,946,700 jobs, a totalincrease of 6.6 percent.5
4 New Solutions for a New Economic Environment, SCAG 2000.5 Ibid.

Fiscal and Economic Conditions
page 4-122
Table 4-11: SCAG Region Jobs by Major Industry Group
1990 1994 1998
Professional Services 570,700 497,700 526,600
Diversified Manufacturing 797,300 706,000 796,700
Transportation & Wholesale Trade 567,800 519,500 588,400
Tourism & Entertainment 254,500 261,100 311,900
Defense Related 290,200 170,700 155,800
Resource Based 87,400 80,500 71,700
High Technology Manufacturing 127,300 100,300 107,700
Total 2,695,200 2,318,100 2,558,800
Source: SCAG, 2000.
SCAG anticipates that employment in the City of Los Angeles as well as in the project studyarea will continue to grow at an even faster rate than the metro area has in the past few years. Asshown in Table 4-12, employment in the City of Los Angeles is expected to increase 30 percentbetween 1994 and 2020, and employment in the East and West Valleys to increase 42 and 22percent respectively in the same time period.
Table 4-12: Employment, 1994-2020
1994-2020 ChangeJurisdiction 1994 2020
Absolute %
City of Los Angeles 1,705,100 2,209,300 504,200 30
East Valley 94,043 133,879 39,836 42
West Valley 44,897 47,816 2,919 22
Source: SCAG, 2000.
Local Economy
The local community directly affected by the project would be the San Fernando Valley in theCity of Los Angeles. The proposed San Fernando Valley East-West Transit Corridor wouldconnect major activity centers that include the North Hollywood Business District, ValleyGovernment Center in Van Nuys, Universal City, Valley College, the Sepulveda BasinRecreation Area, Pierce College, and Warner Center. In addition, the East-West Transit Corridorwould provide connections to the Los Angeles central business district and other points on theMetro Rail, Metro Bus, and Metrolink systems throughout Los Angeles County.
In the 1980s, major employment centers were built in the Valley. While in recent years theValley has lost many high-paying, skilled jobs in the aerospace and defense industry, it stillretains a large, diversified economic base. Two major industries in the Valley are entertainmentand tourism, which support the Warner Brothers, Disney, and MCA/Universal movie studios.
Fiscal and Economic Conditions
page 4-123
By some accounts, approximately 70 percent of Los Angeles’ entertainment companies are basedin the Valley. Other leading employment areas in the Valley are service jobs in health, business,engineering, and wholesale trade.
c. Tax Sources & Revenues
This section describes the tax revenues generated in the County and City of Los Angeles. Thetax revenues addressed are property taxes, sales taxes, and business license fees.
Property Taxes
A small number of privately owned residential and non-residential properties adjacent to thebusway alignment would be acquired during construction activities. The affected properties arewithin the jurisdiction of the City and County of Los Angeles where property taxes are levied onthe assessed value of all privately owned property. The County levies property taxes atapproximately one percent of the assessed property value. The property tax revenues are put intoa county-wide pool and then apportioned on a percentage basis to the local jurisdictions (e.g.,county, cities, school districts, and special districts). In the fiscal year 1999-2000, Los AngelesCounty levied $5.42 billion in property taxes. The allocation of this revenue was approximately28 percent to the County, 17 percent to the cities, 46 percent to the school districts, and 9 percentto special districts6.
Sales Taxes
The gross receipts and sales tax revenues of individual businesses are confidential. Theprovisions of Section 21.17 of the Business Tax Ordinance, subject to certain exceptions, make itunlawful for the City to make known the business affairs, operations, or information required ofany person filing returns or paying taxes under the provisions of the Los Angeles MunicipalCode. It is possible to get information regarding groups of businesses from the CaliforniaDepartment of Finance (DOF). In this instance, the numbers of businesses whose operationswould be terminated (because of acquisition) by this project are so low (see Section 4-2.3.3) thatit is not possible to create a group query to DOF that would not identify an individual business.Consequently, sales tax losses because of displacements have not been estimated for this project.It is also highly likely that displaced businesses would relocate within the San Fernando Valleyand the City of Los Angeles, so actual business tax losses would be negligible.
Business License Fees
Section 3-1.2.2 of the Business Tax Ordinance states that the business affairs and operations ofindividual businesses are confidential and business taxes and payroll taxes cannot be madepublic. Thus, the loss in local business license fee revenues due to business disruptions andacquisitions by the project alternatives cannot be determined.
6 Based on an October 25, 2000 telephone conversation with the Los Angeles County Auditor Comptroller’s Office.
Fiscal and Economic Conditions
page 4-124
4-5.2 Impact Analysis Methodology and Evaluation Criteria
The impact section identifies the jobs generated for the operation of each alternative and thelosses in local jobs and property tax revenues due to property acquisitions (see Section 4-2,Acquisitions and Displacements, for further discussion of job losses). For purposes of thisenvironmental document, a loss of jobs in excess of 1 percent of area employment would beconsidered an adverse effect under NEPA (significant effect under CEQA). Property tax lossesin excess of 1 percent of the area tax base would be considered an adverse effect under NEPA(significant effect under CEQA).
4-5.3 Impacts on Fiscal & Economic Conditions
4-5.3.1 Employment & Economic Activity
a. Employment Loss
No Build Alternative
The No Build Alternative would not require any property acquisitions; therefore, no jobs wouldbe displaced, and there would be no adverse effect under NEPA (significant effect under CEQA)on the local and regional job supply.
Transportation System Management (TSM) Alternative
The TSM Alternative would not require any property acquisitions; therefore, no jobs would bedisplaced, and there would be no adverse effect under NEPA (significant effect under CEQA) onthe local and regional job supply.
Bus Rapid Transit (BRT) Alternative
The BRT Alternative would result in the potential acquisition of a number of businesses,including several restaurants, two car sales lots, an automobile repair shop, a cleaners, andseveral other miscellaneous businesses. Due to these acquisitions, the BRT Alternative wouldresult in the loss of approximately 66 53 jobs (see Section 4-2).
The Lankershim/Oxnard On-Street Alignment and the Minimum Operable Segment (MOS)would each result in potential acquisitions affecting five seven businesses and a religious center.Due to these acquisitions, both of these this options would result in the loss of approximately 2539 jobs (see Section 4-2).
The MOS would result in the displacement of two businesses with approximately 15 employees.Although the displacement would be potentially adverse under NEPA (potentially significantunder CEQA) to individual businesses, it would not have an adverse impact under NEPA(significant impact under CEQA) on the overall local and regional business climate because the

Fiscal and Economic Conditions
page 4-125
numbers of jobs to be displaced would be extremely small in comparison to the total jobs in theregion. As shown in Table 4-13, the job losses would be one-ten-thousandth of a percent or lessof the existing or future jobs in the City of Los Angeles or the East or West Valleys. Since a jobloss of less than 1 percent of the total jobs in an area is considered not significant, these joblosses would not have an adverse effect under NEPA (significant effect under CEQA) on thelocal or regional economy.
Table 4-13: Employment Loss Due to Property Acquisitions
Study AreaTotals Job Losses From Property Acquisitions
Job Loss as Percentage of TotalJobs in Jurisdiction
Jurisdiction1994 2020 No.
1994 2020
City of LosAngeles
1,705,100 2,209,300 <.0001% <.0001%
East Valley 94,043 133,879 <.001% <.001%Full BRT
West Valley 44,897 54,834
65
53.001% .001%
City of LosAngeles
1,705,100 2,209,300 <.0001% .00001%
East Valley 94,043 133,879 <.001% <.001%On-Street /
MOSWest Valley 44,897 54,834
25
39
<.001% <.001%
City of LosAngeles 1,705,100 2,209,300 <.0001% .00001%
East Valley 94,043 133,879 <.001% <.001%MOS
West Valley 44,897 54,834
15
<.001% <.001%
Source: SCAG, 2000; Myra L. Frank & Associates, 2000.
b. Employment Generated by Operation Expenditures
Operating expenditures generate direct (onsite and offsite) and indirect full-time equivalentemployment (FTE). Direct, onsite FTE figures for the TSM and BRT alternatives were providedby Los Angeles Metropolitan Transportation Authority (MTA) and its consultants. Direct,offsite FTE and indirect FTE were derived by multiplying the estimated maintenance andoperation costs by regional multipliers provided by the American Public Transit Association(APTA).
Direct, onsite FTE are the jobs generated to operate the bus system (e.g., bus drivers, roadsupervisors, maintenance workers, security personnel, and administrators and staff). Direct,offsite jobs are those jobs associated with the direct operation of the transit system and includeemployment in business services, insurance, motor vehicles, utilities, real estate, chemicals,petroleum/natural gas, and other industries. Indirect FTE jobs are the jobs required to supportthe direct employment and include employment in the service, restaurant, and hotel industries.
Fiscal and Economic Conditions
page 4-126
No Build Alternative
The No Build Alternative would not result in the creation of any jobs.
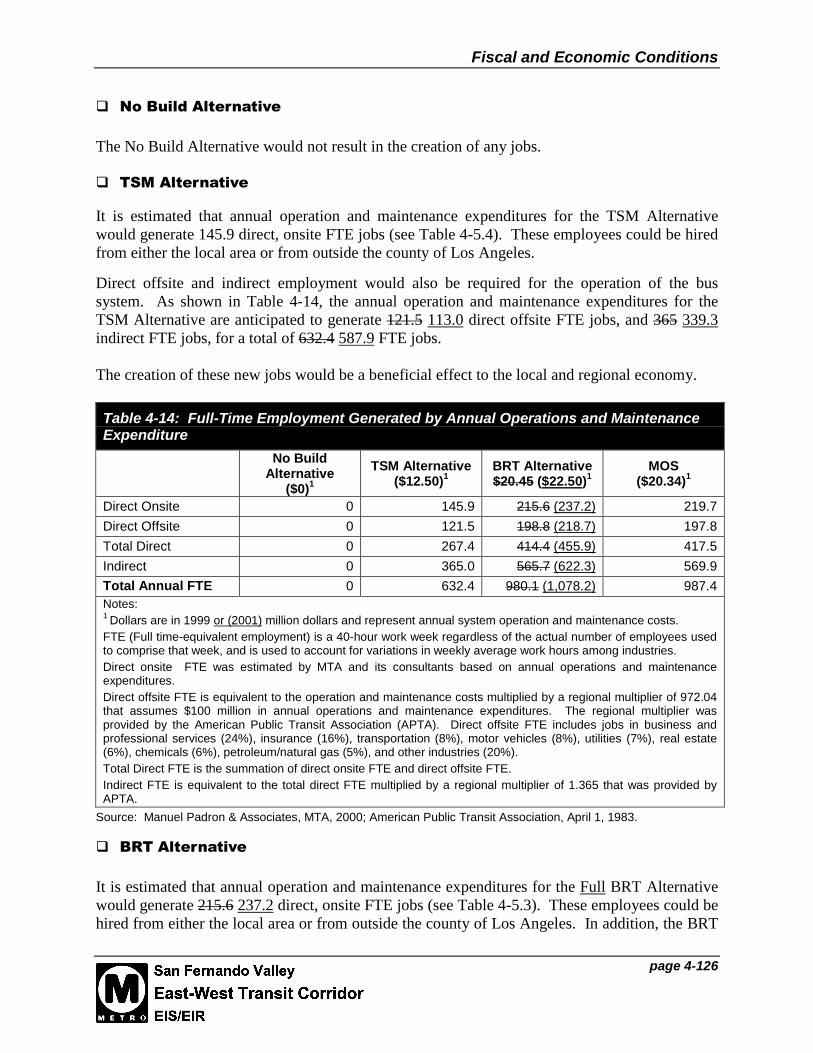
TSM Alternative
It is estimated that annual operation and maintenance expenditures for the TSM Alternativewould generate 145.9 direct, onsite FTE jobs (see Table 4-5.4). These employees could be hiredfrom either the local area or from outside the county of Los Angeles.
Direct offsite and indirect employment would also be required for the operation of the bussystem. As shown in Table 4-14, the annual operation and maintenance expenditures for theTSM Alternative are anticipated to generate 121.5 113.0 direct offsite FTE jobs, and 365 339.3indirect FTE jobs, for a total of 632.4 587.9 FTE jobs.
The creation of these new jobs would be a beneficial effect to the local and regional economy.
Table 4-14: Full-Time Employment Generated by Annual Operations and MaintenanceExpenditure
No BuildAlternative
($0)1
TSM Alternative($12.50)1
BRT Alternative$20.45 ($22.50)1
MOS($20.34)1
Direct Onsite 0 145.9 215.6 (237.2) 219.7
Direct Offsite 0 121.5 198.8 (218.7) 197.8
Total Direct 0 267.4 414.4 (455.9) 417.5
Indirect 0 365.0 565.7 (622.3) 569.9
Total Annual FTE 0 632.4 980.1 (1,078.2) 987.4Notes:1 Dollars are in 1999 or (2001) million dollars and represent annual system operation and maintenance costs.FTE (Full time-equivalent employment) is a 40-hour work week regardless of the actual number of employees usedto comprise that week, and is used to account for variations in weekly average work hours among industries.Direct onsite FTE was estimated by MTA and its consultants based on annual operations and maintenanceexpenditures.Direct offsite FTE is equivalent to the operation and maintenance costs multiplied by a regional multiplier of 972.04that assumes $100 million in annual operations and maintenance expenditures. The regional multiplier wasprovided by the American Public Transit Association (APTA). Direct offsite FTE includes jobs in business andprofessional services (24%), insurance (16%), transportation (8%), motor vehicles (8%), utilities (7%), real estate(6%), chemicals (6%), petroleum/natural gas (5%), and other industries (20%).Total Direct FTE is the summation of direct onsite FTE and direct offsite FTE.Indirect FTE is equivalent to the total direct FTE multiplied by a regional multiplier of 1.365 that was provided byAPTA.
Source: Manuel Padron & Associates, MTA, 2000; American Public Transit Association, April 1, 1983.
BRT Alternative
It is estimated that annual operation and maintenance expenditures for the Full BRT Alternativewould generate 215.6 237.2 direct, onsite FTE jobs (see Table 4-5.3). These employees could behired from either the local area or from outside the county of Los Angeles. In addition, the BRT

Fiscal and Economic Conditions
page 4-127
Alternative is anticipated to generate 198.8 218.7 direct offsite FTE jobs, and 565.7 622.3indirect FTE jobs, for a total of 980.1 1,078.2 FTE jobs.
The MOS option would create an approximately equivalent number of jobs. This option wouldgenerate 219.7 direct onsite FTE jobs, 197.8 direct offsite FTE jobs, and 569.9 indirect FTE jobs,for a total of 987.4 FTE jobs.
As is the case for the TSM Alternative, the creation of these new jobs would be a beneficialeffect to the local and regional economy. In addition, because the Full BRT Alternative wouldgenerate more jobs than the TSM Alternative, the beneficial effect would also be greater.
c. Tax Revenue Loss
No Build Alternative
The No Build Alternative would not require any acquisitions; therefore, there would be no lossof tax revenues and thus no adverse effect under NEPA (significant effect under CEQA).
TSM Alternative
The No Build Alternative would not require any acquisitions; therefore, there would be no lossof tax revenues and thus no adverse effect under NEPA (significant effect under CEQA).
BRT Alternative
As noted above, revenues collected from sales taxes and business license fees are based onbusiness’ gross receipts, which are kept confidential under Sections 21.17 and 3-1.2.2 of theBusiness Tax Ordinance. Therefore, the loss in sales tax and business license fee revenues underthe BRT Alternative cannot be determined.
Termination of the approximately 95 109 lease agreements within the SP MTA ROW would notresult in any property tax losses, because property tax is not levied on MTA property.
The acquisition of private property would result in property tax revenue losses to county and cityagencies, school districts, and other special districts in the County of Los Angeles. Totalproperty tax revenue losses are equivalent to a summation of the assessed property taxes of theprivate properties to be acquired. The assessed property taxes of the acquired properties wereobtained from the Los Angeles County Assessors records for Fiscal Year 1999-2000 as providedin Damar, a real estate database for Los Angeles County produced by TRW-REDI Property Data.
Assessed property taxes for the acquired properties under the Full BRT Alternative, Lankershim/Oxnard On-Street Alignment, and MOS are given below in Table 4-15. The BRT Alternativewould result in the annual loss of approximately $19,400 $19,080 in property taxes, and theLankershim/Oxnard On-Street Alignment would result in an estimated loss of approximately

Fiscal and Economic Conditions
page 4-128
$13,740, and the MOS would each result in the annual loss of approximately $15,800 $10,070 inproperty taxes.
Table 4-15: Property Tax Assessments for Acquired Properties
Property to be Acquired Property Taxes Levied, FY1999-20001
13079 Chandler Boulevard $1605546 Fulton Avenue $2,11013250 Burbank Boulevard $1,3106020 Woodman Avenue $2,31614300 Bessemer Street $3,88014348 Bessemer Street $3,4306050 Van Nuys Boulevard $6,19021045 Victory Boulevard $3,67013321 Burbank Boulevard $1,920Pierce College $0
Bus Rapid Transit (BRT)
Total $23,070 $19,0806020 Woodman Avenue $2,31614300 Bessemer Street $3,88014348 Bessemer Street $3,4306050 Van Nuys Boulevard $6,19021045 Victory Boulevard $3,670Pierce College $0
Lankershim/OxnardOn-Street Alignment
Total $19,490 $13,7406020 Woodman Avenue $2,31614300 Bessemer Street $3,88014348 Bessemer Street $3,4306050 Van Nuys Boulevard $6,190
Minimum Operable Segment(MOS)
Total $15,820 $10,070Notes:(1) FY 1999-2000: Los Angeles County Fiscal Year, ending on June 30, 2000.For a full explanation of properties to be acquired, please refer to Chapter 1-1, Acquisitions.
Source: Los Angeles County Assessors Office, 2000; Myra L. Frank & Associates, 2000.
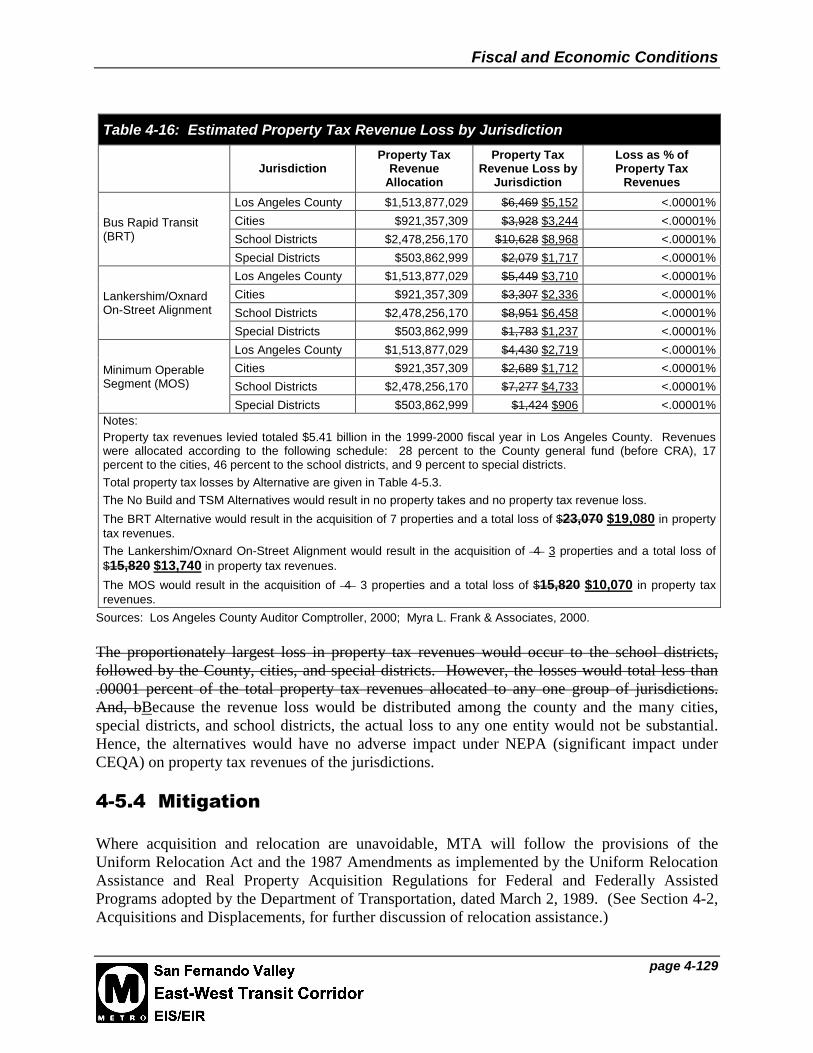
The property tax revenue losses by jurisdiction are equivalent to the total property tax lossesmultiplied by the percent of the total property taxes that each jurisdiction receives (27 percent forthe County, 17 percent for the cities, 47 percent for the school district, and 9 percent for specialdistricts). A summary of the estimated property tax revenue loss by jurisdiction is given belowin Table 4-16. The BRT Alternative, Lankershim/Oxnard On-Street Alignment, and MOS wouldeach result in a property tax loss of less than one ten-thousandth of a percent of eachjurisdiction’s total annual property tax revenues.
Fiscal and Economic Conditions
page 4-129
Table 4-16: Estimated Property Tax Revenue Loss by Jurisdiction
JurisdictionProperty Tax
RevenueAllocation
Property TaxRevenue Loss by
Jurisdiction
Loss as % ofProperty Tax
Revenues
Los Angeles County $1,513,877,029 $6,469 $5,152 <.00001%
Cities $921,357,309 $3,928 $3,244 <.00001%
School Districts $2,478,256,170 $10,628 $8,968 <.00001%Bus Rapid Transit(BRT)
Special Districts $503,862,999 $2,079 $1,717 <.00001%
Los Angeles County $1,513,877,029 $5,449 $3,710 <.00001%
Cities $921,357,309 $3,307 $2,336 <.00001%
School Districts $2,478,256,170 $8,951 $6,458 <.00001%Lankershim/OxnardOn-Street Alignment
Special Districts $503,862,999 $1,783 $1,237 <.00001%
Los Angeles County $1,513,877,029 $4,430 $2,719 <.00001%
Cities $921,357,309 $2,689 $1,712 <.00001%
School Districts $2,478,256,170 $7,277 $4,733 <.00001%Minimum OperableSegment (MOS)
Special Districts $503,862,999 $1,424 $906 <.00001%Notes:Property tax revenues levied totaled $5.41 billion in the 1999-2000 fiscal year in Los Angeles County. Revenueswere allocated according to the following schedule: 28 percent to the County general fund (before CRA), 17percent to the cities, 46 percent to the school districts, and 9 percent to special districts.
Total property tax losses by Alternative are given in Table 4-5.3.
The No Build and TSM Alternatives would result in no property takes and no property tax revenue loss.
The BRT Alternative would result in the acquisition of 7 properties and a total loss of $23,070 $19,080 in propertytax revenues.
The Lankershim/Oxnard On-Street Alignment would result in the acquisition of 4 3 properties and a total loss of$15,820 $13,740 in property tax revenues.
The MOS would result in the acquisition of 4 3 properties and a total loss of $15,820 $10,070 in property taxrevenues.
Sources: Los Angeles County Auditor Comptroller, 2000; Myra L. Frank & Associates, 2000.
The proportionately largest loss in property tax revenues would occur to the school districts,followed by the County, cities, and special districts. However, the losses would total less than.00001 percent of the total property tax revenues allocated to any one group of jurisdictions.And, bBecause the revenue loss would be distributed among the county and the many cities,special districts, and school districts, the actual loss to any one entity would not be substantial.Hence, the alternatives would have no adverse impact under NEPA (significant impact underCEQA) on property tax revenues of the jurisdictions.
4-5.4 Mitigation
Where acquisition and relocation are unavoidable, MTA will follow the provisions of theUniform Relocation Act and the 1987 Amendments as implemented by the Uniform RelocationAssistance and Real Property Acquisition Regulations for Federal and Federally AssistedPrograms adopted by the Department of Transportation, dated March 2, 1989. (See Section 4-2,Acquisitions and Displacements, for further discussion of relocation assistance.)

Visual and Aesthetic Conditions
page 4-130
4-6 VISUAL AND AESTHETIC CONDITIONS
This section presents the existing visual and aesthetic conditions along the length of the proposedSan Fernando Valley East-West Transit Corridor.
The existing setting of the proposed alignments and of the station areas is described in Section4-6.1. In Section 4-6.2, the impact analysis methodology is presented, and in Section 4-6.3 theimpacts on visual and aesthetic conditions along the proposed alignments and in the immediatestation areas are described. Section 4-6.4 describes mitigation measures to be undertaken in eachof the alignment options and at each of the proposed station sites.
4-6.1 Setting
4-6.1.1 Methodology
Generally, there are two types of physical features that characterize the visual environment of anarea:
• Built environment features including development patterns, buildings, structures, parkingareas and roads, utilities, and signs; and,
• Natural features such as hills, vegetation, rock outcroppings, drainages, and soils.
The study area is defined to include both local and distant views as seen from within a ¼-mileradius of the alternative alignments and stations. Local views include the immediate landscape,and distant views include mountains, hills, and ridgelines up to 5 miles away.
The setting is defined in terms of views. The project corridor is subdivided into “visualassessment units” within which the views are discussed. Also included is an assessment ofexisting trees, lighting, and glare.
a. Views
The following terms are used to analyze and rank the overall quality of views in the study area,and are presented in the tables below:
• Visual quality refers to the general aesthetics of a view. This analysis attempts to assessthe quality of a view in an objective fashion through the use of the following descriptivecategories: vividness, intactness, and unity. Vividness is the visual power ormemorability of landscape components as they combine in striking and distinctivepatterns; intactness is the visual integrity of the natural and built landscape and itsfreedom from encroaching elements; and unity is the visual coherence and compositionalharmony of the landscape considered as a whole. This analysis evaluates visual qualityusing low, medium, and high rankings. Views of high quality have topographic relief, a

Visual and Aesthetic Conditions
page 4-131
variety of vegetation, rich colors, and unique natural and built features. Areas withmedium visual quality have interesting but minor landforms, some vegetative variety incolor, and/or moderate scenery. Areas of low visual quality have uninteresting scenery,and/or common elements.
• Viewer groups and sensitivity identifies who is most likely to experience the view andwhat the associated sensitivities of the viewer and land use are. Residents are consideredto have high sensitivity as a viewer group. High sensitivity land uses are schools,religious institutions, and passive outdoor spaces including parks, playgrounds, andrecreation areas. Motorists and transit patrons have varying sensitivity depending on thenature of their trip. Motorists on pleasure trips are generally considered to be moresensitive than are commuters. Due to their travel speed and the large number ofdistractions posed by driving, motorists are ranked as having medium sensitivity.Occupants of office, commercial or industrial buildings are also considered to havemedium sensitivity, as most or all of their time is spent focused on work tasks inside ofbuildings.
• Duration of a view refers to the amount of time that a particular view can be seen by aspecific viewer group. Two duration categories are used in this analysis: fleeting orintermittent views (such as those experienced by motorists and cyclists), which are ratedas short, and long-term or constant views (including views from residences or officebuildings), which are rated long.
• Visual resources within a view may include unique views, views identified in localplans, views from scenic highways, or specific unique structures or landscape features,including distinct groups of mature trees.
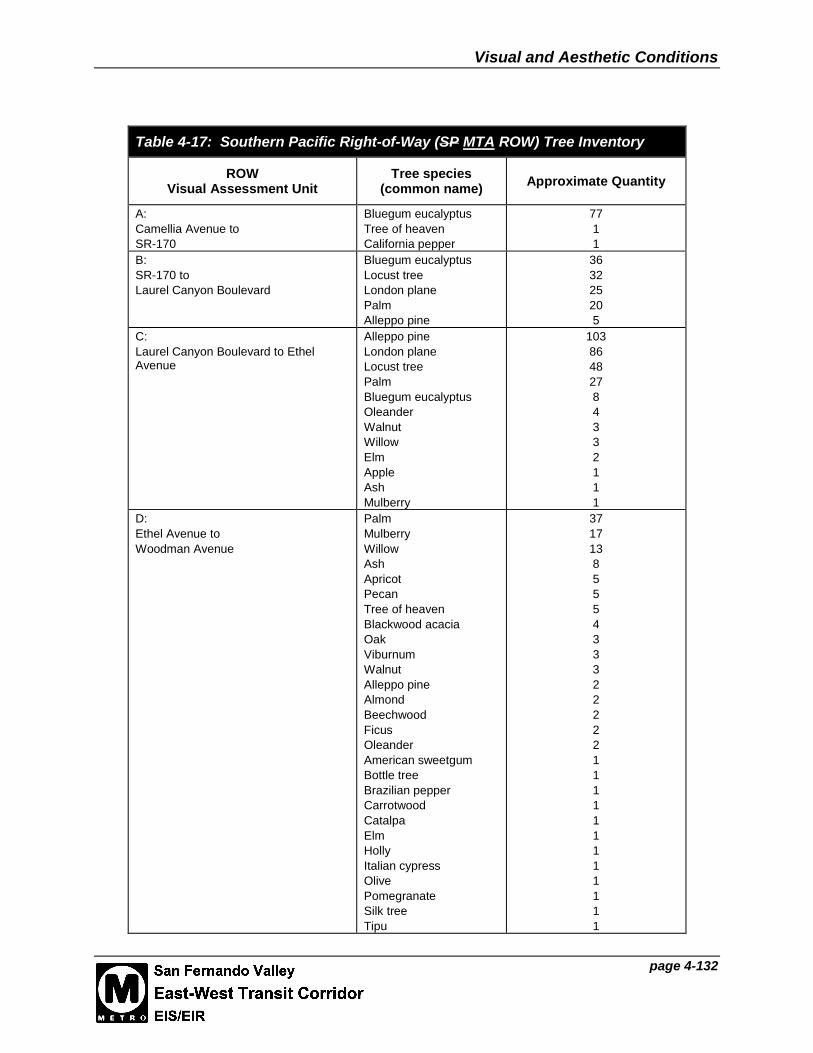
b. Existing Mature Trees
There are approximately 1300 existing trees growing in the SP MTA ROW. Of these,approximately 800 are mature trees. (Trees 25 to 30 feet tall or taller considered mature.) Treeswere documented by size and species along the length of the SP MTA ROW. The species andquantity observed are documented in Table 4-17. Where the SP MTA ROW is in the ChandlerBoulevard
Visual and Aesthetic Conditions
page 4-132
Table 4-17: Southern Pacific Right-of-Way (SP MTA ROW) Tree Inventory
ROWVisual Assessment Unit
Tree species(common name) Approximate Quantity
A:Camellia Avenue toSR-170
Bluegum eucalyptusTree of heavenCalifornia pepper
7711
B:SR-170 toLaurel Canyon Boulevard
Bluegum eucalyptusLocust treeLondon planePalmAlleppo pine
363225205
C:Laurel Canyon Boulevard to EthelAvenue
Alleppo pineLondon planeLocust treePalmBluegum eucalyptusOleanderWalnutWillowElmAppleAshMulberry
10386482784332111
D:Ethel Avenue toWoodman Avenue
PalmMulberryWillowAshApricotPecanTree of heavenBlackwood acaciaOakViburnumWalnutAlleppo pineAlmondBeechwoodFicusOleanderAmerican sweetgumBottle treeBrazilian pepperCarrotwoodCatalpaElmHollyItalian cypressOlivePomegranateSilk treeTipu
3717138555433322222111111111111

Visual and Aesthetic Conditions
page 4-133
Table 4-17: Southern Pacific Right-of-Way (SP MTA ROW) Tree Inventory
ROWVisual Assessment Unit
Tree species(common name) Approximate Quantity
E:
Woodman Avenue to Hazeltine Avenue
Palm
Italian cypress
Almond
Ash
Ficus
Tree of heaven
California pepper
Coast live oak
Elm
17
7
6
6
5
4
1
1
1
F:
Hazeltine Avenue to SepulvedaBoulevard
Eucalyptus
American sweetgum
Palm
14
9
2
G:
Sepulveda Boulevard to Haskell Avenue
Eucalyptus
California pepper
Palm
10
5
1
H:
Haskell Avenue toBalboa Boulevard
Walnut
California Pepper
Coast live oak
Tree of heaven
Ash
Eucalyptus
Black walnut
Catalpa
Palm
Poplar
Blackwood acacia
Stone pine
Cork oak
Elm
Willow
Almond
Box elder
Alleppo pine
Silk tree
Yucca
93
21
21
18
13
13
12
11
11
9
8
8
3
3
3
2
2
1
1
1

Visual and Aesthetic Conditions
page 4-134
Table 4-17: Southern Pacific Right-of-Way (SP MTA ROW) Tree Inventory
ROWVisual Assessment Unit
Tree species(common name) Approximate Quantity
I:
Balboa Boulevard to
White Oak Avenue
Palm
Crepe myrtle
Ash
Tree of heaven
Almond
Walnut
Bottle tree
Plum
Apple
Fig
Sycamore
156
49
9
6
5
3
2
2
1
1
1
J:
White Oak Avenue to ResedaBoulevard
Manna gum eucalyptus
Bushy yate
Mulberry
Ash
Palm
Siberian elm
Tree of heaven
4
3
2
1
1
1
1
K:
Reseda Boulevard
No trees
L:
Reseda Boulevard to Winnetka Avenue
Palm
Grey pinion cypress
Tree of heaven
Brazilian pepper
Ash
Elm
Oleander
Silk tree
Crepe myrtle
Italian cypress
Lemon
Lombardy poplar
Olive
Tipu tree
82
10
10
6
4
3
3
3
1
1
1
1
1
1
M:
Winnetka Avenue to
Variel Avenue
Palm
Tipu tree
Elm
Ash
40
10
5
2
TOTAL TREES: 1384
Note: Since preparation of this inventory, MTA has removed a number of diseased eucalyptus treesalong the corridor.
Source: Gruen Associates, 2000.

Visual and Aesthetic Conditions
page 4-135
median, mature trees are set back 3 to 10 feet from the curb. Where the SP MTA ROW is behindthe rear yards of residential homes, there are mature trees of a diversity of species growingadjacent to rear property fences. Throughout the SP MTA ROW, trees are growing primarilyalong the edges of the right-of-way. Since the preparation of Table 4-17 for the Draft EIS/EIR,some mature diseased eucalyptus trees have been removed by MTA. Potential impacts of theproposed project on these existing mature trees are discussed in Section 4-6.3.
c. Lighting and Glare
In the vicinity of proposed station sites, there is existing street lighting and lighting incommercial and school parking lots. The location of this existing lighting is discussed in thevisual assessment units below. There are no existing glare conditions.
4-6.1.2 Visual Assessment Units: Detailed Discussion
Each visual assessment unit denotes an area of distinct visual character. Fifteen visualassessment units are distinguished along the SP MTA ROW and On-Street Alignments of theBRT Alternative. Each of these visual assessment units is based on common visualcharacteristics, and provides a framework for analyzing the existing visual and aestheticconditions in the Transit Corridor. A map of these visual assessment units is shown in Figure4-28. Each visual assessment unit extends approximately 500 feet to either side of the alignmentor station boundary. In addition to the information presented in the following tables, existingfeatures such as visual character, viewer groups/sensitivity, key views, and visual resources aredescribed in some detail in the visual assessment units. The station areas are described withinthe context of the visual assessment units, and are also described in greater detail in Section 4-6.1.5.
The SP MTA ROW alignment follows an old railroad right-of-way, formerly owned by theSouthern Pacific Railroad and has not been used for transportation since the early 1990s. Theright-of-way is covered with exposed soil, some weedy groundcover and some broken glass.There are rails and railroad ties and no trespassing signs along most of the length of the BRTAlternative. Along certain portions of the SP MTA ROW, the right-of-way is used for industrialand commercial leases or vehicle storage, and rails have been removed in certain areas. TheLankershim/Oxnard On-Street Alignment is characterized by the commercial character ofLankershim Boulevard and the predominantly residential character of Oxnard Street. Note: allphotos in this section were taken between July and September, 2000.
a. Visual Assessment Unit A (Chandler Boulevard – LankershimBoulevard to Camellia Avenue)
Visual Assessment Unit A
Visual QualityViewer Group/
ViewerSensitivity
View Duration VisualResources
MediumNorth HollywoodPark Users/High
ShortEucalyptus trees
None


Visual and Aesthetic Conditions
page 4-137
Beginning at Lankershim Boulevard, Chandler Boulevard is currently a four-lane roadway withthe SP MTA ROW separating the eastbound and westbound lanes. From Lankershim Boulevardto just east of Camellia Avenue the SP MTA ROW is approximately 60 to 250 feet wide andcurrently developed with light industrial uses (see Figure 4-29). The project would follow an on-street route on Chandler Boulevard from Lankershim Boulevard to Camellia Avenue. Just westof Tujunga Boulevard, the busway will pass between industrial buildings that are locatedapproximately 30 feet apart.
The majority of buildings with views of Chandler Boulevard are commercial/industrial andtherefore do not contain sensitive viewers. Users of North Hollywood Park, to the south of thealignment, do represent sensitive viewers. Users of North Hollywood Park are able to seeChandler Boulevard and the right-of-way from the northeast corner of the park, but existingbuildings block other views. There are no key views within this visual assessment unit.
At Camellia Avenue, in the south portion of the right-of-way across Chandler Boulevard fromNorth Hollywood Park, there is was a grove of approximately 65 bluegum eucalyptus treesduring the inventory phase of the Draft EIS.EIR. These trees appeared to be under stress,perhaps as a result of red lerp psyllid infestation. The red lerp psyllid has infested eucalyptustrees in California for two years. In June, 100 parasitic wasps were released in North Hollywoodin an attempt to control the psyllid population. Since the previous inventory, these trees havebeen removed due to disease. (See Table 4-17 for a complete inventory of trees in the SP MTAROW.)
There are no lighting fixtures in the right-of-way, but there are streetlights along ChandlerBoulevard sidewalks, providing background ambient light. The eucalyptus grove is the onlyvisual resource in this visual assessment unit. No visual resources are currently located in thisvisual assessment unit.
b. Visual Assessment Unit B (Chandler Boulevard – Camellia Avenue toLaurel Canyon Boulevard)
Visual Assessment Unit B
Visual QualityViewer Group/
ViewerSensitivity
View Duration VisualResources
Medium Residents/High LongRow of Eucalyptus
None
Between Camellia Avenue and SR-170, the right-of-way narrows to 60 feet in width and a rowof mature bluegum eucalyptus trees approximately 60 feet tall are located were observed alongthe north edge during the inventory phase of the Draft EIS/EIR. Since the previous inventory,these trees have been removed due to disease. Where the right-of-way passes under the SR-170overpass there is no vegetation, only exposed soil and railroad tracks. Remnants of the previousrail operations, such as rails and rail ties, remain throughout this portion of the right-of-way.West of SR-170, the median right-of-way is exposed soil with some low groundcover and treesalong the north and south edges. The right-of-way width is 60 feet wide in this area, with bothmature and young trees planted in rows between 3 and 10 feet from the curb.
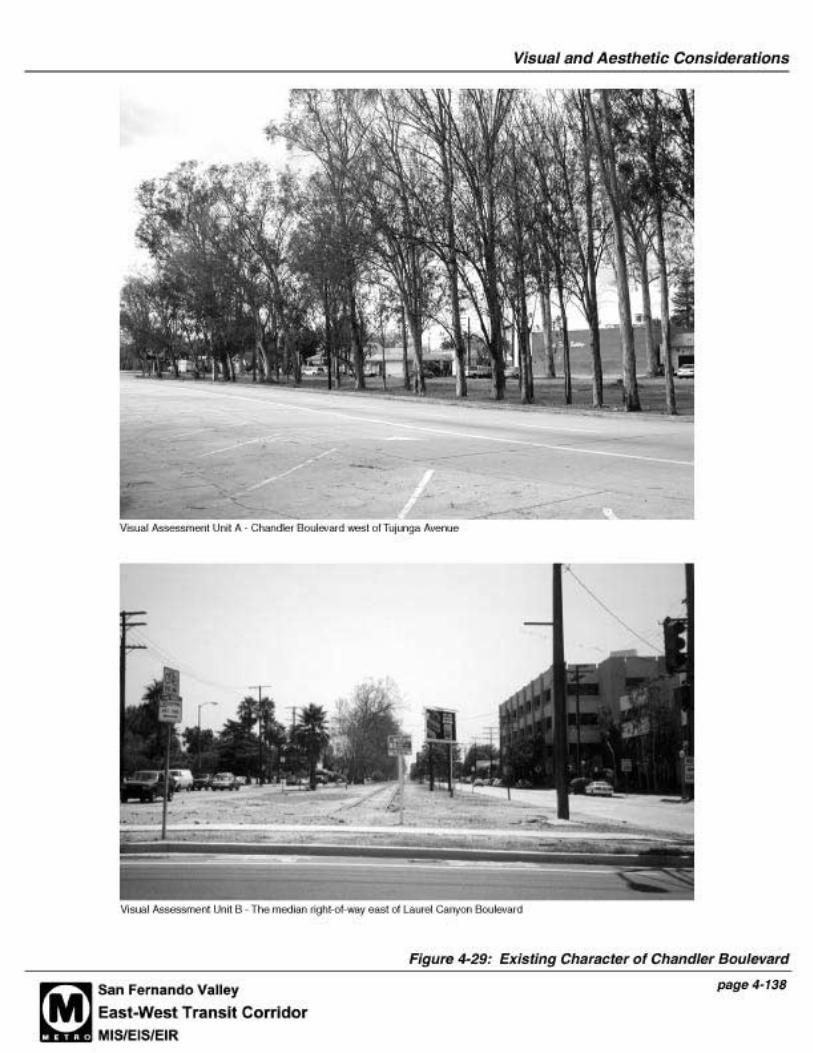
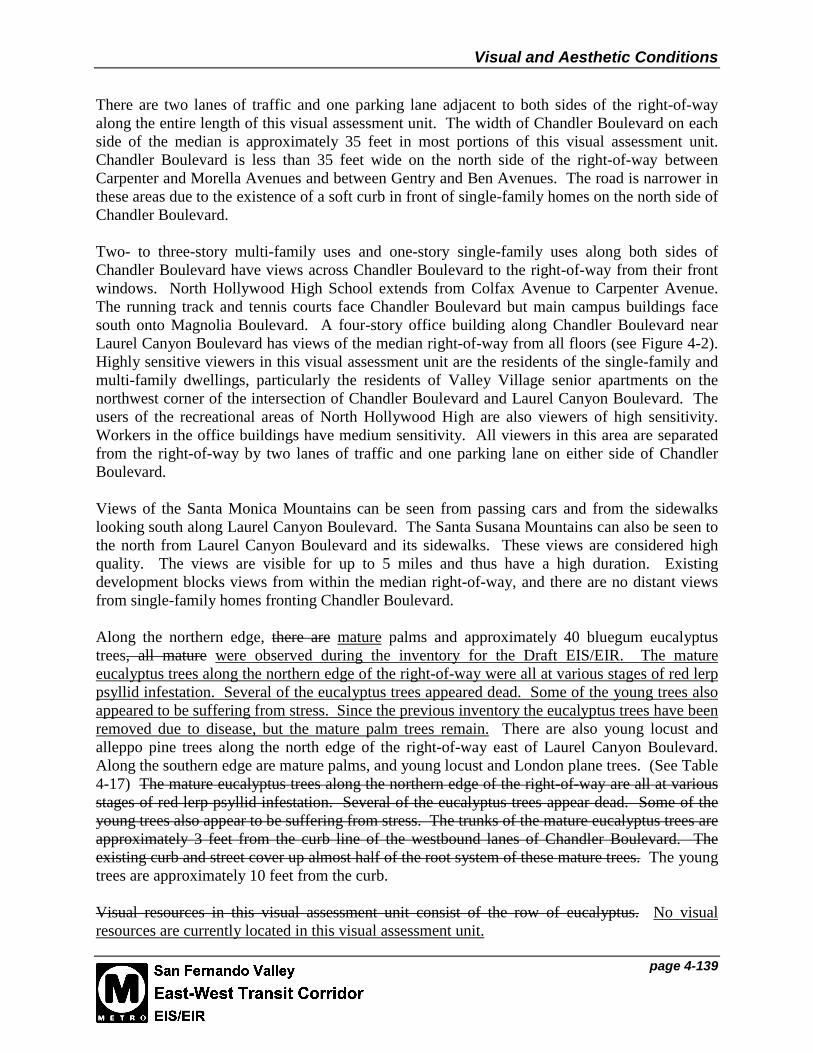
Visual and Aesthetic Conditions
page 4-139
There are two lanes of traffic and one parking lane adjacent to both sides of the right-of-wayalong the entire length of this visual assessment unit. The width of Chandler Boulevard on eachside of the median is approximately 35 feet in most portions of this visual assessment unit.Chandler Boulevard is less than 35 feet wide on the north side of the right-of-way betweenCarpenter and Morella Avenues and between Gentry and Ben Avenues. The road is narrower inthese areas due to the existence of a soft curb in front of single-family homes on the north side ofChandler Boulevard.
Two- to three-story multi-family uses and one-story single-family uses along both sides ofChandler Boulevard have views across Chandler Boulevard to the right-of-way from their frontwindows. North Hollywood High School extends from Colfax Avenue to Carpenter Avenue.The running track and tennis courts face Chandler Boulevard but main campus buildings facesouth onto Magnolia Boulevard. A four-story office building along Chandler Boulevard nearLaurel Canyon Boulevard has views of the median right-of-way from all floors (see Figure 4-2).Highly sensitive viewers in this visual assessment unit are the residents of the single-family andmulti-family dwellings, particularly the residents of Valley Village senior apartments on thenorthwest corner of the intersection of Chandler Boulevard and Laurel Canyon Boulevard. Theusers of the recreational areas of North Hollywood High are also viewers of high sensitivity.Workers in the office buildings have medium sensitivity. All viewers in this area are separatedfrom the right-of-way by two lanes of traffic and one parking lane on either side of ChandlerBoulevard.
Views of the Santa Monica Mountains can be seen from passing cars and from the sidewalkslooking south along Laurel Canyon Boulevard. The Santa Susana Mountains can also be seen tothe north from Laurel Canyon Boulevard and its sidewalks. These views are considered highquality. The views are visible for up to 5 miles and thus have a high duration. Existingdevelopment blocks views from within the median right-of-way, and there are no distant viewsfrom single-family homes fronting Chandler Boulevard.
Along the northern edge, there are mature palms and approximately 40 bluegum eucalyptustrees, all mature were observed during the inventory for the Draft EIS/EIR. The matureeucalyptus trees along the northern edge of the right-of-way were all at various stages of red lerppsyllid infestation. Several of the eucalyptus trees appeared dead. Some of the young trees alsoappeared to be suffering from stress. Since the previous inventory the eucalyptus trees have beenremoved due to disease, but the mature palm trees remain. There are also young locust andalleppo pine trees along the north edge of the right-of-way east of Laurel Canyon Boulevard.Along the southern edge are mature palms, and young locust and London plane trees. (See Table4-17) The mature eucalyptus trees along the northern edge of the right-of-way are all at variousstages of red lerp psyllid infestation. Several of the eucalyptus trees appear dead. Some of theyoung trees also appear to be suffering from stress. The trunks of the mature eucalyptus trees areapproximately 3 feet from the curb line of the westbound lanes of Chandler Boulevard. Theexisting curb and street cover up almost half of the root system of these mature trees. The youngtrees are approximately 10 feet from the curb.
Visual resources in this visual assessment unit consist of the row of eucalyptus. No visualresources are currently located in this visual assessment unit.

Visual and Aesthetic Conditions
page 4-140
c. Visual Assessment Unit C (Chandler Boulevard – Laurel CanyonBoulevard to Ethel Avenue)
Visual Assessment Unit C
Visual QualityViewer Group/
ViewerSensitivity
View Duration VisualResources
Medium Residents/High Long None
Between Laurel Canyon Boulevard and Whitsett Avenue, the SP MTA ROW remains a 60-footmedian along Chandler Boulevard. West of Whitsett Avenue and extending to ColdwaterCanyon Avenue, the width increases to 100 feet. The surface of the median is exposed soilcovered in wood chips, with the exception of the portion of the right-of-way between WhitsettAvenue and Bellaire Avenue, which is exposed soil and sand.
Billboards are were located in the median at Laurel Canyon Boulevard and Whitsett Avenueduring the inventory phase of the Draft EIS/EIR. Since the inventory, the billboards in this areahave been removed. Single- and multifamily residences front onto Chandler Boulevard and haveviews of the median right-of-way across the street. Three Five religious institutions, AishHatorah, Chabad of North Hollywood, and Shaarey Zedek Congregation, Yad Avraham, andToras Hashem, and one two schools, Emek Hebrew Academy and Valley Hillel School, arelocated in this area. Residents of the dwelling units and people visiting the religious institutionsand school are considered highly sensitive viewers. All viewers are separated from the right-of-way on either side by two lanes of traffic and one parking lane.
Key views of the Santa Monica and Santa Susana Mountains can be seen from Whitsett andColdwater Canyon Avenues, but existing development blocks these views from the right-of-way.These views are of high quality and, where visible, can be seen by pedestrians and motoriststraveling on these streets for up to five miles.
There are some mature trees and many newly planted trees along this portion of the right-of-way(see Table 4-17). From Laurel Canyon Boulevard to Ethel Avenue, there are approximately 25mature palms and 10 bluegum eucalyptus trees along the edges of the right-of-way. Thepredominant trees in this area are young locust, London plane, and alleppo pine trees planted inrows along the right-of-way edges (see Figure 4-30). All of the eucalyptus trees appear to beinfested with the red lerp psyllid and have leafless branches. Some of the trees are entirelyleafless. Remnants of the previous rail operations remain in some areas.
No visual resources are located in this visual assessment unit.


Visual and Aesthetic Conditions
page 4-142
d. Visual Assessment Unit D (Diagonal SP MTA ROW – Ethel Avenue toWoodman Avenue)
Visual Assessment Unit D
Visual QualityViewer Group/
ViewerSensitivity
View Duration VisualResources
Low Residents/High Short None
At Ethel Avenue, the alignment transitions from the Chandler Boulevard median into anexclusive right-of-way that travels behind single-family dwellings. The SP MTA ROW varies inwidth in this visual assessment unit. Several homes located just south of Oxnard Street areleasing additional rear yard space in the right-of-way, which reduces the width open area of theSP MTA ROW from 100 feet to 70 feet along a 400-foot length between Ethel and FultonAvenues. At Fulton Avenue, the width of the SP MTA ROW increases to 225 feet. The right-of-way returns to 100 feet in width at a point approximately ½ mile northwest of the intersectionof Fulton and Burbank Avenues. For a portion of this section, there are 30-foot rear yard leaseson either side of the right-of-way. The right-of-way is primarily exposed soil in this area, withsome trees and shrubs growing along both edges, and some broken glass along the rails.
There are several new homes on the west side of Ethel Avenue which are adjacent to the right-of-way (see Figure 4-30). Residents of these houses have views of the right-of-way from theirsecond-story rear windows. Motorists and pedestrians traveling on Fulton Avenue have views ofthe Santa Monica and Santa Susana Mountains. North of Burbank Boulevard, a lumber companyoccupies the right-of-way. Stacked lumber, trucks and other warehousing equipment are visiblein the right-of-way.
Mature trees and fencing are located along the edges of the right-of-way in this area. Theseprovide a dense screen between residential rear yards and the right-of-way. There are a varietyof tree types, including palms, willows, ash trees, trees of heaven, apricot and pecan trees (seeTable 4-17).
There are no visual resources in this visual assessment unit.

Visual and Aesthetic Conditions
page 4-143
e. Visual Assessment Unit E (SP MTA ROW –Woodman Avenue toHazeltine Avenue)
Visual Assessment Unit E
Visual QualityViewer Group/
ViewerSensitivity
View Duration VisualResources
Low Residents/High Short None
Between Woodman Avenue and Hazeltine Avenue the alignment passes adjacent to the rearproperty lines of multifamily uses to the south and a mixed single- and multifamilyneighborhood to the north (see Figure 4-31). The SP MTA ROW is 100 feet wide in this area.There is a large amount of broken glass on the ground, and graffiti on walls abutting the right-of-way.
Rear yard fences block residents’ views of the right-of-way from single-family houses and first-floor apartments in the multifamily buildings. Residents of second and third floor units haveviews looking down onto the right-of-way. Single-family and multifamily residents areconsidered highly sensitive viewers. Motorists and pedestrians traveling on Woodman andHazeltine Avenues have views of the Santa Monica and Santa Susana Mountains.
On the north side of the right-of-way, there are several residential streets that dead-end at theright-of-way. Mature trees and shrubs are growing at these intersections, as well as along theedges of the right-of-way. Tree types growing in this area include palm, Italian cypress, almond,ash, and ficus trees (see Table 4-17).
No important visual resources are located in this visual assessment unit.
f. Visual Assessment Unit F (SP MTA ROW – Hazeltine Avenue toSepulveda Boulevard)
Visual Assessment Unit F
Visual QualityViewer Group/
ViewerSensitivity
View Duration VisualResources
Low Workers/Low Short None
The visual character of this segment is dominated by the industrial uses along the right-of-way(see Figure 4-31). Throughout most of this portion, the right-of-way is completely built out withused car lots and other industrial/commercial uses. Adjacent to the right-of-way are auto repairshops, a recycling yard, oil storage, and other industrial/commercial uses. Views of the SantaMonica and Santa Susana Mountains can be seen along Van Nuys and Sepulveda Boulevards.There is no vegetation in this area.
No visual resources are located in this visual assessment unit.


Visual and Aesthetic Conditions
page 4-145
g. Visual Assessment Unit G (SP MTA ROW – Sepulveda Boulevard toHaskell Avenue)
Visual Assessment Unit G
Visual QualityViewer Group/
ViewerSensitivity
View Duration VisualResources
Low Residents/High Short None
West of the proposed Sepulveda station, the alignment passes behind industrial and commercialbuildings before following the I-405 freeway and passing adjacent to the rear property lines ofapproximately 20 single-family houses. The right-of-way passes under the I-405 freeway toHaskell Avenue and the Sepulveda Dam Recreation Area. The right-of-way is primarily used forstorage along the length of this visual assessment unit (see Figure 4-32).
Views of the right-of-way are currently blocked by rear yard fences and landscaping. Residentshave filtered views of the I-405 freeway from over their rear yard fences.There are no visual resources in this visual assessment unit.
h. Visual Assessment Unit H (SP MTA ROW – Haskell Avenue to BalboaBoulevard)
Visual Assessment Unit H
Visual QualityViewer Group/
ViewerSensitivity
View Duration VisualResources
High Recreation AreaUsers/High Long
Coast Live Oaks
Sepulveda DamRecreation Area
The Sepulveda Dam Recreation Area to the south of the SP MTA ROW dominates the visualcharacter of this segment. In this visual assessment unit, the SP MTA ROW runs parallel to theseven-lane Victory Boulevard to its north, and is separated from traffic lanes by a wide strip ofland with a meandering bike path. Both Balboa Boulevard and Woodley Avenue south ofVictory Boulevard (extending to Burbank Boulevard) are designated scenic highways in the Cityof Los Angeles General Plan. East of Balboa the right-of-way passes behind a City of LosAngeles park-and-ride lot.
From the SP MTA ROW and the surrounding area, there are views of the Santa MonicaMountains to the south, across the open space of the Sepulveda Dam Recreation Area, and of theSanta Susana Mountains to the north, along Woodley Avenue and Balboa Boulevard.


Visual and Aesthetic Conditions
page 4-147
There are some shrubs, mature trees and palms along the right-of-way, which is mostly exposedsoil (see Figure 4-32). There are some native coast live oak trees along this portion of the right-of-way (see Table 4-17). Most of the vegetation is growing along the edges of the right-of-way,especially along a drainage channel on the south edge, which slopes away from the projectlocation.
Visual resources in this visual assessment unit consist of views of the Sepulveda Dam RecreationArea.
i. Visual Assessment Unit I (SP MTA ROW – Balboa Boulevard to WhiteOak Avenue)
Visual Assessment Unit I
Visual QualityViewer Group/
ViewerSensitivity
View Duration VisualResources
High Recreation AreaUsers/High Long
Palms
Sepulveda DamRecreation Area
West of Balboa Boulevard, the SP MTA ROW passes behind an office building complex, andthere is a row of approximately 50 young crepe myrtle trees between the right-of-way and theoffice buildings’ parking lots. West of the office building, the right-of-way curves southwestacross the Recreation Area, crossing the Los Angeles River where it transitions from a concreteculvert to a vegetated riverbed, and straightening at Oxnard Street just east of White OakAvenue. (See Figure 4-33.)
From the SP MTA ROW and the surrounding area, there are views of the Santa MonicaMountains to the south, across the open space of the Sepulveda Dam Recreation Area, and of theSanta Susana Mountains to the north, along Balboa Boulevard and White Oak Avenue.
The majority of the trees growing in this area are palms (see Table 4-17). Trees are primarilylocated along the edge of the SP MTA ROW.


Visual and Aesthetic Conditions
page 4-149
j. Visual Assessment Unit J (SP MTA ROW – White Oak Avenue toReseda Boulevard)
Visual Assessment Unit J
Visual QualityViewer Group/
ViewerSensitivity
View Duration VisualResources
Low Residents/High Short None
West of White Oak Avenue the SP MTA ROW parallels Oxnard Street. As far as ResedaBoulevard, the SP MTA ROW is a 100-foot wide strip of exposed soil north of Oxnard Street(see Figure 4-33). Uses on the south side of Oxnard Street and along the right-of-way are single-family residential.
Views of the right-of-way are generally blocked by rear yard fences and walls and by vegetation.Some two-story residences have views of the right-of-way from their upper windows. There area few trees growing in the right-of-way along the northern edge (see Table 4-17).
There are no visual resources in this visual assessment unit.
k. Visual Assessment Unit K (SP MTA ROW – Reseda Boulevard)
Visual Assessment Unit KVisual Quality Viewer Group/
Viewer SensitivityView Duration Visual Resources
Low Workers/Low Short None
Immediately east of Reseda Boulevard, the SP MTA ROW widens to 225 feet and contains alumberyard on leased land. To the west of the Boulevard, the right-of-way passes through othercommercial/industrial uses before returning to the same character seen in visual assessment unitJ, between White Oak Avenue and Reseda Boulevard. In this visual assessment unit, the right-of-way is completely covered by industrial and commercial uses (see Figure 4-34).
Along Reseda Boulevard there are views of the Santa Monica and Santa Susana Mountains. Theintersection of the right-of-way and Reseda Boulevard is dominated by single-story commercialuses, and there is no existing landscaping.
There are no visual resources in this visual assessment unit.
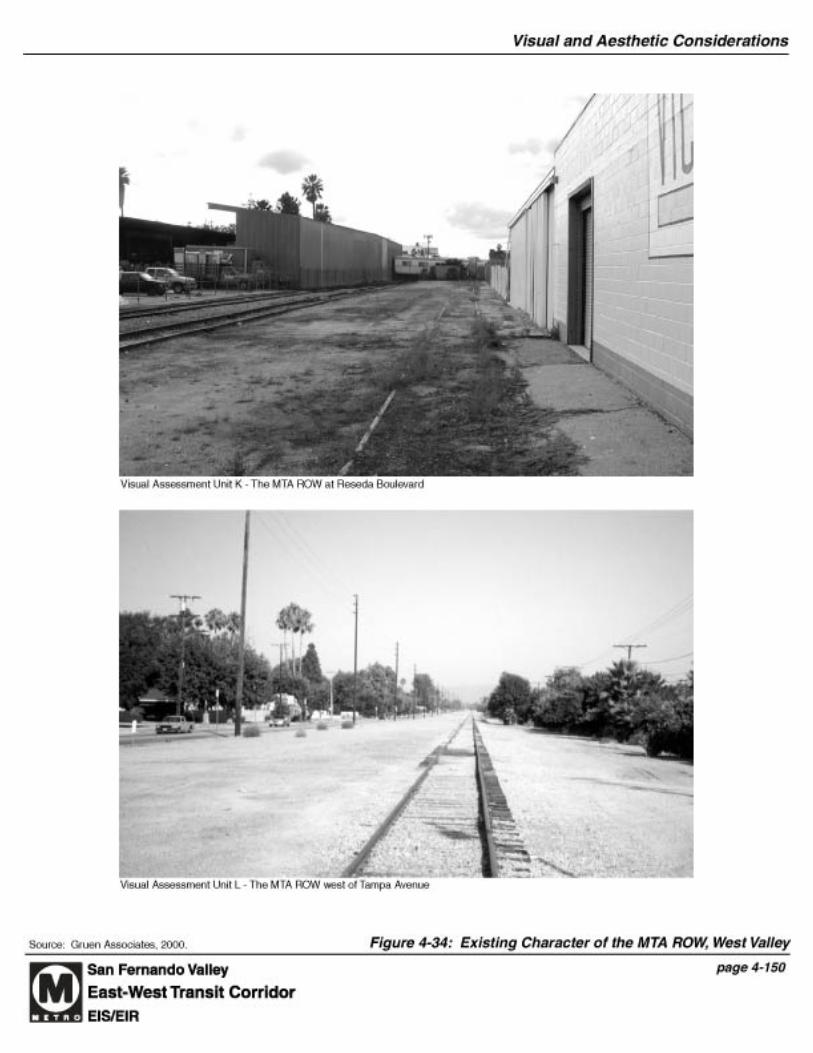

Visual and Aesthetic Conditions
page 4-151
l. Visual Assessment Unit L (SP MTA ROW – Reseda Boulevard toWinnetka Avenue)
Visual Assessment Unit L
Visual QualityViewer Group/
ViewerSensitivity
View Duration VisualResources
Low Residents/High Short None
At Cahill Avenue, west of Reseda Boulevard, the SP MTA ROW runs along the north side ofTopham Street, which is the northwest-bound extension of Oxnard Street (see Figure 4-34).Topham Street ends at Victory Boulevard, and the SP MTA ROW continues across VictoryBoulevard, paralleling it just west of Winnetka Avenue. East of Winnetka Avenue the SP MTAROW passes behind sports fields to the south and the rear yards of single-family homes continueto line the right-of-way on its north edge. In this visual assessment unit, the SP MTA ROW is a100-foot wide strip of exposed soil with rails, rail ties and no trespassing signs, as in visualassessment unit J, from White Oak Avenue to Reseda Boulevard. There is some vegetationgrowing along property lines along the north edge of the right-of-way.
Residents’ views of the right-of-way are blocked by fences, walls, and mature shrubs and othervegetation. Along the north side of the right-of-way, residential rear yards abut the right-of-way.Residents along the south side of Topham Street view the right-of-way from across two lanes oftraffic.
Immediately west of the developed portion of the right-of-way at Reseda Boulevard, there aretwo mature California pepper trees growing in the right-of-way. There are other mature trees inthe right-of-way, including palms, trees of heaven, grey pinion cypress, ash, and Brazilian peppertrees (see Table 4-17). There are several mature palms in the right-of-way at Victory Boulevard.
There are no visual resources in this visual assessment unit.
m. Visual Assessment Unit M (SP MTA ROW – Winnetka Avenue toVariel Avenue: Pierce College)
Visual Assessment Unit M
Visual QualityViewer Group/
ViewerSensitivity
View Duration VisualResources
High Residents/High Long Fields (PierceCollege Campus)
West of Winnetka Avenue, the SP MTA ROW runs parallel to the north side of 7-lane VictoryBoulevard until west of the proposed De Soto station. To the south of Victory Boulevard lies
Visual and Aesthetic Conditions
page 4-152
Pierce College. Along this portion of the alignment, the right-of-way is exposed soil with railsand little vegetation.
Between Mason and De Soto, southward views from Victory open up across a view of the rollingagricultural fields of Pierce College campus and the Santa Monica mountains to the south.Residents and students are viewers of high sensitivity in this area. Patrons of the commercialstrips to the west of De Soto are viewers of medium sensitivity. Views of the Santa SusanaMountains can be seen to the north along Mason and De Soto Avenues. The right-of-way isvisible from a low-rise building at the southern edge of the Pierce College campus.
The rear yards of single-family homes to the north are shielded by thick vegetation (see Figure 4-6.8). Immediately west of Winnetka Avenue there are mature palms growing in the right-of-way.
Visual resources in this visual assessment unit consist of views of the Pierce College campus.
n. Visual Assessment Unit N (Victory Boulevard – Variel Avenue toOwensmouth Avenue Terminus)
Visual Assessment Unit N
Visual QualityViewer Group/
ViewerSensitivity
View Duration VisualResources
Medium Workers andVisitors/Medium Short None
This segment of the alignment is on street, along Victory Boulevard and Owensmouth Avenue.Large-scale commercial retail and office buildings dominate the visual character of this segmentof the alignment. There is some multifamily housing along Owensmouth Avenue north of ErwinStreet. The terminus is adjacent to the Promenade Mall on Owensmouth Avenue between ErwinStreet and Oxnard Street (see Figure 4-35). Surface parking surrounds the mall.
Viewers in this visual assessment unit are mostly of low or medium sensitivity, with some highsensitivity viewers, and there are no unique or sensitive views or visual features. The SantaSusana and Santa Monica Mountains can be seen from Owensmouth Avenue.
On the east side of Owensmouth Avenue there is an office park with manicured lawns andmature trees adjacent to the street. Owensmouth Avenue is a designated parkway and additionalstreet trees are planned to supplement the existing mature eucalyptus trees that line the street.The Warner Center Specific Plan also calls for the planting of street trees along VictoryBoulevard.
There are no visual resources in this visual assessment unit.


Visual and Aesthetic Conditions
page 4-154
4-6.1.3 Lankershim/Oxnard On-Street Alignment and Weekend ServiceVariation of the BRT on Lankershim/Oxnard
a. Visual Assessment Unit O (Lankershim Boulevard & Oxnard Street)
Visual Assessment Unit O
Visual QualityViewer Group/
ViewerSensitivity
View Duration VisualResources
Medium Workers andVisitors/ Medium Short None
This visual assessment unit describes the On-Street Alignment along Lankershim Boulevard andOxnard Street and the Weekend Service Variation of the BRT along Lankershim/Oxnard. Thereis existing transit service along these streets. Lankershim Boulevard is developed with officeand commercial uses. The visual character along Oxnard Street from Lankershim Boulevard toWoodman Avenue is characterized by a large number of single-family dwellings that face ontothe street, mixed with clusters of multifamily uses. The alignment passes Grant High School,Laurel Hall School, and the campus of Valley College. It also passes the Assemblies of GodChurch at Burbank Boulevard and Lankershim Boulevard. Small commercial buildings arelocated at Laurel Canyon Boulevard and at Woodman Avenue.
Residents of single-family and multifamily dwellings are considered to have high sensitivity, asare students at the three schools. Individuals working in office and commercial buildings are ofmedium sensitivity. Workers and patrons at commercial buildings have low sensitivity. Keyviews of the Santa Monica Mountains and Santa Susana Mountains can be seen alongLankershim Boulevard.
There are existing streetlights providing ambient lighting. Overhead wires and power polesdominate the view along this segment. (See Figure 4-36.)
No visual resources are located in this visual assessment unit.
4-6.1.4 Minimum Operable Segment (MOS)
Under the Minimum Operable Segment (MOS), the alignment of the project would follow the SPMTA ROW in visual assessment units E, F, G, and H. In this alternative, buses traveling inmixed flow traffic would transition from Oxnard Street to the SP MTA ROW at WoodmanAvenue. Buses would leave the SP MTA ROW at Victory Boulevard immediately west ofBalboa Boulevard.


Visual and Aesthetic Conditions
page 4-156
4-6.1.5 Station Areas
a. SP MTA ROW Alignment
North Hollywood
The visual character of the station area is defined by Lankershim and Chandler Boulevards, one-story commercial and industrial uses, and by the Metro Rail Red Line Station. In the right-of-way on the west side of Lankershim Boulevard stands the historic Lankershim rail depot (seeFigure 4-6.10). On the east side of Lankershim Boulevard there are a station portal and a newlylandscaped transit plaza at the Red Line station and there is parking behind the plaza and a busturn-around with access from Fair Avenue, a block east of Lankershim Boulevard. The areasurrounding the station is characterized by Lankershim Elementary School and other public andcommercial uses to the south of the station. To the north of the station, Lankershim Boulevardand Tujunga Avenue are commercial strips with residential areas on smaller streets. The NorthHollywood Park is approximately 800 feet west of the station area. There are mountain views tothe south and east from the station. There are new palm trees planted around the station portal.The entire rail and bus station is currently lit at night. There are no visual resources at thisstation other than the Lankershim depot.
Laurel Canyon
This station would be located in the right-of-way in the Chandler Boulevard median, at theintersection of Chandler Boulevard and Laurel Canyon Boulevard, on both sides of LaurelCanyon Boulevard. The visual character of the intersection is defined by the dual roadways andmedian of Chandler Boulevard, intersecting Laurel Canyon Boulevard, and is dominated by one-story commercial uses, the four three-story Valley Village Senior Apartments, and a four-storyoffice building. In the surrounding area, the visual character is that of a mixed single- andmultifamily residential neighborhood. Highly sensitive land uses include the residential carefacility and the single-family houses. Unique views of the Santa Monica and Santa SusanaMountains can be seen from Laurel Canyon Boulevard. There are were billboards in the right-of-way during the inventory phase of the Draft EIS/EIR which that were are slated for removalremoved by the billboard company companies in August and September 2000. There is noexisting landscaping at the station site. There is one palm tree growing in the right-of-way on thelocation of the westbound station. No lighting fixtures are currently located on the station site.(See Figure 4-37.) There are no visual resources at this station.
Valley College
This station site is at the southeast corner of the intersection of Burbank Boulevard and FultonAvenue (see Figure 4-6.11). The visual character of the immediate station area is characterizedby low-intensity commercial development at the Fulton/Burbank intersection, the parking lot ofthe Valley College campus across the street on the north side of Burbank Boulevard, and autobody shops adjacent to the station south of Burbank Boulevard. There is a lumberyardoccupying a leased portion of the right-of-way on the west side of the intersection, across Fulton


Visual and Aesthetic Conditions
page 4-158
Avenue and Burbank Boulevard from the proposed station. The surrounding neighborhoodconsists primarily of single-family homes on quiet streets and culs de sac. Views of the SantaMonica and Santa Susana Mountains can be seen to the north and south along Fulton Avenue.There are three existing mature trees on the station site. Lighting in the campus parking lot isprovided until approximately 10 p.m. on weekday evenings. No visual resources are present atthis location.
Woodman
The Woodman station would be located in the right-of-way southeast of the intersection ofWoodman Avenue and Oxnard Street. The visual character in the immediate area is defined byWoodman Avenue and Oxnard Street and is dominated by small-scale one-story commercialuses with surface parking, some of which lie in the right-of-way (see Figure 4-38). Two- andthree-story multifamily residential uses extend along the south side of the right-of-way west ofthe station and there are single-family homes along the north side of the right-of-way west of thestation. The visual character within a one-quarter mile radius of the station is dominated bysingle-family residential neighborhoods, with multifamily residential uses clustered alongWoodman Avenue and Oxnard Street. There are mountain views from Woodman Avenue.There are some existing oleander bushes in the right-of-way east of Woodman Avenue and northof Oxnard Street. There are two mature palm trees in the right-of-way west of WoodmanAvenue. There are no visual resources at this station.
Van Nuys
The Van Nuys station site is on the east side of Van Nuys Boulevard, a wide thoroughfare, northof Oxnard Street. The site is currently occupied by a used car lot. South of Oxnard Street aresingle-family residential neighborhoods. However, the visual character of this station area isdominated by adjacent industrial and commercial uses and, to the north, the eight- to ten-storybuildings in the Van Nuys Civic Center. No visually sensitive uses are located in proximity tothe station. Views of the Santa Monica and Santa Susana Mountains can be seen along VanNuys Boulevard. Streetlights on Van Nuys Boulevard create a level of ambient lighting typicalof a major commercial thoroughfare. The portion of the right-of-way on the east side of VanNuys Boulevard that is currently used for automobile storage is lit throughout the nighttimehours. (See Figure 4-39.) No visual resources can be seen from the station site in the right-of-way.
Sepulveda
Large industrial and warehouse uses, a five-story office building, large retail uses, and the single-family Cameron Woods neighborhood characterize the visual environment at the proposedSepulveda station site, which is located in the right-of-way on the west side of SepulvedaBoulevard, a major thoroughfare, just east of I-405 (see Figure 4-39). No high-sensitivity usesare located adjacent to the station. However, there are single-family residences across ErwinStreet from the entrance to the proposed park and ride lot, which is currently used for vehiclestorage. There is an access road, connecting Erwin Street to Sepulveda Boulevard, which passes

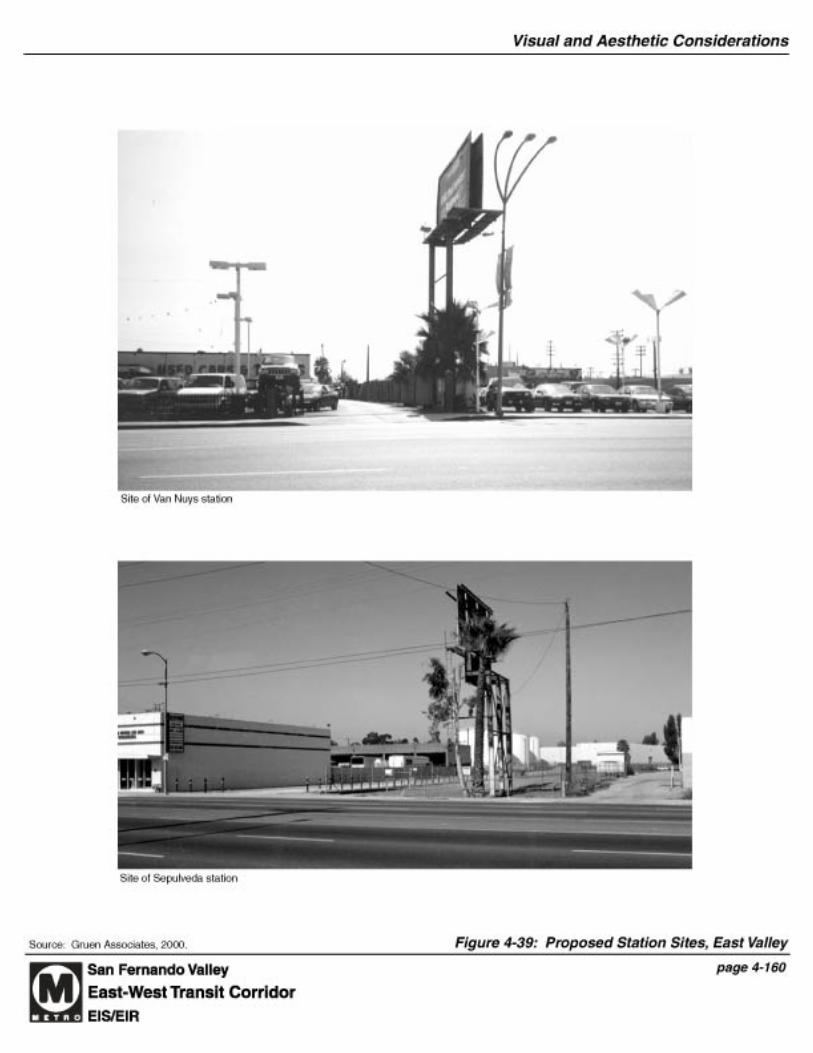

Visual and Aesthetic Conditions
page 4-161
behind the large-scale commercial uses immediately north of the station site. A five-story officebuilding on the southeast corner of Sepulveda Boulevard and the right-of-way represents amedium-sensitivity use within the station area. Views of the Santa Monica and Santa SusanaMountains can be seen along Sepulveda Boulevard. There is one mature palm tree growing onthe station site. No visual resources are located in the station area.
Woodley
This station is located on both the east and west sides of Woodley Avenue in the right-of-wayimmediately south of Victory Boulevard, a major thoroughfare. The visual character of thisstation area is dominated by small-scale one-story commercial uses with surface parking on thenorth side of Victory Boulevard. North of these commercial areas are single-family residentialneighborhoods. To the southwest is a U.S. Army Reserve facility, and beyond that lies access tothe Woodley Golf Course. To the southeast is the Sepulveda Air National Guard station. Thereis a bicycle path between the right-of-way and Victory Boulevard. Views of the Santa MonicaMountains can be seen along Woodley Avenue and across the Recreation Area to the south. TheSanta Susana Mountains are visible to the north along Woodley Avenue. There are mature treesalong the bicycle path on the north side of the right-of-way and along the south edge of the right-of-way, with shrubs and grasses growing in the right-of-way. (See Figure 4-40.) There are novisual resources in the station area.
Balboa
The Balboa station site is located on the south edge of the existing LADOT park and ride lot atthe corner of Balboa and Victory Boulevards (see Figure 4-40), both of which are major streets.The park and ride lot is partially paved, and there are a number of trailers along its south edge.There is some new landscaping and young trees along its north and west edges. South of thepark and ride lot, the rails have been removed from the right-of-way and it is indistinguishablefrom the Sepulveda Dam Recreation Area to its south. The immediate station area is diverse inits visual character. To the northwest of the intersection, mature pine trees partially veil the viewof the bleachers and sports facilities at Birmingham High School. To the northeast is one-storysmall-scale commercial development with surface parking, and multifamily housing alongBalboa Boulevard. Streets off of Balboa Boulevard northeast of the station are of a single-familyresidential character. To the southwest are a group of four-story office buildings with parkingand a row of young crepe myrtle trees along the right-of-way. The bike path along VictoryBoulevard curves south along Balboa Boulevard, which is lined with tall, mature trees souththrough the Sepulveda Dam Recreation Area. Views of the Santa Monica Mountains are visibleto the south across the Recreation Area, and the Santa Susana Mountains can be seen north alongBalboa Boulevard. No visual resources are located in the station area.
Reseda
This station site is located on the northeast corner of the intersection of Reseda Boulevard, amajor thoroughfare, and Oxnard Street. The visual character of this station area is characterizedby one- and two-story commercial structures (see Figure 4-41). A lumberyard and a sash and
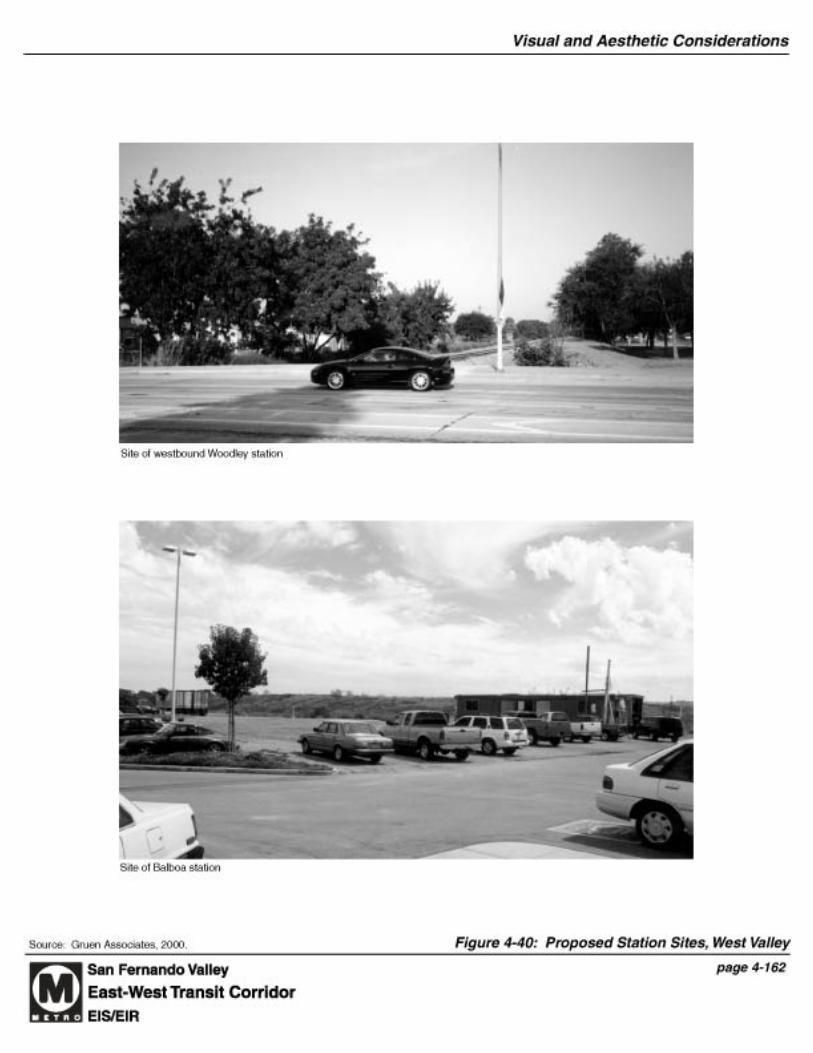

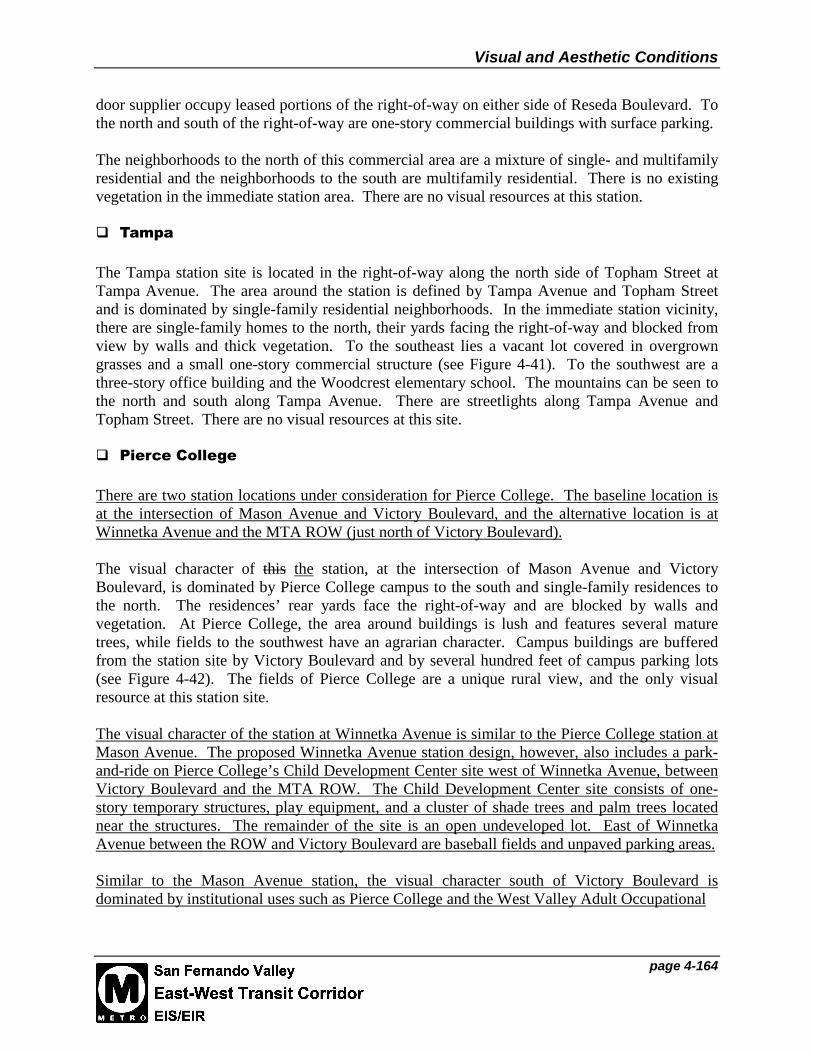
Visual and Aesthetic Conditions
page 4-164
door supplier occupy leased portions of the right-of-way on either side of Reseda Boulevard. Tothe north and south of the right-of-way are one-story commercial buildings with surface parking.
The neighborhoods to the north of this commercial area are a mixture of single- and multifamilyresidential and the neighborhoods to the south are multifamily residential. There is no existingvegetation in the immediate station area. There are no visual resources at this station.
Tampa
The Tampa station site is located in the right-of-way along the north side of Topham Street atTampa Avenue. The area around the station is defined by Tampa Avenue and Topham Streetand is dominated by single-family residential neighborhoods. In the immediate station vicinity,there are single-family homes to the north, their yards facing the right-of-way and blocked fromview by walls and thick vegetation. To the southeast lies a vacant lot covered in overgrowngrasses and a small one-story commercial structure (see Figure 4-41). To the southwest are athree-story office building and the Woodcrest elementary school. The mountains can be seen tothe north and south along Tampa Avenue. There are streetlights along Tampa Avenue andTopham Street. There are no visual resources at this site.
Pierce College
There are two station locations under consideration for Pierce College. The baseline location isat the intersection of Mason Avenue and Victory Boulevard, and the alternative location is atWinnetka Avenue and the MTA ROW (just north of Victory Boulevard).
The visual character of this the station, at the intersection of Mason Avenue and VictoryBoulevard, is dominated by Pierce College campus to the south and single-family residences tothe north. The residences’ rear yards face the right-of-way and are blocked by walls andvegetation. At Pierce College, the area around buildings is lush and features several maturetrees, while fields to the southwest have an agrarian character. Campus buildings are bufferedfrom the station site by Victory Boulevard and by several hundred feet of campus parking lots(see Figure 4-42). The fields of Pierce College are a unique rural view, and the only visualresource at this station site.
The visual character of the station at Winnetka Avenue is similar to the Pierce College station atMason Avenue. The proposed Winnetka Avenue station design, however, also includes a park-and-ride on Pierce College’s Child Development Center site west of Winnetka Avenue, betweenVictory Boulevard and the MTA ROW. The Child Development Center site consists of one-story temporary structures, play equipment, and a cluster of shade trees and palm trees locatednear the structures. The remainder of the site is an open undeveloped lot. East of WinnetkaAvenue between the ROW and Victory Boulevard are baseball fields and unpaved parking areas.
Similar to the Mason Avenue station, the visual character south of Victory Boulevard isdominated by institutional uses such as Pierce College and the West Valley Adult Occupational


Visual and Aesthetic Conditions
page 4-166
Center. The institutional buildings are buffered from the street by Pierce College recreationalfields and parking lots for the Occupational Center. North of the MTA ROW are single-familyresidences, primarily one-story, that are buffered from the MTA ROW by solid walls and tallvegetation. Views of Pierce College from surrounding residential uses are blocked at this site byexisting structures and landscaping. There are no visual resources at this site.
De Soto
At the proposed De Soto station, located at the intersection of De Soto Avenue and VictoryBoulevard, the visual character is varied. To the northwest, multifamily residential dominates.Structures are typically two stories, with no setbacks or vegetation. To the northeast lies asingle-family neighborhood, screened from view by rear yard walls and vegetation. To thesoutheast, the agricultural fields of Pierce College give way to views beyond of the Santa MonicaMountains. To the southwest is a one-story commercial structure with surface parking, withviews of Warner Center to the west. There is some existing vegetation in the right-of-way,including mature palms (see Figure 4-42). The fields of Pierce College are a unique rural viewin this area, and the only important visual resource at this station site.
Warner Center Transit Hub
The proposed west terminus of the project is located on Owensmouth Avenue, between Erwinand Oxnard Streets. There are existing curbside bus stops at this location (see Figure 4-43). Theimmediate station area is commercially oriented, with a mall and surface parking on the westside of Owensmouth Avenue and office buildings with open space and surface parking on theeast side of Owensmouth. North of Erwin Street there is some multifamily housing, however theWarner Center area is predominantly commercial in character. Owensmouth Avenue is aWarner Center Specific Plan-designated parkway, and is planted with mature Red Ironbarkeucalyptus trees.
b. Lankershim/Oxnard On-Street Alignment
Laurel Canyon Boulevard at Oxnard Street
The visual character of this station is established by the older auto-related and other commercialuses at the intersection of Laurel Canyon Boulevard and Oxnard Street, overhead power lines,and the elevated SR 170 Hollywood Freeway (Figure Figure 4-44). The busway in this areawould be on-street and the proposed stations would be similar to those station stops used for theMetro Rapid Bus on Ventura Boulevard. The westbound on-street stop would be on OxnardStreet just west of the SR 170 Hollywood Freeway overpass and the eastbound stop on OxnardStreet just east of the intersection with Laurel Canyon Boulevard.
The visual character of this station is established by Laurel Plaza Shopping Center, SR-170, andLaurel Hall School and Emmanuel Lutheran Church, both of which are on the north side ofOxnard Street to the east of the station at Radford Avenue. The alignment in this area is onstreet, and the proposed station site is currently developed as an LADOT park and ride lot at the


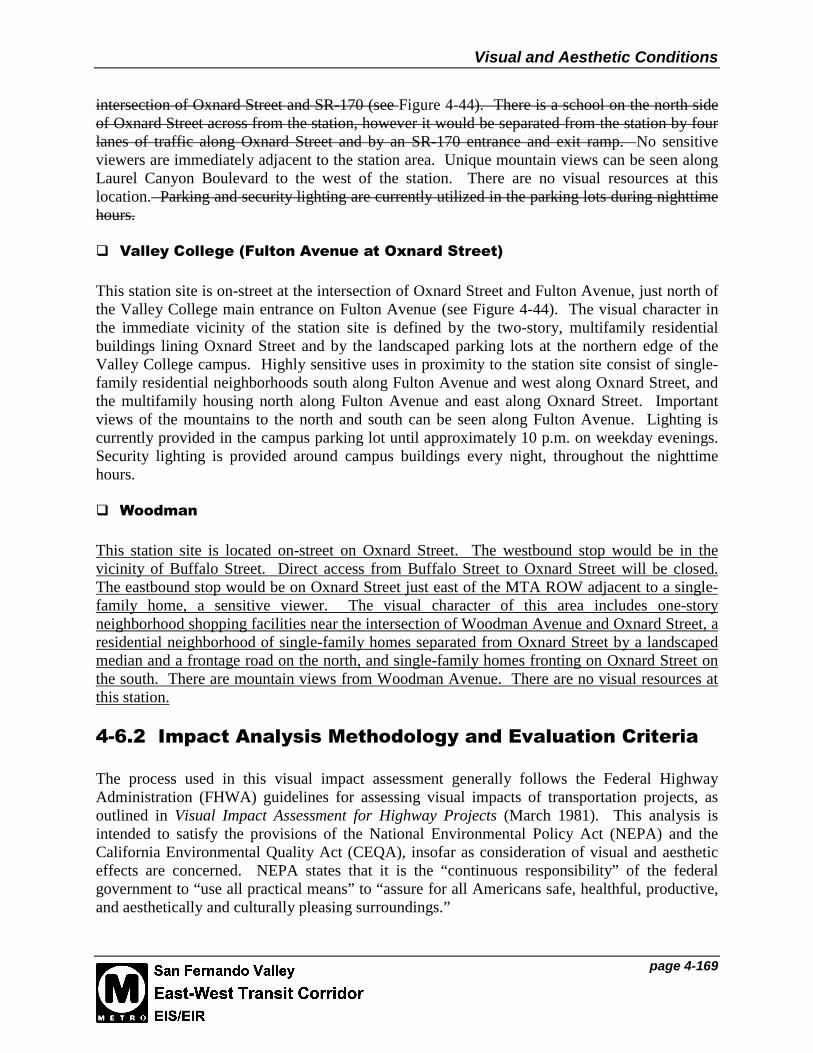
Visual and Aesthetic Conditions
page 4-169
intersection of Oxnard Street and SR-170 (see Figure 4-44). There is a school on the north sideof Oxnard Street across from the station, however it would be separated from the station by fourlanes of traffic along Oxnard Street and by an SR-170 entrance and exit ramp. No sensitiveviewers are immediately adjacent to the station area. Unique mountain views can be seen alongLaurel Canyon Boulevard to the west of the station. There are no visual resources at thislocation. Parking and security lighting are currently utilized in the parking lots during nighttimehours.
Valley College (Fulton Avenue at Oxnard Street)
This station site is on-street at the intersection of Oxnard Street and Fulton Avenue, just north ofthe Valley College main entrance on Fulton Avenue (see Figure 4-44). The visual character inthe immediate vicinity of the station site is defined by the two-story, multifamily residentialbuildings lining Oxnard Street and by the landscaped parking lots at the northern edge of theValley College campus. Highly sensitive uses in proximity to the station site consist of single-family residential neighborhoods south along Fulton Avenue and west along Oxnard Street, andthe multifamily housing north along Fulton Avenue and east along Oxnard Street. Importantviews of the mountains to the north and south can be seen along Fulton Avenue. Lighting iscurrently provided in the campus parking lot until approximately 10 p.m. on weekday evenings.Security lighting is provided around campus buildings every night, throughout the nighttimehours.
Woodman
This station site is located on-street on Oxnard Street. The westbound stop would be in thevicinity of Buffalo Street. Direct access from Buffalo Street to Oxnard Street will be closed.The eastbound stop would be on Oxnard Street just east of the MTA ROW adjacent to a single-family home, a sensitive viewer. The visual character of this area includes one-storyneighborhood shopping facilities near the intersection of Woodman Avenue and Oxnard Street, aresidential neighborhood of single-family homes separated from Oxnard Street by a landscapedmedian and a frontage road on the north, and single-family homes fronting on Oxnard Street onthe south. There are mountain views from Woodman Avenue. There are no visual resources atthis station.
4-6.2 Impact Analysis Methodology and Evaluation Criteria
The process used in this visual impact assessment generally follows the Federal HighwayAdministration (FHWA) guidelines for assessing visual impacts of transportation projects, asoutlined in Visual Impact Assessment for Highway Projects (March 1981). This analysis isintended to satisfy the provisions of the National Environmental Policy Act (NEPA) and theCalifornia Environmental Quality Act (CEQA), insofar as consideration of visual and aestheticeffects are concerned. NEPA states that it is the “continuous responsibility” of the federalgovernment to “use all practical means” to “assure for all Americans safe, healthful, productive,and aesthetically and culturally pleasing surroundings.”

Visual and Aesthetic Conditions
page 4-170
For the following analysis, a visual impact would be considered adverse under NEPA(significant under CEQA) occur if the proposed project:
• Introduces a new visual element that would be incompatible with, or be out of scale withthe existing visual character of the study area.
• Introduces elements that would degrade an important viewshed of highly sensitiveviewers.
• Alters or obstructs the character of key and/or aesthetic views.
• Obstructs the use of existing windows. If the proposed project introduces a physicalstructure so close to a residence or commercial building such that it would completelyeliminate the view from that window, an adverse impact under NEPA (significant impactunder CEQA) would occur regardless of the quality of the view.
• Results in the loss of important or substantial landscape materials, particularly maturetrees.
• Results in light intrusion on residences, increased glare for motorists or pedestrians, orsubstantial shade or shadow on sensitive receptors such as residences, schools, parks, andresidential care facilities.
4-6.3 Impacts
This section describes the impacts the proposed project would have on existing visual andaesthetic conditions along the Transit Corridor. In general, the visual impacts of the BRTAlternative would be minimal. An existing abandoned rail corridor covered in weeds and brokenglass would be landscaped, industrial leases terminated, and a busway and aestheticallyunobtrusive stations constructed. In the following sections, visual impacts are organized by fourareas: (1) general impacts, (2) impacts along the SP MTA ROW alignment, (3) impacts along theLankershim/Oxnard On-Street alignment, and (4) impacts in station areas.
4-6.3.1 General Impacts
a. Compatibility and Views
The proposed project would consist of an at-grade roadway, at-grade crossings, new landscaping,and one-story stations spaced approximately one mile apart. Most elements would be at-gradeand would not materially change the visual character of the area. Introduced elements would notbe visible to highly sensitive viewers nor alter or obstruct the character of key views, includingdistant views of mountains.

Visual and Aesthetic Conditions
page 4-171
In most cases, stations would be located in areas adjoining existing streets with multifamily,commercial, or industrial development and all would be in scale with existing arrangements andwould not obstruct the character of key views. Stations, landscaping, lighting at stations,soundwalls, and street furniture would be the only new vertical elements introduced along theright-of-way. The introduction of these new elements would be compatible with the existingvisual and landscape character of the area. In addition, the conceptual design of the projectalternatives, including landscaping, bike and pedestrian paths, and walls, where appropriate,reduces the potential for visual and aesthetic impacts that are adverse under NEPA (significantunder CEQA).
b. Existing Mature Trees
The construction of the project would result in the loss of up to 420 existing trees. Along theChandler Boulevard median, most mature and recently planted trees would be maintained, withthe exception of some trees in the Chandler Boulevard median that would be removed toaccommodate the transition of the project from an on street alignment to the Chandler Boulevardmedian at Camellia Avenue, and to the off street right-of-way at Ethel Avenue addition of left-turn lanes and the realignment of Chandler Boulevard near Ethel Avenue. Existing eucalyptustrees are already under stress, and some have been recently removed; however, where possible,they those remaining would be preserved. Trees or their root systems may be damaged byconstruction activity, and these would be replaced.
As listed in Table 4-17, portions of the right-of-way contain mature trees that could be affectedby busway construction. These trees are typically located near the edges of the right-of-way.Where the right-of-way passes behind the rear yards of residences, existing trees growing alongthe edge of the right-of-way might need to be removed in order to construct a berm and/or awall/fence. Where feasible, these existing trees would be maintained, particularly where existingtrees are thick enough to adequately buffer adjacent residents from the visual impacts of theproject. Trees removed would be replaced at a minimum 1:1 ratio in the right-of-way. Inindustrial areas, existing trees along the right-of-way generally would be maintained, wherepossible, as additional structural buffers such as a fence or wall would not be necessary inindustrial areas.
Approximately 4,000 trees would be planted along the length of the project, which isconsiderably more than the number of trees which will be removed. These new trees would beplanted in rows, spaced approximately 35 to 40 feet apart, on either side of the right-of-way.
c. Lighting and Glare
The construction of the project would result in the installation of additional lighting at stationareas. There is existing nighttime street lighting at these stations, so impacts would be minimal.Where residential uses are adjacent to station areas, lighting will be designed and placed in sucha way as to minimize glare and nighttime light intrusion on residences. New street trees will beplanted to further minimize the impacts of street lighting at station areas. There will be limitedadditional lighting planned along the right-of-way between station areas. The impact of bus

Visual and Aesthetic Conditions
page 4-172
headlights on residents along the busway will be minimal due to planned landscapeimprovements and fences/walls.
4-6.3.2 SP MTA ROW Alignment
a. Visual Assessment Unit A (Chandler Boulevard – LankershimBoulevard to Camellia Avenue)
East of Camellia Avenue the project could either be on street along the north edge of NorthHollywood Park or within the right-of-way in the Chandler Boulevard median, depending on theNorth Hollywood terminus alternative selected. An on street project would be compatible withthe existing and historic character of Chandler Boulevard as an urban roadway and bus transitline. Approximately 3 eucalyptus trees in the existing grove in the right-of-way median wouldbe removed in order for the project to transition from on street to the median right-of-way. Thehistoric Lankershim Depot is located in this assessment area on North Chandler Boulevard justwest of Lankershim Boulevard. See Section 4-6.3.4 for a discussion of impacts on the historicLankershim Depot. A project in the Chandler Boulevard median would also be compatible withthe historic character of the median as a transportation right-of-way. Any tree removed will bereplaced in the median, where possible. The visual impacts along this segment would not beadverse under NEPA (significant under CEQA).
b. Visual Assessment Units B & C (Chandler Boulevard – CamelliaAvenue to Ethel Avenue)
The MTA currently runs bus service as far west as Whitsett Avenue. Views of the medianproject would be visible across Chandler Boulevard from the commercial/industrial uses to thenorth and from North Hollywood Park to the south. Users of the Park are considered sensitiveviewers along this portion of the alignment. Views of the right-of-way from the Park are filteredby existing street traffic, and new landscaping and new and existing trees would additionallyblock views across Chandler Boulevard.
There are other highly sensitive viewers along this segment, specifically residents of multifamilyand single-family dwellings along Chandler Boulevard across from the median right-of-way,visitors to local religious institutions and users of North Hollywood High School recreationareas. These viewers would have views of the project across Chandler Boulevard, and therewould be at least a 50-foot separation between the viewer and the edges of the project pavement.Existing trees and proposed metal picket wire mesh fences would filter views of the projectacross Chandler Boulevard.
Along the median right-of-way, existing trees would be maintained to the extent possible andlandscaping along the median would be improved. Existing mature eucalyptus trees would bemaintained based on a determination of the health and anticipated future life span of thesemature eucalyptus trees. Recently planted trees along the edges of the right-of-way would bemaintained or replaced in kind if damaged during construction or removed for left-turn lanes.Immediately east of Ethel Avenue, the right-of-way transitions from the median of Chandler

Visual and Aesthetic Conditions
page 4-173
Boulevard to a 100-foot wide strip of land between residential rear yards. Between EthelAvenue and Chandler Boulevard, eleven existing mature trees would need to be removed toaccommodate a berm and/or a fence/wall near the residential rear yards. Existing trees would bemaintained as much as practicable along the rear property lines of residences. Any one treeremoved would be replaced by a new tree in the right-of-way. No adverse visual impacts underNEPA (significant visual impacts under CEQA) would occur in this segment.
c. Visual Assessment Units D & E (SP MTA ROW – Ethel Avenue toHazeltine Avenue)
There are highly sensitive viewers along the lengths of these visual assessment units. The right-of-way passes behind the rear yard fences and walls of single- and multifamily dwellings. Viewsof the right-of-way are blocked by rear yard fences and vegetation in many locations. The upperunits of the multifamily buildings have views into the right-of-way. Existing vegetation wouldbe maintained and landscaping along the project improved to reduce residents’ views of thealignment and improve the aesthetic appearance of the right-of-way. Along both sides of theright-of-way there would be a landscaped berm or a fence/wall to minimize views of the projectand protect residents from noise. In order to construct these buffers in these visual assessmentunits, it would be necessary to remove a number of the existing trees growing in the right-of-way. However, these trees would be replaced to ensure residents’ views of the proposed projectwould be minimized. Visual impacts would not be adverse under NEPA (significant underCEQA).
d. Visual Assessment Units F & G (SP MTA ROW – Hazeltine Avenue toHaskell Avenue)
This portion of the project would travel behind industrial uses to Sepulveda Boulevard, wherethe SP MTA ROW curves northwest behind single-family residences. The existing right-of-wayis typically built-out with commercial/industrial uses. A fence and landscaping would be builtaround park and ride lots to prevent any negative visual impacts in this area. In the single-familyresidential neighborhood just east of I-405, the visual impacts of the project would be minimizedwith the use of a fence/wall and landscaping along the rear of the properties. As fences andwalls already block the views from residences, there would be no adverse visual impacts underNEPA (significant visual impacts under CEQA) in residential areas and there would bebeneficial visual effects under both NEPA and CEQA.
e. Visual Assessment Unit H & I (SP MTA ROW – Haskell Avenue toWhite Oak Avenue)
The proposed project would be compatible with the existing urban character of VictoryBoulevard. There is a bicycle path between the right-of-way and Victory Boulevard, whichwould be maintained. There are no other sensitive uses along this portion of the project. Single-family homes across Topham Street from the right-of-way would be more than 200 feet from theedge of the project pavement. Existing trees would be maintained where possible or replaced

Visual and Aesthetic Conditions
page 4-174
and landscaping improved to remain consistent with the park-like quality of this portion of theright-of-way. Existing native coast live oak trees would not be affected. There would be noadverse visual impacts under NEPA (significant visual impacts under CEQA).
f. Visual Assessment Units J, K & L (White Oak Avenue to WinnetkaAvenue)
This portion of the alignment follows Oxnard and Topham Streets along the rear yard fences andwalls of single-family homes. Space for a A bikeway and pedestrian path would be left along areplanned for the street side of the right-of-way, and would be buffered from the street and projectby new landscaping and trees and a fence/wall along the project. This would minimizepotentially adverse visual impacts under NEPA (potentially significant visual impacts underCEQA) on residences across the street from the right-of-way, along the south side of Oxnard andTopham Streets, Residences along the south side of Oxnard and Topham Streets would be morethan 100 feet from the project. Along the north side of the right-of-way, a landscaped bermand/or a fence/wall and trees would minimize views from residences along the north side of theright-of-way. Existing vegetation is thick along the north side of the right-of-way, and would bemaintained where possible. Where existing trees would be removed, to buffer residents’ viewsof the project, the removed trees will be replaced by at least three new trees in the right-of-way.Visual impacts would not be adverse under NEPA (significant under CEQA).
g. Visual Assessment Unit M (SP MTA ROW – Winnetka Avenue toVariel Avenue: Pierce College)
This portion of the project follows Victory Boulevard, continuing along the rear yard walls ofsingle-family residences to the north of the project. Victory Boulevard is a busy road with sixlanes of traffic and the project is compatible with the existing character. Residents’ views ofVictory Boulevard and of the right-of-way would be blocked by the existing thick vegetationalong the rear yard walls. Existing mature trees would be maintained or if removed, replaced bynew trees. New trees, and a landscaped berm/fence/wall would further minimize views fromsingle-family residences along the north side of the right-of-way. The users of Pierce College tothe south across Victory Boulevard are considered sensitive viewers, however their views of theproject would be blocked by existing mature trees along Victory Boulevard, new trees, and bythe width of the Boulevard itself. Visual impacts would not be adverse under NEPA (significantunder CEQA).
h. Visual Assessment Unit N (Victory Boulevard – Variel Avenue toOwensmouth Avenue Terminus)
In this visual assessment unit the project would leave the right-of-way and buses would travel onstreet along Victory Boulevard and Owensmouth Avenue to the terminus at the Warner CenterTransit Hub. Land uses along this portion of the alignment are predominantly commercial, withmalls, large-scale retail, office buildings, and multifamily housing, thus there are few viewers of

Visual and Aesthetic Conditions
page 4-175
high sensitivity in the area. The project is consistent with existing traffic conditions in this area.Visual impacts would not be adverse under NEPA (significant under CEQA).
4-6.3.3 Lankershim/Oxnard On-Street Alignment
a. Visual Assessment Unit O (Lankershim Boulevard & Oxnard Street–Chandler Boulevard to Woodman Avenue)
In this visual assessment unit the project would run on street with other traffic. There is existingtransit service along this alignment. Viewers along this segment are of varying sensitivity. Highsensitivity viewers include users of educational institutions along the alignment and theinhabitants of the single and multifamily uses that predominate along Oxnard Street. There arealso clusters of commercial and office uses along Lankershim Boulevard and at SR-170.Lankershim Boulevard and Oxnard Street are busy streets with four lanes of traffic and existingbus service, therefore a project would be compatible with current conditions. Visual impactsalong this alignment would not be adverse under NEPA (significant under CEQA).
4-6.3.4 Station Areas
Stations would be constructed at-grade, and would feature one-story station structures that are 15feet wide and 12 feet high, new landscaping, and new nighttime lighting. The change on existingaesthetic conditions would be minimal. Conceptual station plans and descriptions can be found inChapter 2. Station-specific visual impacts are described below.
a. North Hollywood
The project would terminate at Lankershim Boulevard, west of the existing North HollywoodRed Line station. Visual impacts would not be adverse under NEPA (significant under CEQA),due to the existing transit and commercially oriented nature of the area. The design of the NorthHollywood BRT station and turnaround adjacent to the historic Lankershim Depot is beingcoordinated closely with the City of Los Angeles Community Redevelopment Agency. Thedesign takes into account the historic facility. The proposed bus turnaround would beconstructed north of the Depot. An existing track along the north side of the depot would be leftin place, and CRA/MTA plans for restoration of the Depot (as a separate project) andlandscaping of the southeast corner of the site similar to a previous open space on the site areshown on the plan drawings. Fixed station elements such as canopies and ticket vendingmachines would not be placed directly in front of the Depot, and would not block views of theDepot. Lighting is currently provided to the entire site. Considering the existing transit use andcommercially oriented nature of the area, and given incorporation of the historic LankershimDepot into the station design, visual impacts would not be adverse under NEPA (significantunder CEQA).
b. Laurel Canyon
There would be east- and westbound stations located in the median at the intersection of LaurelCanyon and Chandler Boulevards. The stations would consist of platforms and landscaping to

Visual and Aesthetic Conditions
page 4-176
buffer the station from surrounding commercial and residential uses. The westbound stationwould be across Chandler Boulevard from a residential care facility. Residents would haveviews of the station across the width of Chandler Boulevard. Additional trees and landscapingwould minimize visual impacts at this station, making them not adverse under NEPA (notsignificant under CEQA).
c. Valley College
The Valley College station would be located at the intersection of Fulton Avenue and BurbankBoulevard. The westbound bus shelter would be separated from the street and adjacentcommercial uses by the LADOT-planned bikeway and pedestrian path, a transit plaza, andlandscaping. A transit plaza and new landscaping would separate the eastbound station fromadjacent uses. The visual impacts at this station would be not adverse under NEPA (notsignificant under CEQA), as the station would correspond to the existing character, there are noviewers of high sensitivity, and the landscaping of the area would be improved.
d. Woodman
Both platforms of this station would be located in the right-of-way immediately south of OxnardStreet adjacent to commercial uses on the west and single family homes on the east. There aretwo single-family residential rear yards approximately 40 feet from the westbound shelter. Thevisual impacts would be minimal due to the existing commercial orientation of the intersectionand to the planned landscape improvements and noise mitigation, which would buffer residentialareas from the station.
e. Van Nuys
The Van Nuys station would be located on the east side of Van Nuys Boulevard in the right-of-way. The westbound shelter would be separated from commercial uses to the north by theLADOT-planned bikeway and pedestrian path. The eastbound shelter would be adjacent to atransit plaza along Aetna Street. There would be parking lots at the northwest corner of theright-of-way and Van Nuys Boulevard for two blocks along Bessemer Street and to the east ofthe transit plaza along Aetna Street to Tyrone Avenue. The areas adjacent to the station areentirely commercial in use. There are no viewers of high sensitivity in this area. Theimprovements to the landscaping and streetscape are in keeping with the Van Nuys Civic Centeruses to the north and would replace existing used car lots. The visual effects would bebeneficial.
f. Sepulveda
The station at Sepulveda Boulevard would be located on the west side of the SepulvedaBoulevard, adjacent to the proposed park-and-ride facility, and approximately 600 feet west ofthe street. A large park and ride lot would be located northwest of the station, between the right-of-way and Erwin Street. There are single-family homes across Erwin Street from the park andride lot, which is currently a commercial parking lot and storage facility. A 20-foot landscaped

Visual and Aesthetic Conditions
page 4-177
buffer area and possible a soundwall along the north edge of the parking lot would create an over50 foot separation between buffer the parking lot and from single-family homes. Other adjacentuses are commercial and industrial. The access road along the north side of the station would bemaintained. There would be no adverse impacts under NEPA (significant impacts underCEQA).
g. Woodley
This station would be located on both the east and west sides of Woodley Avenue, in the right-of-way south of Victory Boulevard. The platforms would be separated from the existing bicyclepath by approximately 10 to 30 feet of landscaping, and from the Sepulveda Basin byapproximately five feet of landscaping and trees. Due to the planned landscape improvementsand the existing character of the intersection, with its lack of high-sensitivity viewers, therewould be no adverse visual impacts under NEPA (significant visual impacts under CEQA) at thisstation.
h. Balboa
This station would be located on the east side of Balboa Boulevard in the right-of-way south ofthe existing park and ride lot. The closest sensitive viewers to the station site are office workerson the west side of Balboa Boulevard across the street from the station area. The station wouldbe located 350 feet east of Balboa Boulevard (or directly adjacent to Balboa Boulevard) andwould be landscaped, so there would be no adverse visual impacts under NEPA (significantvisual impacts under CEQA) at this location.
i. Reseda
The Reseda Boulevard station would be located just north of the intersection of ResedaBoulevard and Oxnard Street. The surrounding area is entirely industrial and commercial incharacter, so there are no sensitive viewers. The east- and westbound platforms would belocated of the east and west sides of Reseda, respectively, with landscaped transit plazas to thenorth and south. North of the eastbound station, the transit plaza would be adjacent to anexisting carwash. The transit plaza on the south side of the station would extend to OxnardStreet. Across Oxnard Street from the transit plaza site are existing commercial uses. Due to thecurrent density of development and lack of any vegetation, the project station would provide avisual improvement at this location.
j. Tampa, Pierce College, and De Soto
These three stations would be configured identically. The east- and westbound shelters would belocated in the right-of-way on the east and west sides, respectively, of Tampa, Pierce College atMason, and De Soto Avenues. The westbound shelter, like the length of the project in this area,would be buffered from the residential areas to the north by a berm or a fence/wall and new treesand landscaping. There would be approximately 10 to 15 feet of new landscaping and afence/wall to buffer the westbound platform from residential areas to the north a soundwall

Visual and Aesthetic Conditions
page 4-178
located at the rear of the station on the property line. This soundwall would shade the rear yardsof the adjacent residences; however, since a relatively tall wall already exists at or near the rearof residences at the property line, impacts would not be adverse or significant. The eastboundplatform would be separated from Topham Street and Victory Boulevard by the LADOT-planned bikeway and pedestrian path and additional landscaping. Due to the urban character ofVictory Boulevard and the existing and proposed walls and vegetation shielding the homes nearthe intersections from view, there would be no adverse visual impacts under NEPA (significantvisual impacts under CEQA) at these locations.
The Pierce College station includes an alternative station location under consideration at theintersection of Winnetka Avenue and the MTA ROW. A landscaped park-and-ride lot, to belocated west of Winnetka Avenue on the site of the Child Development Center (which would berelocated), is proposed for this station. At this station, the eastbound and westbound shelterswould be located on the east and west side of Winnetka Avenue, respectively. The station areasand busway would be buffered from the residential areas to the north by a wall and landscaping.Along the ROW and the eastbound station there would be approximately 15 feet of newlandscaping to buffer the residential areas to the north, and approximately 5 feet of landscapingat the westbound station. Landscaping would also be provided on the south side of the ROW andin the park-and-ride lot. Due to the existing and proposed walls and vegetation shielding thehomes near the intersections from view, there would be no adverse visual impacts under NEPA(no significant visual impacts under CEQA) at the Winnetka station site.
k. Warner Center Transit Hub
This on street station is being designed and constructed by the LADOT. Curbside bus stops willbe similar to those in use now. Owensmouth Avenue, a designated transit parkway, would notbe negatively affected by the introduction of bus service from the East-West Transit Corridor.
4-6.4 Mitigation Measures
Although not required to reduce visual impacts, the following mitigation measures are proposedto further enhance visual compatibility.
4-6.4.1 SP MTA ROW Alignment
V&A-1: Prior to construction, aA certified arborist shall be has been retained to conduct athorough inspection of the eucalyptus trees located between the North HollywoodMetro Rail Station and Coldwater Canyon Avenue to determine the condition,quality, and estimated life span of the trees and to identify measures that should betaken in the engineering and construction phases to ensure that the trees would bepreserved. This report shall be submitted to the MTA Planning and ConstructionDivisions, and the City of Los Angeles Department of Public Works, Street TreeDivision. In the event that the arborist or project engineers determine thatimplementation of the project would prevent preservation of the trees, or that thehealth of the trees necessitates their removal, the trees shall be replaced in the

Visual and Aesthetic Conditions
page 4-179
Chandler Boulevard median with trees of similar qualities (evergreen, vertical, fast-growing) of 24-inch box size or greater at the rate of one new tree for each treeremoved.
V&A-2: During the preliminary engineering and final design Design/Build phases, thealignment of the busway, as well as and placement of elements such as soundwalls,fences, and berms, should that have been developed in Preliminary Engineering willbe followed, and the project will continue to take into account existing mature trees inthe right-of-way and avoid necessitating their removal where possible.
V&A-3: The following Metro Art policies will be applied:
• Public Art and the Design Process: As part of the Design/Build process, ofdesigning any of the alternatives, artists will be hired to participate in the project.Metro Art staff will invite interested members of the communities (residential,business, and institutional) along the alignment to form a Metro Art AdvisoryGroup. This process of community participation follows FTA policy (Circular9400.1A), which states: “To create facilities that are integral components ofcommunities, information about the character, makeup, and history of theneighborhood should be developed and local residents and businesses could beinvolved in generating ideas for the project.”
A budget will be established for public art that will be based on a percentage ofthe hard costs (construction costs) for the project and will cover design fees andfabrication and installation of art elements. Again, as directed by the FTA(Circular 9400.1A), “Funds spent on the art component of the project should beappropriate to the overall costs of the transit project and adequate to have animpact.”
• Design Excellence: Following policy established by the FTA for design and artin transit projects (Circular 9400.1A), MTA commits to the idea that: “Gooddesign and art can improve the appearance and safety of a facility, give vibrancyto its public spaces, and make patrons feel welcome. Good design and art willalso contribute to the goal that transit facilities help to create livablecommunities.” To continue its commitment to these ideals, design excellence willbe an important criterion for selection of design team members and for evaluationof design proposals.
To ensure design excellence, the MTA will follow the award-winning model for“Excellence in Public Architecture” established by the General ServicesAdministration of the U.S. Government. That process attracts large numbers ofqualified design firms through a streamlined process and utilizes the insight ofoutside peer advisors.

Visual and Aesthetic Conditions
page 4-180
• Graphics and Wayfinding: The quality of graphic signage and wayfindingwithin the system and within the adjacent neighborhoods greatly affects the easeand comfort with which patrons will use the system. Station names, stationidentification, directional signage, logos, maps, and informational signage shalladhere to the MTA Graphics Standards. The guiding principles for the standardsare to simplify Metro signage systems in a way that makes sense for patrons,using uniformity in text styles, a rational hierarchy of sign sizes, clear directionalarrows, etc.
4-6.4.2 Lankershim / Oxnard On-Street Alignment and WeekendService on Lankershim/Oxnard
No additional mitigation measures are required. However, along the portion of this alignmentthat does run within the SP MTA ROW (from Woodman Avenue to Warner Center), themeasures described above in Section 4-6.4.1 would be implemented.
The Lankershim/Oxnard Weekend Service Option would also require no additional mitigationmeasures. As an enhancement, some additional street trees would be planted along OxnardStreet.
4-6.4.3 Station Areas
No mitigation measures are required.

Air Quality
page 4-181
4-7 AIR QUALITY
4-7.1 Setting
Regulatory Setting
Air quality in the United States is governed by the Federal Clean Air Act (CAA) and isadministered by the United States Environmental Protection Agency (USEPA). In addition tobeing subject to the requirements of the CAA, air quality in California is also governed by themore stringent regulations under the California Clean Air Act (CCAA).
The CCAA of 1988 requires all air districts in the State to endeavor to achieve and maintainState Ambient Air Quality Standards. The CCAA is administered statewide by the CaliforniaAir Resources Board (CARB). The State of California has established ambient air qualitystandards, known as the California Ambient Air Quality Standard (CAAQS). These standardsare generally more stringent than the corresponding federal standards and incorporate additionalstandards for sulfates, hydrogen sulfates, hydrogen sulfide, vinyl chloride and visibility reducingparticles. California has established CARB to regulate mobile air pollution sources (such asmotor vehicles). CARB also oversees the functions of local air pollution control districts and airquality management districts, which in turn administer air quality activities at the regional andcounty level. The CCAA is administered by CARB at the state level and by the Air QualityManagement Districts at the regional level.
n U.S. Environmental Protection Agency
USEPA is responsible for establishing the National Ambient Air Quality Standards (NAAQS)and enforcing the Clean Air Act. It also regulates emission sources that are under the exclusiveauthority of the federal government, such as aircraft, ships, and certain types of locomotives.The USEPA has jurisdiction over emission sources outside state waters (e.g., beyond the outercontinental shelf) and establishes various emission standards, including those for vehicles sold instates other than California. Automobiles sold in California must meet the stricter emissionstandards established by CARB.
n California Air Resources Board
CARB, which became part of the California Environmental Protection Agency (CalEPA) in1991, is responsible for ensuring implementation of the California Clean Air Act, meeting staterequirements of the federal Clean Air Act, and establishing state ambient air quality standards. Itis also responsible for setting emission standards for vehicles sold in California and for otheremission sources, such as consumer products and certain off-road equipment. CARB alsoestablished passenger vehicle fuel specifications, which became effective in March 1996.

Air Quality
page 4-182
n Non-attainment and State Implementation Plans
CARB designates an area as non-attainment for a pollutant if air quality data show that a Statestandard for a pollutant was violated at least once during the previous three calendar years.Exceedances that are affected by highly irregular or infrequent events are not consideredviolations of a State standard, and are not used as a basis for designating areas as non-attainment.
On the basis of regional monitoring data, the Los Angeles County portion of the South Coast AirBasin has been designated as a non-attainment area for ozone, carbon monoxide, and totalsuspended particulates (PM10). The air basin is designated as an attainment area for nitrogenoxide, sulfur dioxide, sulfates, and lead.7
Federal clean air laws require areas with unhealthy levels of ozone, carbon monoxide, nitrogendioxide, sulfur dioxide, and inhaleable particulate matter to develop plans, known as StateImplementation Plans (SIPs), describing how they would attain national ambient air qualitystandards (NAAQS). The 1992 amendments to the federal Clean Air Act set new deadlines forattainment based on the severity of the pollution problem and launched a comprehensiveplanning process for attaining the NAAQS.
SIPs are not single documents; rather, they are a compilation of new and previously submittedplans, programs (such as monitoring, modeling, permitting, etc.), district rules, state regulations,and federal controls. Many of California’s SIPs rely on the same core set of control strategies,including emission standards for cars and heavy trucks, fuel regulations, and limits on emissionsfrom consumer products. State law makes CARB the lead agency for all purposes related to theSIP. Local air districts and other agencies, such as the Bureau of Automotive Repair, prepareSIP elements and submit them to CARB for review and approval. CARB forwards SIP revisionsto USEPA for approval and publication in the Federal Register. The Code of FederalRegulations (CFR) Title 40, Chapter 1, Part 52, Subpart F, Section 52.220 lists all of the itemsthat are included in the California SIP. Many additional California submittals are pendingUSEPA approval.
n South Coast Air Quality Management District
In order to coordinate air quality planning efforts throughout southern California, the SouthCoast Air Quality Management District (SCAQMD) was created by the 1977 Lewis Air QualityManagement Act, which merged four county air pollution control agencies into one regionaldistrict to better address the issue of improving air quality in Southern California. Under the act,renamed the Lewis-Presley Air Quality Management Act in 1988, the SCAQMD is the agencyprincipally responsible for comprehensive air pollution control in the Basin. Specifically, theSCAQMD is responsible for monitoring air quality and planning, implementing, and enforcingprograms designed to attain and maintain state and federal ambient air quality standards in the
7 California Air Resources Board: Proposed Amendments to the Designation Criteria and Amendments to the AreaDesignations for State Ambient Air Quality Standards and Proposed Maps of the Area Designations for the Stateand National Ambient Air Quality Standards, September 2000.
Air Quality
page 4-183
district. Programs developed include air quality rules and regulations that regulate stationarysource emissions, including area sources and point sources and certain mobile source emissions.The SCAQMD is also responsible for establishing permitting requirements for stationary sourcesand ensuring that new, modified, or relocated stationary sources do not create net emissionsincreases and, therefore, is consistent with the region’s air quality goals. The SCAQMDenforces air quality rules and regulations through a variety of means, including inspections,educational or training programs, or fines, when necessary.
The SCAQMD has jurisdiction over a 10,743 square mile area, commonly referred to as theSouth Coast Air Basin (SCAB). This area includes all of Orange County, Los Angeles County,except for the Antelope Valley, the non-desert portion of western San Bernardino County, andthe western and Coachella Valley portions of Riverside County. The SCAB is bounded by thePacific Ocean to the west; by the San Gabriel, San Bernardino, and San Jacinto mountains to thenorth and the east; and by the San Diego County line to the south (see Figure 4-45).
n Air Quality Management Plan
Within the project area, the SCAQMD and the Southern California Association of Governments(SCAG) have responsibility for preparing the Air Quality Management Plan (AQMP), whichaddress federal and state Clean Air Act requirements. The AQMP details goals, policies, andprograms for improving air quality and establishes thresholds for daily operation emissions.Environmental review of individual projects within the region must demonstrate that dailyconstruction and operational emissions thresholds, as established by the SCAQMD, would not beexceeded, nor would the number or severity of existing air quality violations.
In August of 1996, the SCAQMD submitted its AQMP to CARB for inclusion in the SIP. Asmentioned earlier, the AQMP also meets CCAA requirements. The AQMP addressed CCAArequirements, which are intended to bring the SCAQMD into compliance with federal and stateair quality standards. The AQMP focused on ozone and carbon monoxide emissions, whichwould be reduced through public education, vehicle and fuel management, transportationcontrols, indirect source controls, and stationary source controls programs.
The 1997 Draft AQMP has been prepared to reflect the requirements of the 1990 Clean Air ActAmendments and is consistent with the approaches taken in the 1994 AQMP. The Plan isexpected to replace, in part or in whole, many of the proposed measures set forth in the SIP andanticipates the attainment of all pollutants by 2010.
The overall control strategy of the 1997 AQMP was to meet applicable state and federalrequirements and to demonstrate attainment with ambient air quality standards. The 1997AQMP is the first plan required by the federal law to demonstrate attainment of the federal PM10
ambient air quality standards, and therefore, places a greater focus on PM10.
n National and State Ambient Air Quality Standards
As required by the Clean Air Act, National Ambient Air Quality Standards (“NAAQS”) havebeen established for six major air pollutants: carbon monoxide (CO), nitrogen oxides (NOx),ozone (O3), particulate matter smaller than 10 microns (PM10), sulfur oxides (SOx), and lead.


Air Quality
page 4-185
The State of California has also established ambient air quality standards, known as theCalifornia Ambient Air Quality Standards (CAAQS). These standards are generally morestringent than the federal standards and incorporate additional standards for sulfates, hydrogensulfide, vinyl chloride and visibility reducing particles. Because the CAAQS are more stringentthan the NAAQS, they are used as the comparative standard in the analysis contained in thisreport.
Both State and Federal standards are summarized in Table 4-18. The “primary” standards havebeen established to protect the public health. The “secondary” standards are intended to protectthe nation’s welfare and account for air pollutant effects on soil, water, visibility, materials,vegetation and other aspects of the general welfare.
Table 4-18: Federal and California Ambient Air Quality Standards
California Standard1 Federal Standards2
Pollutant AveragingPeriod Concentration3 Primary3, 4 Secondary3, 5
1 hour 0.09 ppm (180 µg/m3)0.12 ppm (235
µg/m3)6Same as Primary
StandardOzone (O3)
8 hour --0.08 ppm (157
µg/m3)Annual
GeometricMean
30 µg/m3 -- Same as PrimaryStandard
24 hour 50 µg/m3 150 µg/m3RespirableParticulateMatter (PM10) Annual
ArithmeticMean
-- 50 µg/m3
24 hour No Separate Standard 65 µg/m3 Same as PrimaryStandardFine
ParticulateMatter (PM2.5)
AnnualArithmetic
Mean15 µg/m3
8 hour 9.0 (10 mg/m3) 9.0 (10 mg/m3) None
1 hour 20 ppm (23 mg/m3) 35 ppm (40mg/m3)
CarbonMonoxide(CO)
8 hour (LakeTahoe)
6 ppm (7 mg/m3) --
AnnualArithmetic
Mean--
0.053 ppm (100µg/m3)
Same as PrimaryStandardNitrogen
Dioxide (NO2)1 hour 0.25 ppm (470 µg/m3) --Annual
ArithmeticMean
--0.030 ppm (80
µg/m3)--
24 hour 0.04 ppm (105 µg/m3)0.14 ppm (365
µg/m3)--
3 hour -- -- 0.5 ppm (1300 µg/m3)
Sulfur dioxide(SO2)
1 hour 0.25 ppm (655 µg/m3) -- --30 daysaverage 1.5 µg/m3 -- --
LeadCalendarQuarter -- 1.5 µg/m3 Same as Primary
Standard

Air Quality
page 4-186
Table 4-18: Federal and California Ambient Air Quality Standards
California Standard1 Federal Standards2
Pollutant AveragingPeriod Concentration3 Primary3, 4 Secondary3, 5
VisibilityReducingParticulates
8 hour (10am to 6 pm,
PST)
In sufficient amount toproduce an extinctioncoefficient of 0.23 perkilometer—visibility of tenmiles or more (0.07-30 milesor more for Lake Tahoe) dueto particles when the relativehumidity is less than 70percent.
No Federal Standards
Sulfates 24 hour 25 µg/m3
HydrogenSulfide 1 hour 0.03 ppm (42 µg/m3)
Notes:1. California standards for ozone, carbon monoxide (except Lake Tahoe), sulfur dioxide (1 and 24 hour),nitrogen dioxide, suspended particulate matter—PM10, and visibility-reducing particles, are values that are not tobe exceeded. All others are not to be equaled or exceeded.2. National standards (other than ozone, particulate matter, and those based on annual averages or annualarithmetic mean) are not to be exceeded more than once a year. The ozone standard is attained when the fourthhighest 8-hour concentration in a year, averaged over three years, is equal to or less than the standard. For PM10,the 24-hour standard is attained when 99 percent of the daily concentrations, averaged over three years, are equalto or less than the standard. For PM2.5, the 24-hour standard is attained when 98 percent of the dailyconcentrations, averaged over three years, are equal to or less than the standard.3. Concentration expressed first in units in which it was promulgated. Equivalent units given in parentheses arebased upon a reference temperature of 2°C and a reference pressure of 760 mm of mercury. Most measurementsof air quality are to be corrected to a reference temperature of 25°C and a reference pressure of 760 mm ofmercury (1,013.2 millibar); ppm in this table refers to ppm by volume, or micromoles of pollutant per mole of gas.4. National Primary Standards: The levels of air quality necessary, with an adequate margin of safety toprotect the public health.5. National Secondary Standards: The levels of air quality necessary to protect the public welfare from any knownor anticipated adverse effects of a pollutant.6. New federal 1-hour ozone and fine particulate matter standards were promulgated by U.S. EPA on July18,1997. The federal 1-hour ozone standard continues to apply in areas that violated the standard.
Source: California Air Resources Board, Federal and State Air Quality Standards 1999 (1/25/99).
Regional Setting
The proposed project is located within the Los Angeles County portion of the SCAB. Ambientpollution concentrations recorded in the Los Angeles County are among the highest in the fourcounties comprising the Basin. The SCAB is an area of high air pollution potential due to itsclimate and topography. The Basin experiences warm summers, mild winters, infrequentrainfalls, light winds, and moderate humidity. In addition, the mountains and hills within thearea contribute to the variation of rainfall, temperature, and winds throughout the region. Theregion experiences frequent temperature inversions-temperature typically decreases with height;however, under inversion conditions, temperature increases as altitude increases and prevents airclose to the ground from mixing with the air above it. As a result, air pollutants are trapped nearthe ground. During the summer, air quality problems are created due to the interaction betweenthe ocean surface and lower layer of the atmosphere, which creates a moist marine layer. Anupper layer of warm air mass forms over the cool marine layer, preventing air pollutants fromdispersing upward.

Air Quality
page 4-187
In addition, hydrocarbons, ozone (O3), and nitrogen dioxide (NO2) react under strong sunlight,creating pollution, commonly referred to as “smog.” Light, daytime winds, predominantly fromthe west, further aggravate the condition by driving the air pollutants inland, toward themountains.
During the fall and winter, air quality problems are created due to carbon monoxide (CO) andnitrogen dioxide emissions. High nitrogen dioxide levels usually occur during autumn or winter,on days with summer-like conditions. Since CO is produced almost entirely from automobiles,the highest CO concentrations in the SCAB are associated with heavy traffic.
n Pollutants and Effects
Air quality studies focus on the following five criteria pollutants: ozone, carbon monoxide,nitrogen dioxide, sulfur dioxide (SO2), and respirable particulate matter (PM10).
Ozone. Ozone (O3) is a colorless gas and is the chief component of urban smog. Ozone impactslung function by irritating and damaging the respiratory system. In addition, ozone causesdamage to vegetation, buildings, rubber, and some plastics (California Air Resources BoardAlmanac, 1999). Ozone is one of a number of substances called photochemical oxidants that areformed when reactive organic compounds (ROC) and nitrogen oxides (precursor emissions),both byproducts of the internal combustion engine, react in the presence of ultraviolet sunlight.Ozone is present in relatively high concentrations within the Basin, and the damaging effects ofphotochemical smog are generally related to the concentrations of ozone. (SCAQMD, 1993).Meteorology and terrain play major roles in ozone formation. Generally, low wind speeds orstagnant air coupled with warm temperatures and cloudless skies provide for the optimumconditions.
Carbon Monoxide. Carbon monoxide (CO) is a gas that, in the human body, interferes with thetransfer of oxygen to the blood. It can cause dizziness and fatigue, and can impair centralnervous system functions. CO is a product of incomplete combustion emitted, along with carbondioxide, by motor vehicles, power plants, refineries, industrial boilers, ships, aircraft, and trains.In urban areas, CO is emitted primarily by automobiles, trucks, and motorcycles. CO is anonreactive air pollutant that dissipates relatively quickly, so ambient carbon monoxideconcentrations generally follow the spatial and temporal distributions of vehicular traffic. COconcentrations are influenced by local meteorological conditions, primarily wind speed,topography, and atmospheric stability. When surface-based temperature inversions arecombined with calm atmospheric conditions, a typical situation at dusk in urban areas betweenNovember and February, CO from motor vehicle exhaust can become locally concentrated. Thehighest CO concentrations measured in SCAB are typically recorded during the winter.
Nitrogen Dioxide. Nitrogen dioxide (NO2) is a byproduct of fuel combustion. The principalform of nitrogen oxide produced by combustion is nitric oxide (NO), but NO reacts quickly toform NO2, creating the mixture of NO and NO2 commonly called NOx. Nitrogen dioxide acts asan acute irritant and, in higher concentrations is more injurious than NO. There is someindication of a relationship between NO2 and chronic pulmonary fibrosis. Some increase inbronchitis in children (2 to 3 years old) has also been observed at concentrations below 0.3 parts

Air Quality
page 4-188
per million (ppm). Nitrogen dioxide absorbs blue light; the result is a brownish-red cast to theatmosphere and reduced visibility. NO2 also contributes to the formation of PM10 (SCAQMD,1993).
Sulfur Oxides. SO2 is a human respiratory irritant. It also combines with moisture in theatmosphere to form sulfuric acid, which, in turn, damages vegetation and slowly erodes theexterior facades of buildings and other structures in urban areas. Sulfur oxides (SOx), primarilysulfur dioxide (SO2), are a product of combustion of high-sulfur fuels, such as many grades ofcoal and oil. In recent years, restrictions on the use of high-sulfur fuels and other air pollutioncontrol measures have substantially reduced ambient concentrations of SO2 throughout the U.S.SO2 concentrations have been reduced to levels well below state and national standards, butfurther reductions in emissions are needed to attain compliance with standards for sulfates andPM10, of which SO2 is a contributor.
Suspended Particulate Matter. Suspended, or respirable, particulate matter (PM10) consists ofsuspended particles less than 10 microns in diameter. Particulates in this size category can beinhaled, irritating the human respiratory tract and aggravating pre-existing respiratory disease.Very small particles of substances such as lead, sulfates, and nitrates can cause lung damagedirectly, can be absorbed into the blood stream and cause damage elsewhere in the body, and cantransport absorbed gases, such as chlorides or ammonium, into the lungs and cause injury.Particulates also damage and discolor surfaces on which they settle, and reduce regionalvisibility.
Particulates in the atmosphere result from natural sources, such as wind erosion and ocean spray,and from human activities. Man-made sources include many types of dust- and fume-producingindustrial and agricultural operations; fuel combustion and vehicle travel; grading, excavating,demolition, and blasting from construction; and atmospheric chemical and photochemicalreactions. Motor vehicle traffic is the major source of PM10. In urban areas, PM10
concentrations generally are higher in winter when more fuel is burned and meteorologicalconditions favor the concentration of primary air pollutants.
Local Setting
The SCAQMD monitors air quality conditions at 37 locations throughout the SCAB. The SanFernando East-West Transit Corridor is within the East and West San Fernando Valley SourceReceptor Area (see Figure 4-46). Data from the Burbank and Reseda monitoring stations,located in the two receptor areas, were used to characterize existing conditions in the vicinity ofthe proposed project, and establish a baseline for estimating future conditions both with andwithout the proposed project. The pollutants NO2, SO2, and PM10 are not monitored at theReseda monitoring station. The Burbank monitoring station will be used to characterize thesethree pollutants. A summary of the data recorded at these stations is presented in Table 4-19.
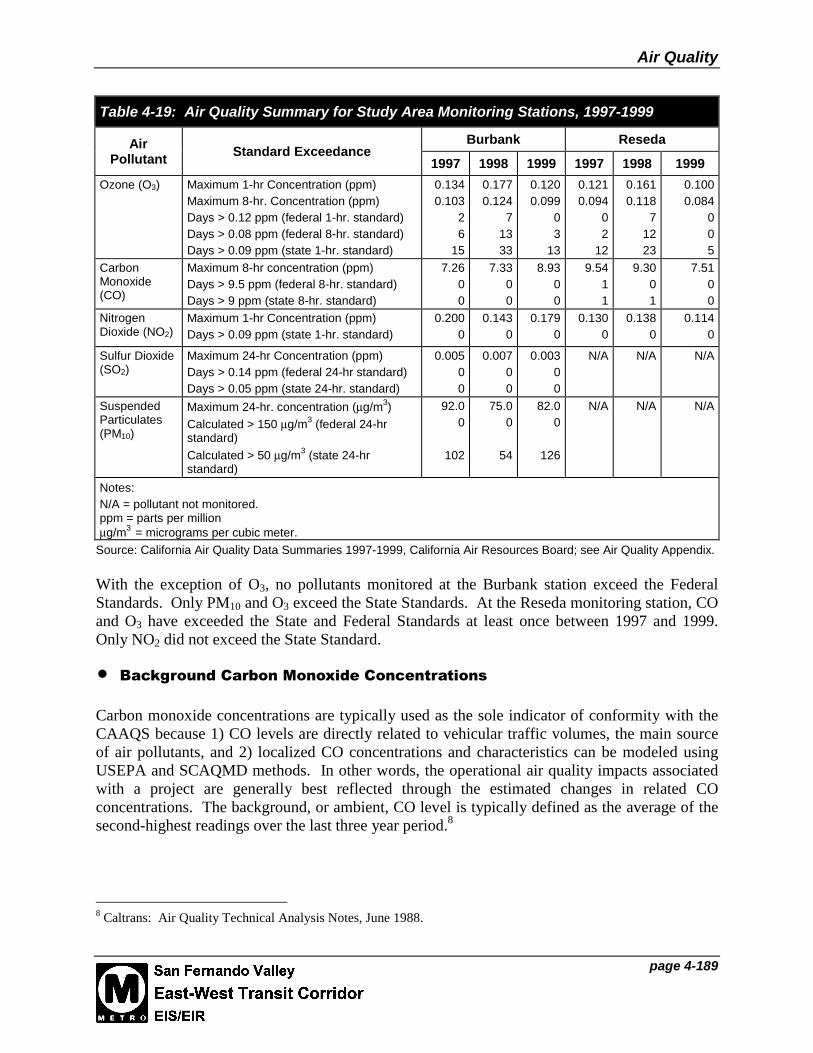
Air Quality
page 4-189
Table 4-19: Air Quality Summary for Study Area Monitoring Stations, 1997-1999
Burbank ResedaAirPollutant Standard Exceedance
1997 1998 1999 1997 1998 1999
Ozone (O3) Maximum 1-hr Concentration (ppm)Maximum 8-hr. Concentration (ppm)Days > 0.12 ppm (federal 1-hr. standard)Days > 0.08 ppm (federal 8-hr. standard)Days > 0.09 ppm (state 1-hr. standard)
0.1340.103
26
15
0.1770.124
71333
0.1200.099
03
13
0.1210.094
02
12
0.1610.118
71223
0.1000.084
005
CarbonMonoxide(CO)
Maximum 8-hr concentration (ppm)Days > 9.5 ppm (federal 8-hr. standard)Days > 9 ppm (state 8-hr. standard)
7.2600
7.3300
8.9300
9.5411
9.3001
7.5100
NitrogenDioxide (NO2)
Maximum 1-hr Concentration (ppm)Days > 0.09 ppm (state 1-hr. standard)
0.2000
0.1430
0.1790
0.1300
0.1380
0.1140
Sulfur Dioxide(SO2)
Maximum 24-hr Concentration (ppm)Days > 0.14 ppm (federal 24-hr standard)Days > 0.05 ppm (state 24-hr. standard)
0.00500
0.00700
0.00300
N/A N/A N/A
SuspendedParticulates(PM10)
Maximum 24-hr. concentration (µg/m3)Calculated > 150 µg/m3 (federal 24-hrstandard)
Calculated > 50 µg/m3 (state 24-hrstandard)
92.00
102
75.00
54
82.00
126
N/A N/A N/A
Notes:N/A = pollutant not monitored.ppm = parts per millionµg/m3 = micrograms per cubic meter.
Source: California Air Quality Data Summaries 1997-1999, California Air Resources Board; see Air Quality Appendix.
With the exception of O3, no pollutants monitored at the Burbank station exceed the FederalStandards. Only PM10 and O3 exceed the State Standards. At the Reseda monitoring station, COand O3 have exceeded the State and Federal Standards at least once between 1997 and 1999.Only NO2 did not exceed the State Standard.
n Background Carbon Monoxide Concentrations
Carbon monoxide concentrations are typically used as the sole indicator of conformity with theCAAQS because 1) CO levels are directly related to vehicular traffic volumes, the main sourceof air pollutants, and 2) localized CO concentrations and characteristics can be modeled usingUSEPA and SCAQMD methods. In other words, the operational air quality impacts associatedwith a project are generally best reflected through the estimated changes in related COconcentrations. The background, or ambient, CO level is typically defined as the average of thesecond-highest readings over the last three year period.8
8 Caltrans: Air Quality Technical Analysis Notes, June 1988.
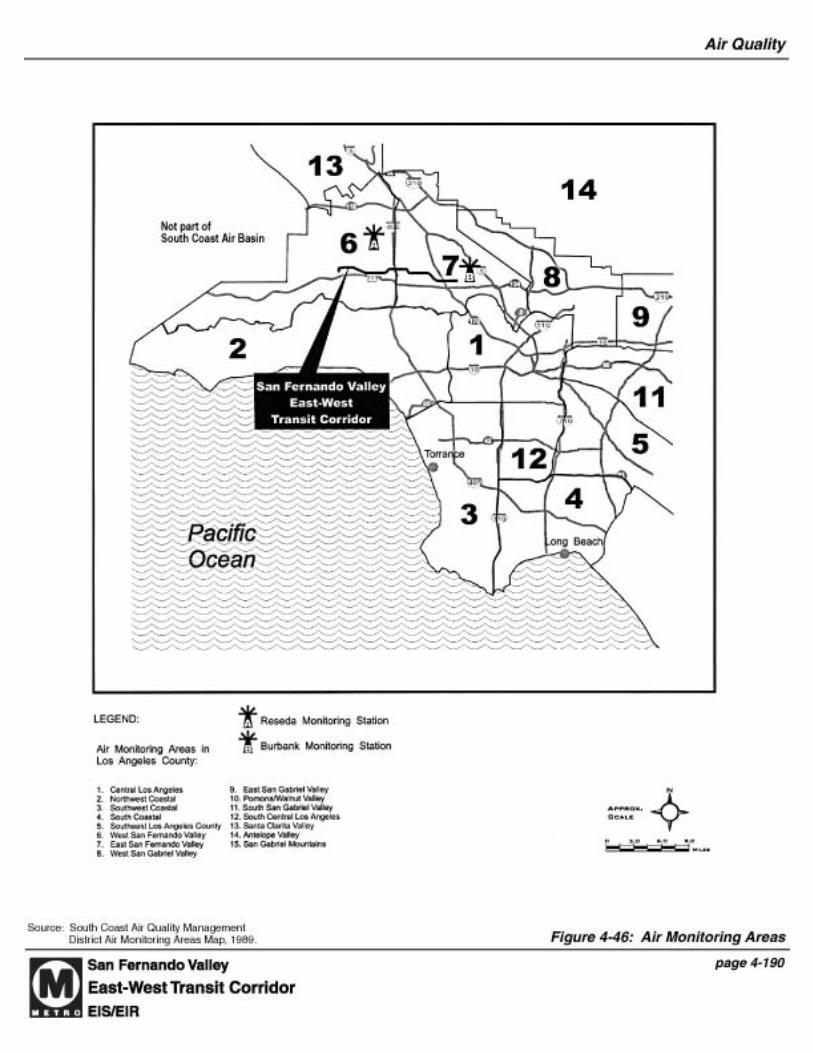

Air Quality
page 4-191
A review of the data from the Reseda monitoring station during the 1997 through 1999 periodindicates that the average 8-hour background CO concentration was 7.3 parts per million (ppm).An ambient 8-hour CO concentration based on the data recorded from the Burbank monitoringstation is 6.9 ppm.9 Assuming a typical persistence factor10 of 0.7, the estimated 1-hourbackground concentration would be 10.4 ppm at the Reseda monitoring station, and 9.9 ppm atthe Burbank Monitoring Station. The ambient CO concentrations at each station do not exceedthe State and Federal standards.
n Carbon Monoxide Concentrations at Sensitive Receptor Locations
Some land uses are considered more sensitive to changes in air quality than others, depending onthe types of population groups and the activities involved. The CARB has identified thefollowing people as the most likely to be affected by air pollution: children under 14 years ofage, the elderly over 65 years of age, athletes, and people with cardiovascular and chronicrespiratory diseases. These groups are classified as sensitive receptors. Locations that maycontain a high concentration of these sensitive population groups include hospitals, daycarefacilities, elder care facilities, elementary schools, and parks.
There is a direct relationship between traffic/circulation congestion and CO impacts, sinceexhaust fumes from vehicular traffic is the primary source of CO. Carbon monoxide is alocalized gas that dissipates very quickly under normal meteorological conditions. Therefore,CO concentrations decrease substantially as distance from the source (intersection) increases.The highest CO concentrations are typically found along sidewalk locations directly adjacent tocongested roadway intersections.
To provide a worst-case simulation of CO concentrations within the area that may be affected bythe proposed project, CO concentrations at sidewalks adjacent to the most congested 21 of the 53study intersections were modeled. The 21 intersections were selected to represent worst-caseconditions because the intersections were designated in the project traffic study as beingsignificantly impacted by traffic under future No Build conditions. The 21 intersections wouldhave level of service (LOS) of D, E, or F under future No Build conditions. PM peak hourconditions were analyzed because it is at this time when vehicle delays and LOS are the highest.At each intersection, traffic related CO contributions were added to the background conditionsdiscussed above. Traffic contributions were estimated using the CAL3QHC dispersion model,which utilizes traffic volume inputs and EMFAC7F emissions factors.11 Table 4-20 showsexisting CO concentrations at the 21 study intersections evaluated.
9 See Air Quality Appendix.10 Persistence factor is the ratio between the one-hour and one-hour second annual maximum CO concentrationsmeasured at a continuous air monitoring station. A persistence factor of 0.7 is typically used in urban areas.11 CAL3QHC is an EPA-approved computer model used to estimate localized pollutant concentrations, using carbonmonoxide as an indicator compound and a Gaussian plume distribution methodology. EMFAC7F is a set ofCalifornia Air Resources Board-approved emission factors for motor vehicles that is used as input to the CAL3QHCmodel.

Air Quality
page 4-192
As shown in Table 4-20, three of the 21 study intersections currently exceed the state 1-hour COconcentration standard of 20 ppm. All 21 study intersections currently exceed the State 8-hourCO concentration standard of 9 ppm.
Table 4-20: Existing Carbon Monoxide (CO) Concentrations (parts per million)
Intersection 1-Hour COConcentration
Exceed State1-Hour Standard
(20 ppm)?
8-Hour COConcentration
Exceed State8-Hour Standard
(9 ppm)?
Owensmouth Ave/Victory Blvd 19.6 No 13.7 Yes
Canoga Ave/Victory Blvd 19.0 No 13.3 Yes
Variel Ave/Victory Blvd 16.5 No 11.6 Yes
De Soto Ave/Victory Blvd 17.4 No 12.2 Yes
Winnetka Ave/Victory Blvd 18.3 No 12.8 Yes
Tampa Ave/Topham Street 22.0 Yes 15.4 Yes
Reseda Blvd/Hatteras Street 14.1 No 9.9 Yes
Balboa Blvd/Victory Blvd 19.8 No 13.9 Yes
Woodley Ave/Victory Blvd 18.3 No 12.8 Yes
Haskell Ave/Victory Blvd 20.8 Yes 14.6 Yes
Sepulveda Blvd/Victory Blvd 20.0 14.0 Yes
Sepulveda Blvd/Erwin Street 16.0 No 11.2 Yes
Sepulveda Blvd/Oxnard Street 17.1 No 12.0 Yes
Kester Ave/Oxnard Street 16.0 No 11.2 Yes
Van Nuys Blvd/Oxnard Street 17.4 No 12.2 Yes
Hazeltine Ave/Oxnard Street 15.4 No 10.8 Yes
Woodman Ave/Oxnard Street 16.5 No 11.6 Yes
Laurel Canyon Blvd/Oxnard St 17.4 No 12.2 Yes
Lankershim Blvd/Oxnard St 15.4 No 10.8 Yes
Lankershim Blvd/Burbank Blvd 15.6 No 10.9 Yes
Lankershim Blvd/Cumpston St 14.9 No 10.4 Yes
Source: Terry A. Hayes Associates, CAL3QHC output; see Air Quality Appendix.
n Future Baseline Air Quality
The California Air Resources Board (CARB), as part of their planning process to meet therequirements of the National and State Clean Air acts, estimates future mobile emissions for eachair basin within the State. Table 4-21 illustrates the South Coast Air Basin mobile emissionsestimate for the years 2000 and 2020. As can be seen, SOX and PM10 emissions are expected toincrease by 16 and 22 percent, respectively, as a result of an increase in vehicle miles traveled(VMT), which results in more brake and tire-wear. Although vehicle miles traveled within theCounty is expected to increase by approximately 33 percent, CO, NOX, and ROG emissions areexpected to decrease by 47 to 80 percent due to cleaner vehicle fleet. The cleaner fleet is a result

Air Quality
page 4-193
of reduced emissions from new vehicles and removal of older higher emission vehicles over the20-year period.
Table 4-21: Criteria Pollutant Emissions Reductiona
Year 2000 Year 2020Pollutant
Tons/day Tons/yearb Tons/day Tons/yearb
PercentChange
Reactive Organic Gases (ROG) 349.2 109,998 69.8 21,987 -80%CO 3,162.1 996,061.5 1,296.2 408,303 -59%NOX 331.3 104,359.5 174.9 55,093.5 -47%PM10 8.2 2,583 10.0 3,150 22%SOX 2.9 913.5 3.5 1,102.5 21%Daily VMTc (millions) 280.3 88,309.9 373.8 117,740.1 33%
Notes:(a) Emissions are calculated for light duty automobiles and light duty trucks.(b) Tons/year is calculated based on a trip factor of 315 days.(c) VMT = vehicle miles traveled.
Source: California Air Resources Board, Burden 7G output – South Coast Air Basin; see Air Quality Appendix.
As shown in Table 4-21, carbon monoxide accounts for the vast majority of mobile emissions.The anticipated reduction in CO emissions would have a corresponding effect on ambient airquality levels in the SCAB. Because the CARB mobile emissions estimates take into accountboth the growth in vehicle miles traveled as well as improved emission rates, the CO reductionscan be directly applied to ambient background CO concentrations, consistent with the USEPAguidance, to provide a future year estimate of background CO levels.
As previously indicated, the average one and 8-hour background CO concentrations were 10.4and 7.26 ppm, respectively, at the Reseda monitoring station.12 Year 2020 1-hour and 8-hourambient CO concentrations would be reduced to 5.1 ppm and 3.6 ppm. This anticipateddownward trend in CO concentrations is consistent with a continuing decline in historical COmeasurements registered at the Reseda monitoring stations (See Table 4-19).
4-7.2 Impact Analysis Methodology and Evaluation Criteria
The following calculation methods and estimation models were utilized in ascertaining airquality impacts: the CARB Motor Vehicle Emission Inventory 7G (MVEI7G) emissions model,the Caltrans EMFAC emissions factor model, the USEPA CAL3QHC dispersion modelsoftware, and the USEPA Industrial Source Complex-Short Term Model (ISCST3) air dispersionmodel. In addition, the FTA Office of Planning Section 5309 New Starts Criteria was used tocalculate criteria pollutant/precursor emissions for each alternative being considered. This airquality analysis is consistent with procedures described in the SCAQMD CEQA Handbook(1993 edition).
12As discussed earlier, ambient CO concentration at the Reseda monitoring station is higher than the ambient CO concentrations
at the Burbank monitoring station. Therefore, the ambient CO concentration for the Reseda monitoring station was utilized to
calculate year 2020 ambient CO concentrations.

Air Quality
page 4-194
The Code of Federal Regulations (CFR) 40 Part 51 establishes conformity measures for theFederal or State Implementation Plan. Under CFR 40 Part 51, should criteria pollutants emittedby the proposed project exceed the amounts listed in Table 4-22 when compared to future noproject conditions, a conformity analysis would be required.
Table 4-22: CFR 40, Part 51 – Conformity Criteria
Pollutants Tons per Year(increase over no project conditions)
Carbon MonoxideCO 100
NOX 10
ROG 10
PM10 70
Source: United States Environmental Protection Agency, CFR 40 Part 51.
The proposed project would have a significant impact if criteria pollutant concentrations exceedthe amounts listed in Table 4-22 when compared to the No Build Alternative. The proposedproject would also result in a significant impact if the proposed project would cause any criteriapollutant concentration to exceed the CAAQS at any sensitive receptor location.
The proposed project does not contain lead, hydrogen sulfide, or sulfate emission sources.Therefore, emissions and concentrations related to these pollutants will not be analyzed in thisdocument.
4-7.3 Impacts
4-7.3.1 Macro Scale (Burden) Emissions
a. No Build Alternative
There is a direct relationship between vehicle miles traveled (VMT) and air pollution. Inurbanized regions, such as the Los Angeles Metropolitan area, mobile emissions are the primarysource of air pollution. Transportation projects that significantly increase or decrease regionalVMT will also significantly degrade or improve regional air quality.
Criteria pollutant emissions for the No Build Alternative are shown in Table 4-23. The pollutantemissions for the No Build Alternative will be compared to the TSM Alternative, as well as theBRT, MOS, and On-Street Alignment, in subsequent sections. The regional VMT was estimatedusing the Los Angeles County Metropolitan Transit Authority (LACMTA) transportation model.
• Annual VMT for the No Build Alternative is expected to be approximately 141,900 millionmiles.
• CO emissions are anticipated to be 492,266 tons per year
• NOX emissions are anticipated to be 71,938 tons per year• ROG emissions are anticipated to be 28,068 tons per year• PM10 emissions are anticipated to be 3,155 tons per year.

Air Quality
page 4-195
Table 4-23: Criteria Pollutant Emissions for No Build Alternative (Year 2020)
Criteria Pollutant Emissions (tons per year)Vehicular Class Annual VMT
(millions) CO NOX ROG PM10
Passenger Vehicle(Light duty Auto/Light duty trucks)
141,667 491,907 70,272 26,547 3,123
Bus/CNG 235.5 319 1,545 431 5Commuter Rail/Diesel 4.9 40 121 1,090 27Total 141,907 492,266 71,938 28,068 3,155Note: VMT = vehicle miles traveled.
Source: Terry A. Hayes Associates, see FTA New Start Worksheets in Air Quality Appendix, 2000.
b. Transportation System Management (TSM) Alternative
Criteria pollutant emissions for the TSM Alternative are shown in Table 4-24. The regionalVMT for the TSM Alternative was estimated using the Los Angeles County Metropolitan TransitAuthority (LACMTA) transportation model.
Table 4-24: Estimated Change in Criteria Pollutant Emissions for TSM Alternative (Year2020)
Criteria Pollutant Emissions (tons per year)Vehicular Class Annual VMT
(millions) CO NOX ROG PM10
Passenger Vehicle(Light duty Auto/Light duty trucks)
141,647 491,837 70,262 26,544 3,123
Bus/CNG 236.9 321 1,554 433 5Commuter Rail/Diesel 4.9 41 122 1,102 28TSM Total 141,889 492,199 71,938 28,079 3,156
TSM vs. No Build -18 (-0.01%change)
-67 (-0.01%change) 0 11 (0.04%
change)1 (0.03%change)
Note: VMT = vehicle miles traveled.
Source: Terry A. Hayes Associates, see FTA New Start Worksheets in Air Quality Appendix, 2000.
As indicated in Table 4-24, annual VMT is expected to decrease by approximately 18 millionmiles, or 0.01 percent when compared to the No Build Alternative. The TSM Alternative emitshigher concentrations of ROG and PM10 than the No Build Alternative. However, the TSMAlternative would emit lower concentrations of CO. Changes in NOX emissions are negligible.All criteria pollutants are expected to change by less than one percent when compared to the NoBuild Alternative.
Under the TSM Alternative, the increase in ROG emissions when compared to the No BuildAlternative would exceed the Federal Conformity Criteria by approximately one ton per year.Thus, a conformity analysis would be required.
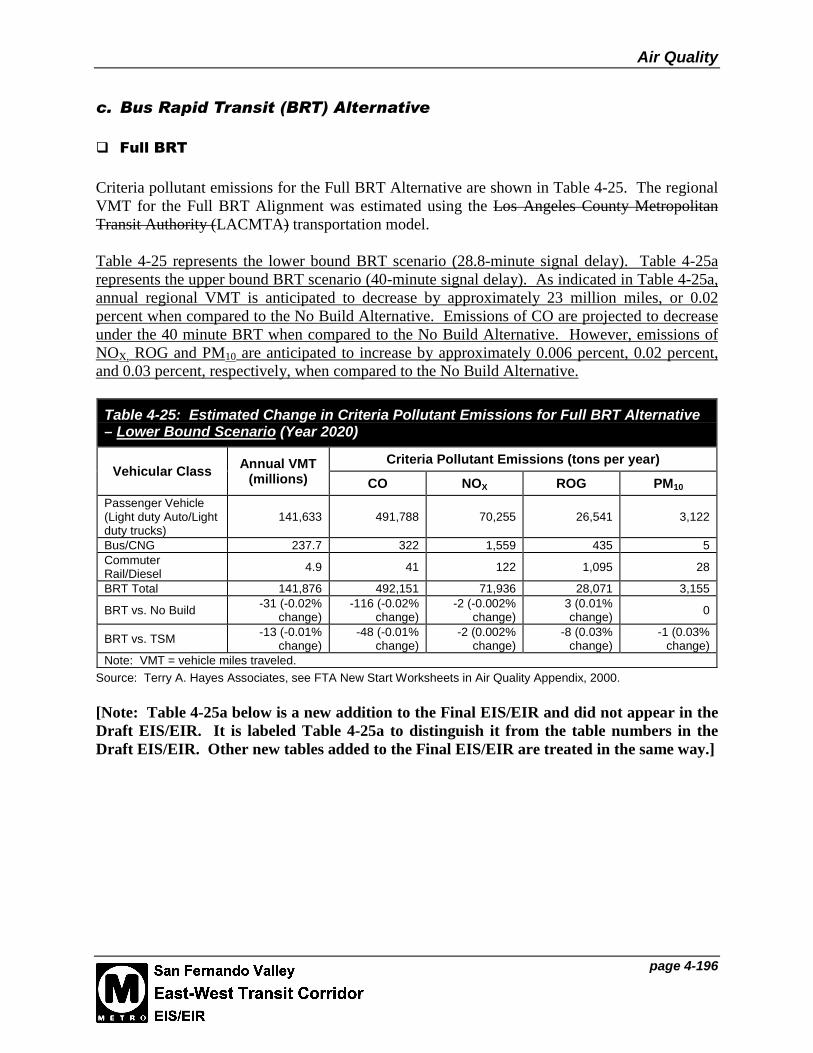
Air Quality
page 4-196
c. Bus Rapid Transit (BRT) Alternative
Full BRT
Criteria pollutant emissions for the Full BRT Alternative are shown in Table 4-25. The regionalVMT for the Full BRT Alignment was estimated using the Los Angeles County MetropolitanTransit Authority (LACMTA) transportation model.
Table 4-25 represents the lower bound BRT scenario (28.8-minute signal delay). Table 4-25arepresents the upper bound BRT scenario (40-minute signal delay). As indicated in Table 4-25a,annual regional VMT is anticipated to decrease by approximately 23 million miles, or 0.02percent when compared to the No Build Alternative. Emissions of CO are projected to decreaseunder the 40 minute BRT when compared to the No Build Alternative. However, emissions ofNOX, ROG and PM10 are anticipated to increase by approximately 0.006 percent, 0.02 percent,and 0.03 percent, respectively, when compared to the No Build Alternative.
Table 4-25: Estimated Change in Criteria Pollutant Emissions for Full BRT Alternative– Lower Bound Scenario (Year 2020)
Criteria Pollutant Emissions (tons per year)Vehicular Class Annual VMT
(millions) CO NOX ROG PM10
Passenger Vehicle(Light duty Auto/Lightduty trucks)
141,633 491,788 70,255 26,541 3,122
Bus/CNG 237.7 322 1,559 435 5CommuterRail/Diesel 4.9 41 122 1,095 28
BRT Total 141,876 492,151 71,936 28,071 3,155
BRT vs. No Build -31 (-0.02%change)
-116 (-0.02%change)
-2 (-0.002%change)
3 (0.01%change) 0
BRT vs. TSM -13 (-0.01%change)
-48 (-0.01%change)
-2 (0.002%change)
-8 (0.03%change)
-1 (0.03%change)
Note: VMT = vehicle miles traveled.
Source: Terry A. Hayes Associates, see FTA New Start Worksheets in Air Quality Appendix, 2000.
[Note: Table 4-25a below is a new addition to the Final EIS/EIR and did not appear in theDraft EIS/EIR. It is labeled Table 4-25a to distinguish it from the table numbers in theDraft EIS/EIR. Other new tables added to the Final EIS/EIR are treated in the same way.]

Air Quality
page 4-197
Table 4-25a: Estimated Change in Criteria Pollutant Emissions for BRT Alternative –Upper Bound Scenario (Year 2020)
Criteria Pollutant Emissions (tons per year)Vehicular Class Annual VMT
(millions) CO NOX ROG PM10
Passenger Vehicle(Light duty Auto/Lightduty trucks)
141,641 491,819 70,260 26,543 3,123
Bus/CNG 237.8 322 1,560 435 5CommuterRail/Diesel
4.9 41 122 1,095 28
40 Minute BRT Total 141,884 492,182 71,942 28,073 3,15640 Minute BRT vs.No Build
-23 (-0.02%change)
-84 (-0.02%change)
4 (0.006%change)
5 (0.02%change)
1 (0.03%change)
40 Minute BRT vs.TSM
-5 (-0.004%change)
-17 (-0.003%change)
4 (0.006%change)
-6 (-0.02%change) 0
Note: VMT = vehicle miles traveled.Source: Terry A. Hayes Associates, see FTA New Start Worksheets in Air Quality Appendix, 2000-2002.
When compared to the TSM Alternative, the annual regional VMT for the upper bound scenariois projected to decrease by 0.004 percent, or 5 million VMT. In addition, emissions of CO andROG are anticipated to decrease. Emissions of NOX are anticipated to increase, and changes inPM10 emissions are negligible.
Increase in criteria pollutant concentrations of the upper bound scenario over No BuildAlternative would not violate CFR 40 Part 51, and a conformity analysis would not be required.Thus, less than significant impacts are anticipated.
Annual regional VMT is anticipated to decrease by approximately 31 million miles, or 0.02percent. With the exception of ROG, all criteria pollutant emissions are projected to decreaseunder the Full BRT when compared to the No Build Alternative. ROG is anticipated to increaseby approximately 0.01 percent when compared to the No Build Alternative. A less than onepercent change in VMT and the four criteria pollutants are anticipated under the Full BRT whencompared to the No Build Alternatives.
When compared to the TSM Alternative, the annual regional VMT for the BRT alignment isprojected to decrease by 0.01 percent, or 13 million VMT. In addition, all criteria pollutants,with the exception of PM10, are anticipated to decrease. Changes in PM10 emissions arenegligible.
Under the Full BRT, iIncrease in criteria pollutant concentrations of the Full BRT over the NoBuild Conditions Alternative would not violate CFR 40 Part 51, and a conformity analysis wouldnot be required. Thus, less than significant impacts are anticipated.
Lankershim/Oxnard On-Street Alignment
Criteria pollutant emissions for the Lankershim/Oxnard Alignment are shown in Table 4-26.The regional VMT was estimated using the Los Angeles County Metropolitan Transit Authority(LACMTA) transportation model.
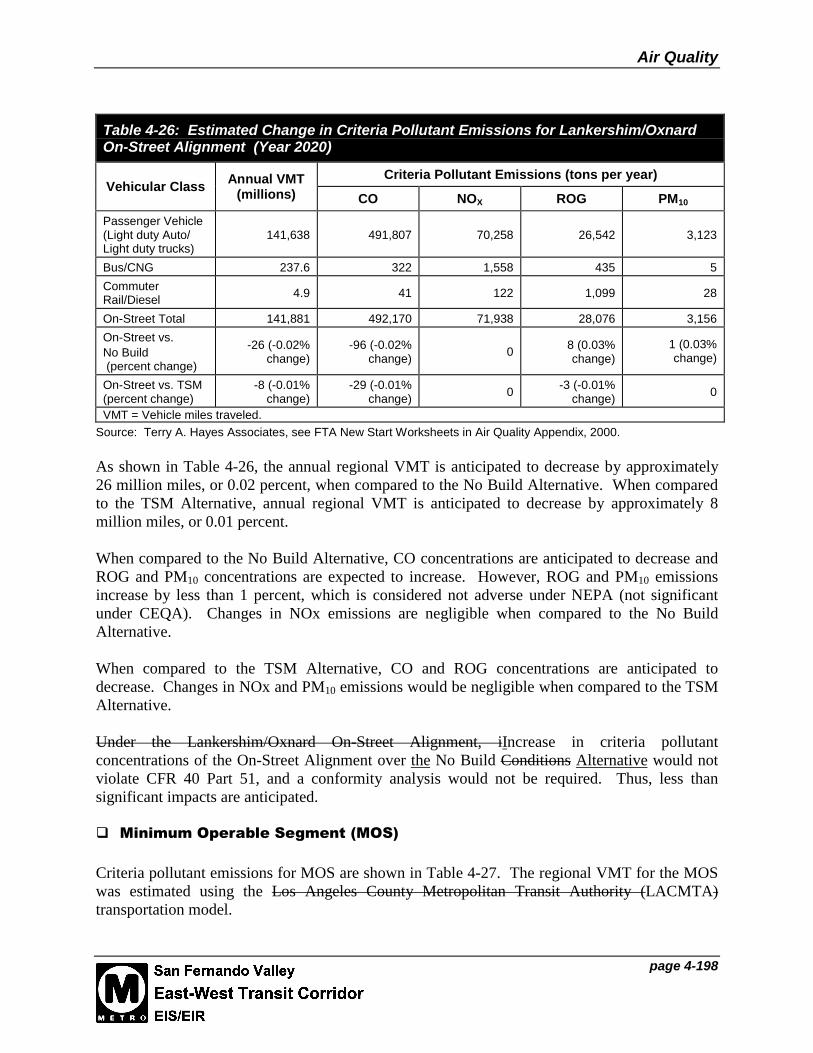
Air Quality
page 4-198
Table 4-26: Estimated Change in Criteria Pollutant Emissions for Lankershim/OxnardOn-Street Alignment (Year 2020)
Criteria Pollutant Emissions (tons per year)Vehicular Class Annual VMT
(millions) CO NOX ROG PM10
Passenger Vehicle(Light duty Auto/Light duty trucks)
141,638 491,807 70,258 26,542 3,123
Bus/CNG 237.6 322 1,558 435 5
CommuterRail/Diesel 4.9 41 122 1,099 28
On-Street Total 141,881 492,170 71,938 28,076 3,156
On-Street vs.No Build(percent change)
-26 (-0.02%change)
-96 (-0.02%change)
0 8 (0.03%change)
1 (0.03%change)
On-Street vs. TSM(percent change)
-8 (-0.01%change)
-29 (-0.01%change) 0
-3 (-0.01%change) 0
VMT = Vehicle miles traveled.Source: Terry A. Hayes Associates, see FTA New Start Worksheets in Air Quality Appendix, 2000.
As shown in Table 4-26, the annual regional VMT is anticipated to decrease by approximately26 million miles, or 0.02 percent, when compared to the No Build Alternative. When comparedto the TSM Alternative, annual regional VMT is anticipated to decrease by approximately 8million miles, or 0.01 percent.
When compared to the No Build Alternative, CO concentrations are anticipated to decrease andROG and PM10 concentrations are expected to increase. However, ROG and PM10 emissionsincrease by less than 1 percent, which is considered not adverse under NEPA (not significantunder CEQA). Changes in NOx emissions are negligible when compared to the No BuildAlternative.
When compared to the TSM Alternative, CO and ROG concentrations are anticipated todecrease. Changes in NOx and PM10 emissions would be negligible when compared to the TSMAlternative.
Under the Lankershim/Oxnard On-Street Alignment, iIncrease in criteria pollutantconcentrations of the On-Street Alignment over the No Build Conditions Alternative would notviolate CFR 40 Part 51, and a conformity analysis would not be required. Thus, less thansignificant impacts are anticipated.
Minimum Operable Segment (MOS)
Criteria pollutant emissions for MOS are shown in Table 4-27. The regional VMT for the MOSwas estimated using the Los Angeles County Metropolitan Transit Authority (LACMTA)transportation model.

Air Quality
page 4-199
Table 4-27: Estimated Change in Criteria Pollutant Emissions for MOS (Year 2020)
Criteria Pollutant Emissions (tons per year)Vehicular Class
AnnualVMT
(millions) CO NOX ROG PM10
Passenger Vehicle(Light duty Auto/Light duty trucks)
141,636 491,801 70,257 26,542 3,123
Bus/CNG 237.4 322 1,557 434 5
Commuter Rail/Diesel 5.0 41 122 1,103 28
MOS Total 141,878 492,164 71,936 27,079 3,156
MOS vs. No Build(percent change)
-29 (-0.02%change)
-104 (-0.02%change)
-2 -(0.002%change)
11 (0.04%change)
0
MOS vs. TSM (percentchange)
-11 (-0.01%change)
-36 (-0.01%change)
-2 (-0.003%change) 0 0
Note: VMT = vehicle miles traveled.
Source: Terry A. Hayes Associates, see FTA New Start Worksheets in Air Quality Appendix, 2000.
As shown in Table 4-27, the annual regional VMT is anticipated to decrease by approximately29 million miles (approximately 0.02 percent) when compared to the No Build Alternative, and11 million miles (approximately 0.01 percent) when compared to the TSM Alternative. Whencompared to the No Build and TSM Alternatives, CO and NOX concentrations are anticipated todecrease. However, ROG emissions are anticipated to increase by 11 tons per year, and PM10
emissions are anticipated to increase by approximately one ton per year when compared to theNo Build Alternative. Changes in ROG and PM10 emissions are negligible when compared tothe TSM Alternative.
Under the MOS, the increase in ROG emissions when compared to the No Build Alternativewould exceed the Federal Conformity Criteria for ROG by 1 ton per year. Thus a conformityanalysis would be required.
It should be noted that the MOS is a shorter alignment than the Full BRT and Lankershim/Oxnard On-Street Alignment. The Full BRT and Lankershim/Oxnard On-Street Alignment arelonger alignments and therefore generate lower VMT than the MOS. As a result, these twoalignments have lower ROG emissions. Although incremental increases in ROG emissions forthe MOS would exceed the Federal Conformity Criteria, ROG emissions for the Full BRT andLankershim/Oxnard On-Street Alignment would not exceed the Federal Conformity Criteria.A summary comparison of all alternatives is provided in Table 4-28.

Air Quality
page 4-200
Table 4-28 Comparison of Criteria Pollutant Emissions (Year 2020)
Criteria Pollutant Emissions (tons/year)Alternative
CO NOx ROG PM10
No Build 492,266 71,938 28,068 3,155
492,199 71,938 28,079 3,156TSM Change from No
Build -67 (-0.01%) 0 11 (0.04%) 1 (0.03%)
492,151 71,936 28,071 3,155
Full BRT Change from NoBuild
-48 (-0.018)
-166 (-0.02%)-2 (-0.002%)
-8 (0.03%)
-3 (0.01%)0
492,177
492,170
71,973
71,938
28,077
28,0763,155
Lankershim/OxnardOn-Street Alignment Change from No
Build-23 (-0.01%)
-96 (-0.02%)
35 (0.05%)
0
-2 (-0.01%)
8 (0.03%)
0
1 (0.03%)
492,164 71,936 27,079 3,156
MOS Alignment Change from NoBuild
-36 (-0.01%)
-104 (-0.02%)
-2 (-0.003%)
(-0.002%)
0
11 (0.04%)0
Terry A. Hayes Associates, 2000.
4-7.3.2 CO Hot Spot Analysis
Carbon monoxide concentrations at 21 study intersections were calculated using the USEPACAL3QHC micro scale dispersion model. CO concentrations at each study intersection includefuture ambient 1-hour and 8-hour CO concentration of 5.1 and 3.6 ppm, respectively. Resultsare discussed below.
a. No Build Alternative
Table 4-29 identifies the 1- and 8-hour CO concentrations at the 21 study intersections under theNo Build Alternative. As indicated, future No Build CO concentrations would range from 7.2 to10.3 ppm for 1-hour concentrations and from 4.5 to 7.2 for 8-hour concentrations. CO emitted atthe 21 study intersections would not exceed the State 1- and 8-hour CO standard of 20 ppm and 9ppm, respectively.