Embed Size (px)
Citation preview
Dendrograms for Data
Mining
Eamonn Keogh
• Informally, finding natural groupings or relationships among objects.
What is Clustering?What is Clustering?Also called unsupervised learning, sometimes called classification by statisticians and sorting by psychologists and segmentation by people in marketing
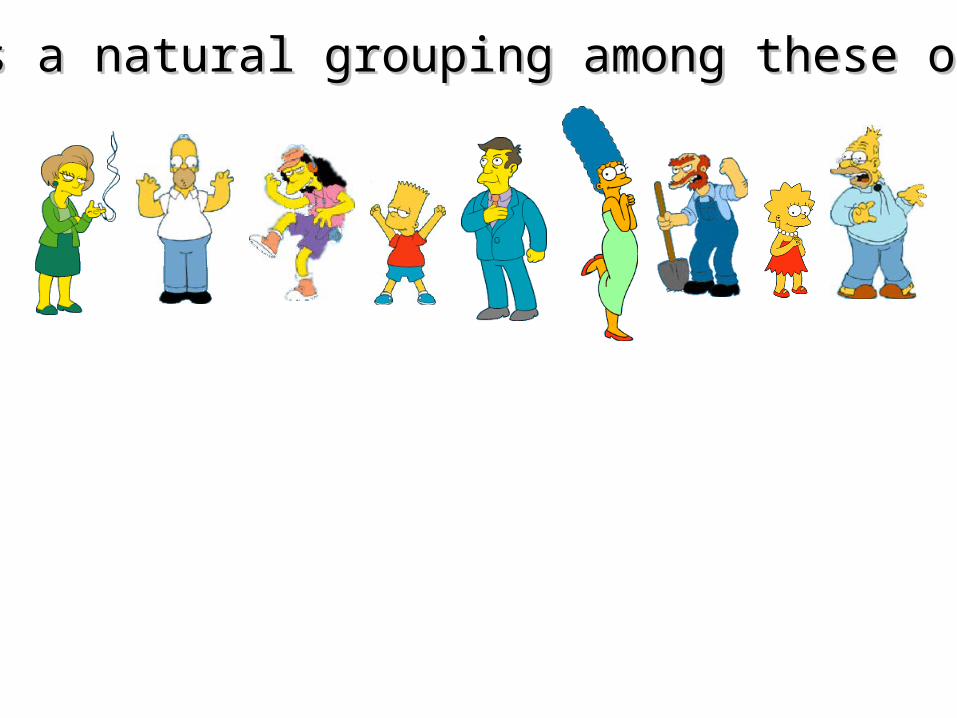
What is a natural grouping among these objects?What is a natural grouping among these objects?
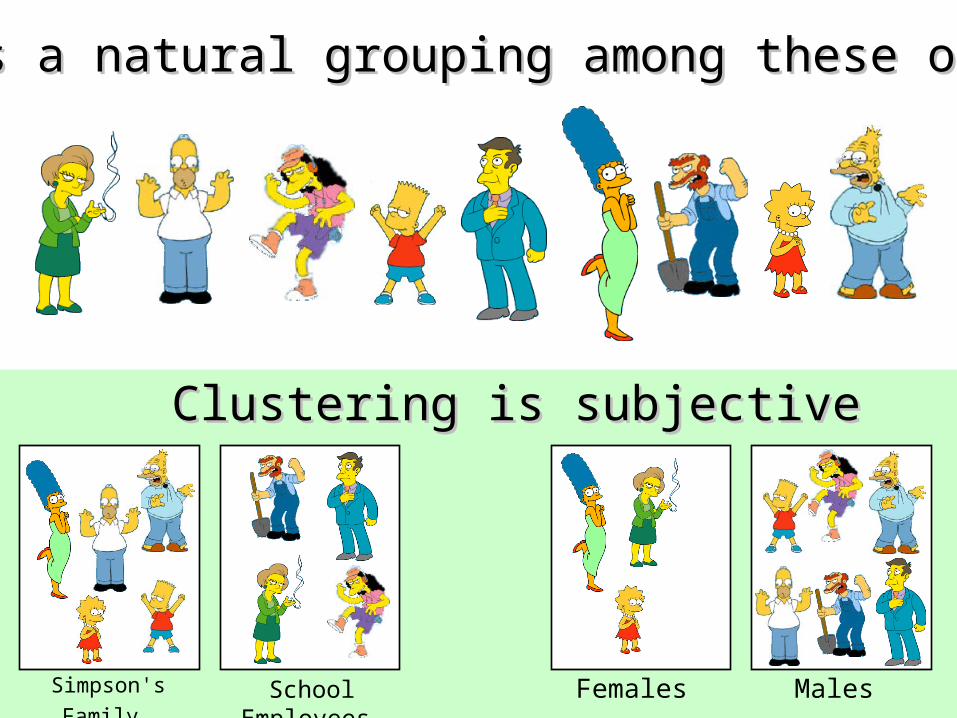
School Employees Simpson's Family Males Females
Clustering is subjectiveClustering is subjective
What is a natural grouping among these objects?What is a natural grouping among these objects?
Two Types of ClusteringTwo Types of Clustering
HierarchicalHierarchical
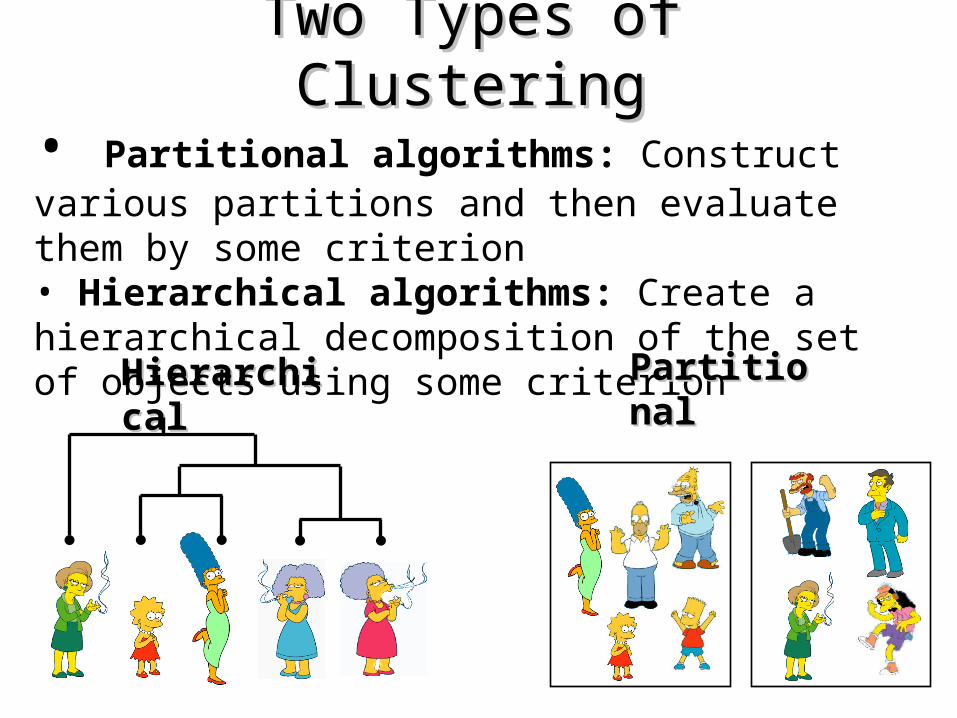
• Partitional algorithms: Construct various partitions and then evaluate them by some criterion• Hierarchical algorithms: Create a hierarchical decomposition of the set of objects using some criterion
PartitionalPartitional
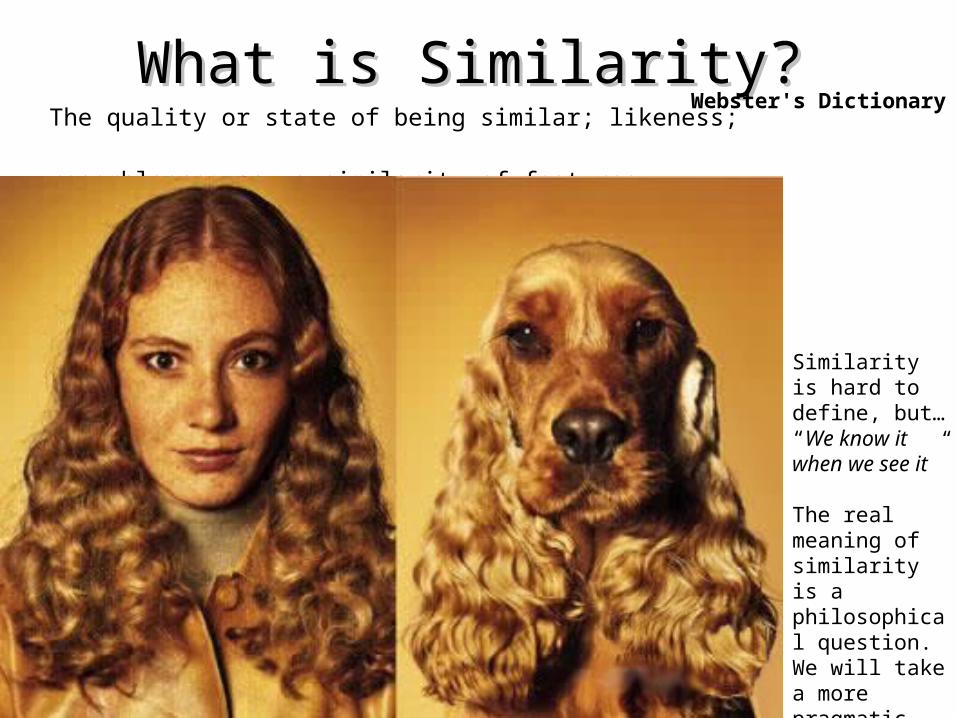
What is Similarity?What is Similarity?The quality or state of being similar; likeness; resemblance; as, a similarity of features.
Similarity is hard to define, but… “We know it when we see it”
The real meaning of similarity is a philosophical question. We will take a more pragmatic approach.
Webster's Dictionary
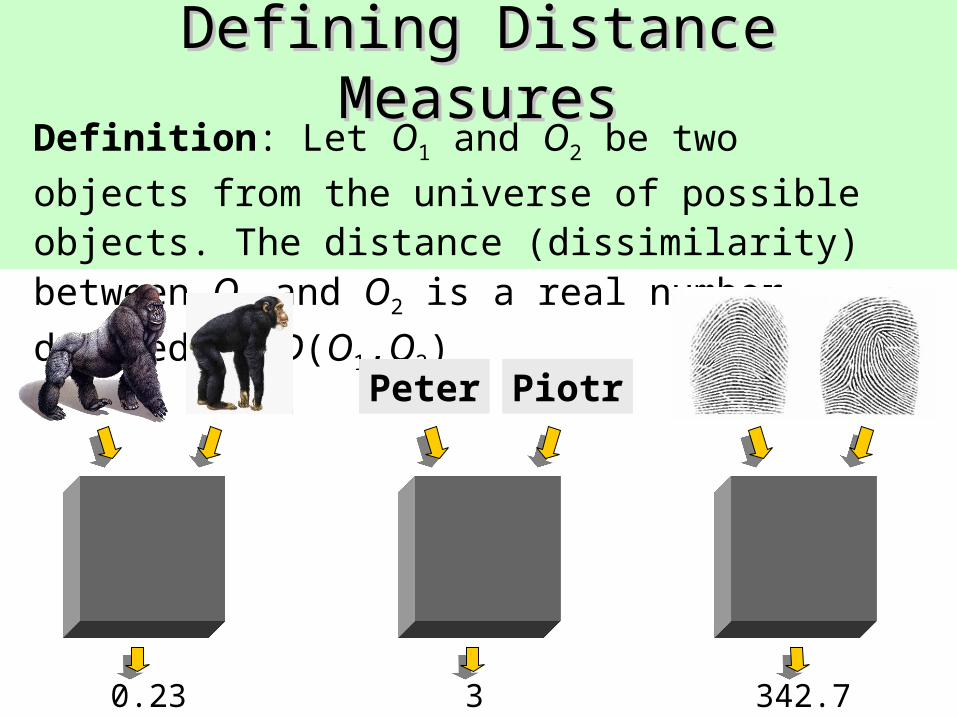
Defining Distance MeasuresDefining Distance MeasuresDefinition: Let O1 and O2 be two objects from the universe
of possible objects. The distance (dissimilarity) between O1 and O2 is a real number denoted by D(O1,O2)
0.23 3 342.7
Peter Piotr
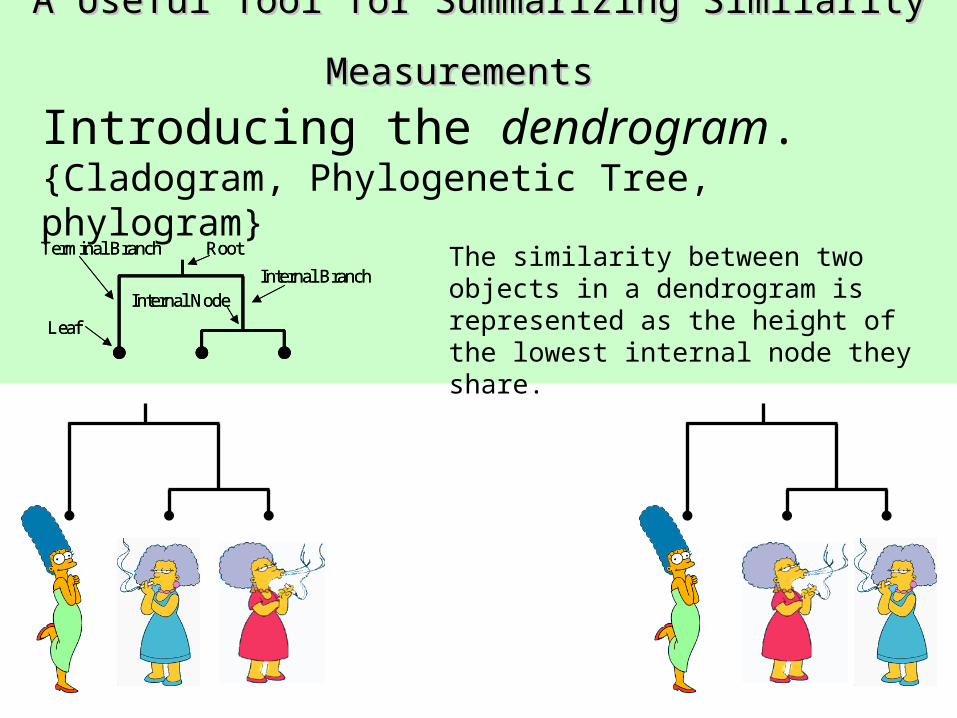
A Useful Tool for Summarizing Similarity MeasurementsA Useful Tool for Summarizing Similarity Measurements Introducing the dendrogram.{Cladogram, Phylogenetic Tree, phylogram}
Root
Internal Branch
Terminal Branch
Leaf
Internal Node
Root
Internal Branch
Terminal Branch
Leaf
Internal Node
The similarity between two objects in a dendrogram is represented as the height of the lowest internal node they share.
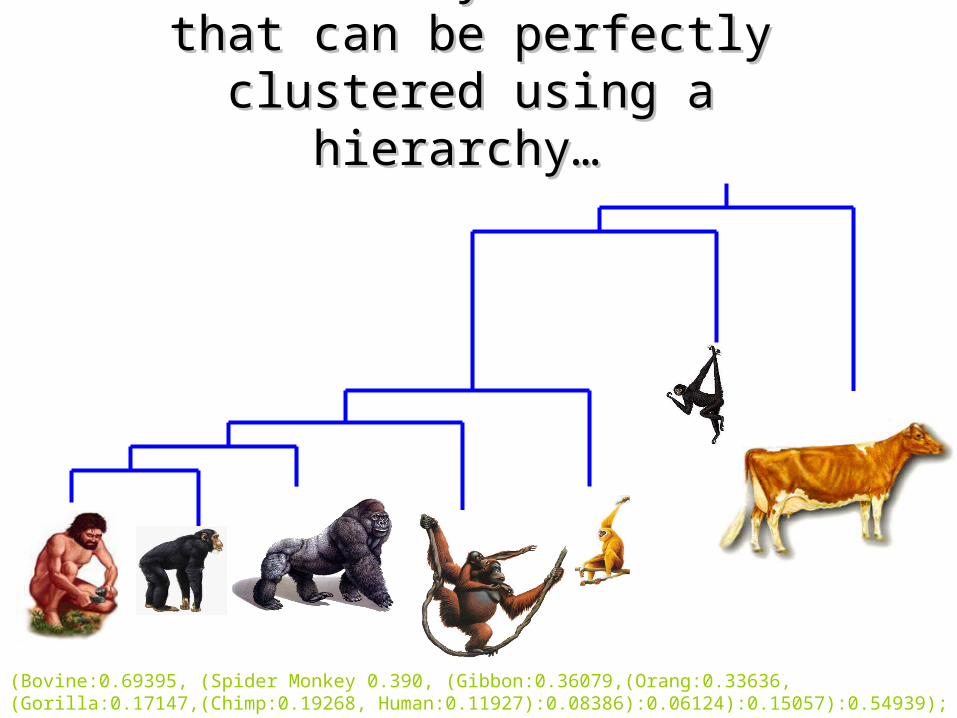
(Bovine:0.69395, (Spider Monkey 0.390, (Gibbon:0.36079,(Orang:0.33636,(Gorilla:0.17147,(Chimp:0.19268, Human:0.11927):0.08386):0.06124):0.15057):0.54939);
There is only one dataset that can be There is only one dataset that can be perfectly clustered using a hierarchy… perfectly clustered using a hierarchy…
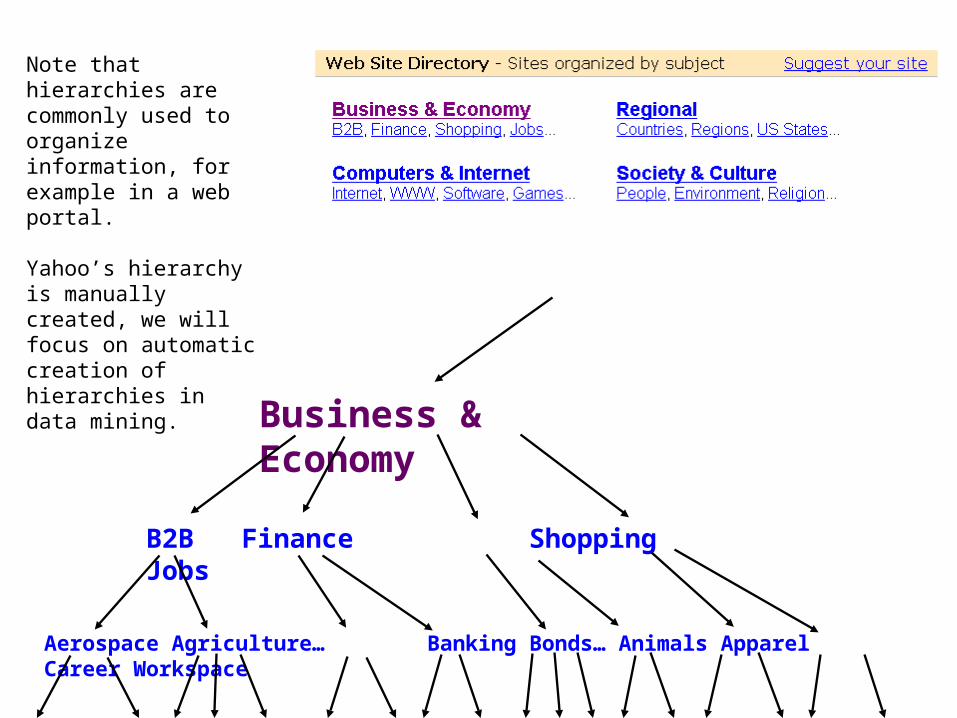
Business & Economy
B2B Finance Shopping Jobs
Aerospace Agriculture… Banking Bonds… Animals Apparel Career Workspace
Note that hierarchies are commonly used to organize information, for example in a web portal.
Yahoo’s hierarchy is manually created, we will focus on automatic creation of hierarchies in data mining.
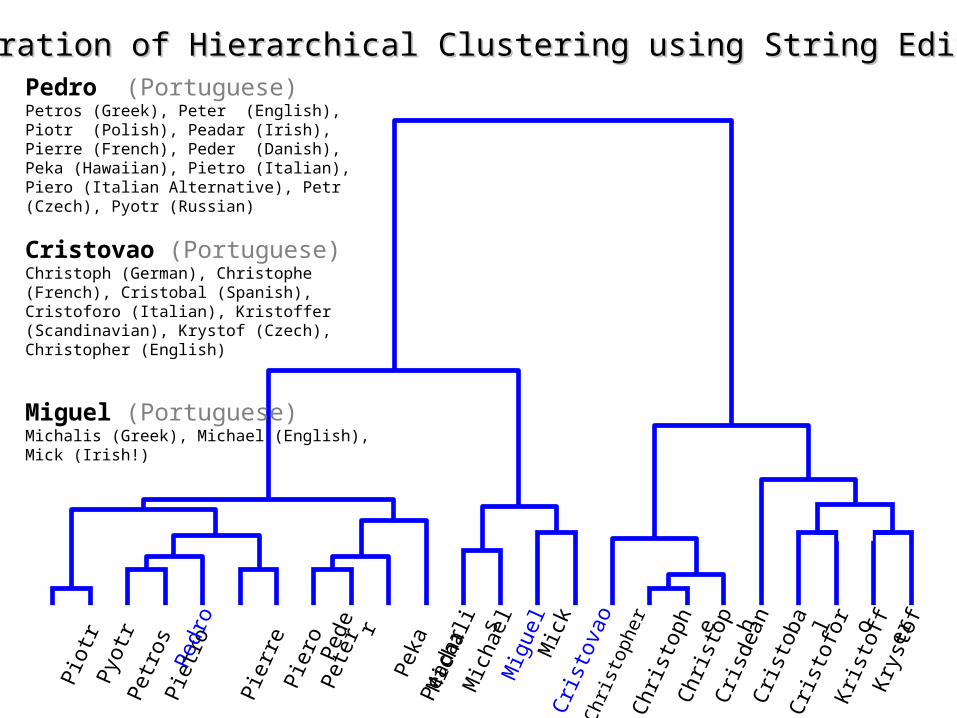
Pedro (Portuguese)Petros (Greek), Peter (English), Piotr (Polish), Peadar (Irish), Pierre (French), Peder (Danish), Peka (Hawaiian), Pietro (Italian), Piero (Italian Alternative), Petr (Czech), Pyotr (Russian)
Cristovao (Portuguese)Christoph (German), Christophe (French), Cristobal (Spanish), Cristoforo (Italian), Kristoffer (Scandinavian), Krystof (Czech), Christopher (English)
Miguel (Portuguese)Michalis (Greek), Michael (English), Mick (Irish!)
A Demonstration of Hierarchical Clustering using String Edit Distance A Demonstration of Hierarchical Clustering using String Edit Distance Pio
tr Py
otr
Petro
s Pie
troPe
dro
Pierr
e Pi
ero
Pete
rPe
der
Peka
Pead
arM
icha
lisM
icha
elM
igue
lM
ick
Cris
tova
oC
hris
toph
erC
hris
toph
eC
hris
toph
Cris
dean
Cris
toba
lC
risto
foro
Kri
stof
fer
Kry
stof
Pio
tr P
yotr
Pet
ros
Pie
tro
Ped
ro P
ierr
e P
iero
Pet
erP
eder
Pek
a P
eada
r
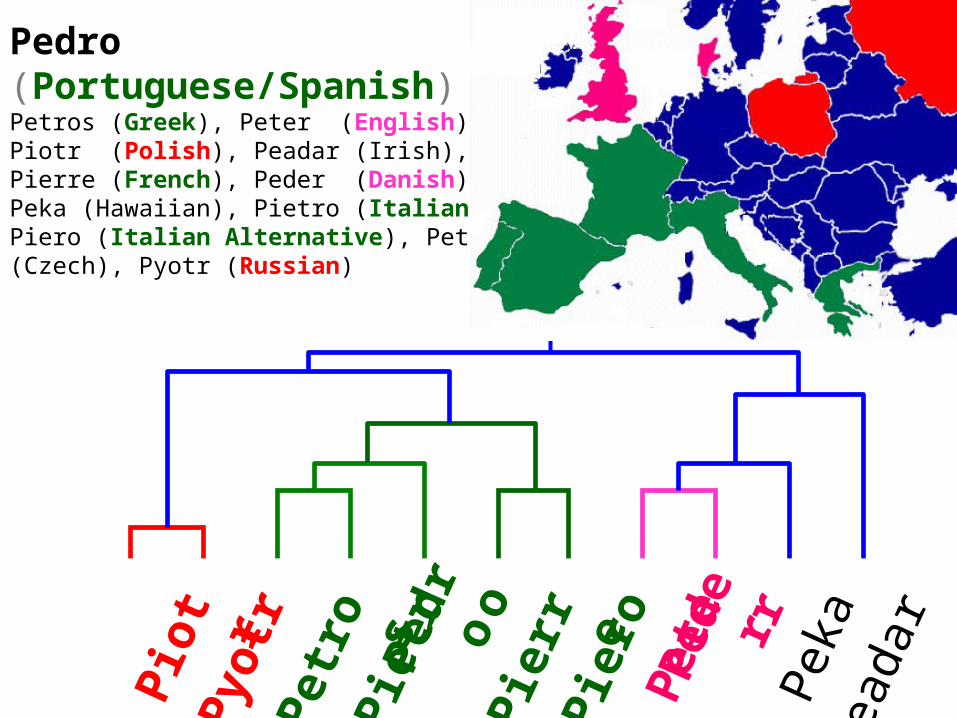
Pedro (Portuguese/Spanish)Petros (Greek), Peter (English), Piotr (Polish), Peadar (Irish), Pierre (French), Peder (Danish), Peka (Hawaiian), Pietro (Italian), Piero (Italian Alternative), Petr (Czech), Pyotr (Russian)
ANGUILLAAUSTRALIA St. Helena & Dependencies
South Georgia &South Sandwich Islands U.K.
Serbia & Montenegro(Yugoslavia) FRANCE NIGER INDIA IRELAND BRAZIL
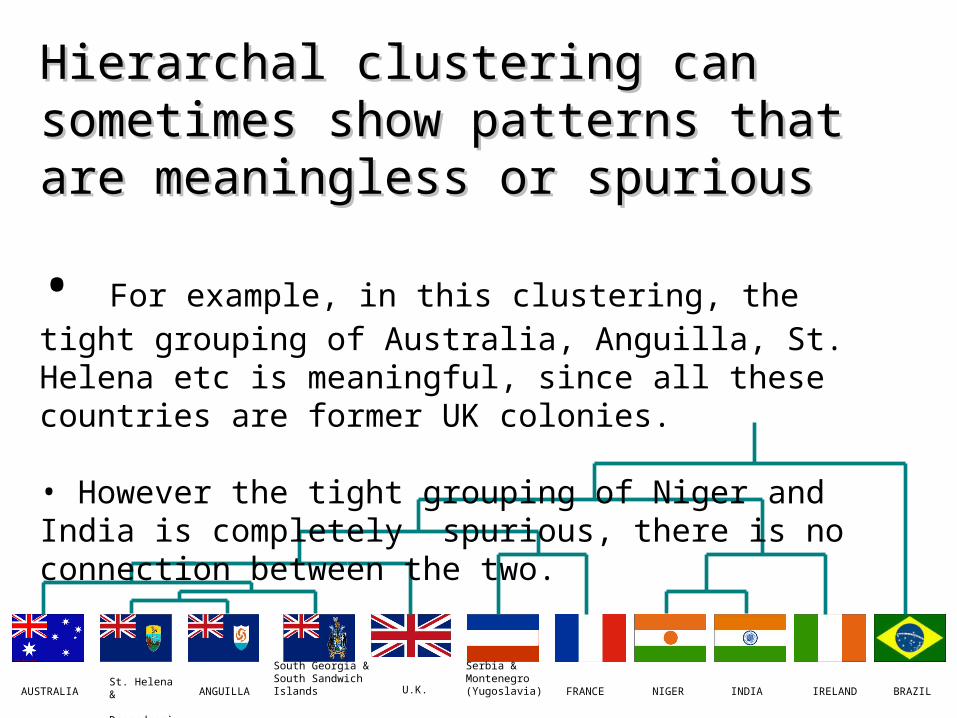
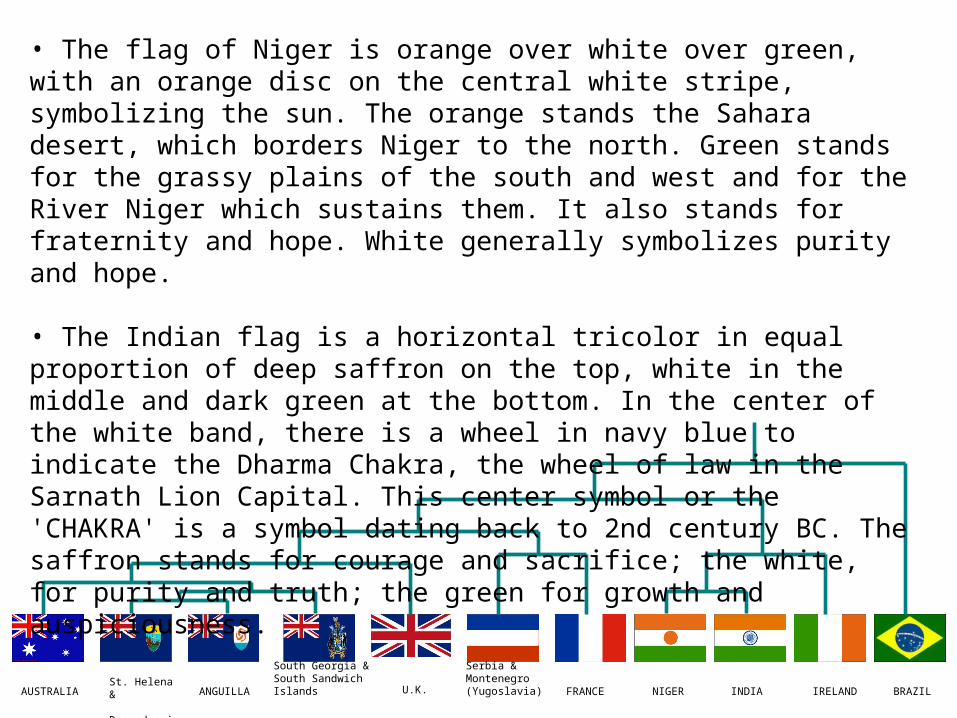
Hierarchal clustering can sometimes show Hierarchal clustering can sometimes show patterns that are meaningless or spuriouspatterns that are meaningless or spurious
• For example, in this clustering, the tight grouping of Australia, Anguilla, St. Helena etc is meaningful, since all these countries are former UK colonies.
• However the tight grouping of Niger and India is completely spurious, there is no connection between the two.
ANGUILLAAUSTRALIA St. Helena & Dependencies
South Georgia &South Sandwich Islands U.K.
Serbia & Montenegro(Yugoslavia) FRANCE NIGER INDIA IRELAND BRAZIL
• The flag of Niger is orange over white over green, with an orange disc on the central white stripe, symbolizing the sun. The orange stands the Sahara desert, which borders Niger to the north. Green stands for the grassy plains of the south and west and for the River Niger which sustains them. It also stands for fraternity and hope. White generally symbolizes purity and hope.
• The Indian flag is a horizontal tricolor in equal proportion of deep saffron on the top, white in the middle and dark green at the bottom. In the center of the white band, there is a wheel in navy blue to indicate the Dharma Chakra, the wheel of law in the Sarnath Lion Capital. This center symbol or the 'CHAKRA' is a symbol dating back to 2nd century BC. The saffron stands for courage and sacrifice; the white, for purity and truth; the green for growth and auspiciousness.
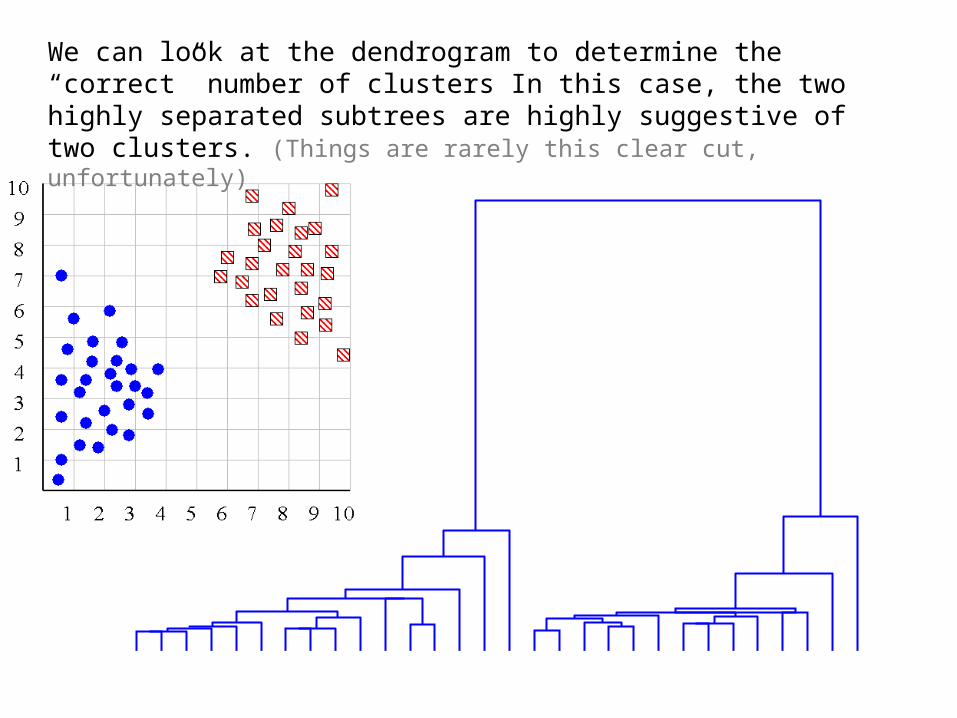
We can look at the dendrogram to determine the “correct” number of clusters In this case, the two highly separated subtrees are highly suggestive of two clusters. (Things are rarely this clear cut, unfortunately)
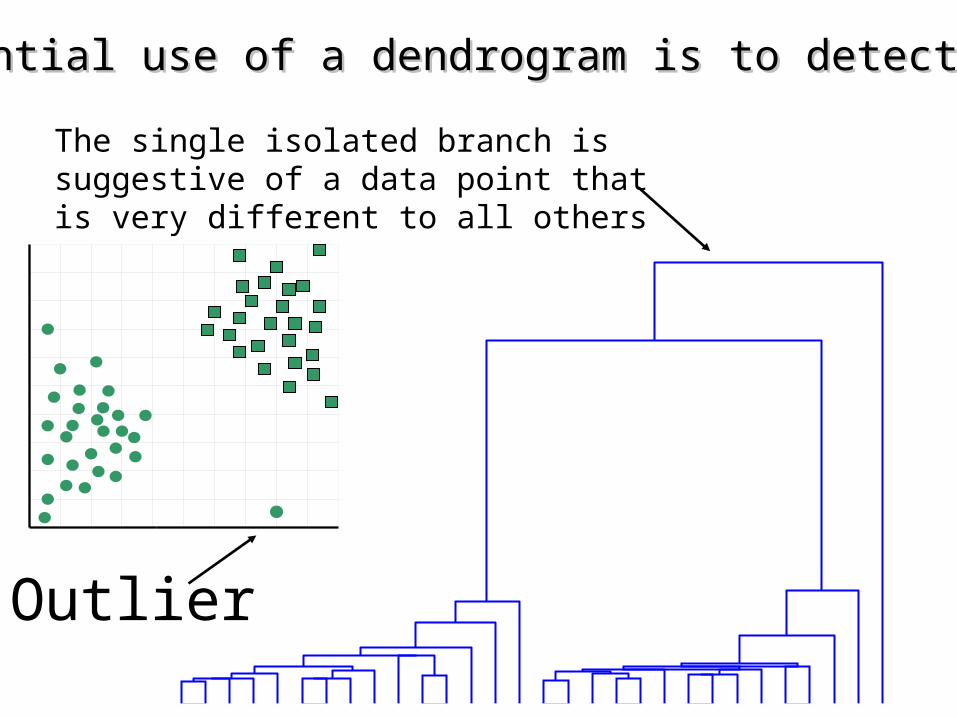
Outlier
One potential use of a dendrogram is to detect outliersOne potential use of a dendrogram is to detect outliers
The single isolated branch is suggestive of a data point that is very different to all others
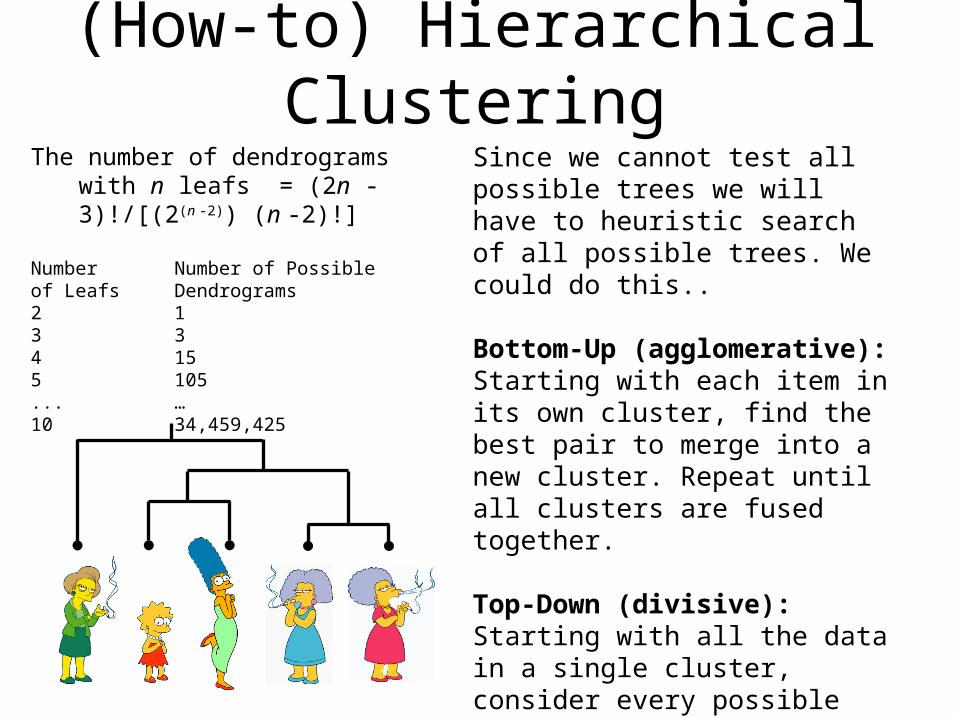
(How-to) Hierarchical ClusteringThe number of dendrograms with n
leafs = (2n -3)!/[(2(n -2)) (n -2)!]
Number Number of Possibleof Leafs Dendrograms 2 13 34 155 105... …10 34,459,425
Since we cannot test all possible trees we will have to heuristic search of all possible trees. We could do this..
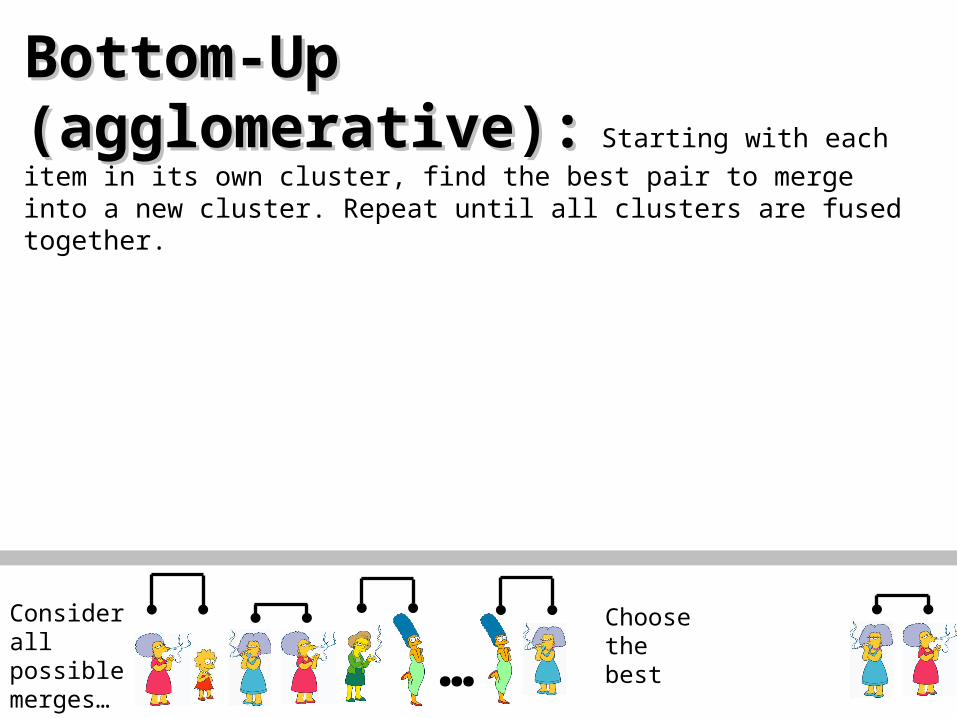
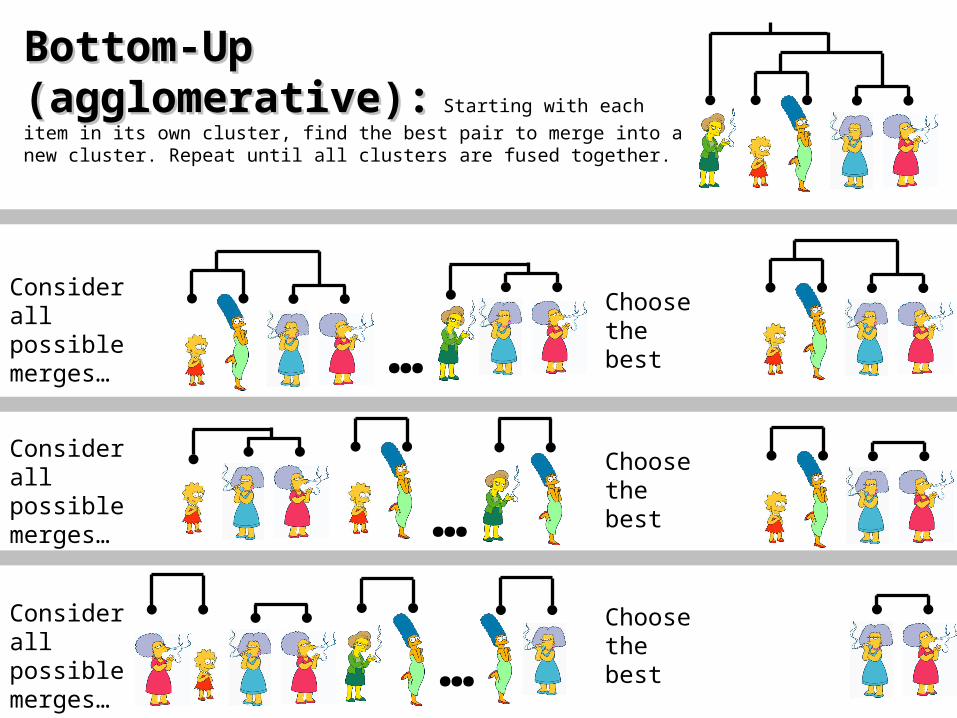
Bottom-Up (agglomerative): Starting with each item in its own cluster, find the best pair to merge into a new cluster. Repeat until all clusters are fused together.
Top-Down (divisive): Starting with all the data in a single cluster, consider every possible way to divide the cluster into two. Choose the best division and recursively operate on both sides.
0 8 8 7 70 2 4 4
0 3 30 1
0
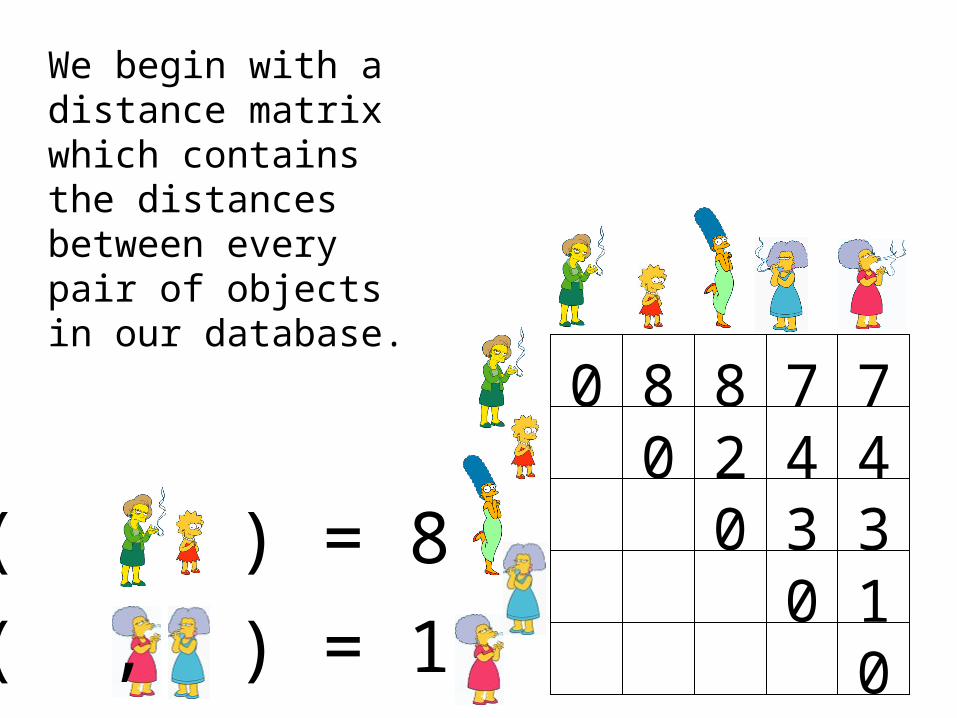
D( , ) = 8
D( , ) = 1
We begin with a distance matrix which contains the distances between every pair of objects in our database.
Bottom-Up (Bottom-Up (agglomerativeagglomerative):): Starting
with each item in its own cluster, find the best pair to merge into a new cluster. Repeat until all clusters are fused together.
…Consider all possible merges…
Choose the best
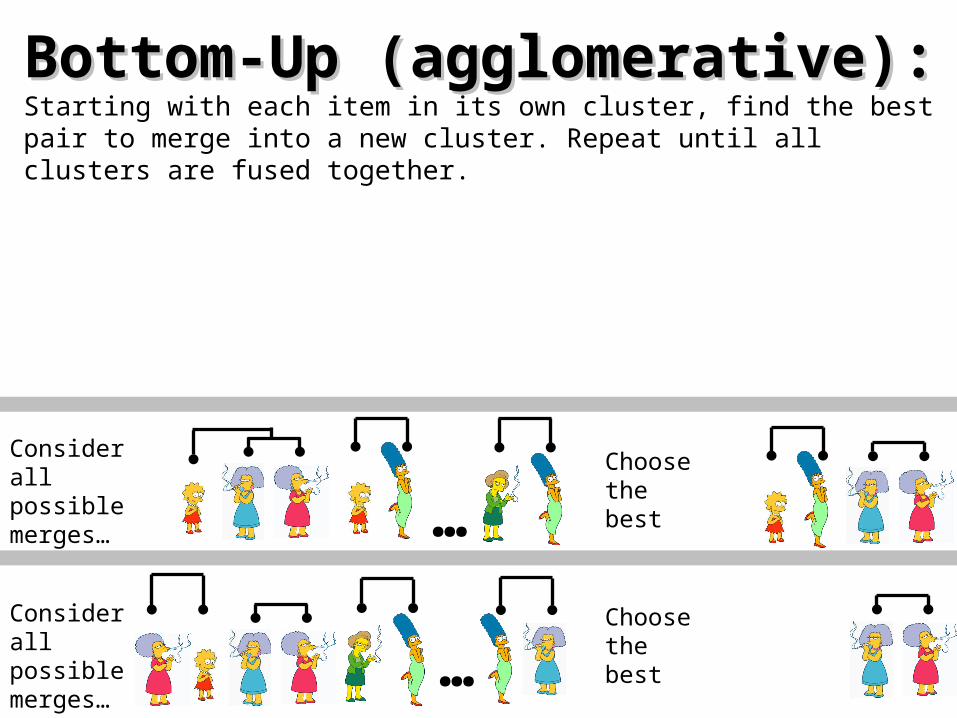
Bottom-Up (Bottom-Up (agglomerativeagglomerative):): Starting with
each item in its own cluster, find the best pair to merge into a new cluster. Repeat until all clusters are fused together.
…Consider all possible merges…
Choose the best
Consider all possible merges… …
Choose the best
Bottom-Up (Bottom-Up (agglomerativeagglomerative):): Starting
with each item in its own cluster, find the best pair to merge into a new cluster. Repeat until all clusters are fused together.
…Consider all possible merges…
Choose the best
Consider all possible merges… …
Choose the best
Consider all possible merges…
Choose the best
…
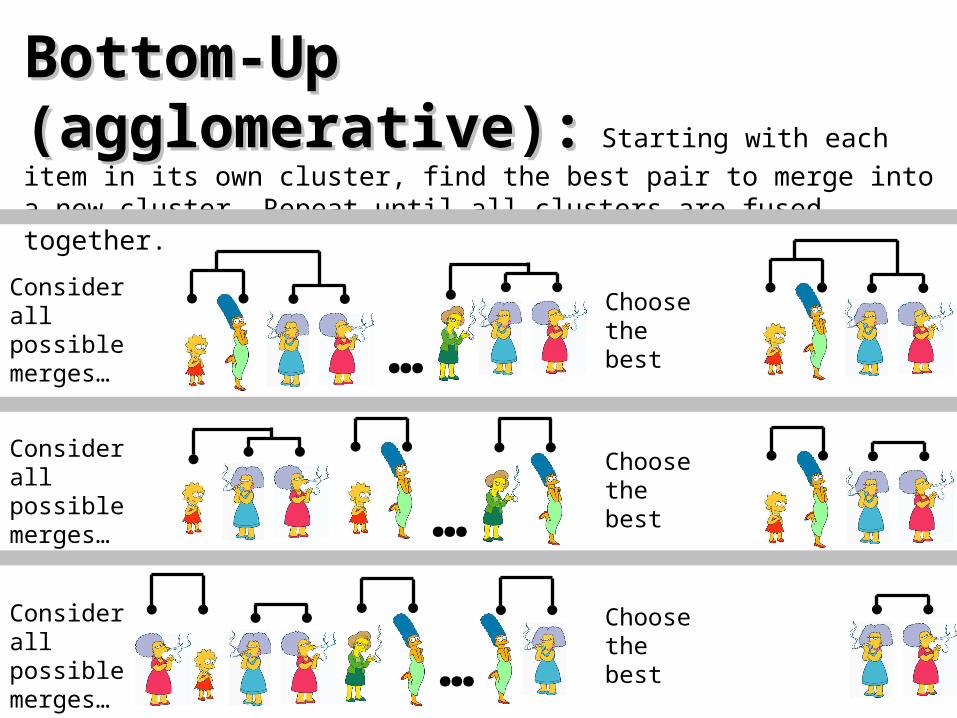
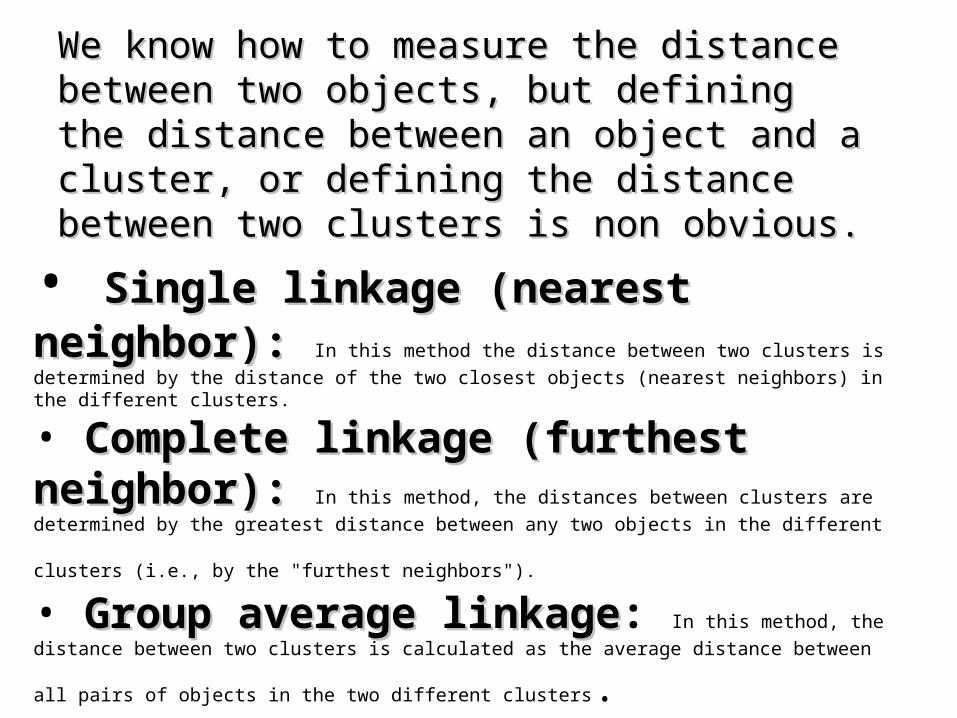
We know how to measure the distance between two We know how to measure the distance between two objects, but defining the distance between an object objects, but defining the distance between an object and a cluster, or defining the distance between two and a cluster, or defining the distance between two clusters is non obvious. clusters is non obvious.
• Single linkage (nearest neighbor):Single linkage (nearest neighbor): In this method
the distance between two clusters is determined by the distance of the two closest objects (nearest neighbors) in the different clusters.
• Complete linkage (furthest neighbor):Complete linkage (furthest neighbor): In this
method, the distances between clusters are determined by the greatest distance between any two objects in the
different clusters (i.e., by the "furthest neighbors"). • Group average linkageGroup average linkage: In this method, the distance between two
clusters is calculated as the average distance between all pairs of objects in the two different clusters.• Wards LinkageWards Linkage: In this method, we try to minimize the variance of the merged
clusters
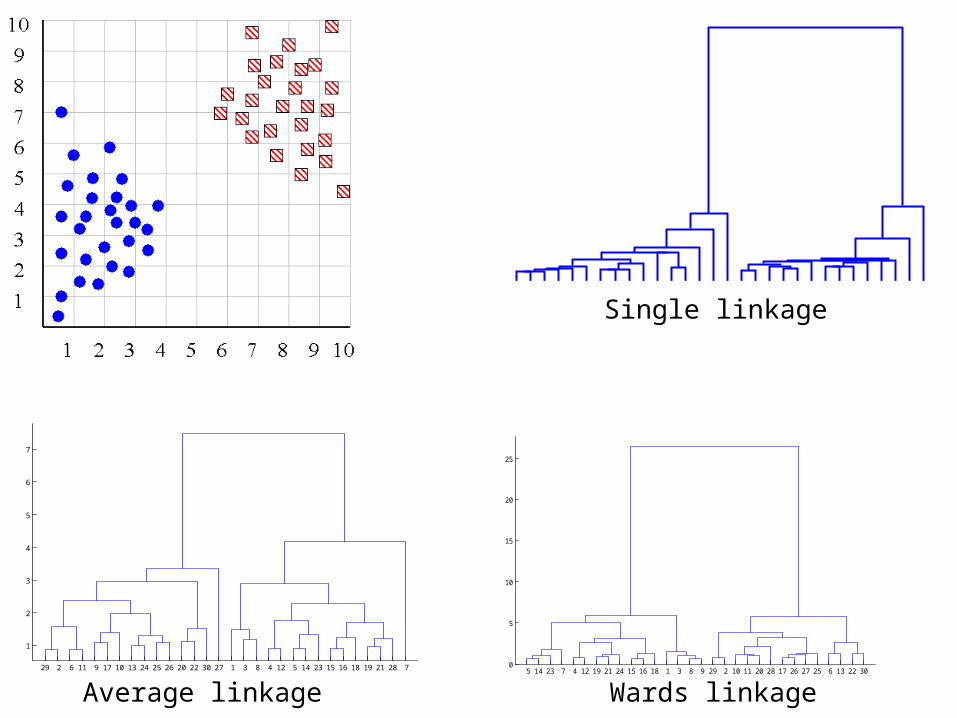
29 2 6 11 9 17 10 13 24 25 26 20 22 30 27 1 3 8 4 12 5 14 23 15 16 18 19 21 28 7
1
2
3
4
5
6
7
Average linkage 5 14 23 7 4 12 19 21 24 15 16 18 1 3 8 9 29 2 10 11 20 28 17 26 27 25 6 13 22 30
0
5
10
15
20
25
Wards linkage
Single linkage
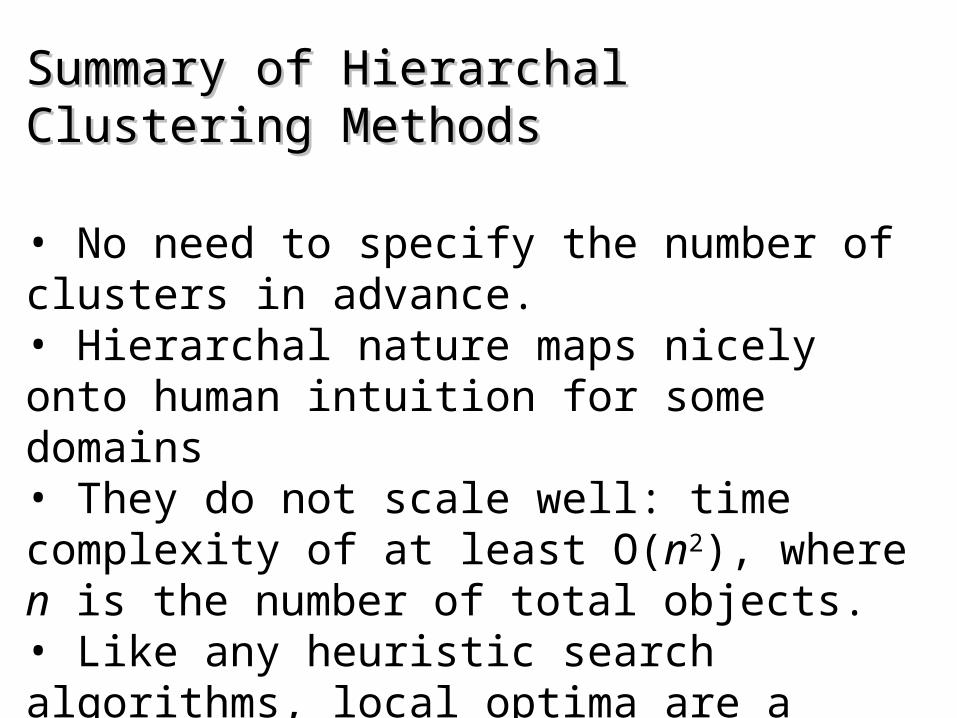
Summary of Hierarchal Clustering MethodsSummary of Hierarchal Clustering Methods
• No need to specify the number of clusters in advance. • Hierarchal nature maps nicely onto human intuition for some domains• They do not scale well: time complexity of at least O(n2), where n is the number of total objects.• Like any heuristic search algorithms, local optima are a problem.• Interpretation of results is (very) subjective.
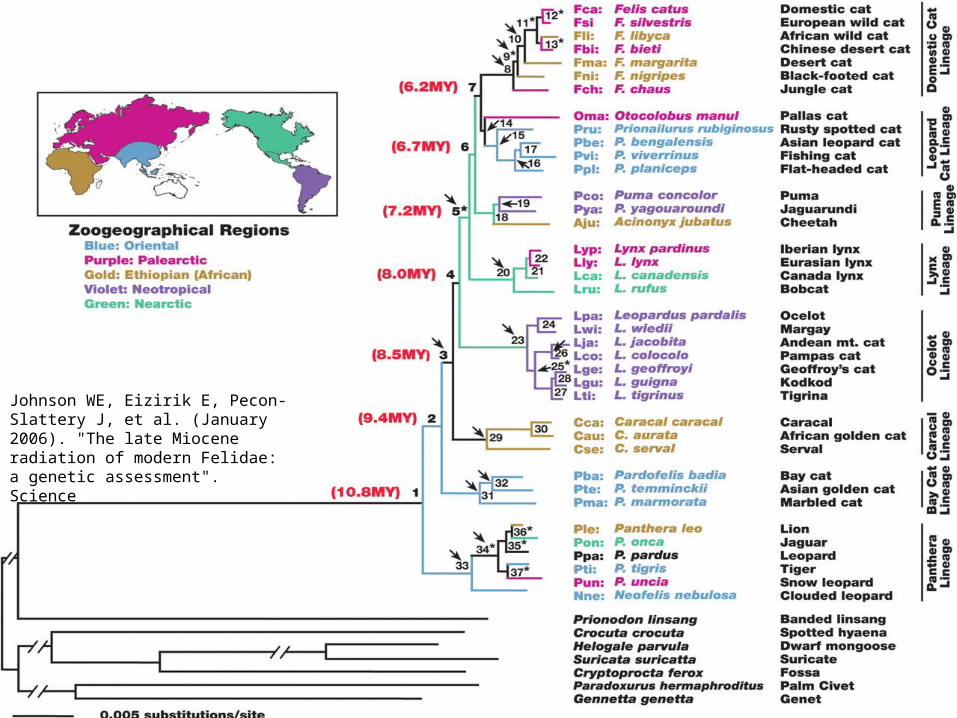
Johnson WE, Eizirik E, Pecon-Slattery J, et al. (January 2006). "The late Miocene radiation of modern Felidae: a genetic assessment". Science
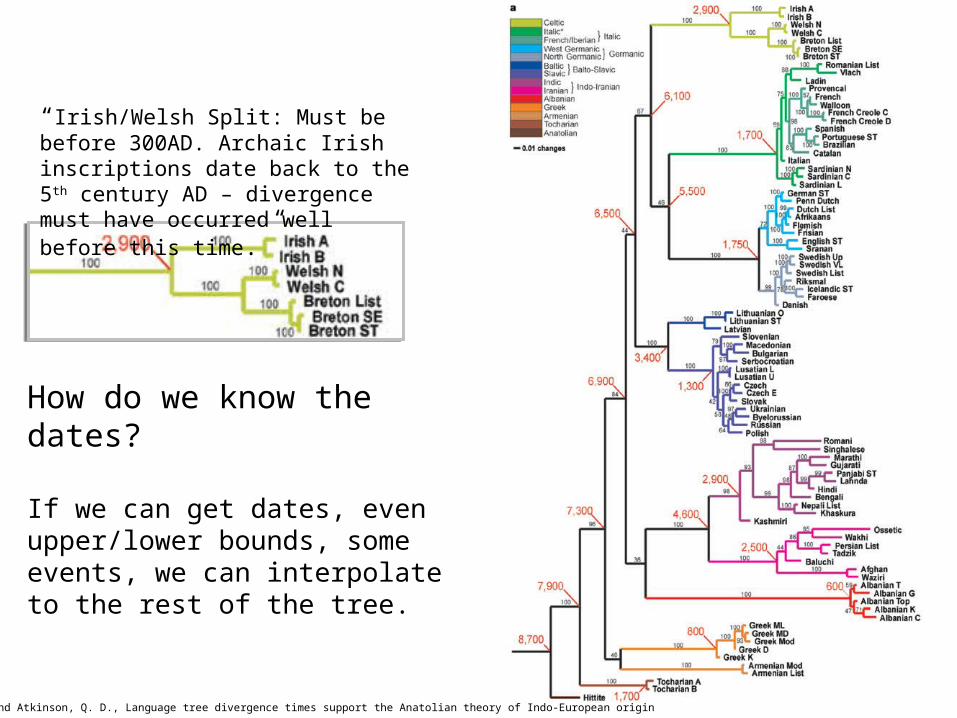
How do we know the dates?
If we can get dates, even upper/lower bounds, some events, we can interpolate to the rest of the tree.
“Irish/Welsh Split: Must be before 300AD. Archaic Irish inscriptions date back to the 5th century AD – divergence must have occurred well before this time.”
Gray, R.D. and Atkinson, Q. D., Language tree divergence times support the Anatolian theory of Indo-European origin
Chimpanzee
Pygmy Chimp
Human
Gorilla
Orangutan
Sumatran Orangutan
Gibbon Hellenic
Armenian
Persian
Persian
Hellenic
Armenian
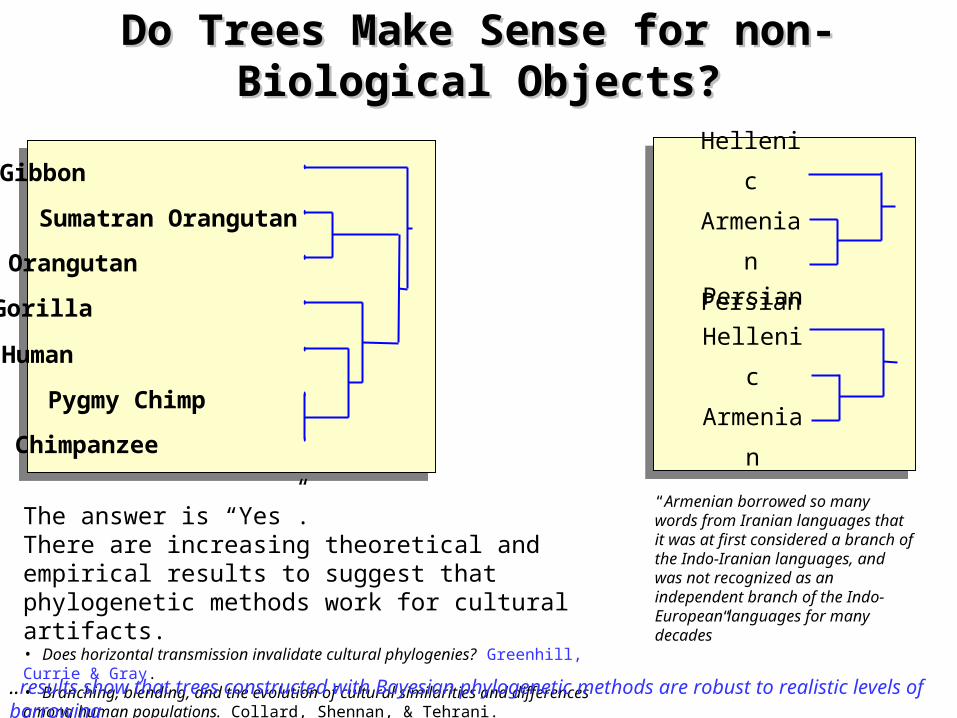
“Armenian borrowed so many words from Iranian languages that it was at first considered a branch of the Indo-Iranian languages, and was not recognized as an independent branch of the Indo-European languages for many decades”
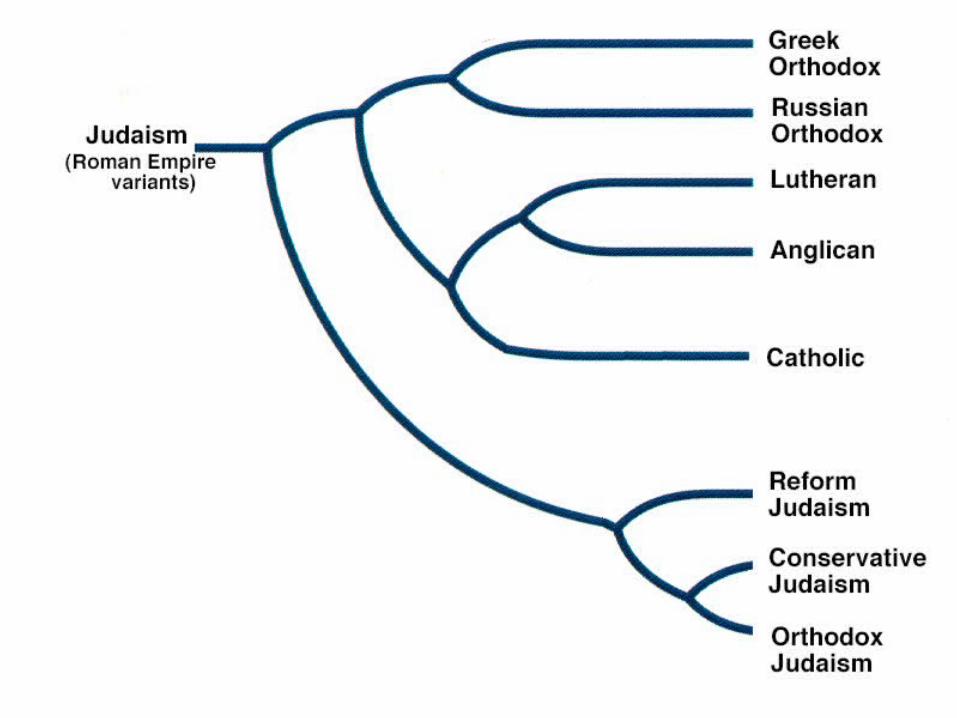
Do Trees Make Sense for non-Biological Objects?Do Trees Make Sense for non-Biological Objects?
The answer is “Yes”.There are increasing theoretical and empirical results to suggest that phylogenetic methods work for cultural artifacts. • Does horizontal transmission invalidate cultural phylogenies? Greenhill, Currie & Gray.• Branching, blending, and the evolution of cultural similarities and differences among human populations. Collard, Shennan, & Tehrani.
..results show that trees constructed with Bayesian phylogenetic methods are robust to realistic levels of borrowing
Gray, RD, Greenhill, SJ, & Ross, RM (2007). The Pleasures and Perils of Darwinizing Culture (with phylogenies). Biological Theory, 2(4)
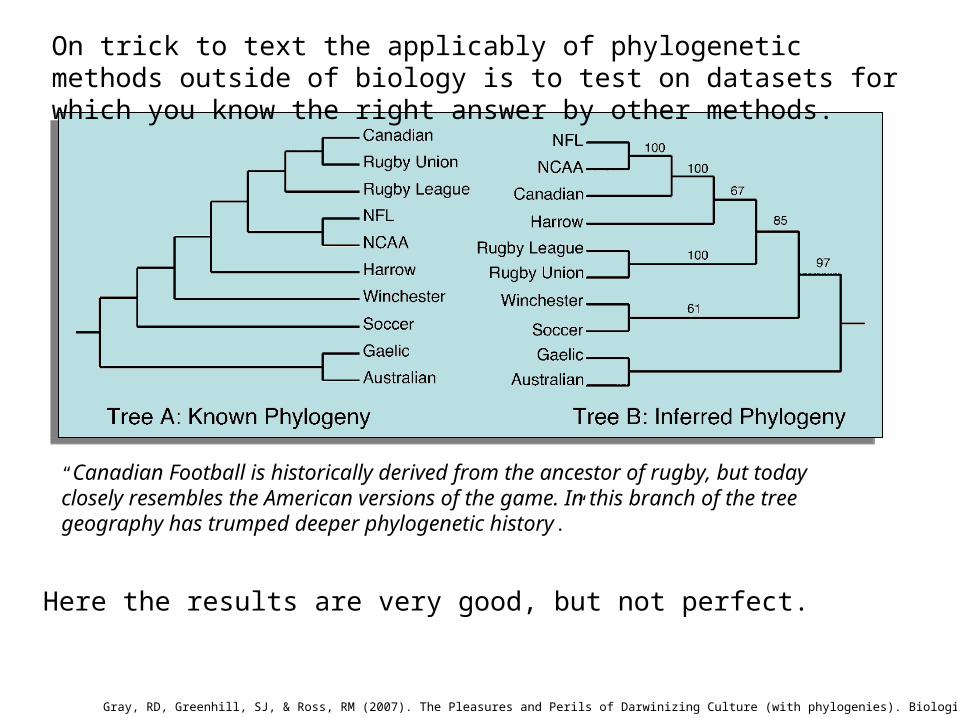
“Canadian Football is historically derived from the ancestor of rugby, but today closely resembles the American versions of the game. In this branch of the tree geography has trumped deeper phylogenetic history.”
On trick to text the applicably of phylogenetic methods outside of biology is to test on datasets for which you know the right answer by other methods.
Here the results are very good, but not perfect.
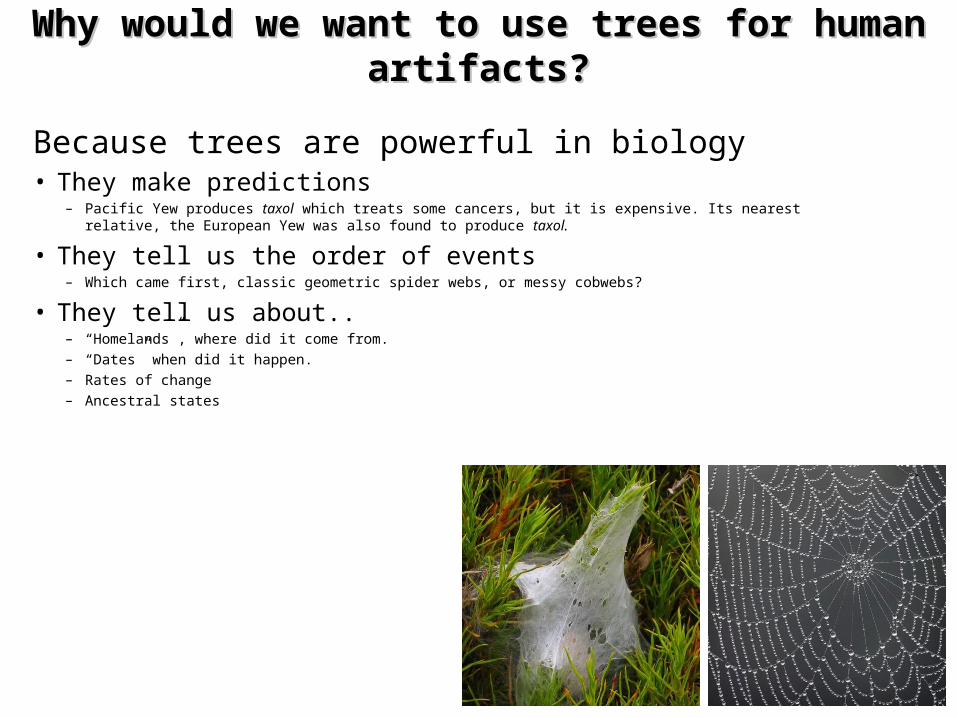
Because trees are powerful in biology • They make predictions
– Pacific Yew produces taxol which treats some cancers, but it is expensive. Its nearest relative, the European Yew was also found to produce taxol.
• They tell us the order of events– Which came first, classic geometric spider webs, or messy cobwebs?
• They tell us about..– “Homelands”, where did it come from.– “Dates” when did it happen.– Rates of change– Ancestral states
Why would we want to use trees for human artifacts?Why would we want to use trees for human artifacts?
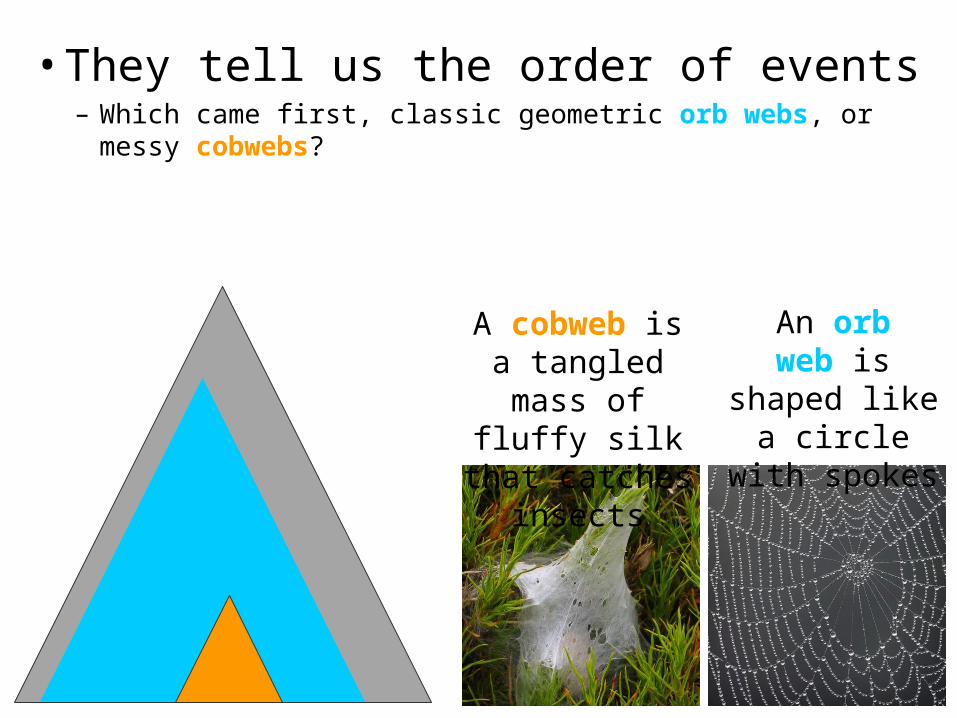
• They tell us the order of events– Which came first, classic geometric orb webs, or messy
cobwebs?
A cobweb is a tangled mass of fluffy silk that catches insects
An orb web is shaped like a circle with
spokes
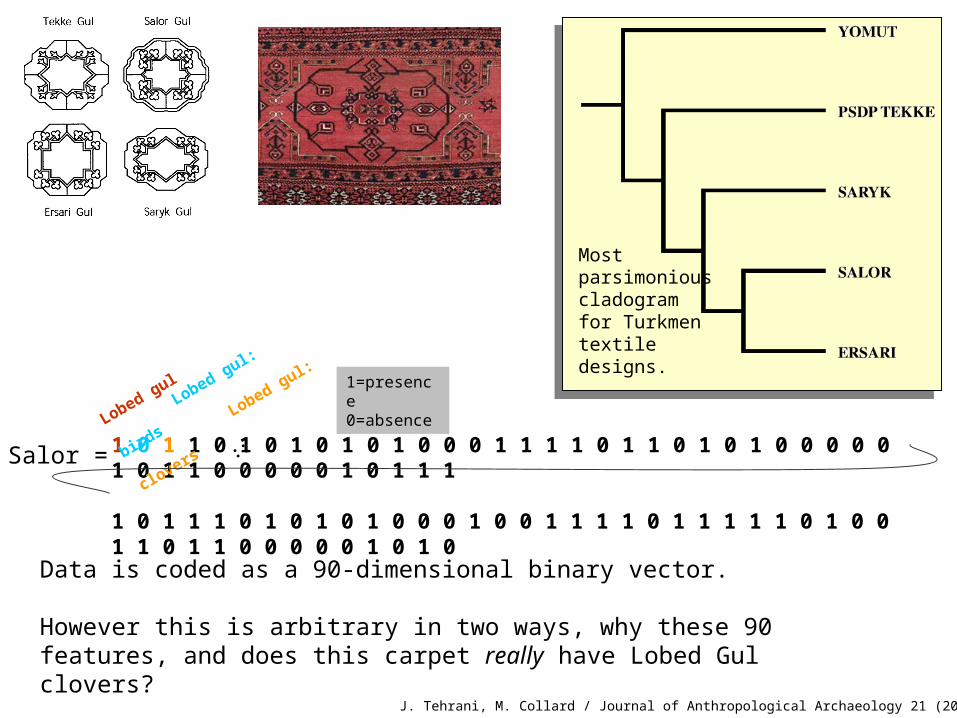
Most parsimonious cladogram for Turkmen textile designs.
J. Tehrani, M. Collard / Journal of Anthropological Archaeology 21 (2002) 443–463
1 0 1 1 0 1 0 1 0 1 0 1 0 0 0 1 1 1 1 0 1 1 0 1 0 1 0 0 0 0 0 1 0 1 1 0 0 0 0 0 1 0 1 1 1
1 0 1 1 1 0 1 0 1 0 1 0 0 0 1 0 0 1 1 1 1 0 1 1 1 1 1 0 1 0 0 1 1 0 1 1 0 0 0 0 0 1 0 1 0
1=presence 0=absence
Salor =
Lobed gul
Lobed gul: bird
s
Lobed gul: c
lovers
::
Data is coded as a 90-dimensional binary vector.
However this is arbitrary in two ways, why these 90 features, and does this carpet really have Lobed Gul clovers?
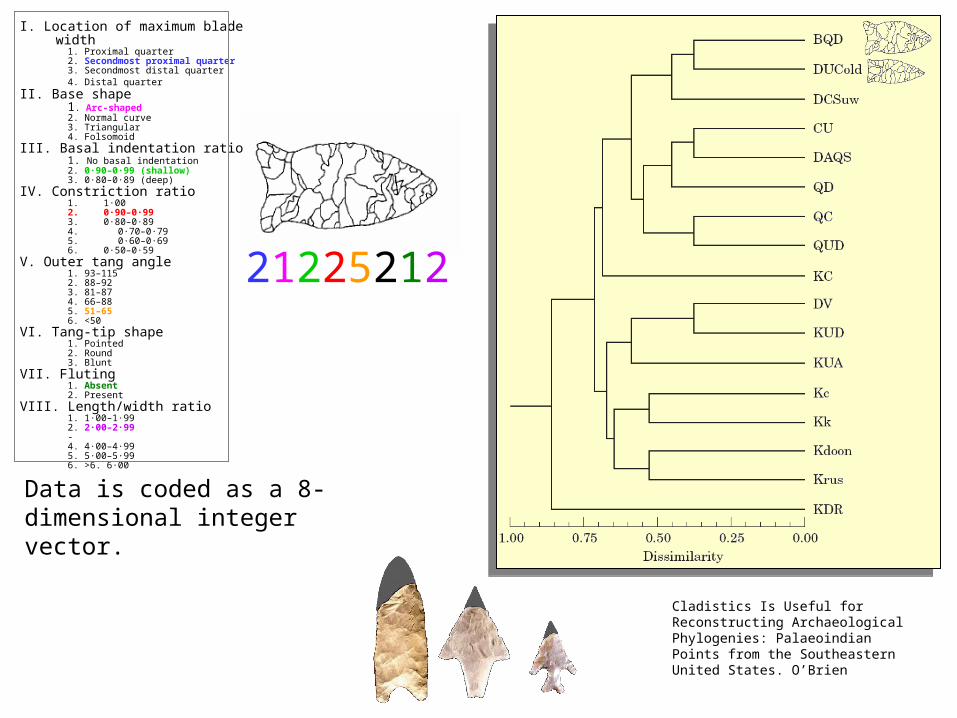
21225212
I. Location of maximum blade width 1. Proximal quarter2. Secondmost proximal quarter3. Secondmost distal quarter4. Distal quarter
II. Base shape1. Arc-shaped2. Normal curve3. Triangular4. Folsomoid
III. Basal indentation ratio1. No basal indentation2. 0·90–0·99 (shallow)3. 0·80–0·89 (deep)
IV. Constriction ratio1. 1·002. 0·90–0·99 3. 0·80–0·89 4. 0·70–0·79 5. 0·60–0·69 6. 0·50–0·59
V. Outer tang angle1. 93–1152. 88–923. 81–874. 66–885. 51–656. <50
VI. Tang-tip shape1. Pointed2. Round3. Blunt
VII. Fluting1. Absent2. Present
VIII. Length/width ratio1. 1·00–1·992. 2·00–2·99-4. 4·00–4·995. 5·00–5·996. >6. 6·00
Cladistics Is Useful for Reconstructing Archaeological Phylogenies: Palaeoindian Points from the Southeastern United States. O’Brien
Data is coded as a 8-dimensional integer vector.
An Inverted use of Dendrograms
• Suppose you have a new distance measure A, and you want to claim it is better than the old method B
• You could run some classification experiments and report some numbers..
• A get 95% B gets 90%
• But this is not very forceful, and it does not tell you when you win/lose
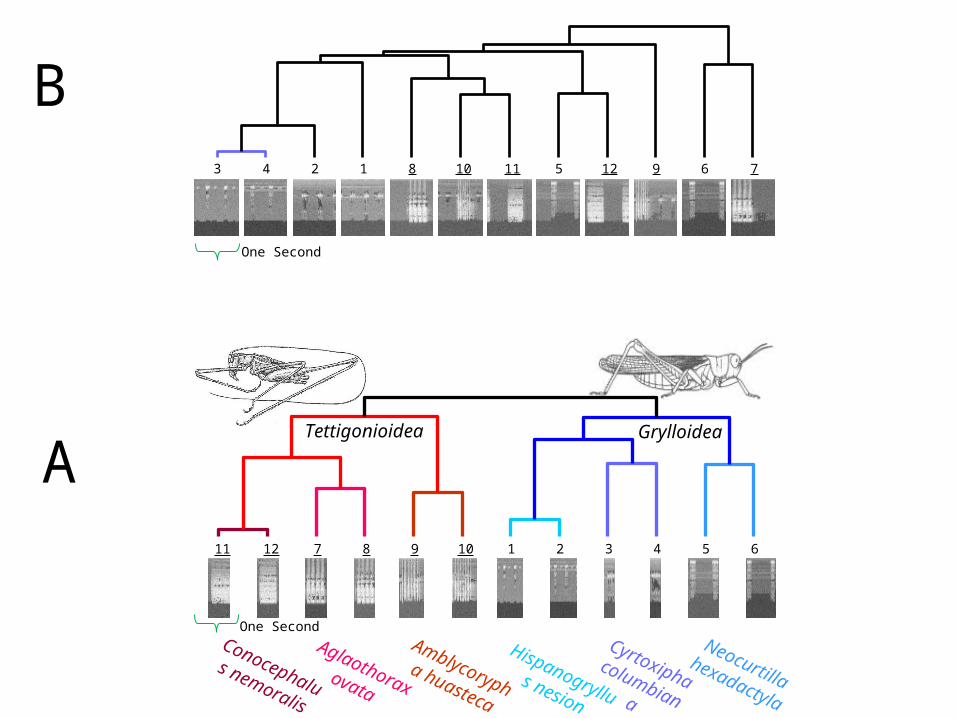
B
A
3 4 2 1 8 10 11 5 12 9 6 7
One Second
GrylloideaTettigonioidea
11 12 7 8 9 10 1 2 3 4 5 6
Hispanogryllus nesion
Cyrtoxipha columbiana
Neocurtilla hexadactyla
Aglaothorax ovata
Amblycorypha huasteca
Conocephalus nemoralis
One Second
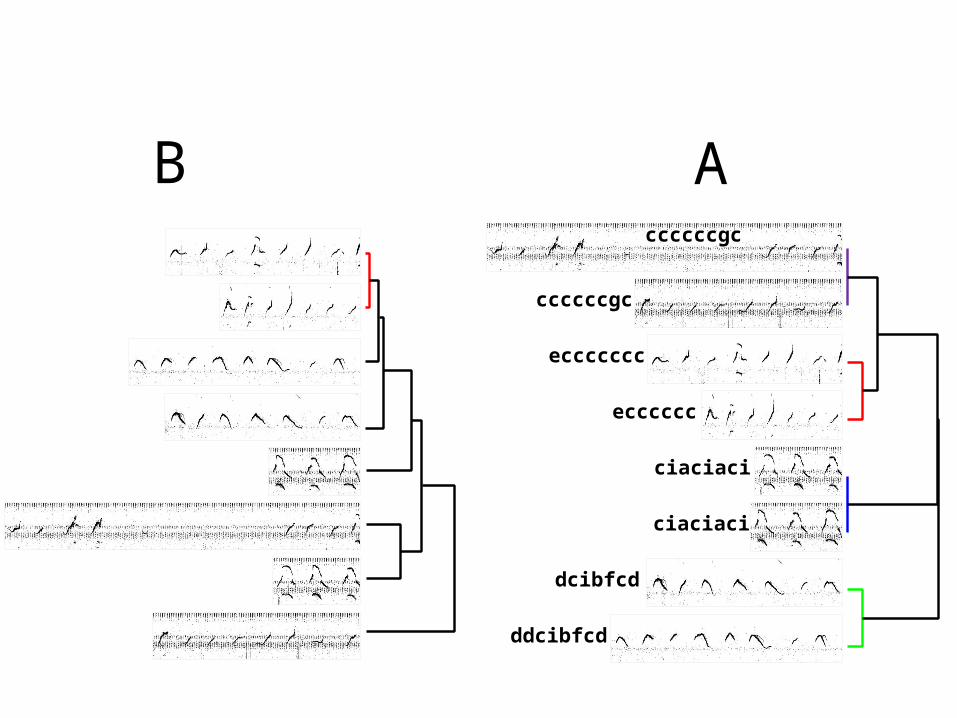
ddcibfcd
dcibfcd
ciaciaci
ciaciaci
ecccccc
eccccccc
ccccccgc
ccccccgc
B A
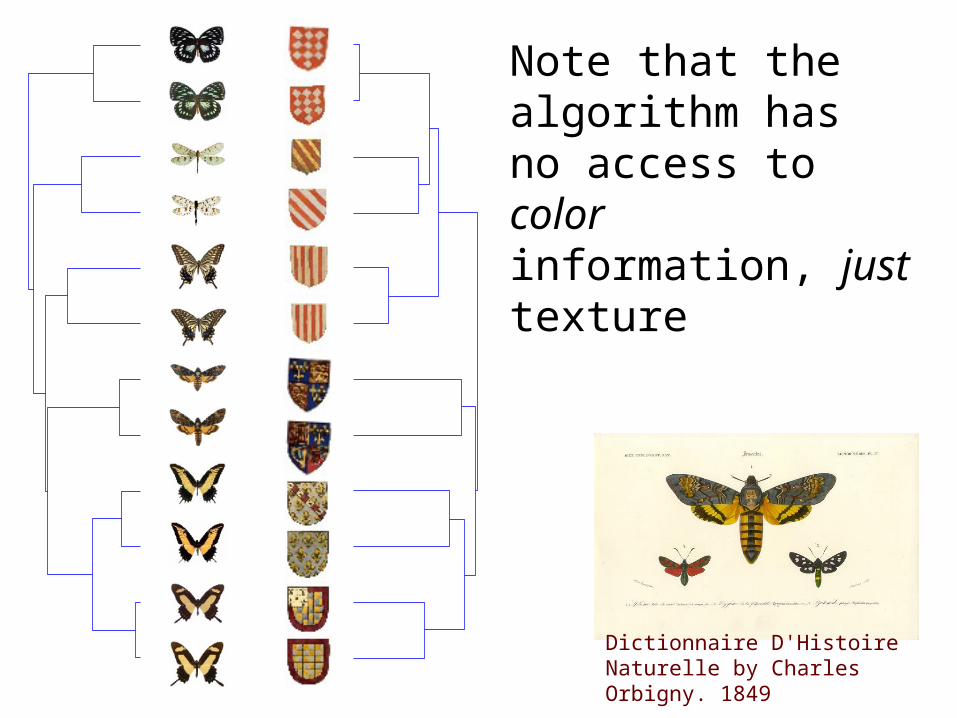
Note that the algorithm has no access to color information, just texture
Dictionnaire D'Histoire Naturelle by Charles Orbigny. 1849
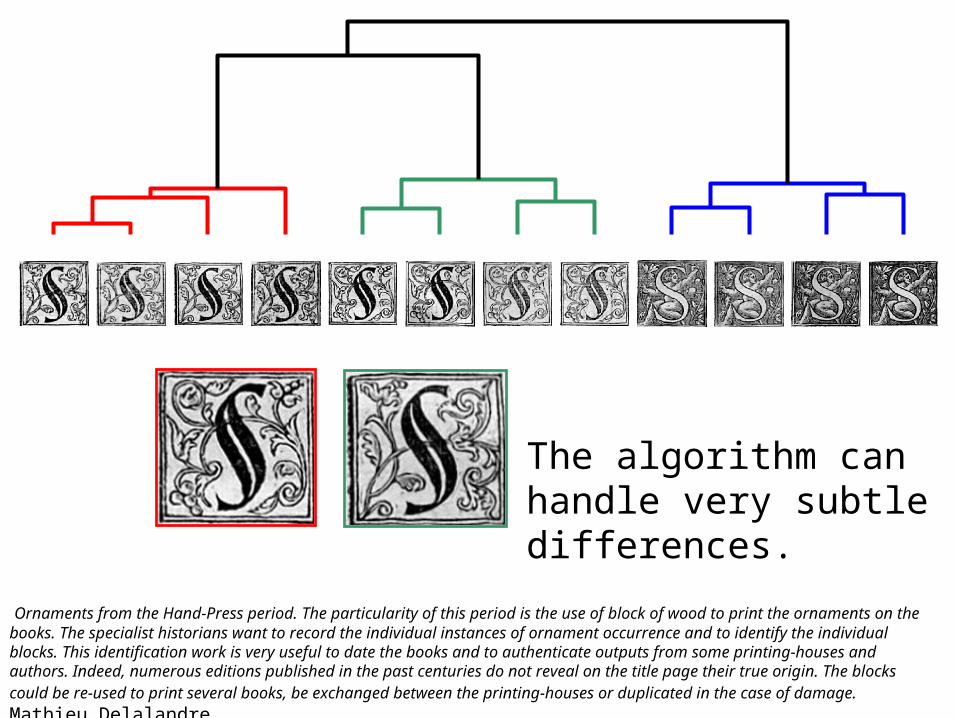
Ornaments from the Hand-Press period. The particularity of this period is the use of block of wood to print the ornaments on the books. The specialist historians want to record the individual instances of ornament occurrence and to identify the individual blocks. This identification work is very useful to date the books and to authenticate outputs from some printing-houses and authors. Indeed, numerous editions published in the past centuries do not reveal on the title page their true origin. The blocks could be re-used to print several books, be exchanged between the printing-houses or duplicated in the case of damage. Mathieu Delalandre
The algorithm can handle very subtle differences.
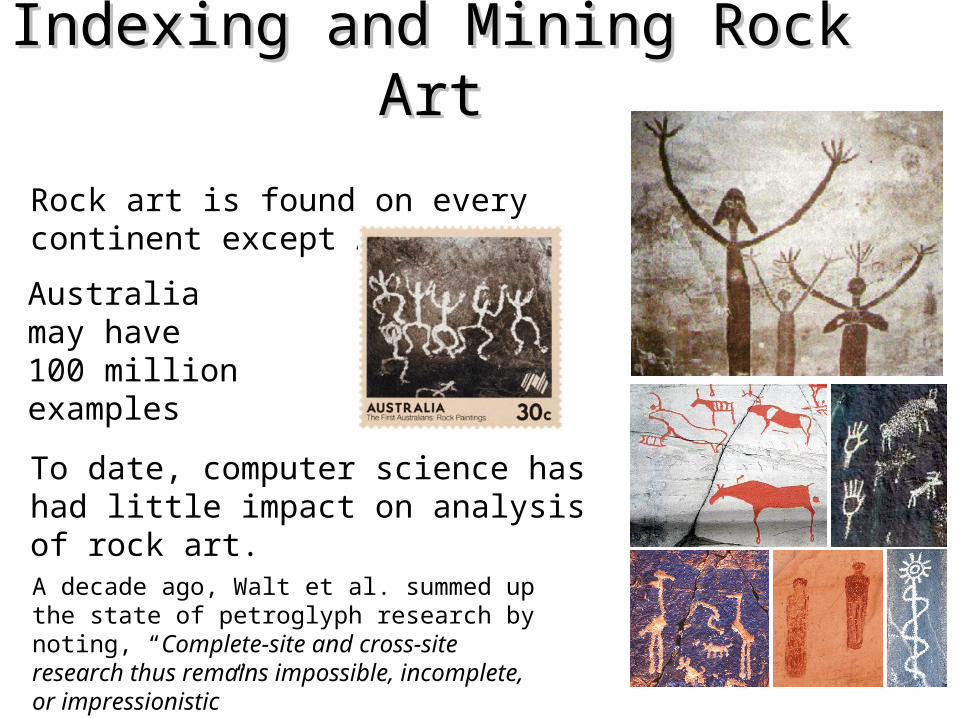
Indexing and Mining Rock ArtIndexing and Mining Rock Art
Rock art is found on every continent except Antarctica.
To date, computer science has had little impact on analysis of rock art.
A decade ago, Walt et al. summed up the state of petroglyph research by noting, “Complete-site and cross-site research thus remains impossible, incomplete, or impressionistic”
Australia may have 100 million examples
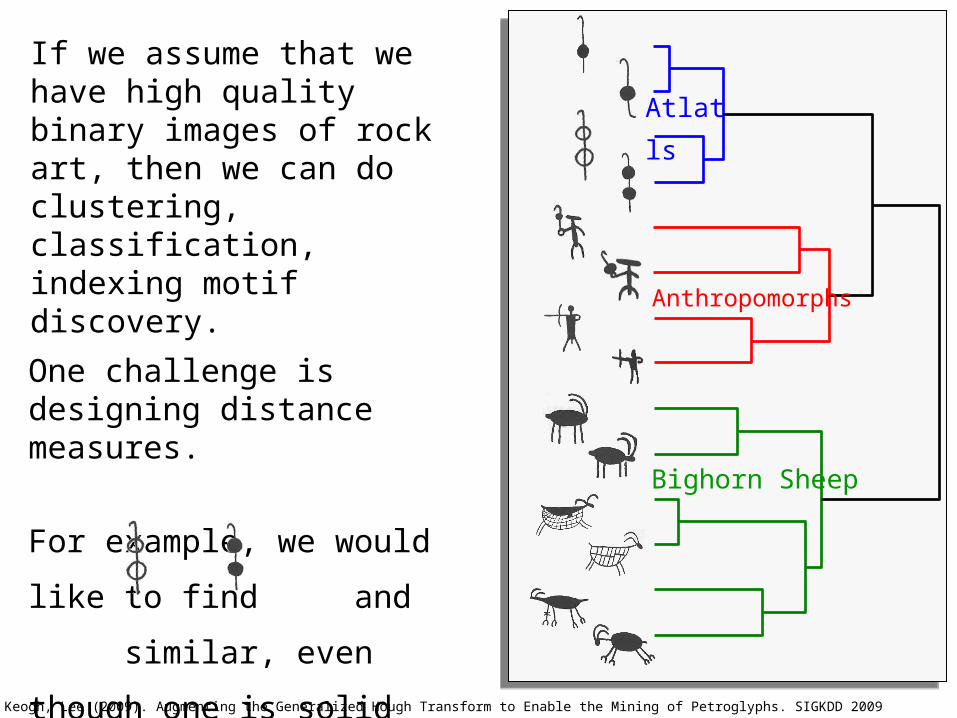
Atlatls
Anthropomorphs
Bighorn Sheep
One challenge is designing distance measures.
For example, we would like
to find and similar,
even though one is solid and
one is hollow. *Zhu, Wang, Keogh, Lee (2009). Augmenting the Generalized Hough Transform to Enable the Mining of Petroglyphs. SIGKDD 2009
If we assume that we have high quality binary images of rock art, then we can do clustering, classification, indexing motif discovery.

Eamonn Eamonn
KeoghKeogh Computer Science & Computer Science &
Engineering DepartmentEngineering Department
University of California – RiversideUniversity of California – Riverside
[email protected]@cs.ucr.edu