Embed Size (px)
Citation preview

Department of AgricultureDepartment of AgricultureMaharashtra StateMaharashtra State
ParticularsParticulars IndiaIndia MSMS %%
Total Geographical Area 3287.30
307.58 9.40
Area under Forest 774.74
61.94 8.00
Area under non-agri use 225.60
14.12 6.26
Cultivable waste land 142.60 9.15
6.42
Area unfit for cultivation184.70
17.19 9.31
Area under cultivation 1408.61 174.73 12.40
Gross area Irrigated 872.60
40.37 4.60
Population (Crores)
102.86
9.69 11.6
(Lakh Ha.)
Area under non-agri use Area under non-agri use Source :Economic Survey of Maharashtra 2010-11
LAND USE PATTRN

Agro-climatic Zones in Maharashtra
3

• Pressure of the population on land(55%)• Skewed distribution of operational holdings(1.44 %)• Limited area under irrigation(17.90 %)
(National avg.45.50%)• Vast drought prone area(52%)• Extent of ill-drained & saline soil(4.23%)• Extent of light soil(39%)• Degraded Soils(42.5%)• Erratic behavior of Mansoon• Constant Threat of Drought• Erosion in Catchment Area of Major Projects
Current Concerns of Agriculture in Maharashtra
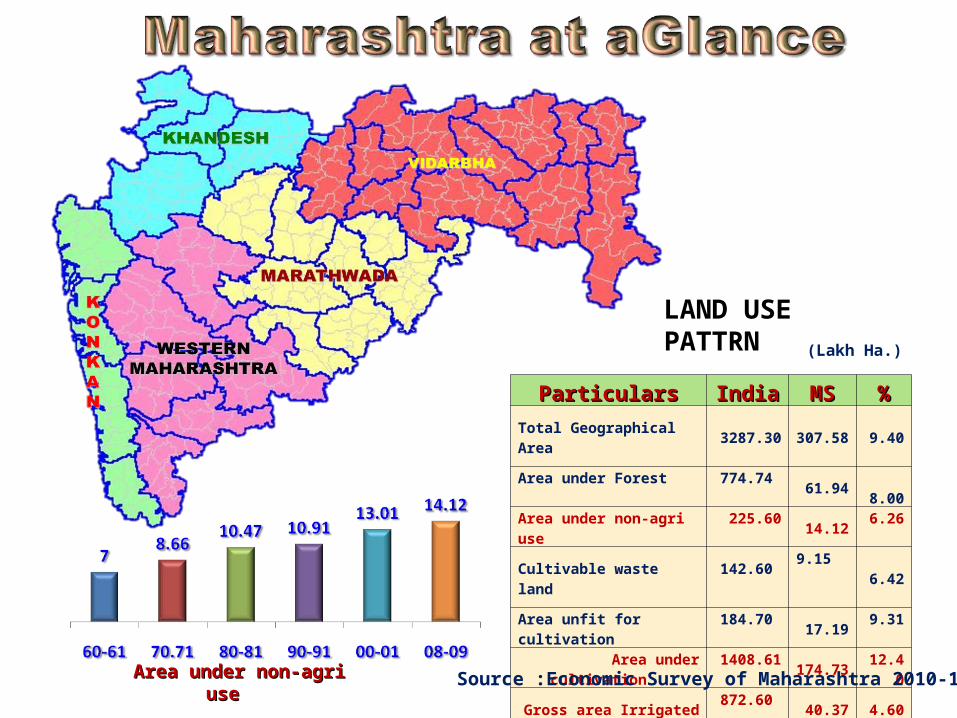
FERTILITY STATUS OF SOILS IN MAHARASHTRA
YearFertility status Fertility Level
N P K N P K
1981-1985 1.51 1.07 2.59 M L H
1985-1990 1.43 1.03 2.74 M L H
1990-1995 1.33 0.95 2.70 M L H
1995-2000 1.25 0.91 2.62 L L H
2000-2005 1.37 1.09 2.43 M L H
L-Low M-Medium H-High 0.76-1.25 1.26-1.75 2.26-2.75

Samples Analyzed during 2005 to 2010
Sr.No YearSamples analyzed
Ph, EC, NPK Micro nutrient
1 2005-06 1,09,983 82892 2006-07 1,44,694 16,6893 2007-08 1,63,956 21,1094 2008-09 1,44,301 27,7535 2009-10 2,13,543 23,702
Total 7,76,477 97,542

Majority of Soil are Neutral to Moderately Alkaline in nature.

Ec. below 1 - normal, 1-2 - harmful to germination 2-3 - harmful to salt sensitive crops above 3 harmful to majority crops

Ranges of Nutrient Level : 0.76-1.25 Low / 1.26-1.75 Medium / 2.26-2.75 High
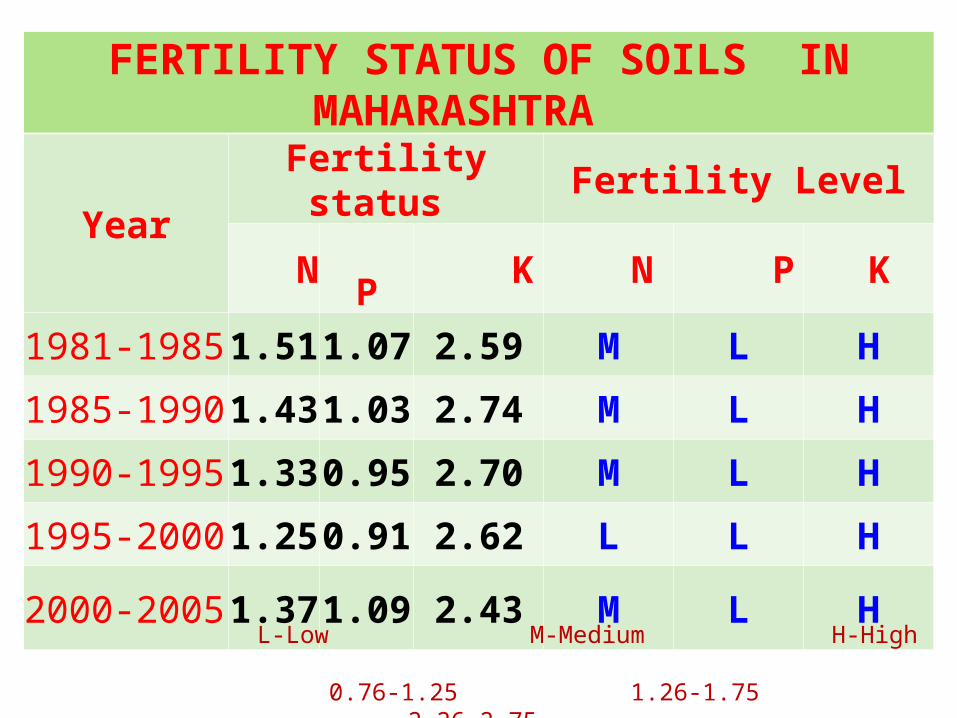
Districtwise Nitrogen (N) Status
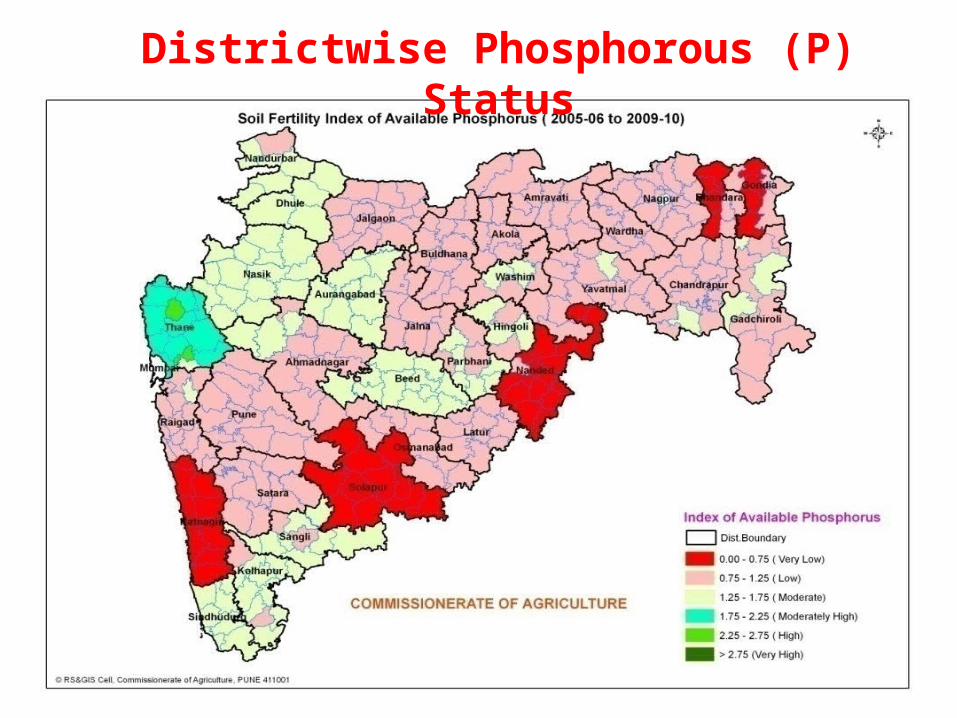
Districtwise Phosphorous (P) Status

Districtwise Patassium (K) Status
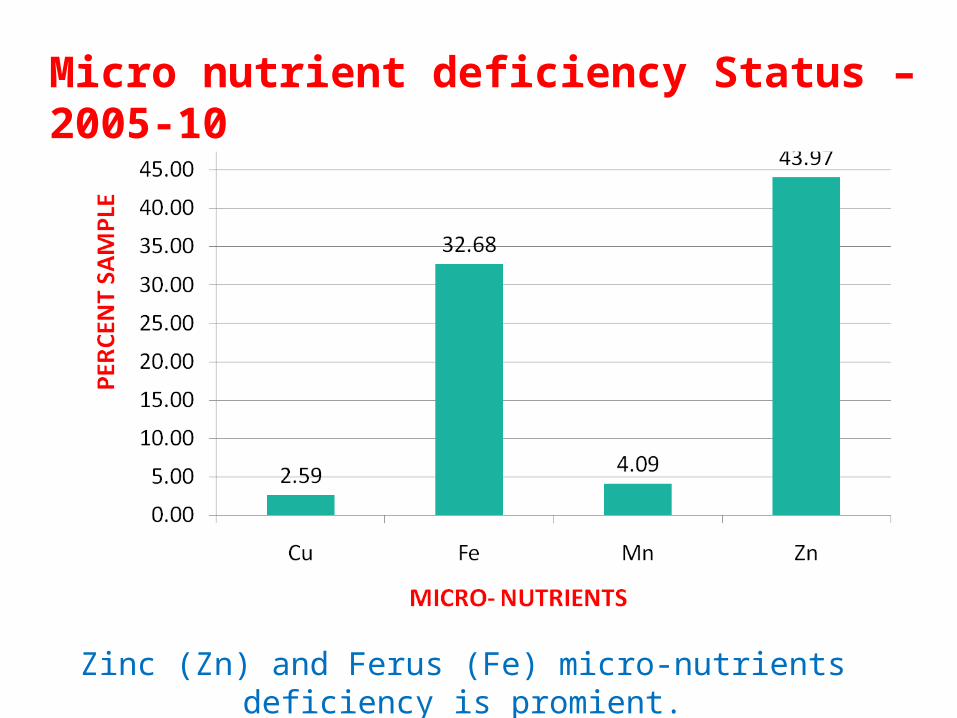
Zinc (Zn) and Ferus (Fe) micro-nutrients deficiency is promient.
Micro nutrient deficiency Status – 2005-10
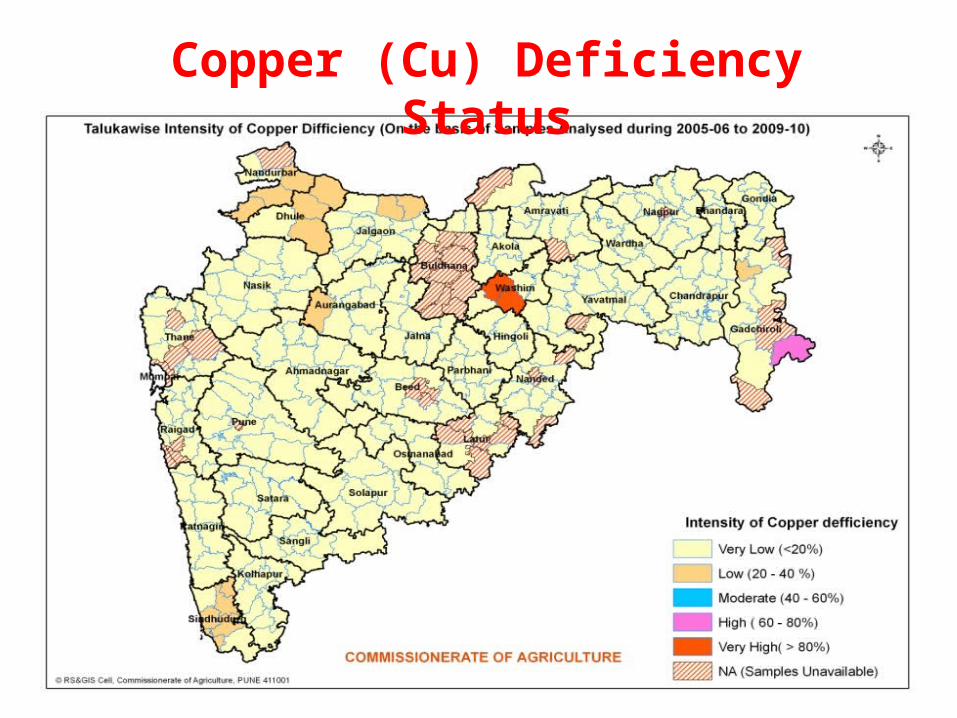
Copper (Cu) Deficiency Status
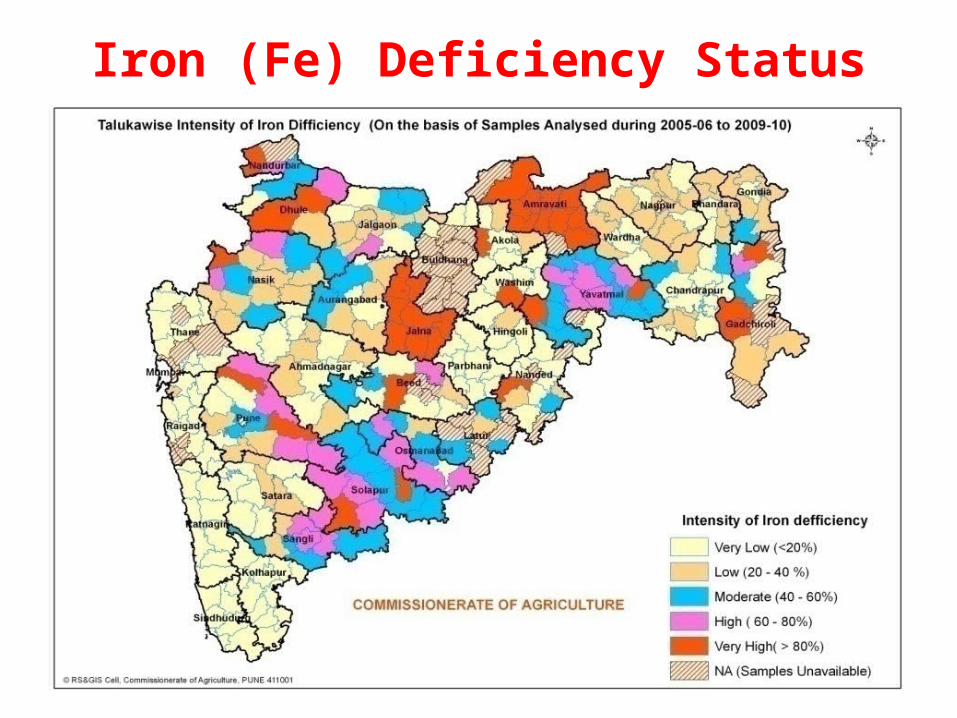
Iron (Fe) Deficiency Status

Manganese (Mn) Deficiency Status
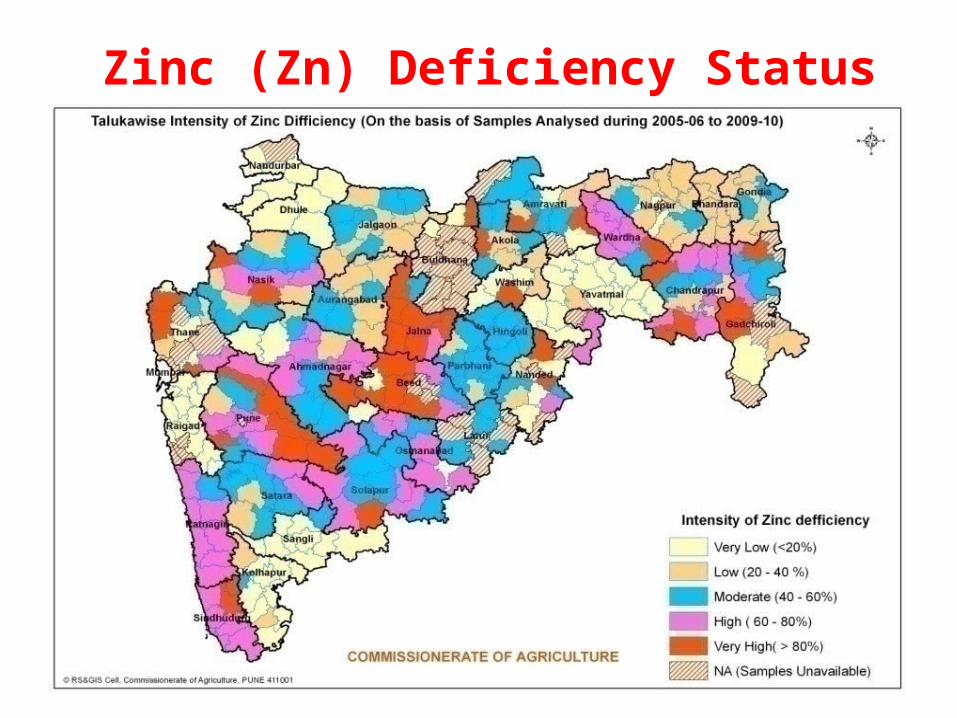
Zinc (Zn) Deficiency Status
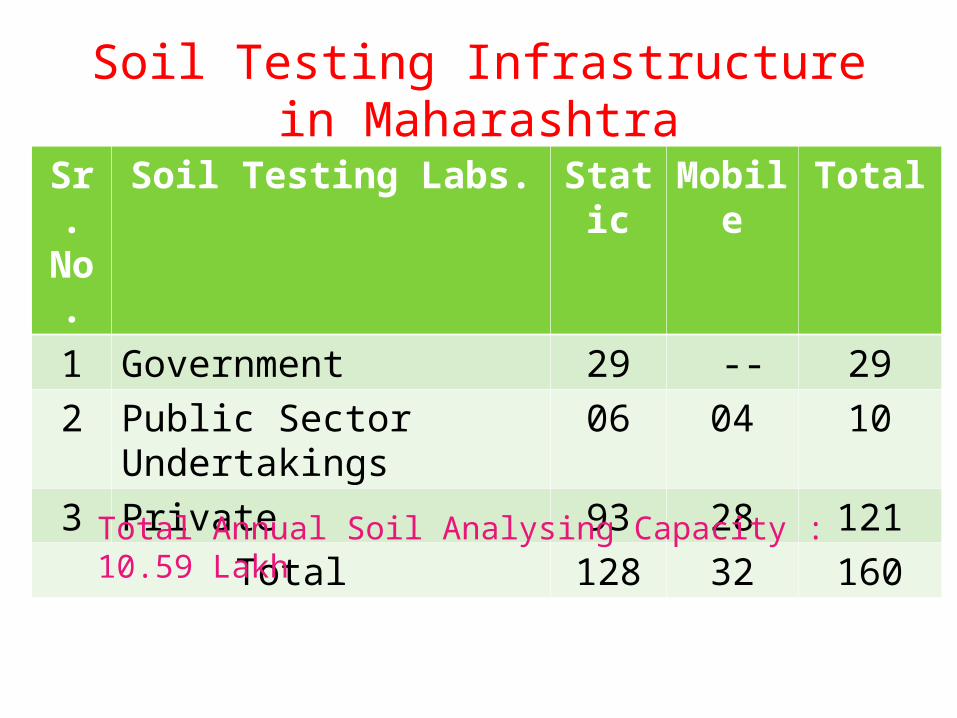
Soil Testing Infrastructure in Maharashtra
Sr. No.
Soil Testing Labs. Static Mobile Total
1 Government 29 -- 292 Public Sector Undertakings 06 04 103 Private 93 28 121
Total 128 32 160
Total Annual Soil Analysing Capacity : 10.59 Lakh
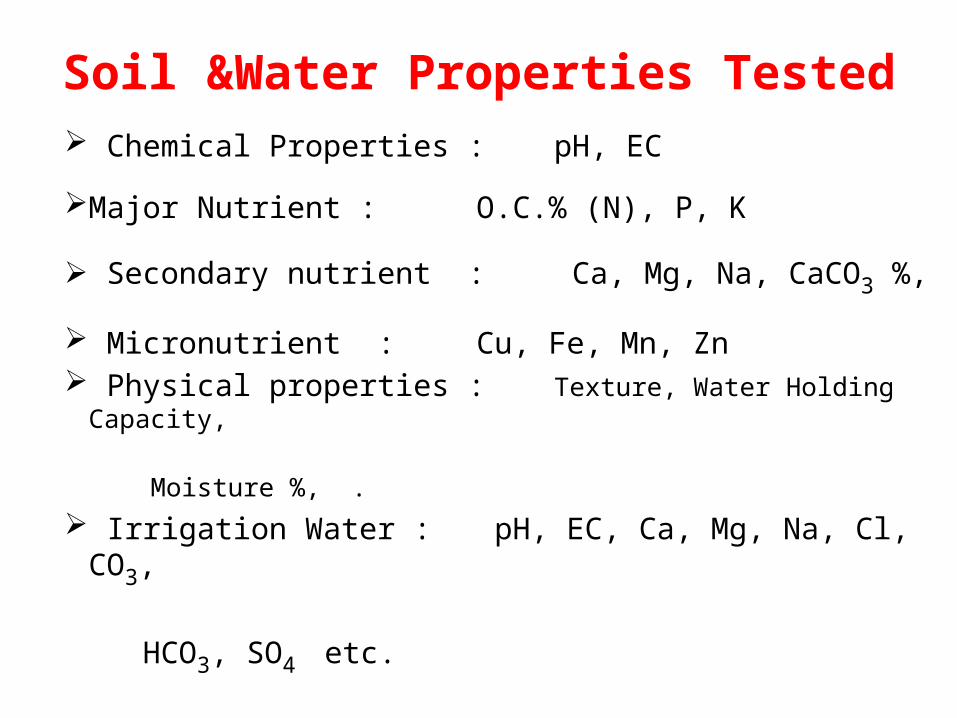
Soil &Water Properties Tested Chemical Properties : pH, EC
Major Nutrient : O.C.% (N), P, K
Secondary nutrient : Ca, Mg, Na, CaCO3 %,
Micronutrient : Cu, Fe, Mn, Zn Physical properties : Texture, Water Holding Capacity, Moisture %, .
Irrigation Water : pH, EC, Ca, Mg, Na, Cl, CO3,
HCO3, SO4 etc.
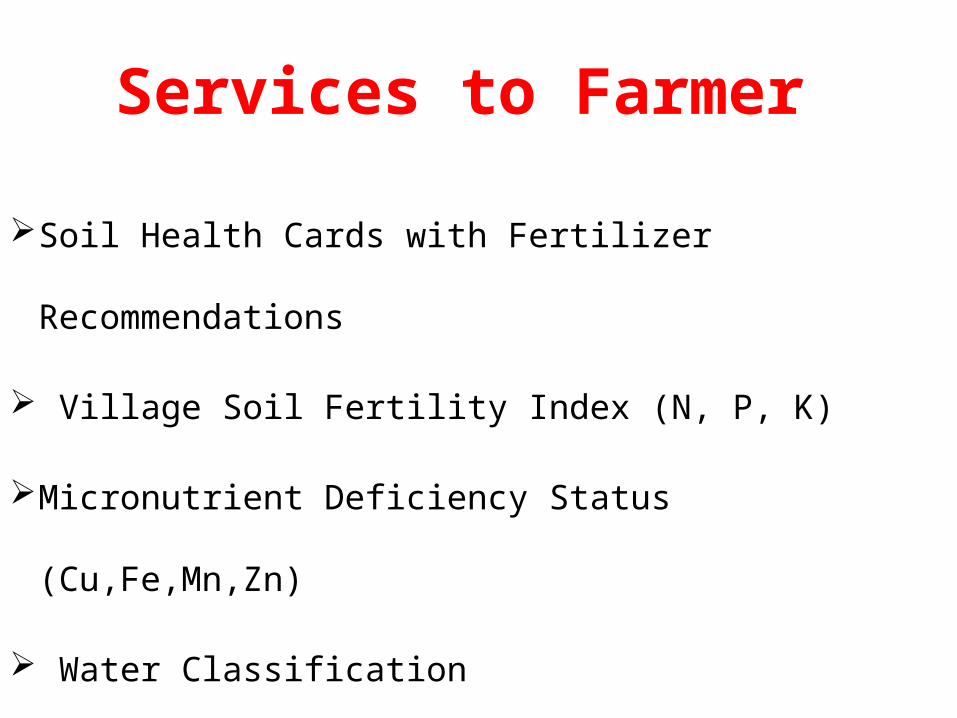
Services to Farmer
Soil Health Cards with Fertilizer Recommendations
Village Soil Fertility Index (N, P, K)
Micronutrient Deficiency Status (Cu,Fe,Mn,Zn)
Water Classification

STATUS OF SOIL TESTING IN MAHARASHTRA
Sample Type 2012-13 2013-14 2014-15
Target Achiev’t % Target Achiev’t % Target Achiev’t(till
Aug.14)
%
General soil samples
2,00,000 2,41,288 121 2,00,000 2,25,408 113 2,00,000 74,683 37
Micronutrient samples
2,00,000 1,44,996 73 2,00,000 1,58,752 79 2,00,000 42,548 21
Special soil samples
20, 000 23,551 118 20, 000 18,677 93 20, 000 8,362 42
Water samples 20, 000 36,864 184 20, 000 35,522 178 20, 000 10,978 55
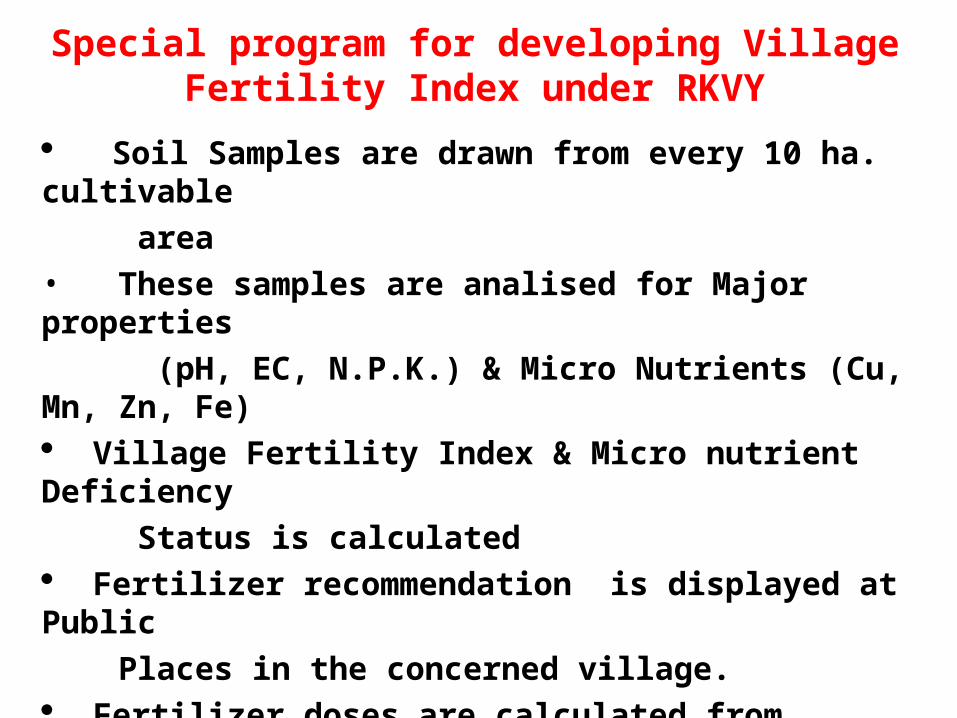
Special program for developing Village Fertility Index under RKVY
Soil Samples are drawn from every 10 ha. cultivable
area• These samples are analised for Major properties
(pH, EC, N.P.K.) & Micro Nutrients (Cu, Mn, Zn, Fe) Village Fertility Index & Micro nutrient Deficiency
Status is calculated Fertilizer recommendation is displayed at Public
Places in the concerned village. Fertilizer doses are calculated from Village Fertility
Index This will help in INM & balance use of fertilizer.
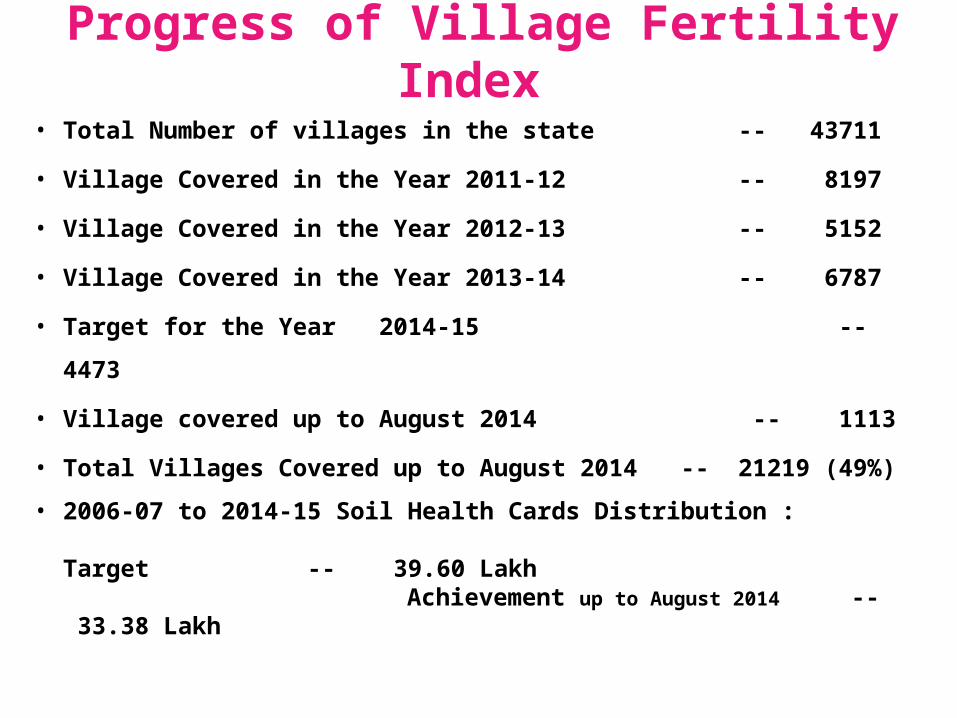
Progress of Village Fertility Index
• Total Number of villages in the state -- 43711
• Village Covered in the Year 2011-12 -- 8197
• Village Covered in the Year 2012-13 -- 5152
• Village Covered in the Year 2013-14 -- 6787
• Target for the Year 2014-15 -- 4473
• Village covered up to August 2014 -- 1113
• Total Villages Covered up to August 2014 -- 21219 (49%)
• 2006-07 to 2014-15 Soil Health Cards Distribution : Target -- 39.60 Lakh Achievement up to August 2014 -- 33.38 Lakh

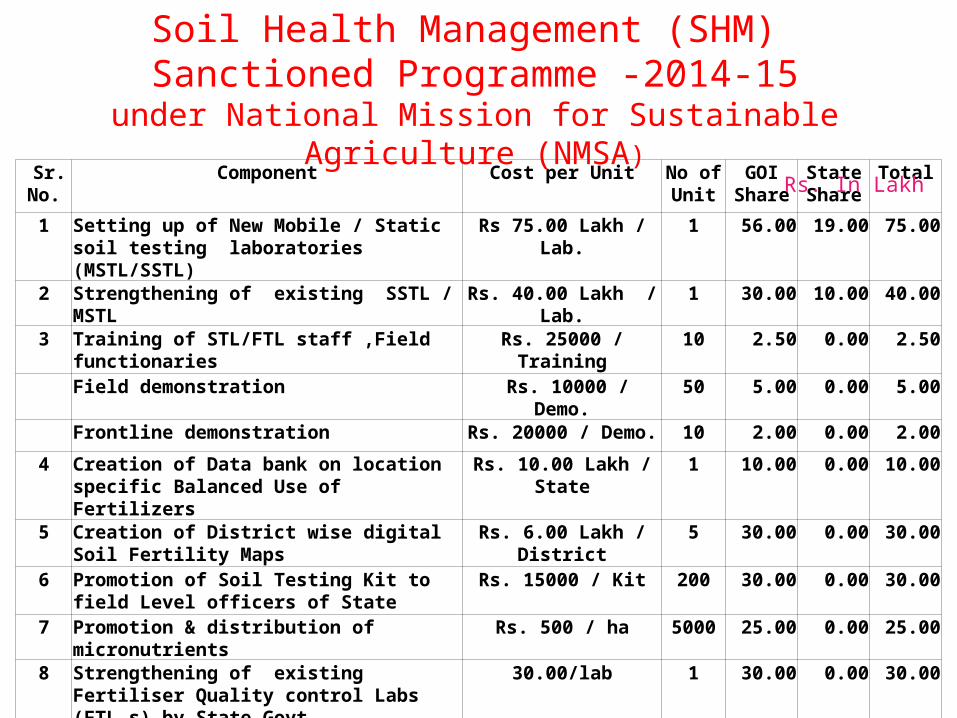
Sr. No.
Component Cost per Unit No of Unit
GOI Share
State Share
Total
1 Setting up of New Mobile / Static soil testing laboratories (MSTL/SSTL)
Rs 75.00 Lakh / Lab. 1 56.00 19.00 75.00
2 Strengthening of existing SSTL / MSTL Rs. 40.00 Lakh / Lab. 1 30.00 10.00 40.00
3 Training of STL/FTL staff ,Field functionaries
Rs. 25000 / Training 10 2.50 0.00 2.50
Field demonstration Rs. 10000 / Demo. 50 5.00 0.00 5.00
Frontline demonstration Rs. 20000 / Demo. 10 2.00 0.00 2.00
4 Creation of Data bank on location specific Balanced Use of Fertilizers
Rs. 10.00 Lakh / State 1 10.00 0.00 10.00
5 Creation of District wise digital Soil Fertility Maps
Rs. 6.00 Lakh / District
5 30.00 0.00 30.00
6 Promotion of Soil Testing Kit to field Level officers of State
Rs. 15000 / Kit 200 30.00 0.00 30.00
7 Promotion & distribution of micronutrients Rs. 500 / ha 5000 25.00 0.00 25.00
8 Strengthening of existing Fertiliser Quality control Labs (FTL s) by State Govt.
30.00/lab 1 30.00 0.00 30.00
9 Setting up New FQCL by State Govt. 75.00/lab 1 75.00 0.00 75.00
Total 295.50 29.00 324.50
Soil Health Management (SHM) Sanctioned Programme -2014-15
under National Mission for Sustainable Agriculture (NMSA)Rs. In Lakh

Proposed Plan for Strengthening of STLs
Create facility to Analyze Boron (B) and Sulphur(S)
Increase in Analysing Capacity : o Establishment of Govt. STLs in 4 Districts
(Nandurbar, Hingoli, Washim & Gondiao HRD Program for Staff engaged in STL.o Modernization of STLs.o Increasing Involvement of Pvt. Sectors.
NABL Accrediation to Govt. STLs. : o Staff Training Program is Completed

State initiatives for Soil Health improvement
Soil Health Improvement Program: Distribution of Zinc, Ferrous Sulphate on 50% subsidy in deficient blocks
(Zn deficit blocks 175 and Fe deficit blocks 106)
State Organic Farming Policy : Organic Farming Area Increase by 10000 ha / year.
District wise Fertilizer Demand and Use Strictly on basis of Fertility Status.
Farmer Awareness Program for INM

Policy issues for consideration Assistance to chemical fertilizers only on the
basis of soil testing recommendations Promotion of organic manures like FYM compost,
green manuring, recycling and reuse of crop residue/biomass
Promotion of bio-fertilizers on massive scale Encouragement for inter cropping of pulses in all
major cereal crops Encourage use of soil amendments like lime,
gypsum, rock phosphate etc. Promotion of organic farming Establishment of soil testing laboratories at each
block along with major, micro nutrients and water testing facilities

Thank YouThank You


Nutrient Deficiency Symptoms'