Embed Size (px)
Citation preview

1
Depec-Bradesco Economic Highlights
Mac
roec
onom
ic R
esea
rch
Dep
artm
ent
Mac
roec
onom
ic R
esea
rch
Dep
artm
ent
Year XIII Number 140 - April, 1 2016
Fabiana D’Atri
Recent Chinese acquisitions, on a global scale, should increase the country’s presence in important production chains
The strong and rapid deceleration of the Chinese economy, the significant capital outflow from the country and the need for a productive capacity adjustment in several sectors draws attention and raises concerns to global markets. At the same time, the acquisitions made by Chinese companies on a global scale and with significant volumes also stand out. Accentuating the trend of the last decade, Chinese corporations – public and private – have announced the acquisition of many different businesses, including large multinational companies, in search of new markets, technology acquisition, expansion of economic and social influence, and the acquisition of resources.
In 2015 alone, according to a Rhodium Group survey1, acquisitions made by Chinese companies exceeded US$60 billion, the highest level in history. This year, according to Dealogic, 144 purchasing intentions and acquisitions have been announced, totaling US$88 billion2. Therefore, the internationalization of Chinese groups – through acquisitions, loans, investments in startups or branch openings – has diversified characteristics that consolidate the country as a new player in important chains, such as infrastructure, financial, agribusiness and food, technology and entertainment. And, more than investing or acquiring
companies with local representatives, the most recent announcements mean that China has been gaining global scale in business, with participation in large multinational companies. Brazil, of course, is part of this new phase of Chinese investments – whether because it is included in large multinational operations, or due to the country’s characteristics, given the current scenario, the opportunities for investment, especially in infrastructure, and the attractiveness of the supply of natural resources, now more concentrated on the food sector.
Chinese groups began to invest abroad at the end of the 70’s, stimulated by the open door policy. However, the main boost came in 1992, with Deng Xiaoping and the Go Global strategy started in 1999. The current volume, however, is very different from what could be observed in those years. The country represented 0.2% of the volume invested abroad in 1999, in 2009 this number was increased to 5% and now reaches 8%, according to a survey by Unctad, with the last update made in 2014. That means China is currently ranked third in the global ranking of largest investors, behind only the United States and Hong Kong, followed by Japan and Germany. In fact, if we add up the investment volumes made by Mainland China and Hong Kong, we would reach a share of 18% of the global total in 2014.
Source: Unctad Production: BRADESCO
Flow of investments made by China and Hong Kong in the world, in US$ million
26.531
54.07943.637
64.166
96.341
80.773
142.700
4.400 6.88521.160
74.654
116.000
0
20000
40000
60000
80000
100000
120000
140000
160000
1985
1986
1987
1988
1989
1990
1991
1992
1993
1994
1995
1996
1997
1998
1999
2000
2001
2002
2003
2004
2005
2006
2007
2008
2009
2010
2011
2012
2013
2014
Fluxo de Investimentos feitos pela China e por Hong Kong no mundo, US$ milhões. Fonte: Unctad
China
Hong Kong
1 http://rhg.com/notes/chinas-global-outbound-ma-in-2015, consulted on March 28, 20162 It is worth noting that, last year, this consultancy registered 607 operations, totaling US$112.5 billion. http://www.businessinsider.co.id/china-is-buying-a-lot-of-foreign-companies-2016-2/, consulted on 29 March 2016. This difference may be due to the distinction between announcements and completed operations.
2DEPEC
Dep
ec-B
rade
so E
cono
mic
Hig
hlig
hts
Source: Balance of PaymentsProduction: BRADESCO
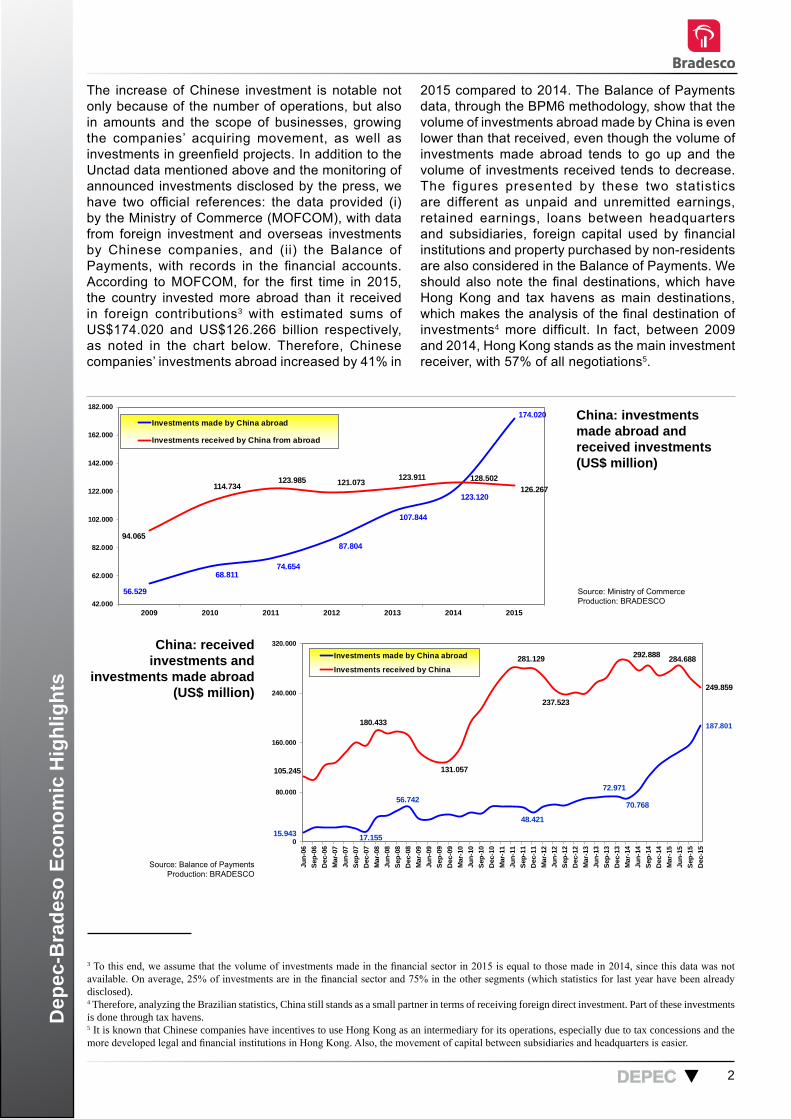
The increase of Chinese investment is notable not only because of the number of operations, but also in amounts and the scope of businesses, growing the companies’ acquiring movement, as well as investments in greenfield projects. In addition to the Unctad data mentioned above and the monitoring of announced investments disclosed by the press, we have two official references: the data provided (i) by the Ministry of Commerce (MOFCOM), with data from foreign investment and overseas investments by Chinese companies, and (ii) the Balance of Payments, with records in the financial accounts. According to MOFCOM, for the first time in 2015, the country invested more abroad than it received in foreign contributions3 with estimated sums of US$174.020 and US$126.266 billion respectively, as noted in the chart below. Therefore, Chinese companies’ investments abroad increased by 41% in
2015 compared to 2014. The Balance of Payments data, through the BPM6 methodology, show that the volume of investments abroad made by China is even lower than that received, even though the volume of investments made abroad tends to go up and the volume of investments received tends to decrease. The figures presented by these two statistics are different as unpaid and unremitted earnings, retained earnings, loans between headquarters and subsidiaries, foreign capital used by financial institutions and property purchased by non-residents are also considered in the Balance of Payments. We should also note the final destinations, which have Hong Kong and tax havens as main destinations, which makes the analysis of the final destination of investments4 more difficult. In fact, between 2009 and 2014, Hong Kong stands as the main investment receiver, with 57% of all negotiations5.
China: received investments and
investments made abroad (US$ million)
China: investments made abroad and received investments (US$ million)
Source: Ministry of CommerceProduction: BRADESCO
56.529
68.81174.654
87.804
107.844
123.120
174.020
94.065
114.734123.985 121.073 123.911 128.502
126.267
42.000
62.000
82.000
102.000
122.000
142.000
162.000
182.000
2009 2010 2011 2012 2013 2014 2015
China: investimentos feitos no exterior e recebidos. Fonte: Ministério do Comércio da China
Investments made by China abroad
Investments received by China from abroad
15.943 17.155
56.742
48.421
72.971
70.768
187.801
105.245
180.433
131.057
281.129
237.523
292.888 284.688
249.859
0
80.000
160.000
240.000
320.000
Jun-
06Se
p-06
Dec
-06
Mar
-07
Jun-
07Se
p-07
Dec
-07
Mar
-08
Jun-
08Se
p-08
Dec
-08
Mar
-09
Jun-
09Se
p-09
Dec
-09
Mar
-10
Jun-
10Se
p-10
Dec
-10
Mar
-11
Jun-
11Se
p-11
Dec
-11
Mar
-12
Jun-
12Se
p-12
Dec
-12
Mar
-13
Jun-
13Se
p-13
Dec
-13
Mar
-14
Jun-
14Se
p-14
Dec
-14
Mar
-15
Jun-
15Se
p-15
Dec
-15
China: investimentos recebidos e feitos no exterior. Fonte: Balanço de Pagamentos
Investments made by China abroad
Investments received by China
3 To this end, we assume that the volume of investments made in the financial sector in 2015 is equal to those made in 2014, since this data was not available. On average, 25% of investments are in the financial sector and 75% in the other segments (which statistics for last year have been already disclosed).4 Therefore, analyzing the Brazilian statistics, China still stands as a small partner in terms of receiving foreign direct investment. Part of these investments is done through tax havens.5 It is known that Chinese companies have incentives to use Hong Kong as an intermediary for its operations, especially due to tax concessions and the more developed legal and financial institutions in Hong Kong. Also, the movement of capital between subsidiaries and headquarters is easier.

3DEPEC
Dep
ec-B
rade
so E
cono
mic
Hig
hlig
hts
China's largest investment receptors in 2014 (US$ million)
Source: CEIC, MOFCOMProduction: BRADESCO
70.867
7.5964.578 4.570 4.192 4.049 2.814 1.499 1.439 1.272 1.030 1.027 1.014 904 839 730 708 705 666 634
0
9.000
18.000
27.000
36.000
45.000
54.000
63.000
72.000
Hon
g Ko
ng
USA
Luxe
mbo
urg
Virg
in Is
land
s
Cay
man
Isla
nds
Aus
tralia
Sing
apor
e
Uni
ted
Kin
gdom
Ger
man
y
Indo
nesi
a
Net
herla
nds
Laos
Paki
stan
Can
ada
Thai
land
Bra
zil
Ber
mud
a
Uni
ted
Arab
Emira
tes
Alg
eria
Rus
sia
Maiores receptores de investimentos da China (US$ milhões), 2014. Fonte: CEIC
In a simplified way, we can characterize the previous stage of Chinese investments around the world by the search for natural resources, led by state-owned companies. The investments were not only directed at developed countries, but also countries with a weak institutional environment (especially in Africa)6. More recently, however, the internationalization of Chinese companies has been more diversified, in terms of destinations and sectors and amounts. Therefore, adding up these statistics, analyzing the investments announced in the global press and by specialized consultants, we have noted very interesting features of this new phase of purchases and acquisitions, as listed below:
• The volume of acquisitions related to energy and other natural resources has been dropping, while interest in technology assets, brands, the financial and real estate sectors is increasing. Acquisitions in the energy and mining sector fell from a little over 80% in 2011 to around 15% in 20157;
• With the reduction of operations related to natural resources, negotiations tend to have a lower value. In 2014, for example, small and medium-sized transactions, of up to US$1 billion, accounted for 40% of the investments;
• The anti-corruption campaign may have reduced the state-owned companies’ investment availability, opening the way for private companies;
• The smaller interest in assets in the mining sector migrated to agribusiness. Examples are: the acquisition of Smithfields by Shuanghui; the acquisition made by Bright Food of 60% of the British company Weetbix (specialized in cereals) and of
Manassen Foods, from Australia; the acquisition of several dairy farms in New Zealand by Pengxin. The interest of Chinese companies in sugarcane farms in Australia has also grown, with investments from Cofco and the Xangai group8;
• Developed countries still account for the majority of Chinese acquisitions, with a highly attractive Europe, the United States gaining share and Australia being consolidated as one of the main destinations of Chinese investments. These three destinations accounted for 2/3 of Chinese acquisitions last year9. Japan and Canada, on the other hand, have lost share;
• Financial investors through private equity firms, financial conglomerates and insurance companies have increased their participation in operations, as China begins to relax the restrictions for these types of companies to invest abroad. This way, the involvement of development banks and sovereign wealth funds also increases;
• The strategy of investing in countries that previously belonged to the Silk Road (strategy known as One Road, One Belt, launched in 2014), still seems to be moving forward, timidly, with few negotiations in the past year in Israel, Kazakhstan and Turkey. Eventually, the strategy may change to investing through greenfield projects and loans and not acquiring existing companies in these countries;
• Recent acquisitions such as the household appliances unit of GE by Haier and of Syngenta by ChemChina (which is the largest acquisition made by a Chinese company) reveal the search for consolidated markets, global brand recognition and access to research and technology;
6 KOLSTAD, Ivar e WIIG, Arne. What determines Chinese Outward Investment?. CHR Michelsen Institute. 20097 According to data from the Rhodium Group.8 According to a survey of the Beijing office of the National Agriculture and Livestock Confederation (CNA).9 According to data from the Rhodium Group.
4DEPEC
Dep
ec-B
rade
so E
cono
mic
Hig
hlig
hts
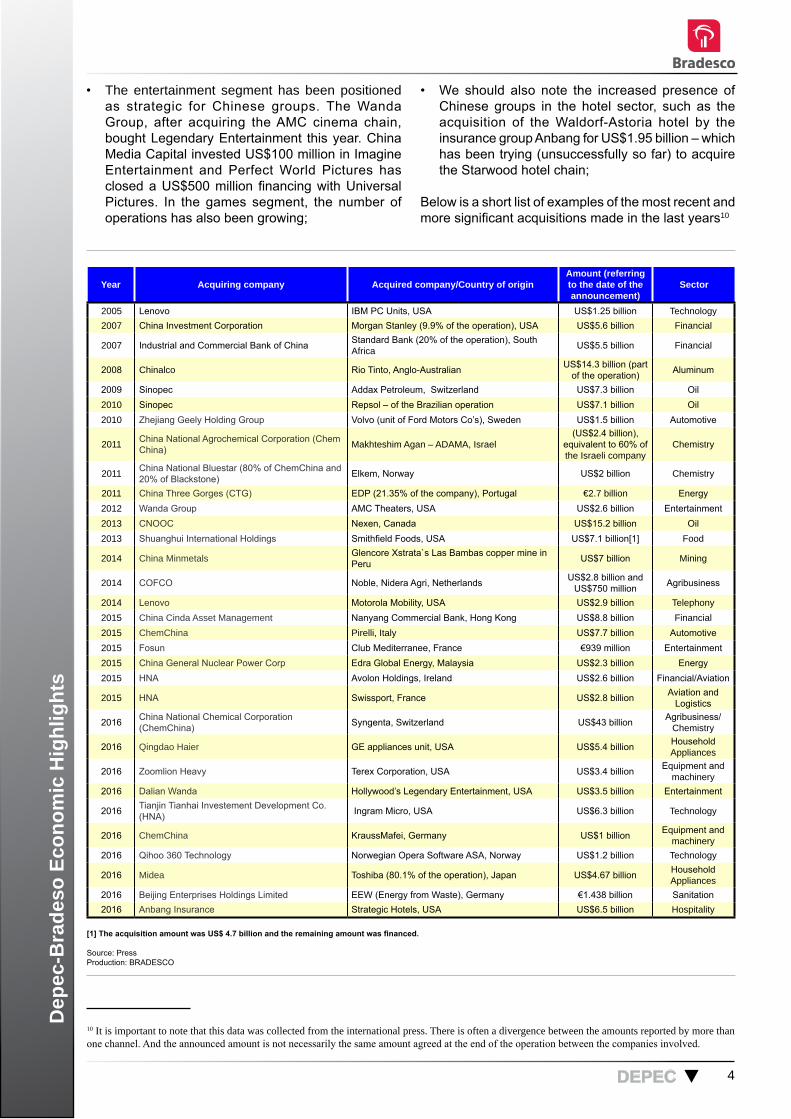
• The entertainment segment has been positioned as strategic for Chinese groups. The Wanda Group, after acquiring the AMC cinema chain, bought Legendary Entertainment this year. China Media Capital invested US$100 million in Imagine Entertainment and Perfect World Pictures has closed a US$500 million financing with Universal Pictures. In the games segment, the number of operations has also been growing;
• We should also note the increased presence of Chinese groups in the hotel sector, such as the acquisition of the Waldorf-Astoria hotel by the insurance group Anbang for US$1.95 billion – which has been trying (unsuccessfully so far) to acquire the Starwood hotel chain;
Below is a short list of examples of the most recent and more significant acquisitions made in the last years10
[1] The acquisition amount was US$ 4.7 billion and the remaining amount was financed.
Year Acquiring company Acquired company/Country of originAmount (referring to the date of the announcement)
Sector
2005 Lenovo IBM PC Units, USA US$1.25 billion Technology2007 China Investment Corporation Morgan Stanley (9.9% of the operation), USA US$5.6 billion Financial
2007 Industrial and Commercial Bank of China Standard Bank (20% of the operation), South Africa US$5.5 billion Financial
2008 Chinalco Rio Tinto, Anglo-Australian US$14.3 billion (part of the operation) Aluminum
2009 Sinopec Addax Petroleum, Switzerland US$7.3 billion Oil2010 Sinopec Repsol – of the Brazilian operation US$7.1 billion Oil2010 Zhejiang Geely Holding Group Volvo (unit of Ford Motors Co’s), Sweden US$1.5 billion Automotive
2011 China National Agrochemical Corporation (Chem China) Makhteshim Agan – ADAMA, Israel
(US$2.4 billion), equivalent to 60% of the Israeli company
Chemistry
2011 China National Bluestar (80% of ChemChina and 20% of Blackstone) Elkem, Norway US$2 billion Chemistry
2011 China Three Gorges (CTG) EDP (21.35% of the company), Portugal €2.7 billion Energy2012 Wanda Group AMC Theaters, USA US$2.6 billion Entertainment2013 CNOOC Nexen, Canada US$15.2 billion Oil2013 Shuanghui International Holdings Smithfield Foods, USA US$7.1 billion[1] Food
2014 China Minmetals Glencore Xstrata`s Las Bambas copper mine in Peru US$7 billion Mining
2014 COFCO Noble, Nidera Agri, Netherlands US$2.8 billion and US$750 million Agribusiness
2014 Lenovo Motorola Mobility, USA US$2.9 billion Telephony2015 China Cinda Asset Management Nanyang Commercial Bank, Hong Kong US$8.8 billion Financial2015 ChemChina Pirelli, Italy US$7.7 billion Automotive2015 Fosun Club Mediterranee, France €939 million Entertainment2015 China General Nuclear Power Corp Edra Global Energy, Malaysia US$2.3 billion Energy2015 HNA Avolon Holdings, Ireland US$2.6 billion Financial/Aviation
2015 HNA Swissport, France US$2.8 billion Aviation and Logistics
2016 China National Chemical Corporation (ChemChina) Syngenta, Switzerland US$43 billion Agribusiness/
Chemistry
2016 Qingdao Haier GE appliances unit, USA US$5.4 billion Household Appliances
2016 Zoomlion Heavy Terex Corporation, USA US$3.4 billion Equipment and machinery
2016 Dalian Wanda Hollywood’s Legendary Entertainment, USA US$3.5 billion Entertainment
2016 Tianjin Tianhai Investement Development Co. (HNA) Ingram Micro, USA US$6.3 billion Technology
2016 ChemChina KraussMafei, Germany US$1 billion Equipment and machinery
2016 Qihoo 360 Technology Norwegian Opera Software ASA, Norway US$1.2 billion Technology
2016 Midea Toshiba (80.1% of the operation), Japan US$4.67 billion Household Appliances
2016 Beijing Enterprises Holdings Limited EEW (Energy from Waste), Germany €1.438 billion Sanitation2016 Anbang Insurance Strategic Hotels, USA US$6.5 billion Hospitality
Source: Press Production: BRADESCO
10 It is important to note that this data was collected from the international press. There is often a divergence between the amounts reported by more than one channel. And the announced amount is not necessarily the same amount agreed at the end of the operation between the companies involved.
5DEPEC
Dep
ec-B
rade
so E
cono
mic
Hig
hlig
hts
It is critical to contextualize this new more aggressive internationalization phase of Chinese companies. Therefore, we believe that the economic slowdown, leading to the low growth of industry and of the real estate sector, in addition to the existing idle capacity, to the reduction of investment opportunities in the real estate sector and the increasing number of protectionist measures against the country are the great motivators of the most recent acquisitions. The expectation of further depreciation of the renminbi – after dropping approximate 5% in the last twelve months – may also have accelerated this latest trend. Food supply guarantee and food safety concerns have also led other relevant part of the acquisitions. Furthermore, China has sought to acquire technology, conquer markets in segments where it has no participation and global influence, such as entertainment (which is also growing within China). As a government strategy, there is also the One Road, One Belt policy, which should gain strength in the coming years. Development banks and commercial banks are funding this movement – in addition to the Asian Infrastructure Development Bank establishment – in order to support the internationalization of Chinese companies.
This Chinese companies trend, in turn, tends to bring the country significant productivity gains, whether through knowledge of new practices (labor, legal, etc.), or through improvements in the quality of products and transfer of technology11. This movement is seen
as increasingly strategic in a period of changes in its growth model, in which efficiency and productivity gains will be one of the factors to sustain China’s strong pace of expansion.
Finally, the same way as is observed in the rest of the world, China’s interest in Brazil has focused on investments, surpassing only trade relations. The presence of Chinese companies in the country is growing and was initially and mainly done through the opening of branches, with the presence of important companies in different segments and the acquisition of businesses linked to the commodities and the energy sectors. More recently, industrial and financial segments have gained relevance, with companies in the automotive, home appliances and heavy machinery sectors, as well as the leading Chinese banks and telephony and energy groups. The Asian presence also progresses through these global acquisitions, as major multinationals that operate here, such as COFCO, which is fast gaining participation in the export of grain in the country. There are still high expectations of greater involvement of Chinese groups in the infrastructure sector. Two very recent examples are emblematic: China Three Gorges successfully bid on hydroelectric concessions for R$13.8 billion and HNA bought 23.7% of Azul Linhas Aéreas for R$1.7 billion. In our monitoring of investment announcements, we managed to select different experiences of the arrival of Chinese companies in Brazil, as shown on this final table12.
11 Chen, Wenjie e Tang, Heiwai. The Dragon is Flying West: Micro-Level Evidence of Chinese Outward Direct Investment. Asian Development Review, vol 31, no2. 201412 It is important to note that these are announcements made by the press. The projects and amounts are not necessarily confirmed after their disclosure. An interesting study explores the difference between the announcements and the negotiations that, in fact, were closed. Following is a reading reference: https://www.ciaonet.org/attachments/16891/uploads, consulted on March 29, 2016

6DEPEC
Dep
ec-B
rade
so E
cono
mic
Hig
hlig
hts
Company Economic Sector
Amount (in millions)
Montante (R$-em
milhões)Period Investments Type Country
of origin
Beigi Foton Motor Co. Automotive Complex R$300.0 R$300.0 NA Expansion of the Guaíba mill project (RS) to start
producing vans and SUVs. Greenfield China
Fundo Chinês para Investimento na
América Latina (Clai-Fund) / China Railway
Engineering Group
Civil Construction R$2.600.0 R$2.600.0 nd
Construction and operation of the Porto Sul and four stretches of the Ferrovia Integração Oeste Leste, between the cities of Ilhéus and Caetité in the state of Bahia.
Greenfield China
China Railway Construction
Corporation Limited (CRCC)
Civil Construction NA NA NAIt will make investments in Pará state acting in the areas of industrial production, logistics and real estate development.
Greenfield China
Jinheng-Jinhua Holdings Food Industry R$10.0 R$10.0 2016
Equipment acquisition and restructuring of pavilions of the development PET HM, located in Taquari (RS).
Moderni-zation China
Shandong Sanjing Lighting
Electro electronics R$100.0 R$100.0 NA Construction of a led lamps factory in Itapetininga
(SP). Greenfield China
Zhengchang Machines and Equipment R$100.0 R$100.0 NA Installation of a agricultural equipment factory in
Curitiba (PR). Greenfield China
Chery Automotive Complex R$400.0 R$400.0 2015-2017 Construction of a new production line in its
Jacareí (SP) plant. Expansion China
Chery no Brasil Automotive Complex US$300.0 R$1.157.9 NA Installation of a suppliers center in Jacareí (SP). Greenfield China
BYD (Build Your Dream)
Machines and Equipment R$150.0 R$150.0 2015-2016 Construction of a photovoltaic cells factory in
Campinas (SP). Greenfield China
LiuGong Machinery Machines and Equipment R$120.0 R$120.0 2015-2017 Construction of a civil construction equipment
factory in Mogi Guaçu (SP). Greenfield China
Yunlihong Automotive Complex R$230.0 R$230.0 NA Construction of a truck factory in Camaquã (RS). Greenfield China
Sany Construction material US$300.0 R$673.7 2014-2016 Construction of a civil construction equipment
factory in Jacareí (SP). Greenfield China
Huawei Technology R$200.0 R$200.0 2014
Construction of three research and development centers, with focus on areas such as cloud computing, big data, cyber security and mobile applications.
Greenfield China
Huawei Technology R$10.0 R$10.0 2014 Construction of a R&D laboratory in Salvador (BA). Greenfield China
Lenovo Technology US$100.0 R$238.5 NA Investment in a new center for R&D in software in Campinas (SP). Greenfield China
State Grid Electricity US$10.000.0 R$23.847.0 2013- 2015 Investments in the Brazilian electricity sector. Greenfield China
Chongqing Grain Agribusiness US$1.000.0 R$2.384.7 NA Investment in the agribusiness sector, with focus on the textile and fertilizer areas in Bahia. Greenfield China
Sinotruck Automotive Complex R$300.0 R$300.0 2013 -
2015 Construction of a truck factory in Lages (SC). Greenfield China
Foton Motor Automotive Complex R$250.0 R$250.0 2013 -
2015 Construction of a factory in Guaíba (RS). Greenfield China
Foton Lovol Bramax (FLB)
Machines and Equipment R$150.0 R$150.0 2013 -
2015 Installation of a factory in Anápolis (GO). Greenfield China
Citic HIC Machines and Equipment NA NA NA Construction of a factory in Adrianópolis (PR). Greenfield China
Yishion Retail R$10.0 R$ 10.0 2013 Opening of a store in São Paulo (SP). Greenfield China
Shineray Retail NA NA NA Inauguration of 50 new concessionaires. Expansion ChinaKerry Logistics /
Ascensus Trading & Logística
Transportation and Logistics R$50.0 R$50.0 2013 Construction of a logistical development in
Garuva (SC). Greenfield Brazil / China
XCMG Machines and Equipment NA NA NA Opening of a new factory in Venâncio Aires (RS). Greenfield China
Announcement of Chinese investments in Brazil
Source: Press Production: BRADESCO

7DEPEC
Dep
ec-B
rade
so E
cono
mic
Hig
hlig
hts
Octavio de Barros - Macroeconomic Research DirectorMarcelo Cirne de Toledo Global economics: Fabiana D’Atri / Felipe Wajskop França / Thomas Henrique Schreurs Pires / Ellen Regina Steter Brazil: Igor Velecico / Estevão Augusto Oller Scripilliti/ Andréa Bastos Damico / Myriã Tatiany Neves Bast / Daniela Cunha de Lima / Ariana Stephanie ZerbinattiBrazilian sectors: Regina Helena Couto Silva / Priscila Pacheco TrigoProprietary survey: Leandro Câmara Negrão / Ana Maria Bonomi BarufiInternships: Gabriel Marcondes dos Santos / Wesley Paixão Bachiega / Carlos Henrique Gomes de Brito
Team
DEPEC - BRADESCO does not accept responsibility for any actions/decisions that may be taken based on the information provided in its publications and projections. All the data and opinions contained in these information bulletins is carefully checked and drawn up by fully qualified professionals, but it should not be used, under any hypothesis, as the basis, support, guidance or norm for any document, valuations, judgments or decision taking, whether of a formal or informal nature. Therefore, we emphasize that all the consequences and responsibility for using any data or analysis contained in this publication is assumed exclusively by the user, exempting BRADESCO from all responsibility for any actions resulting from the usage of this material. We all point out that access to this information implies acceptance in full of this term of responsibility and usage. The reproduction of the content in this report (partially or in full) is strictly forbidden except if authorized by BRADESCO or if the sources (the name of the authors, publication and BRADESCO) are strictly mentioned.