Embed Size (px)
Citation preview
Dependent Invention and Dependent Inventors: Evidence from
Historical Swedish Inventors and Patent Data*
David E. Andersson‡ Fredrik Tell†
PRELIMINARY DRAFT
July, 2018
Prepared for the IP Day 2018, Patents: A historical perspective, TPRI, Boston University
School of Law
Abstract
This paper examines to what extent invention and inventors were independent in Sweden during
the 18th century and the second industrial revolution at the turn of 20th century. Understanding
in which organizational setting new inventions emerge is a first-order question with implications
both for research in economic history and for policy makers working with research policy. Our
study makes use of occupational data on the patentees on all Swedish patents along with a
prosopographical methodology studying the inventive careers of the 100 most productive patentees
in Sweden 1819-1914. We make use of biographical dictionaries together with a new dataset on the
universe of Swedish patents to pinpoint the actual workplaces of the individuals at the time of their
patent applications to get a more accurate picture of the actual setting of the inventive activity. Our
results show that, in contrast to previous research, by using a sample of “great patentees” and the
place of work as an indicator of the organizational setting of invention as few as 10% of all
inventions patented by individuals can be considered to be truly independent, while equally many
originate inside academic or state institutions. The remaining 80% of the patents are made up of
firm-employees, entrepreneurs and spin-offs.
* We thank Mats Larsson, Patricio Sáiz, Ove Granstrand, Alessandro Nuvolari, Michelangelo Vasta, Jochen Streb, Christian Sandström, Vandari Mendoza and Maureen McKelvey for helpful comments on earlier drafts of this paper. The paper has also benefitted from comments from participants at the European Social Science History Conference (Valencia, 2016) and the European Business History Association Conference (Vienna, 2017). The research was supported by research grant P2010-0183:1 from Handelsbankens forskningsstiftelser. ‡ Department of Business Studies, Uppsala University and The Institute for Analytical Sociology, Linköping University, [email protected] † Department of Business Studies, Uppsala University, [email protected]
Introduction
The organizational setting in which new inventions emanate is a contested issue for academics in
economic history and economics of innovation and entrepreneurship, as well as in practical
implementation of science and research policy. The issue is most commonly framed as one
involving a dichotomous distinction between on the one hand independent inventors and on the
other hand corporations and R&D labs. One inroad to the distinction is the development in Joseph
Schumpeter analysis of entrepreneurship and innovation. Analogical to the entrepreneur as
outlined in The Theory of Economic Development, the tinkering and experimenting inventor has been
labelled a hero that through sparks of genius and recombination of ideas fuel the process of creative
destruction in a capitalistic economy.1 On the other hand, in Capitalism, Socialism and Democracy, the
‘entrepreneurial spirit’ was transferred to corporations and other large organizations that allow for
routinized invention on a much grander scale through the collaborative work of a cadre of
employed scientists and engineers managed in an organizational hierarchy.2 The function of
entrepreneurship accordingly moving from being independent to dependent on its formal
organizational setting.3 In the same vein, research in entrepreneurship and research policy has
continued to analyze the characteristics and impact of independent inventors, as distinct form of
invention different from invention organized by large organizations such as private and public
R&D Labs, corporations, universities and research institutes.4
Such unidimensional and schematic characterizations of independent invention are echoed in
historical analysis. Thomas Hughes dubbed the period from the mid-19th century to the beginning
of World War I “the era of independent inventors”.5 Implicitly this statement followed studies
suggesting an unfolding of events where independent invention was replaced by corporate
invention and industrialization of invention by the large industrial firms with their internalized
R&D labs accompanied by managerial hierarchies.6 This literature points to that such
1 Schumpeter, Theory of Economic Development 2 Schumpeter, Capitalism, Socialism and Democracy; Dosi and Orsenigo, 1988 3 In subsequent literature in evolutionary economics, Schumpeter’s former conception of entrepreneurship has been labelled Mark I, and the latter view, correspondingly, Mark II. See e.g. Cohen and Levin, 1990; Malerba and Orsenigo, 1997; Hagedoorn, 1996 4 See e.g. Åstebro (1998); (2003); Dahlin, Taylor and Fichman, (2004); Lettl, Rost, and Wartburg (2009), Why are some independent inventors ‘heroes’ and others ‘hobbyists’? The moderating role of technological diversity and specialization, Research Policy, Volume 38, Issue 2, p. 243-254 5 Hughes (1988, p. 151), 6 On R&D labs, see e.g. Bernal 1953; Hounshell, David A. and John Kenly Smith Jr. (1988), Science and Corporate Strategy: Du Pont R&D, 1902-1980; Reich, Leonard S. (1985), The Making of American Industrial Research: Science and Business at GE and Bell, 1876-1926, Cambridge, UK: Cambridge University Press Reich, Leonard S. (1987), Edison, Coolidge, and Langmuir: Evolving Approaches to American Industrial Research, The Journal of Economic History, Vol. 47, No. 2, pp. 341-352; Wise, George (1985), Willis R. Whitney, General Electric, and the Origins of U.S. Industrial Research, New York, NY: Columbia University Press. On managerial hierarchies, see
developments took place during the second industrial revolution during the late 19th and early 20th
centuries.
In the research literature in innovation and economic history it is possible to discern two strands,
one arguing that independent inventors were the main source of new invention during the late 19th
century and that this group has subsequently been both quantitatively and qualitatively
underestimated as a source of new inventions during the first half of the 20th century, when the
focus has been the emergence of the large industrial enterprise.7 This strand in the literature
emphasizes that the use of markets as coordination devices, such as markets for technology, made
it possible for independent inventors to profit from their inventions by selling and licensing them
to firms.8 Even though they reach somewhat different conclusions about independent inventors
they have in common that start from the supposition that independent inventors were responsible
for the bulk of new inventions at the turn of the 20th century.
On the other side there are several researchers that stress the importance of organized invention.
The argument for organized invention is due to resource dependencies, complementarities, and
social interaction.9 This is something that the firm, the factory floor or the R&D lab can provide
perhaps more efficiently. If this is the case, then the result would instead be that patents/inventions
made in an organized context should be of higher quality than those by lone or more independent
inventors.
One common denominator of previous research is however, that to a large extent, it does not take
into account potential heterogeneity of patentees and classify all individual assignees as
independent inventors – our claim is that even in the “age of independent inventors”, inventive
Chandler, Alfred D. Jr. (1977), The Visible Hand: The Managerial Revolution in American Business, Cambridge, MA: The Belknap Press of Harvard University Press; Chandler, Alfred D. Jr. (1990), Scale and Scope: The Dynamics of Industrial Capitalism, Cambridge, MA: The Belknap Press of Harvard University; Lazonick, William (1991), Business Organization and the Myth of the Market Economy, Cambridge, MA: Cambridge University Press 7 John Jewkes, The Sources of Invention (Springer, 1969); Thomas P. Hughes, “The Era of Independent Inventors,” in Science in Reflection (Springer, 1988), 151–168; Thomas P. Hughes, American Genesis: A Century of Invention and Technological Enthusiasm, 1870-1970 (University of Chicago Press, 2004); Tom Nicholas, “The Role of Independent Invention in U.S. Technological Development, 1880–1930,” The Journal of Economic History 70, no. 1 (2010): 57–82; Tom Nicholas, “Independent Invention during the Rise of the Corporate Economy in Britain and Japan,” The Economic History Review 64, no. 3 (2011): 995–1023; Alessandro Nuvolari and Michelangelo Vasta, “Independent Invention in Italy during the Liberal Age, 1861–1913,” The Economic History Review 68, no. 3 (2015): 858–886; 8 Naomi R. Lamoreaux and Kenneth L. Sokoloff, “Market Trade in Patents and the Rise of a Class of Specialized Inventors in the 19th-Century United States,” American Economic Review 91, no. 2 (May 2001): 39–44, https://doi.org/10.1257/aer.91.2.39; Tom Nicholas, “Spatial Diversity in Invention: Evidence from the Early R&D Labs,” Journal of Economic Geography 9, no. 1 (January 1, 2009): 1–31, https://doi.org/10.1093/jeg/lbn042. 9 See for example: Thomas \AAstebro, “Basic Statistics on the Success Rate and Profits for Independent Inventors,” Entrepreneurship Theory and Practice 23, no. 2 (1998): 41–48; Jasjit Singh and Lee Fleming, “Lone Inventors as Sources of Breakthroughs: Myth or Reality?,” Management Science 56, no. 1 (October 16, 2009): 41–56, https://doi.org/10.1287/mnsc.1090.1072; Basberg, “Amateur or Professional?”
activity to a large extent took place in organizations. Basberg hints at this in his work on Norwegian
patents, claiming that individual patentees were strongly associated with industry.10 This is also
pointed out by Nuvolari and Vasta in their work on Italian independent inventors.
“[I]t is also possible that patents formally granted to individuals actually cover the formalized
inventive activities taking place inside companies. This is probably a more serious source of error
for the period considered here.”11
How (in-)dependent was invention in Sweden during this period? It is in relation to thes debates
above that we analyze inventors as assigned in Swedish patents 1885 to 1914. In particular, we seek
to disentangle the relationship between inventors and organizational contexts. By doing this we
attempt to provide answers to two research question related to this problem. One is a theoretical
one; in which organizational settings do inventions emerge? The second one is methodological in
nature; To what extent does a patent granted to an individual represent an invention made by an
independent inventor? The question is a first-order question with implications both for research in
economic history and for policy makers working with research policy, the second one should
particularly relevant to anyone working with historical patent data as a proxy for invention and
innovation.
To investigate this, we use Sweden as an example and combine two new datasets on historical
patents and inventors. The patent data cover the universe of Swedish patents (1819-1914) where
we have coded more than 1,500 occupational titles for about 20,000 individuals into the Historical
International Standard Classification of Occupations (HISCO). In addition to the patent data we
have also employ a prosopographical approach studying the inventive careers of the 100 most
productive patentees, “great patentees”, in Sweden 1819-1914. We do this by using several
biographical dictionaries over the most famous Swedes together with biographical registers of
Swedish engineers. This allows us to pinpoint the actual workplaces of these inventors and
construct timelines of their professional careers.
Our results are twofold. First, we show that even though patents granted to individual on average
are of lower quality (measured as patent life in years) than firm patents, patents granted to
individuals who we identify as employed by firms or proprietors of firms are of higher quality.
Secondly, in contrast to previous research, by using place of work as an indicator of the
organizational setting of invention as few as 10% of all inventions patented by individuals can be
considered to be truly independent, while as much as 10% originate inside universities or state-
10 Basberg, “Amateur or Professional?” p. 38. 11 Nuvolari and Vasta, “Independent Invention in Italy during the Liberal Age, 1861–1913.”, p. 12.
owned enterprises. The remaining patents are made up of firm-employees, entrepreneurs and spin-
offs.
The paper is outlined as follows. Section I provides a background of the patent system in Sweden
during the time. Section II presents our data. Section III describes the data. Section IV investigates
empirically the relationship between patent quality and type of inventor as well as the classification
of the “Great Patentees” sample according to place of work at time of patent application. Section
V concludes.
I. Sweden
The Swedish case is interesting for several reasons. Firstly, the Swedish patent law from 1884
allowed patents to be registered either in the name of an individual person (or persons) or a firm.
This allows for a relatively easy comparison between other countries except the US, which used a
first-to-invent system instead of first-to-file. Furthermore, with the new patent law of 1884 Sweden
went from having a registration system to having a rigorous examination of novelty apart from
only controlling that the formal requirements were fulfilled. At this time only Sweden, the US and
Germany had introduced an examination system. Other important countries such as Britain, Italy
and France continued with a pure registration system. In this light, one could expect patents granted
in Sweden after 1884 to be of higher quality than other countries all things equal, since they had to
go through a rigorous examination to be granted. A prime example of the effect of the examination
system is world famous Swedish inventor Gustav de Laval. De Laval had no fewer than 57 Swedish
patent applications 1890-1910, which were either rejected, expired or withdrawn.12 In a simpler
registration system (e.g. Belgium) these applications would most likely have been granted with the
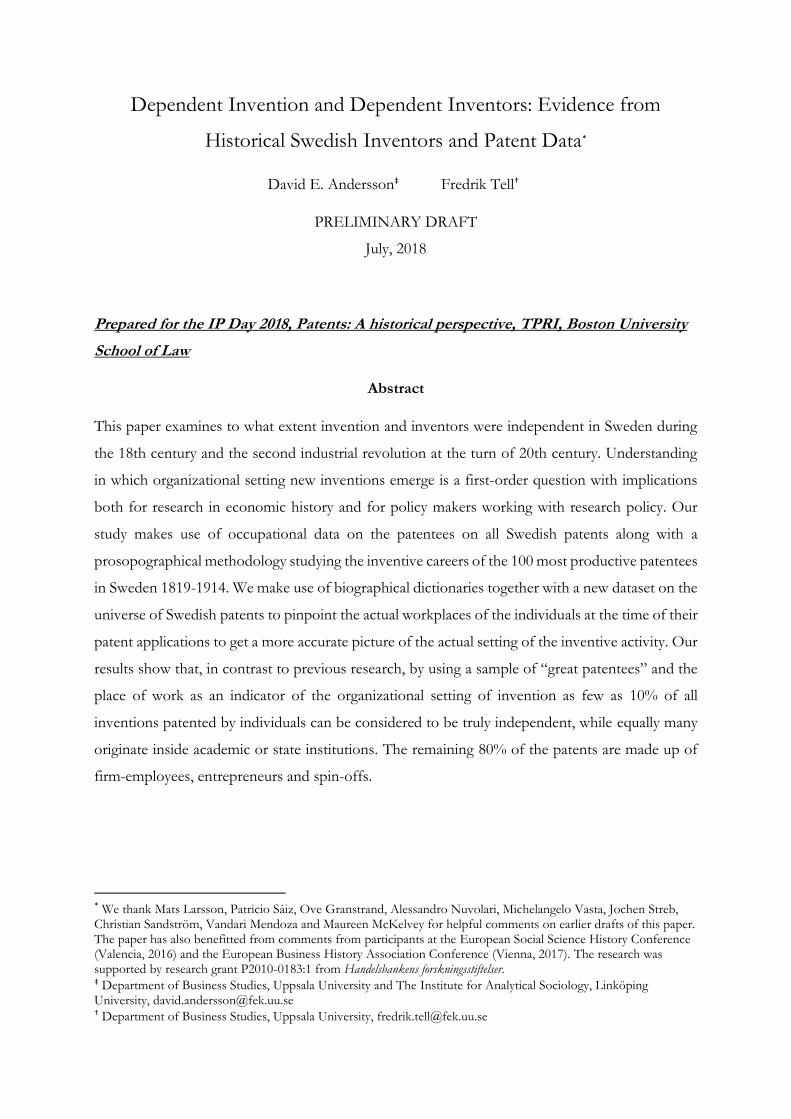
payment of a registration fee. Figure 1 shows the evolution of patenting in Sweden 1819-1914.
Besides showing a strong increase from the 1870s and onwards it also shows that starting from
1856 Sweden has been a relatively open country in terms of patenting. This is because the new
patent law in 1856 relaxed some of the restriction that had been in place for foreign patentees in
previous laws.13 From the 1880s and onwards around 50 percent of all patents were granted to
patentees not residing in Sweden. Figure 1 also shows two effects of the already mentioned patent
law from 1884. Firstly, we see that on average more that 30 percent of all patent applications were
rejected, reflecting the new examination system put in place. Secondly, individuals and firms
interesting in obtaining patents for their inventions seem to have appreciated the more secure
12 Torsten Althin, Gustaf De Laval-1845-1913: De Höga Hastigheternas Man (AB de Lavals Ångturbin, 1943). 13 David E. Andersson and Fredrik Tell, “From Fighting Monopolies to Promoting Industry: Patent Laws and Innovation in Sweden 1819-1914,” Economic History Yearbook, forthcoming.
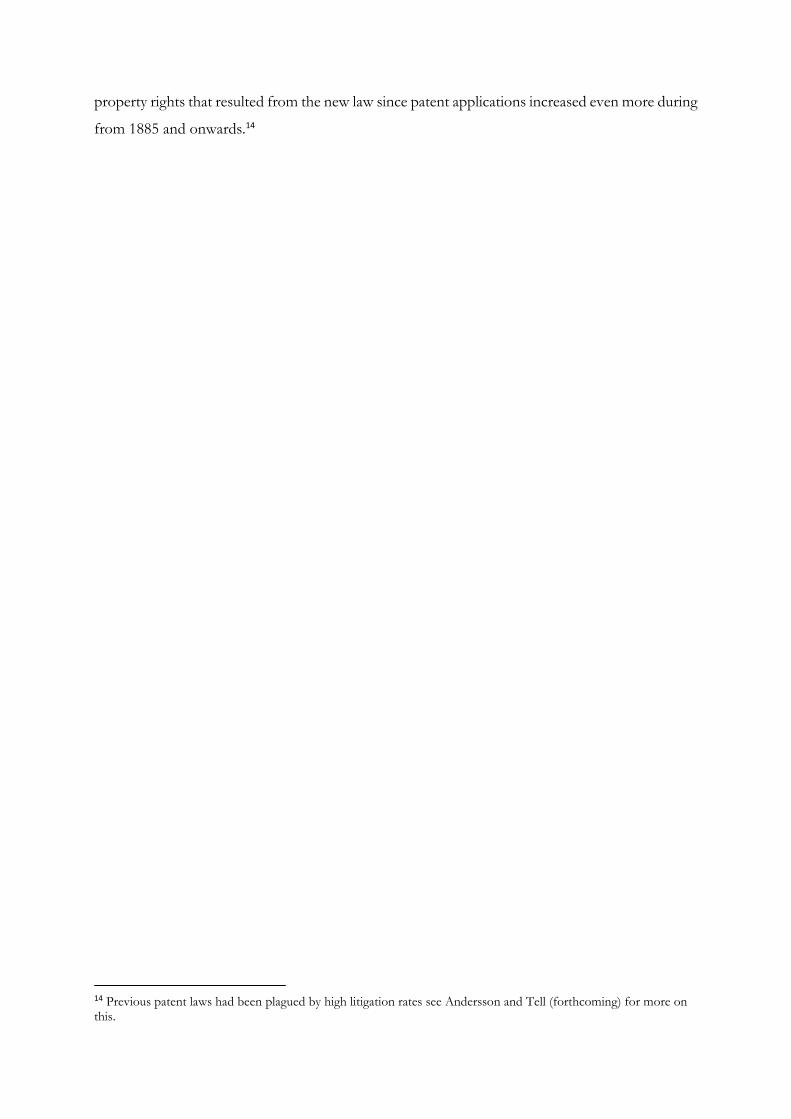
property rights that resulted from the new law since patent applications increased even more during
from 1885 and onwards.14
14 Previous patent laws had been plagued by high litigation rates see Andersson and Tell (forthcoming) for more on this.
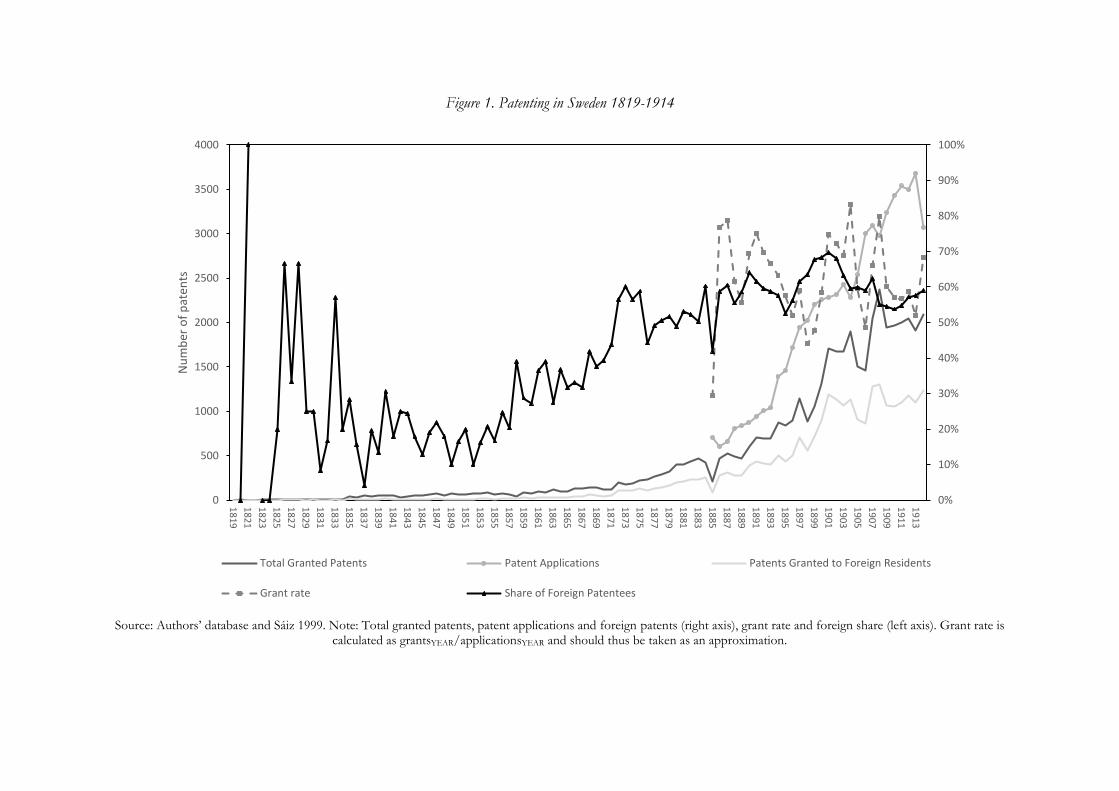
Figure 1. Patenting in Sweden 1819-1914
Source: Authors’ database and Sáiz 1999. Note: Total granted patents, patent applications and foreign patents (right axis), grant rate and foreign share (left axis). Grant rate is
calculated as grantsYEAR/applicationsYEAR and should thus be taken as an approximation.
0%
10%
20%
30%
40%
50%
60%
70%
80%
90%
100%
0
500
1000
1500
2000
2500
3000
3500
4000
18
19
18
21
18
23
18
25
18
27
18
29
18
31
18
33
18
35
18
37
18
39
18
41
18
43
18
45
18
47
18
49
18
51
18
53
18
55
18
57
18
59
18
61
18
63
18
65
18
67
18
69
18
71
18
73
18
75
18
77
18
79
18
81
18
83
18
85
18
87
18
89
18
91
18
93
18
95
18
97
18
99
19
01
19
03
19
05
19
07
19
09
19
11
19
13
Nu
mb
er o
f p
aten
ts
Total Granted Patents Patent Applications Patents Granted to Foreign Residents
Grant rate Share of Foreign Patentees
Secondly, an argument is often made for the importance of costs in the patent system for
independent invention.15 Financially constrained individuals should have a harder time to use the
patent system than firms that have an easier access to financial resources. The usual example of a
cheap patent system is often the American one which only demanded a one-time fee for seventeen
years of patent protection.16 Figure 2 shows that the Swedish system, even though not as cheap as
the US one, were considerably cheaper than many of its European counterparts at the time.
Figure 2. Patenting costs in different countries in 1900
Source: Lerner (2002)
However, even though it was obviously a great advantage of the US system for patentees that there
were no fees to be paid during the time period one could argue that what is most important for
individual patentees is obtaining a patent in the first place and that paying for keeping a good and
solid patent alive is in a way a more pleasant problem and possibly one that is easier to overcome.
Furthermore, obtaining finances to pay for patent fees or for exploiting an invention was most
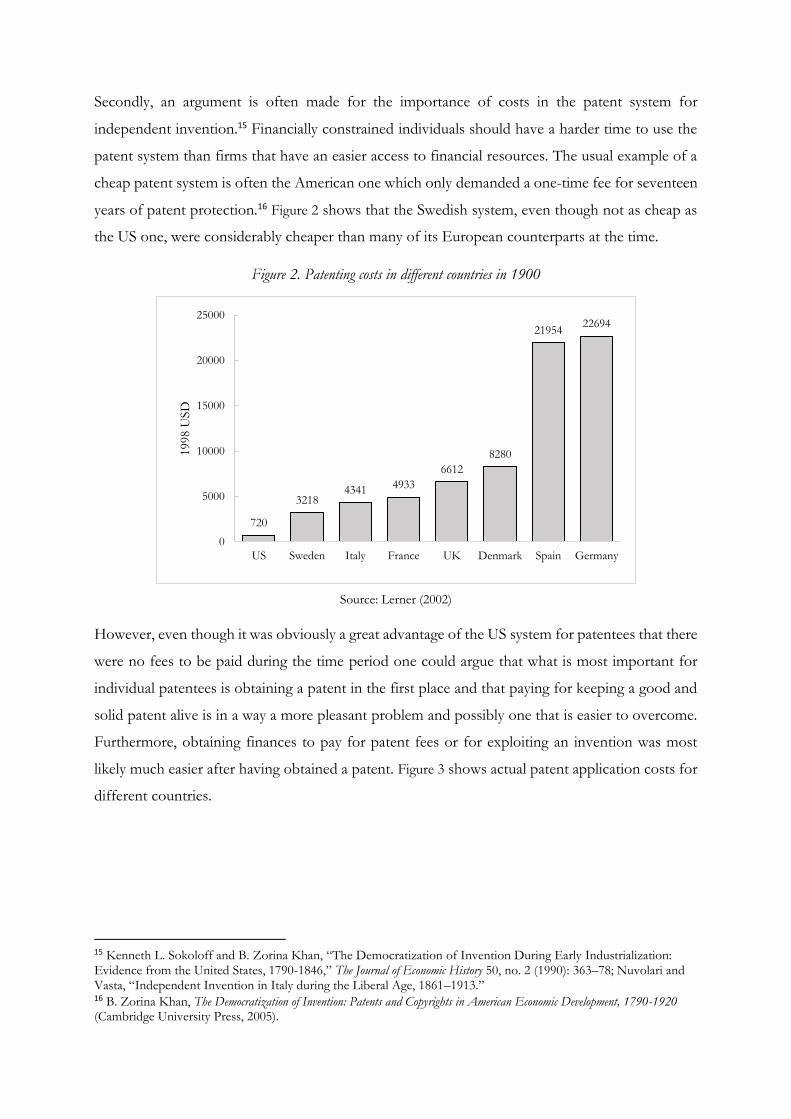
likely much easier after having obtained a patent. Figure 3 shows actual patent application costs for
different countries.
15 Kenneth L. Sokoloff and B. Zorina Khan, “The Democratization of Invention During Early Industrialization: Evidence from the United States, 1790-1846,” The Journal of Economic History 50, no. 2 (1990): 363–78; Nuvolari and Vasta, “Independent Invention in Italy during the Liberal Age, 1861–1913.” 16 B. Zorina Khan, The Democratization of Invention: Patents and Copyrights in American Economic Development, 1790-1920 (Cambridge University Press, 2005).
720
32184341 4933
6612
8280
2195422694
0
5000
10000
15000
20000
25000
US Sweden Italy France UK Denmark Spain Germany
1998 U
SD
Figure 3. Patent application costs in different countries in 1884
Source: Andrée, S.A., 1888. Uppfinningarna i Sverige åren 1870–84, Stockholm
In this light the US system is instead the most expensive one being more than six times as expensive
as the Swedish one and almost twenty times as expensive as the Belgium one which is by far the
cheapest. One could argue that this is a more relevant comparison, since these were the actual
application costs that had to be paid to obtain a patent. Interestingly enough, as can be seen in the
graph most European countries only had half the costs (or less) than the US system. Ceteris paribus,
this shows that Sweden was cheaper or just as cheap/expensive as other countries during the same
time, which should at least not be a hinderance for individuals to patent.
Also important for our arguments below is the industrial structure of Sweden at the time. Figure 4
shows how factory ownership was distributed in Sweden between 1863-1910. As can be seen, as
late as 1910 about 50 percent of all Swedish factories was still owned by individual proprietors and
not by firms.
42
128
203 215239
269315
347
431 437
795
0
100
200
300
400
500
600
700
800
900
1998 U
SD
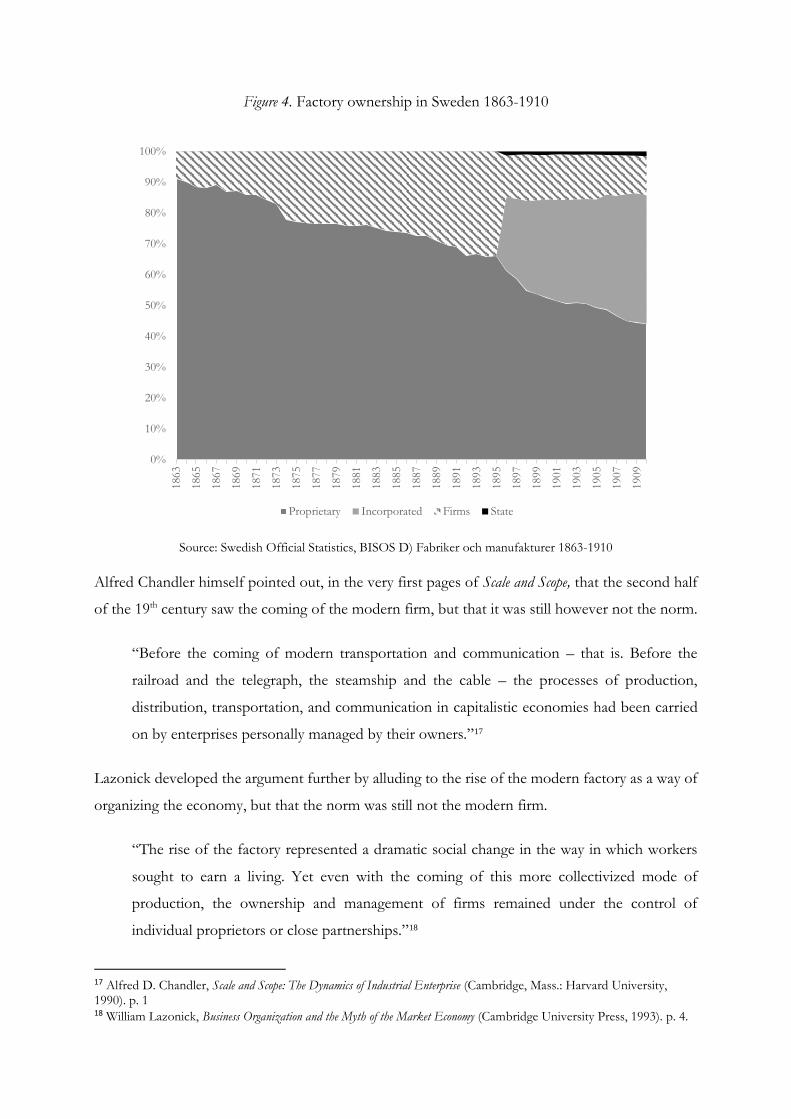
Figure 4. Factory ownership in Sweden 1863-1910
Source: Swedish Official Statistics, BISOS D) Fabriker och manufakturer 1863-1910
Alfred Chandler himself pointed out, in the very first pages of Scale and Scope, that the second half
of the 19th century saw the coming of the modern firm, but that it was still however not the norm.
“Before the coming of modern transportation and communication – that is. Before the
railroad and the telegraph, the steamship and the cable – the processes of production,
distribution, transportation, and communication in capitalistic economies had been carried
on by enterprises personally managed by their owners.”17
Lazonick developed the argument further by alluding to the rise of the modern factory as a way of
organizing the economy, but that the norm was still not the modern firm.
“The rise of the factory represented a dramatic social change in the way in which workers
sought to earn a living. Yet even with the coming of this more collectivized mode of
production, the ownership and management of firms remained under the control of
individual proprietors or close partnerships.”18
17 Alfred D. Chandler, Scale and Scope: The Dynamics of Industrial Enterprise (Cambridge, Mass.: Harvard University, 1990). p. 1 18 William Lazonick, Business Organization and the Myth of the Market Economy (Cambridge University Press, 1993). p. 4.
0%
10%
20%
30%
40%
50%
60%
70%
80%
90%
100%
1863
1865
1867
1869
1871
1873
1875
1877
1879
1881
1883
1885
1887
1889
1891
1893
1895
1897
1899
1901
1903
1905
1907
1909
Proprietary Incorporated Firms State
II. Data
To be able to study the organizational setting of inventions we combine to unique datasets on
Swedish patents and inventors. The dataset on Swedish patents comprises the universe of Swedish
patents (>45,000) from the first patent law in 1819 until the start of WWI in 1914 and was collected
from the original ledgers of the Swedish National Archive and Patent Office archive.19 For every
patent we have collected the date of application, grant and expiration, official patent number, the
name(s) of the patentee(s) and the inventor(s) (coded as individual, firm or institution), the place
of residence of individuals and firms, the duration of the patent, the agent used (if any) by the
patentee, the technological classification of the patent and more.20 We then excerpted the inventive
career of the 110 most active Swedish individuals in our data set of Swedish patents starting with
the year of their first patent application.21 We choose the application date as this most likely is the
date that is closest in time to the actual time of invention.22
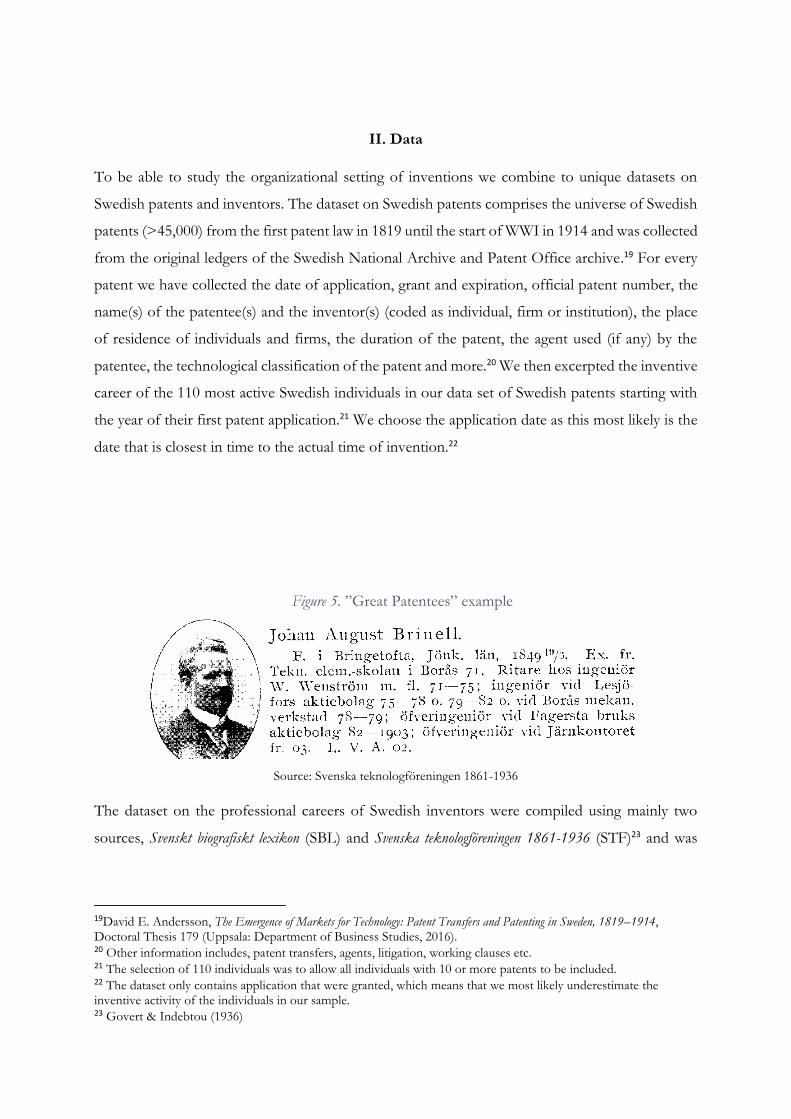
Source: Svenska teknologföreningen 1861-1936
The dataset on the professional careers of Swedish inventors were compiled using mainly two
sources, Svenskt biografiskt lexikon (SBL) and Svenska teknologföreningen 1861-1936 (STF)23 and was
19David E. Andersson, The Emergence of Markets for Technology: Patent Transfers and Patenting in Sweden, 1819–1914, Doctoral Thesis 179 (Uppsala: Department of Business Studies, 2016). 20 Other information includes, patent transfers, agents, litigation, working clauses etc. 21 The selection of 110 individuals was to allow all individuals with 10 or more patents to be included. 22 The dataset only contains application that were granted, which means that we most likely underestimate the inventive activity of the individuals in our sample. 23 Govert & Indebtou (1936)
Figure 5. ”Great Patentees” example
complemented with other biographical dictionaries as well.24 The dictionaries and registers contain
detailed information about the individual’s life including, place of birth, parents, education and
most importantly, information about where and when the individual worked and in what position.
Figure 5 shows an example of an entry in the STF register of the Swedish inventor Johan August
Brinell. As can be seen it clearly shows that he started his career as a drawer for engineer Wilhelm
Wenström working there 1871-1875, before moving to work as an engineer for the firm Lesjöfors
AB and ending his career as chief engineer at Jernkontoret25. For every entry of a new workplace,
we have recorded the occupational title and the period. In the end, we have in this way managed
to reconstruct the professional careers of 79 of the individuals in our most productive inventor
sample. We call these individuals “Great Patentees”.
III. Descriptives
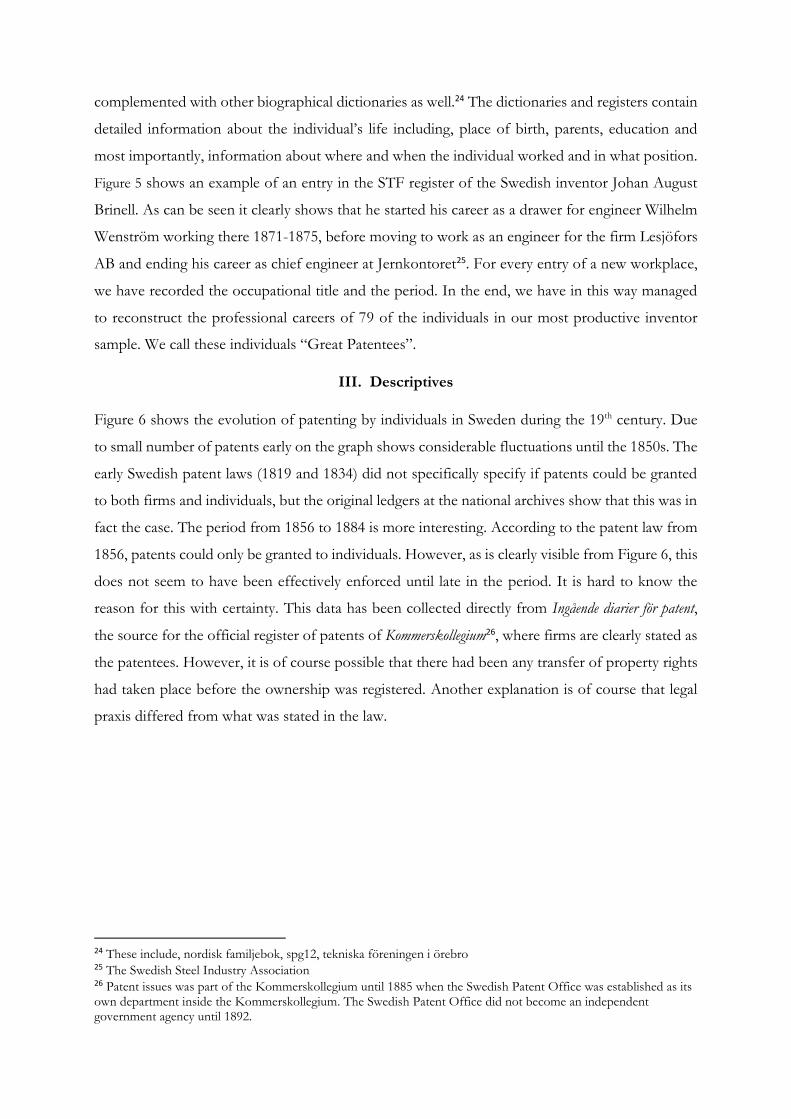
Figure 6 shows the evolution of patenting by individuals in Sweden during the 19th century. Due
to small number of patents early on the graph shows considerable fluctuations until the 1850s. The
early Swedish patent laws (1819 and 1834) did not specifically specify if patents could be granted
to both firms and individuals, but the original ledgers at the national archives show that this was in
fact the case. The period from 1856 to 1884 is more interesting. According to the patent law from
1856, patents could only be granted to individuals. However, as is clearly visible from Figure 6, this
does not seem to have been effectively enforced until late in the period. It is hard to know the
reason for this with certainty. This data has been collected directly from Ingående diarier för patent,
the source for the official register of patents of Kommerskollegium26, where firms are clearly stated as
the patentees. However, it is of course possible that there had been any transfer of property rights
had taken place before the ownership was registered. Another explanation is of course that legal
praxis differed from what was stated in the law.
24 These include, nordisk familjebok, spg12, tekniska föreningen i örebro 25 The Swedish Steel Industry Association 26 Patent issues was part of the Kommerskollegium until 1885 when the Swedish Patent Office was established as its own department inside the Kommerskollegium. The Swedish Patent Office did not become an independent government agency until 1892.
Figure 6. Share of patents granted to individuals in Sweden, 1834-1914
Source: Authors’ database
As we mentioned earlier, the law from 1884 explicitly stated that patents could be granted to both
individuals and firms. This legal change is clearly visible in the strong break in 1885.27 The decline
in patents granted to individuals then declines throughout the rest of our time period. The strong
break in 1885 tells us that firms where eager to register patents, but there is also the possibility
that patents previously granted to individuals actually covered firm inventions.
The geographical distributions of patents in Sweden is shown in the maps of Figure 7 for four
different benchmark years. The maps shows how Sweden first industrialized on east coast, where
patenting activity was high in the counties of Gävleborg and Västernorrland in the 1890s, where two
important industrial cities are located, Gävle and Sundsvall respectively. Most inventive activity is
concentrated in the capital of Stockholm, which has more 30 precent of all patents during the
whole period. The maps also show how inventive activity spread more evenly across the country
in the end of the 19th century and beginning of the 20th century, while at the same time becoming
more concentrated in the counties of Västra Götaland and Skåne, where the Sweden’s second and
third largest cities, Gothenburg and Malmo are situated.
27 The 1884 law came into force on January 1, 1885.
65%
70%
75%
80%
85%
90%
95%
100%
18
34
18
37
18
40
18
43
18
46
18
49
18
52
18
55
18
58
18
61
18
64
18
67
18
70
18
73
18
76
18
79
18
82
18
85
18
88
18
91
18
94
18
97
19
00
19
03
19
06
19
09
19
12
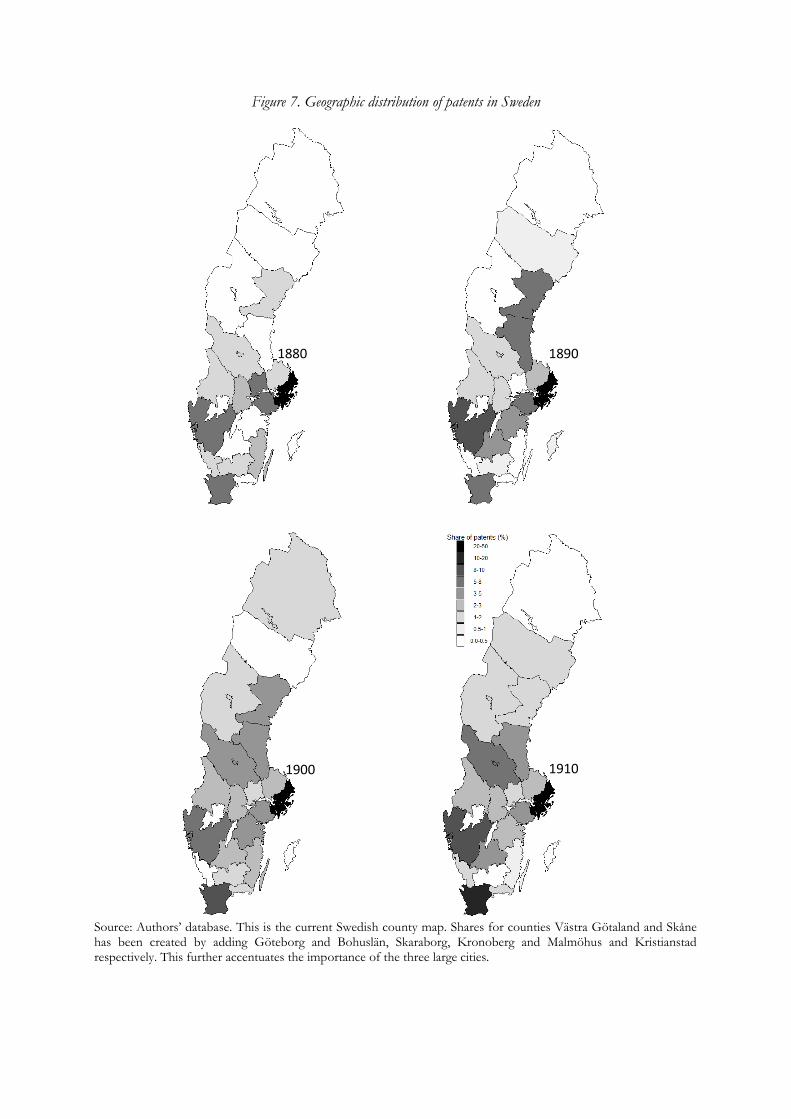
Figure 7. Geographic distribution of patents in Sweden
Source: Authors’ database. This is the current Swedish county map. Shares for counties Västra Götaland and Skåne has been created by adding Göteborg and Bohuslän, Skaraborg, Kronoberg and Malmöhus and Kristianstad respectively. This further accentuates the importance of the three large cities.
1880
1910 1900
1890
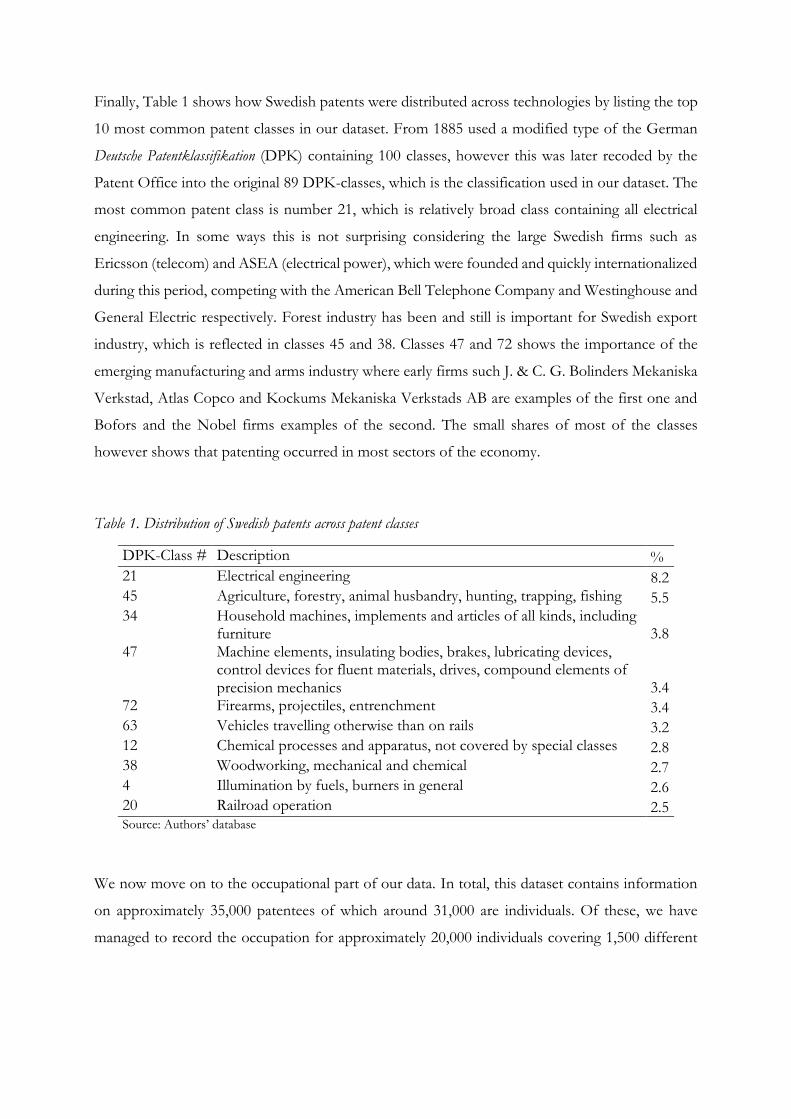
Finally, Table 1 shows how Swedish patents were distributed across technologies by listing the top
10 most common patent classes in our dataset. From 1885 used a modified type of the German
Deutsche Patentklassifikation (DPK) containing 100 classes, however this was later recoded by the
Patent Office into the original 89 DPK-classes, which is the classification used in our dataset. The
most common patent class is number 21, which is relatively broad class containing all electrical
engineering. In some ways this is not surprising considering the large Swedish firms such as
Ericsson (telecom) and ASEA (electrical power), which were founded and quickly internationalized
during this period, competing with the American Bell Telephone Company and Westinghouse and
General Electric respectively. Forest industry has been and still is important for Swedish export
industry, which is reflected in classes 45 and 38. Classes 47 and 72 shows the importance of the
emerging manufacturing and arms industry where early firms such J. & C. G. Bolinders Mekaniska
Verkstad, Atlas Copco and Kockums Mekaniska Verkstads AB are examples of the first one and
Bofors and the Nobel firms examples of the second. The small shares of most of the classes
however shows that patenting occurred in most sectors of the economy.
Table 1. Distribution of Swedish patents across patent classes
DPK-Class # Description %
21 Electrical engineering 8.2 45 Agriculture, forestry, animal husbandry, hunting, trapping, fishing 5.5 34 Household machines, implements and articles of all kinds, including
furniture 3.8 47 Machine elements, insulating bodies, brakes, lubricating devices,
control devices for fluent materials, drives, compound elements of precision mechanics 3.4
72 Firearms, projectiles, entrenchment 3.4 63 Vehicles travelling otherwise than on rails 3.2 12 Chemical processes and apparatus, not covered by special classes 2.8 38 Woodworking, mechanical and chemical 2.7 4 Illumination by fuels, burners in general 2.6 20 Railroad operation 2.5 Source: Authors’ database
We now move on to the occupational part of our data. In total, this dataset contains information
on approximately 35,000 patentees of which around 31,000 are individuals. Of these, we have
managed to record the occupation for approximately 20,000 individuals covering 1,500 different
occupational titles.28 To get make this number more manageable and to collapse titles representing
the same occupation, these occupations have in a second step been coded according to the
Historical International Standard Classification of Occupations (HISCO)29.
Figure 8 shows the distribution of the different HISCO classes among the individuals in the dataset.
As can be seen, there is a strong overrepresentation of the group containing professional and
technical workers e.g. engineers.30 This is however expected considering that Sweden was to a large
extent an agricultural society at the turn of the twentieth century. For the purpose of this paper
however, it is interesting to note that the group which includes managerial workers also make up a
considerable part of the sample. This group mainly consists of managers and different kinds of
foremen and supervisors, which can be seen more clearly in Table 2.
28 These occupational titles have been recorded exactly as they are written in the register, which explain the large number of titles. For example, the Swedish titles fabriksidkare, fabrikör, fabrikant, fabriksägare, industriidkare all mean manufacturer/factory owner. 29 For more on HISCO see: Marco H. D. Van Leeuwen, Ineke Maas, and Andrew Miles, HISCO Historical International Standard Classification of Occupations (Leuven: Leuven Univ Press, 2002); Marco H. D. Van Leeuwen, Ineke Maas, and Andrew Miles, “Creating a Historical International Standard Classification of Occupations An Exercise in Multinational Interdisciplinary Cooperation,” Historical Methods: A Journal of Quantitative and Interdisciplinary History 37, no. 4 (September 2004): 186–97, https://doi.org/10.3200/HMTS.37.4.186-197. Occupational sectors follow the 7 major groups of the Historical International Standard Classification of Occupations (HISCO). Professionals includes professional, technical and related workers. Administrative includes administrative and managerial workers. Clerical includes clerical and related workers. Sales includes sales workers. Service includes service workers. Agricultural includes agricultural, animal husbandry and forestry workers, fishermen and hunters. Industrial includes production and related workers, transport equipment operators and laborers. 30 David Andersson, Mounir Karadja, and Erik Prawitz, “Mass Migration, Cheap Labor, and Innovation,” 2016. have shown that this distribution is almost reversed when looking at the total Swedish population where agricultural workers instead make up about 50 percent of the population. See Figure 11, p. 36.
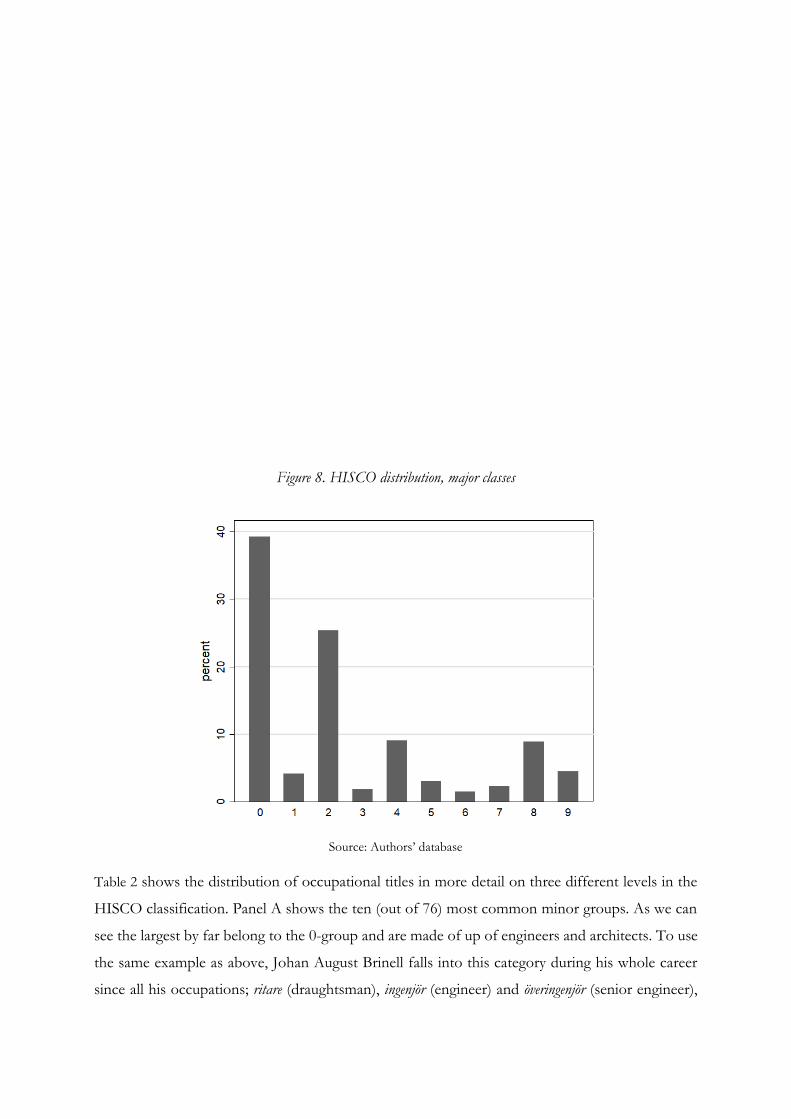
Figure 8. HISCO distribution, major classes
Source: Authors’ database
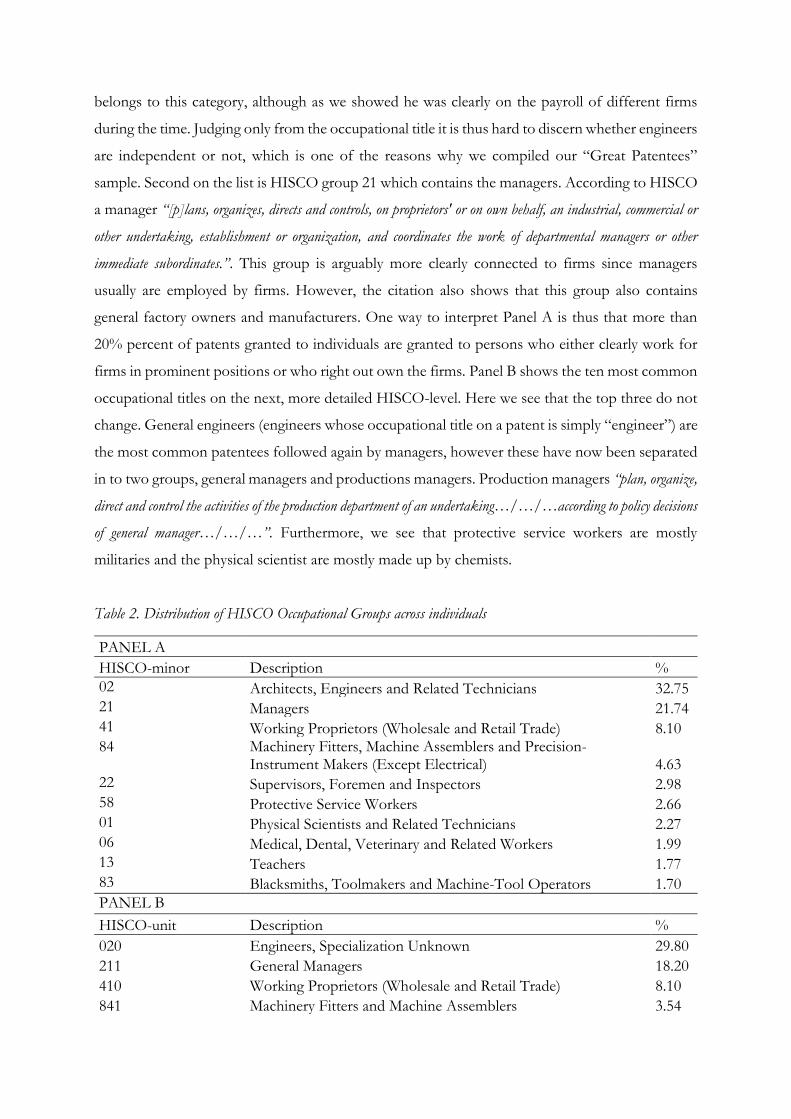
Table 2 shows the distribution of occupational titles in more detail on three different levels in the
HISCO classification. Panel A shows the ten (out of 76) most common minor groups. As we can
see the largest by far belong to the 0-group and are made of up of engineers and architects. To use
the same example as above, Johan August Brinell falls into this category during his whole career
since all his occupations; ritare (draughtsman), ingenjör (engineer) and överingenjör (senior engineer),
belongs to this category, although as we showed he was clearly on the payroll of different firms
during the time. Judging only from the occupational title it is thus hard to discern whether engineers
are independent or not, which is one of the reasons why we compiled our “Great Patentees”
sample. Second on the list is HISCO group 21 which contains the managers. According to HISCO
a manager “[p]lans, organizes, directs and controls, on proprietors' or on own behalf, an industrial, commercial or
other undertaking, establishment or organization, and coordinates the work of departmental managers or other
immediate subordinates.”. This group is arguably more clearly connected to firms since managers
usually are employed by firms. However, the citation also shows that this group also contains
general factory owners and manufacturers. One way to interpret Panel A is thus that more than
20% percent of patents granted to individuals are granted to persons who either clearly work for
firms in prominent positions or who right out own the firms. Panel B shows the ten most common
occupational titles on the next, more detailed HISCO-level. Here we see that the top three do not
change. General engineers (engineers whose occupational title on a patent is simply “engineer”) are
the most common patentees followed again by managers, however these have now been separated
in to two groups, general managers and productions managers. Production managers “plan, organize,
direct and control the activities of the production department of an undertaking…/…/…according to policy decisions
of general manager…/…/…”. Furthermore, we see that protective service workers are mostly
militaries and the physical scientist are mostly made up by chemists.
Table 2. Distribution of HISCO Occupational Groups across individuals
PANEL A
HISCO-minor Description %
02 Architects, Engineers and Related Technicians 32.75 21 Managers 21.74 41 Working Proprietors (Wholesale and Retail Trade) 8.10 84 Machinery Fitters, Machine Assemblers and Precision-
Instrument Makers (Except Electrical) 4.63 22 Supervisors, Foremen and Inspectors 2.98 58 Protective Service Workers 2.66 01 Physical Scientists and Related Technicians 2.27 06 Medical, Dental, Veterinary and Related Workers 1.99 13 Teachers 1.77 83 Blacksmiths, Toolmakers and Machine-Tool Operators 1.70
PANEL B
HISCO-unit Description %
020 Engineers, Specialization Unknown 29.80
211 General Managers 18.20
410 Working Proprietors (Wholesale and Retail Trade) 8.10
841 Machinery Fitters and Machine Assemblers 3.54
212 Production Managers 3.07
583 Military 2.52
226 Production Supervisors and General Foremen 2.50
011 Chemists 2.18
061 Medical Doctors 1.33
021 Architects and Town Planners 1.28
PANEL C
HISCO-code Description %
02000 Engineers, Specialization Unknown 28.98 21110 General Manager 17.70 41025 Working Proprietor (Wholesale or Retail Trade) 5.61 84100 Machinery Fitter or Machine Assembler, Type of Machine
Unknown 3.44 -131 Noble men/women 2.47 22610 Production Supervisor or Foreman, General 2.26 58320 Officer 2.20 01110 Chemist, General 2.11 41020 Working Proprietor (Wholesale Trade) 2.01 21220 Production Manager (except Farm) 1.38
PANEL D
Occupation (Swedish) Occupation (English) %
Ingenjör Engineer 28.4
Fabriksidkare Manufacturer (factory owner, proprietor) 12.4
Handlande Merchant 5.4
Mekaniker Mechanic 3.0
Direktör General Manager 2.4
Kemist Chemist 2.1
Grosshandlare Wholesale merchant 1.9
Verkmästare Foreman 1.7
Disponent Technical manager 1.0
Elektriker Electrician 1.0
Source: Authors’ database
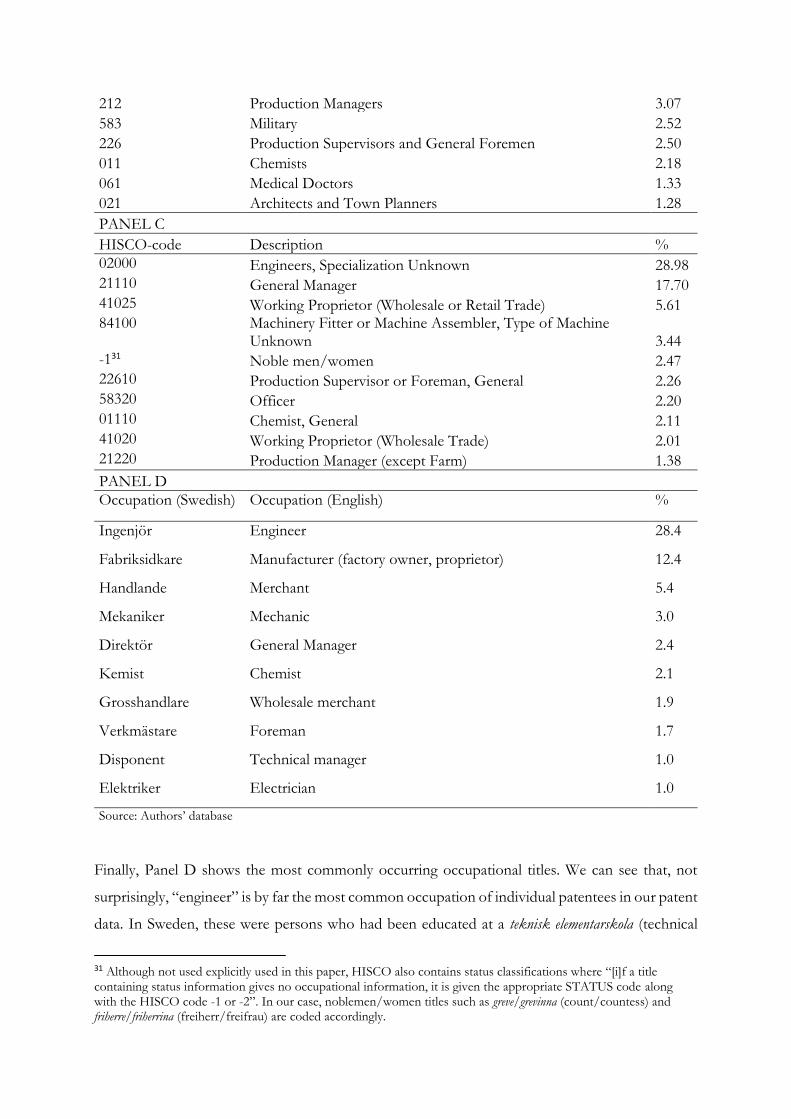
Finally, Panel D shows the most commonly occurring occupational titles. We can see that, not
surprisingly, “engineer” is by far the most common occupation of individual patentees in our patent
data. In Sweden, these were persons who had been educated at a teknisk elementarskola (technical
31 Although not used explicitly used in this paper, HISCO also contains status classifications where “[i]f a title containing status information gives no occupational information, it is given the appropriate STATUS code along with the HISCO code -1 or -2”. In our case, noblemen/women titles such as greve/grevinna (count/countess) and friherre/friherrina (freiherr/freifrau) are coded accordingly.
secondary school/gymnasium), but many also had an education from one the technical universities
in Sweden during the time, The Royal Institute of Technology and Chalmers University of
Technology. The second most common occupation of individuals is fabriksidkare or
“manufacturer”, a person who is the proprietor of a factory.32 These persons are the owners of the
factories in Figure 4 above.33 Perhaps even more clearly than the managers, these persons most
likely represents firm patents since these individuals are the owners of firms that are not
incorporated. There are several examples that this was the case. One of them is the famous Swedish
inventor Johan Petter Johansson, the inventor of the modern adjustable wrench and the plumber’s
wrench.34 As an entrepreneur he founded his own firm, Enköpings Mekaniska Verkstad in 1886, but
took out his patents in his own name until the firm was incorporated in 1902. Interestingly enough,
the percentage of manufacturers in our data is similar to those reported by Nicholas for the British
data, pointing to the fact that these patterns most likely were similar in some of the most important
industrialized countries.35 We continue to test this below.
IV Analysis
As already mentioned above, with the 1884 patent law Sweden’s patent system changed from a
registration system with a one-time fee to employing a patent fee system with an increasing fee
structure. In 1885 the application fee was SEK 50, but this was lowered to SEK 20 in 1893 due to
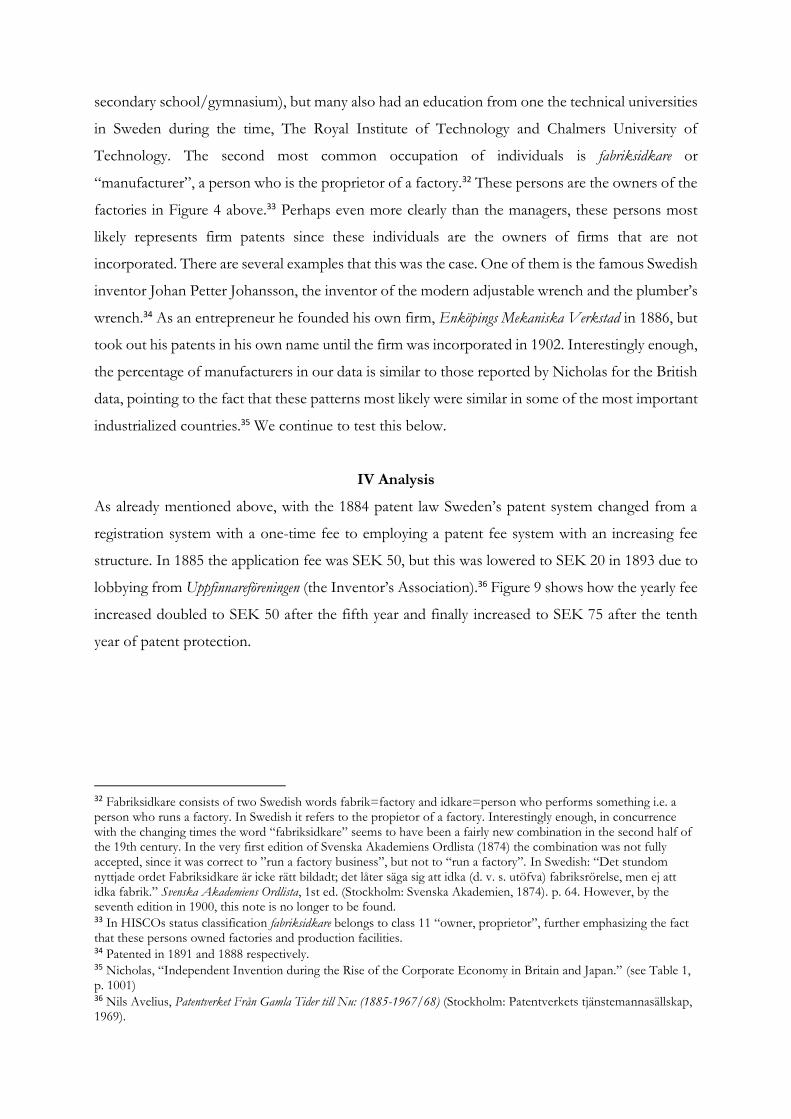
lobbying from Uppfinnareföreningen (the Inventor’s Association).36 Figure 9 shows how the yearly fee
increased doubled to SEK 50 after the fifth year and finally increased to SEK 75 after the tenth
year of patent protection.
32 Fabriksidkare consists of two Swedish words fabrik=factory and idkare=person who performs something i.e. a person who runs a factory. In Swedish it refers to the propietor of a factory. Interestingly enough, in concurrence with the changing times the word “fabriksidkare” seems to have been a fairly new combination in the second half of the 19th century. In the very first edition of Svenska Akademiens Ordlista (1874) the combination was not fully accepted, since it was correct to ”run a factory business”, but not to “run a factory”. In Swedish: “Det stundom nyttjade ordet Fabriksidkare är icke rätt bildadt; det låter säga sig att idka (d. v. s. utöfva) fabriksrörelse, men ej att idka fabrik.” Svenska Akademiens Ordlista, 1st ed. (Stockholm: Svenska Akademien, 1874). p. 64. However, by the seventh edition in 1900, this note is no longer to be found. 33 In HISCOs status classification fabriksidkare belongs to class 11 “owner, proprietor”, further emphasizing the fact that these persons owned factories and production facilities. 34 Patented in 1891 and 1888 respectively. 35 Nicholas, “Independent Invention during the Rise of the Corporate Economy in Britain and Japan.” (see Table 1, p. 1001) 36 Nils Avelius, Patentverket Från Gamla Tider till Nu: (1885-1967/68) (Stockholm: Patentverkets tjänstemannasällskap, 1969).
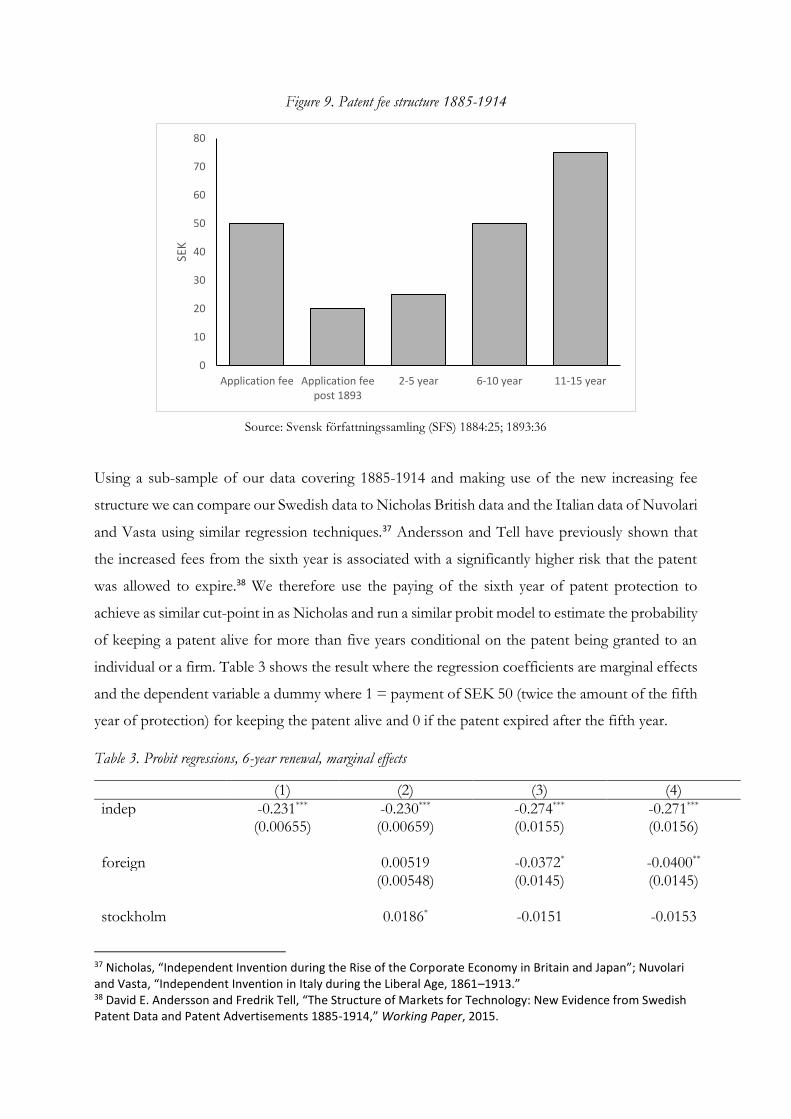
Figure 9. Patent fee structure 1885-1914
Source: Svensk författningssamling (SFS) 1884:25; 1893:36
Using a sub-sample of our data covering 1885-1914 and making use of the new increasing fee
structure we can compare our Swedish data to Nicholas British data and the Italian data of Nuvolari
and Vasta using similar regression techniques.37 Andersson and Tell have previously shown that
the increased fees from the sixth year is associated with a significantly higher risk that the patent
was allowed to expire.38 We therefore use the paying of the sixth year of patent protection to
achieve as similar cut-point in as Nicholas and run a similar probit model to estimate the probability
of keeping a patent alive for more than five years conditional on the patent being granted to an
individual or a firm. Table 3 shows the result where the regression coefficients are marginal effects
and the dependent variable a dummy where 1 = payment of SEK 50 (twice the amount of the fifth
year of protection) for keeping the patent alive and 0 if the patent expired after the fifth year.
Table 3. Probit regressions, 6-year renewal, marginal effects
(1) (2) (3) (4)
indep -0.231*** -0.230*** -0.274*** -0.271*** (0.00655) (0.00659) (0.0155) (0.0156) foreign 0.00519 -0.0372* -0.0400** (0.00548) (0.0145) (0.0145) stockholm 0.0186* -0.0151 -0.0153
37 Nicholas, “Independent Invention during the Rise of the Corporate Economy in Britain and Japan”; Nuvolari and Vasta, “Independent Invention in Italy during the Liberal Age, 1861–1913.” 38 David E. Andersson and Fredrik Tell, “The Structure of Markets for Technology: New Evidence from Swedish Patent Data and Patent Advertisements 1885-1914,” Working Paper, 2015.
0
10
20
30
40
50
60
70
80
Application fee Application feepost 1893
2-5 year 6-10 year 11-15 year
SEK
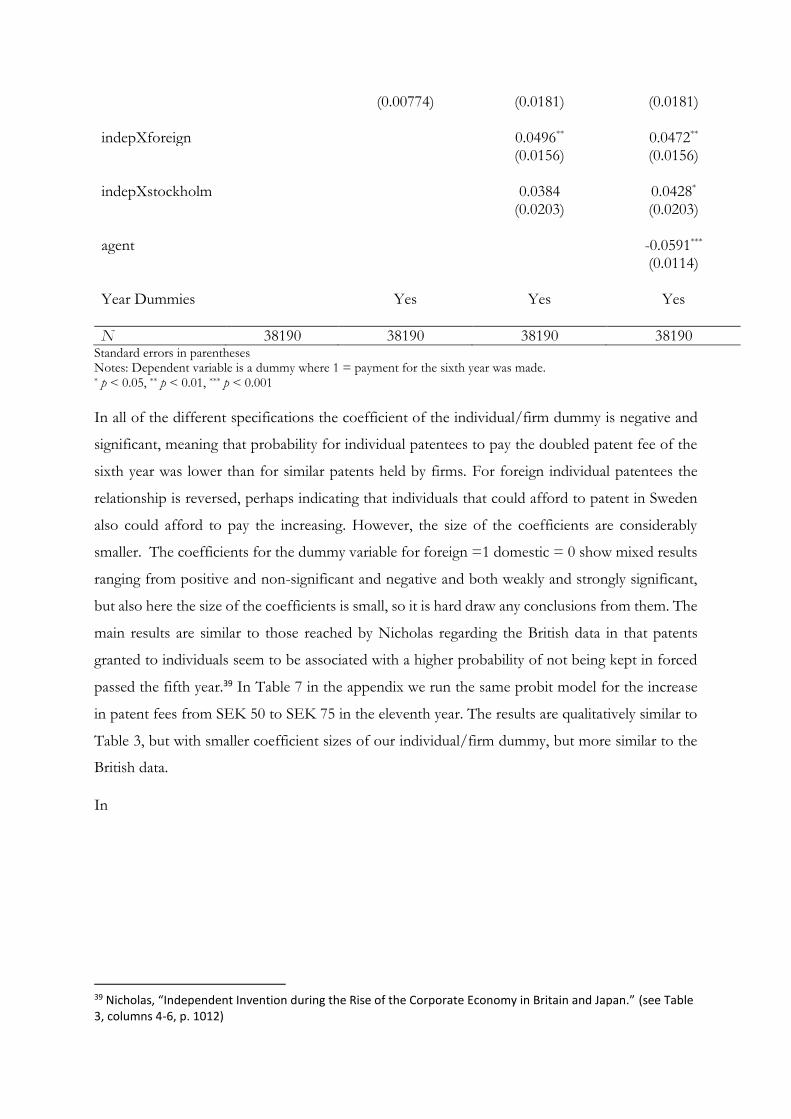
(0.00774) (0.0181) (0.0181) indepXforeign 0.0496** 0.0472** (0.0156) (0.0156) indepXstockholm 0.0384 0.0428* (0.0203) (0.0203) agent -0.0591*** (0.0114) Year Dummies Yes Yes Yes
N 38190 38190 38190 38190 Standard errors in parentheses Notes: Dependent variable is a dummy where 1 = payment for the sixth year was made. * p < 0.05, ** p < 0.01, *** p < 0.001
In all of the different specifications the coefficient of the individual/firm dummy is negative and
significant, meaning that probability for individual patentees to pay the doubled patent fee of the
sixth year was lower than for similar patents held by firms. For foreign individual patentees the
relationship is reversed, perhaps indicating that individuals that could afford to patent in Sweden
also could afford to pay the increasing. However, the size of the coefficients are considerably
smaller. The coefficients for the dummy variable for foreign =1 domestic = 0 show mixed results
ranging from positive and non-significant and negative and both weakly and strongly significant,
but also here the size of the coefficients is small, so it is hard draw any conclusions from them. The
main results are similar to those reached by Nicholas regarding the British data in that patents
granted to individuals seem to be associated with a higher probability of not being kept in forced
passed the fifth year.39 In Table 7 in the appendix we run the same probit model for the increase
in patent fees from SEK 50 to SEK 75 in the eleventh year. The results are qualitatively similar to
Table 3, but with smaller coefficient sizes of our individual/firm dummy, but more similar to the
British data.
In
39 Nicholas, “Independent Invention during the Rise of the Corporate Economy in Britain and Japan.” (see Table 3, columns 4-6, p. 1012)
Table 4 and 5 we use the fact the Swedish fee structure included yearly patent fees in addition to
the fees increasing step wise. This allows us to also compare the Swedish data to Nuvolari and
Vasta’s.40 As with the Italian data, Swedish patents could be kept in force for a maximum of 15
years with yearly patent fees payable. One major difference from the Italian system is of course
that, as previously mentioned, Sweden now employed a novelty examination while Italy still used
a registration system. Also, all granted patents in Sweden were given 15 years of protection
conditional on the payment of fees and patentees could not ask for specific patent lengths or
prolong them later during the process as was the case in Italy.41 Since citation data seldom is
available for historical patent data, renewal fees have been shown to be a good proxy for the
economic value of patents since at a minimum a keeping a patent alive must be associated with
some kind of subjective value to the patentee.42 Patent citations are furthermore arguably more of
a measurement of technological quality of patents.43
40 Nuvolari and Vasta, “Independent Invention in Italy during the Liberal Age, 1861–1913.” 41 The registration system employed in Sweden between 1856-1884 was similar to the Italian system in that patentees could ask for specific patent lengths and in some exceptional cases prolongations. However only a one-time fee was paid, and no yearly fees used. 42 Mark Schankerman and Ariel Pakes, “Estimates of the Value of Patent Rights in European Countries during the Post-1950 Period,” The Economic Journal 96 (1986): 1052–76; Carsten Burhop, “The Transfer of Patents in Imperial Germany,” The Journal of Economic History 70, no. 4 (2010): 921–939. 43 Adam B. Jaffe and Manuel Trajtenberg, Patents, Citations, and Innovations: A Window on the Knowledge Economy (MIT Press, 2002).
Table 4 uses similar specifications of a censored poisson model as Nuvolari and Vasta where patent
length is transformed from 1-15 to 0-14 to avoid zero-truncation.44 In Table 6 we also include
control for the different major HISCO groups discussed in Table 2.
Table 4 shows that on average individual patentees keep their patents alive for a shorter amount of
time compared to the firm counterparts. This could of course be because of financial constraints,
but as we have shown above, the Swedish patent system was cheaper than both the Italian and the
British system so this was most likely the case. Furthermore, the application cost, at least from
1893 was among the lowest in Europe during this time. Considering that individuals had the
possibility to make use of markets for technology, as long as you got your patent granted, valuable
inventions should have been able to get finances. From 1886, there even existed an Uppfinnarbörs
(“Inventor’s Exchange”) in the largest industry journal of the time Industritidnngen Norden (“The
44 However,
Table 8 in the appendix shows that a zero-truncated model gives qualitatively similar results.
North”), which was similar to the American journal Scientific American. Here anyone could freely
advertise for inventions, patents or licensing up to three times. Andersson and Tell have shown
that during the end of the 19th century more than 1,000 advertisements was made through this
exchange of which they have been able to connect more than 700 of them to specific patents.45
This shows, that obtaining a patent was crucial, but that there were probably good possibilities to
obtain further financing for promising patents ones they had been granted., which stresses the
importance of low application costs. Another explanation is of course the one we alluded to in the
introduction, that inventive activity organized in firms or associated with firms is better equipped
to manage patent strategically and has better access complementary resources needed to properly
exploit the patent.46 It could also be the case that the collective environment that factories and
firms represent creates a more dynamic environment where engineers could benefit from each
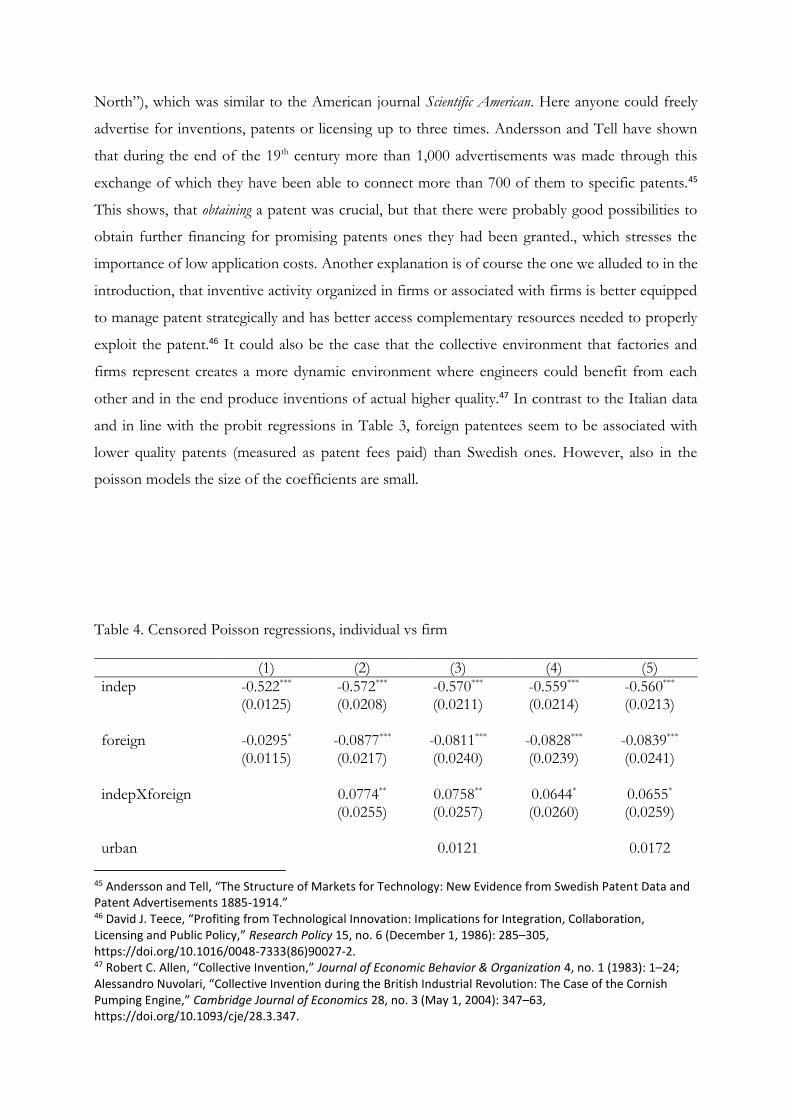
other and in the end produce inventions of actual higher quality.47 In contrast to the Italian data
and in line with the probit regressions in Table 3, foreign patentees seem to be associated with
lower quality patents (measured as patent fees paid) than Swedish ones. However, also in the
poisson models the size of the coefficients are small.
Table 4. Censored Poisson regressions, individual vs firm
(1) (2) (3) (4) (5)
indep -0.522*** -0.572*** -0.570*** -0.559*** -0.560*** (0.0125) (0.0208) (0.0211) (0.0214) (0.0213) foreign -0.0295* -0.0877*** -0.0811*** -0.0828*** -0.0839*** (0.0115) (0.0217) (0.0240) (0.0239) (0.0241) indepXforeign 0.0774** 0.0758** 0.0644* 0.0655* (0.0255) (0.0257) (0.0260) (0.0259) urban 0.0121 0.0172
45 Andersson and Tell, “The Structure of Markets for Technology: New Evidence from Swedish Patent Data and Patent Advertisements 1885-1914.” 46 David J. Teece, “Profiting from Technological Innovation: Implications for Integration, Collaboration, Licensing and Public Policy,” Research Policy 15, no. 6 (December 1, 1986): 285–305, https://doi.org/10.1016/0048-7333(86)90027-2. 47 Robert C. Allen, “Collective Invention,” Journal of Economic Behavior & Organization 4, no. 1 (1983): 1–24; Alessandro Nuvolari, “Collective Invention during the British Industrial Revolution: The Case of the Cornish Pumping Engine,” Cambridge Journal of Economics 28, no. 3 (May 1, 2004): 347–63, https://doi.org/10.1093/cje/28.3.347.
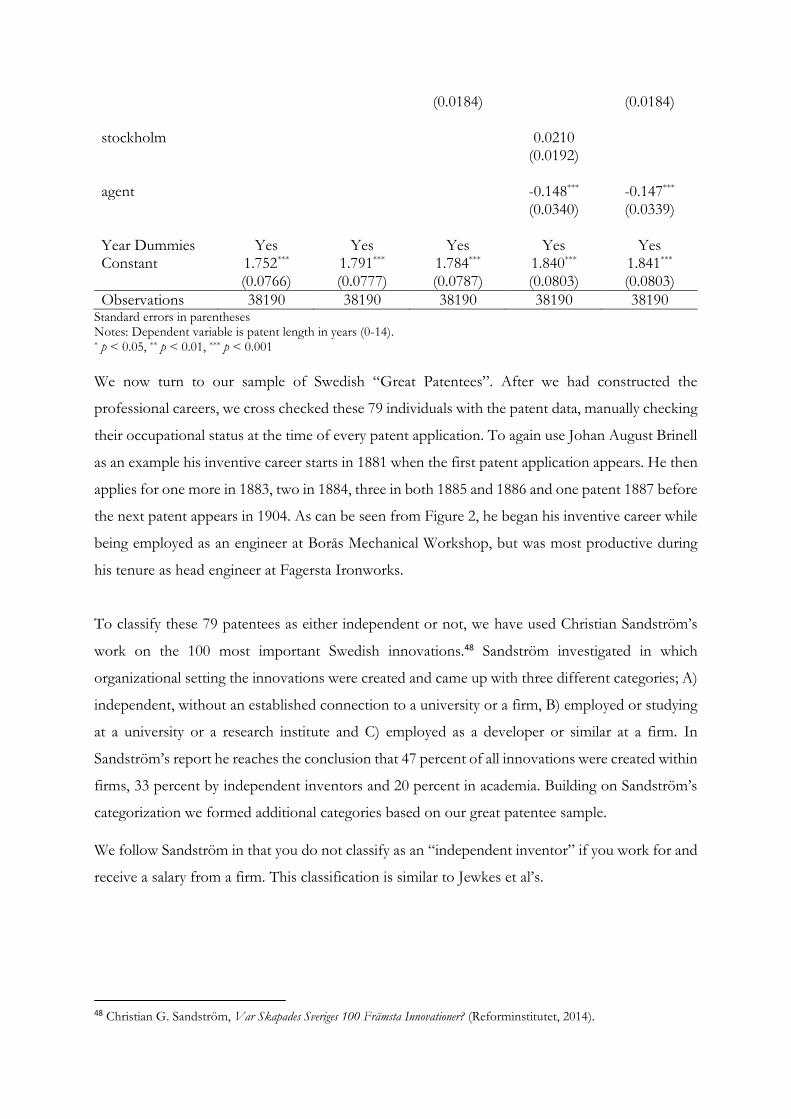
(0.0184) (0.0184) stockholm 0.0210 (0.0192) agent -0.148*** -0.147*** (0.0340) (0.0339) Year Dummies Yes Yes Yes Yes Yes Constant 1.752*** 1.791*** 1.784*** 1.840*** 1.841*** (0.0766) (0.0777) (0.0787) (0.0803) (0.0803)
Observations 38190 38190 38190 38190 38190 Standard errors in parentheses Notes: Dependent variable is patent length in years (0-14). * p < 0.05, ** p < 0.01, *** p < 0.001
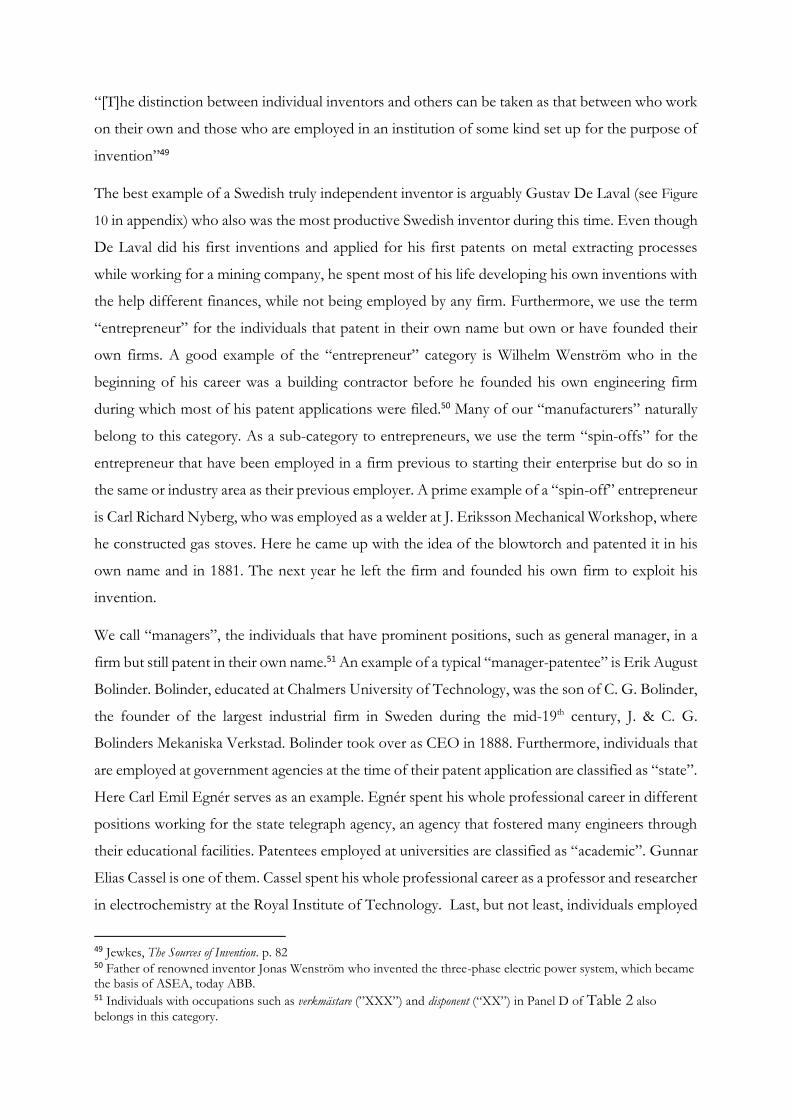
We now turn to our sample of Swedish “Great Patentees”. After we had constructed the
professional careers, we cross checked these 79 individuals with the patent data, manually checking
their occupational status at the time of every patent application. To again use Johan August Brinell
as an example his inventive career starts in 1881 when the first patent application appears. He then
applies for one more in 1883, two in 1884, three in both 1885 and 1886 and one patent 1887 before
the next patent appears in 1904. As can be seen from Figure 2, he began his inventive career while
being employed as an engineer at Borås Mechanical Workshop, but was most productive during
his tenure as head engineer at Fagersta Ironworks.
To classify these 79 patentees as either independent or not, we have used Christian Sandström’s
work on the 100 most important Swedish innovations.48 Sandström investigated in which
organizational setting the innovations were created and came up with three different categories; A)
independent, without an established connection to a university or a firm, B) employed or studying
at a university or a research institute and C) employed as a developer or similar at a firm. In
Sandström’s report he reaches the conclusion that 47 percent of all innovations were created within
firms, 33 percent by independent inventors and 20 percent in academia. Building on Sandström’s
categorization we formed additional categories based on our great patentee sample.
We follow Sandström in that you do not classify as an “independent inventor” if you work for and
receive a salary from a firm. This classification is similar to Jewkes et al’s.
48 Christian G. Sandström, Var Skapades Sveriges 100 Främsta Innovationer? (Reforminstitutet, 2014).
“[T]he distinction between individual inventors and others can be taken as that between who work
on their own and those who are employed in an institution of some kind set up for the purpose of
invention”49
The best example of a Swedish truly independent inventor is arguably Gustav De Laval (see Figure
10 in appendix) who also was the most productive Swedish inventor during this time. Even though
De Laval did his first inventions and applied for his first patents on metal extracting processes
while working for a mining company, he spent most of his life developing his own inventions with
the help different finances, while not being employed by any firm. Furthermore, we use the term
“entrepreneur” for the individuals that patent in their own name but own or have founded their
own firms. A good example of the “entrepreneur” category is Wilhelm Wenström who in the
beginning of his career was a building contractor before he founded his own engineering firm
during which most of his patent applications were filed.50 Many of our “manufacturers” naturally
belong to this category. As a sub-category to entrepreneurs, we use the term “spin-offs” for the
entrepreneur that have been employed in a firm previous to starting their enterprise but do so in
the same or industry area as their previous employer. A prime example of a “spin-off” entrepreneur
is Carl Richard Nyberg, who was employed as a welder at J. Eriksson Mechanical Workshop, where
he constructed gas stoves. Here he came up with the idea of the blowtorch and patented it in his
own name and in 1881. The next year he left the firm and founded his own firm to exploit his
invention.
We call “managers”, the individuals that have prominent positions, such as general manager, in a
firm but still patent in their own name.51 An example of a typical “manager-patentee” is Erik August
Bolinder. Bolinder, educated at Chalmers University of Technology, was the son of C. G. Bolinder,
the founder of the largest industrial firm in Sweden during the mid-19th century, J. & C. G.
Bolinders Mekaniska Verkstad. Bolinder took over as CEO in 1888. Furthermore, individuals that
are employed at government agencies at the time of their patent application are classified as “state”.
Here Carl Emil Egnér serves as an example. Egnér spent his whole professional career in different
positions working for the state telegraph agency, an agency that fostered many engineers through
their educational facilities. Patentees employed at universities are classified as “academic”. Gunnar
Elias Cassel is one of them. Cassel spent his whole professional career as a professor and researcher
in electrochemistry at the Royal Institute of Technology. Last, but not least, individuals employed
49 Jewkes, The Sources of Invention. p. 82 50 Father of renowned inventor Jonas Wenström who invented the three-phase electric power system, which became the basis of ASEA, today ABB. 51 Individuals with occupations such as verkmästare (”XXX”) and disponent (“XX”) in Panel D of Table 2 also
belongs in this category.
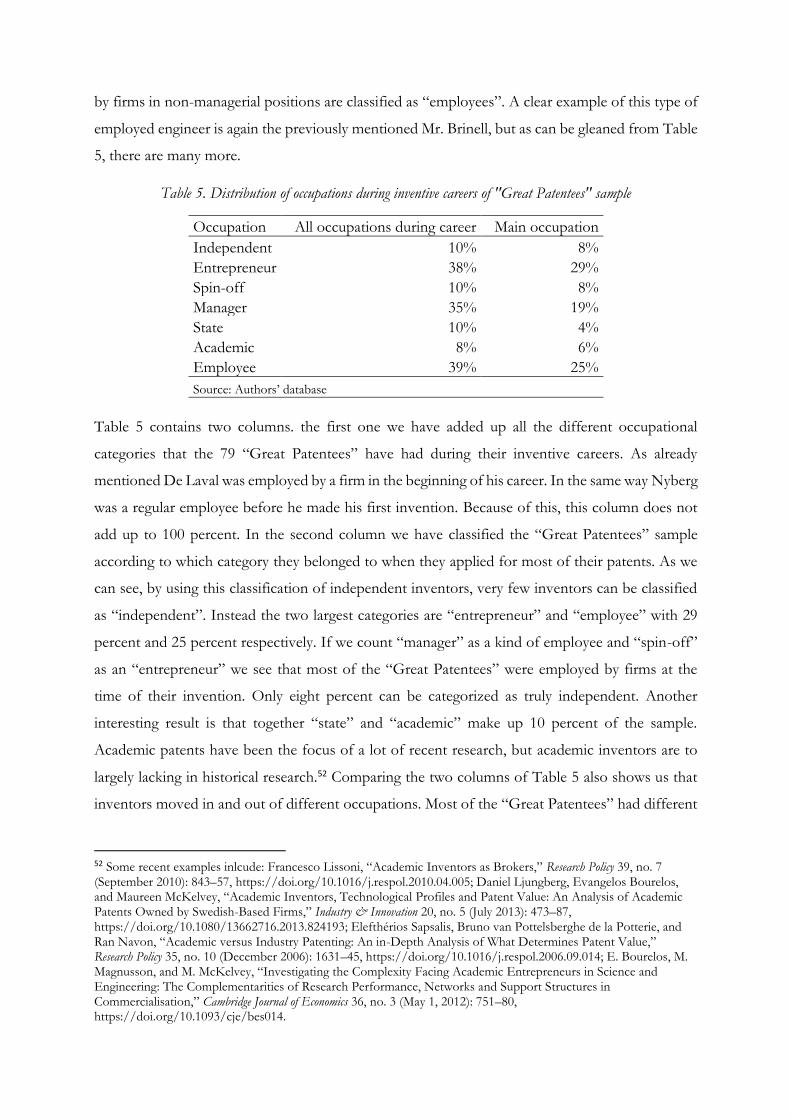
by firms in non-managerial positions are classified as “employees”. A clear example of this type of
employed engineer is again the previously mentioned Mr. Brinell, but as can be gleaned from Table
5, there are many more.
Table 5. Distribution of occupations during inventive careers of "Great Patentees" sample
Occupation All occupations during career Main occupation
Independent 10% 8%
Entrepreneur 38% 29%
Spin-off 10% 8%
Manager 35% 19%
State 10% 4%
Academic 8% 6%
Employee 39% 25%
Source: Authors’ database
Table 5 contains two columns. the first one we have added up all the different occupational
categories that the 79 “Great Patentees” have had during their inventive careers. As already
mentioned De Laval was employed by a firm in the beginning of his career. In the same way Nyberg
was a regular employee before he made his first invention. Because of this, this column does not
add up to 100 percent. In the second column we have classified the “Great Patentees” sample
according to which category they belonged to when they applied for most of their patents. As we
can see, by using this classification of independent inventors, very few inventors can be classified
as “independent”. Instead the two largest categories are “entrepreneur” and “employee” with 29
percent and 25 percent respectively. If we count “manager” as a kind of employee and “spin-off”
as an “entrepreneur” we see that most of the “Great Patentees” were employed by firms at the
time of their invention. Only eight percent can be categorized as truly independent. Another
interesting result is that together “state” and “academic” make up 10 percent of the sample.
Academic patents have been the focus of a lot of recent research, but academic inventors are to
largely lacking in historical research.52 Comparing the two columns of Table 5 also shows us that
inventors moved in and out of different occupations. Most of the “Great Patentees” had different
52 Some recent examples inlcude: Francesco Lissoni, “Academic Inventors as Brokers,” Research Policy 39, no. 7 (September 2010): 843–57, https://doi.org/10.1016/j.respol.2010.04.005; Daniel Ljungberg, Evangelos Bourelos, and Maureen McKelvey, “Academic Inventors, Technological Profiles and Patent Value: An Analysis of Academic Patents Owned by Swedish-Based Firms,” Industry & Innovation 20, no. 5 (July 2013): 473–87, https://doi.org/10.1080/13662716.2013.824193; Elefthérios Sapsalis, Bruno van Pottelsberghe de la Potterie, and Ran Navon, “Academic versus Industry Patenting: An in-Depth Analysis of What Determines Patent Value,” Research Policy 35, no. 10 (December 2006): 1631–45, https://doi.org/10.1016/j.respol.2006.09.014; E. Bourelos, M. Magnusson, and M. McKelvey, “Investigating the Complexity Facing Academic Entrepreneurs in Science and Engineering: The Complementarities of Research Performance, Networks and Support Structures in Commercialisation,” Cambridge Journal of Economics 36, no. 3 (May 1, 2012): 751–80, https://doi.org/10.1093/cje/bes014.
occupations during their career. As can be seen several of them spent some part of their time in
academic or state institutions. Here the Royal Institute of Technology and Telegraph agency stand
out as the most important workplaces. Moreover, almost 40 percent of the sample could be
classified as “entrepreneur”, “manager” or “employee”, sometime of their career. This indicates
that are several examples where individuals became entrepreneurs or managers late in their careers
and that many of them started out as employees.
Connecting this to what we first said in the introduction, we argue that this tells us two things.
First, the classification of inventions as “independent” or firm patents largely gives us a misleading
picture of the organizational setting where inventive activity actually took place. We believe we
have showed that to a larger extent than previous research has showed inventive activity took place
in the connection to firms, by employed engineers or by people in managerial positions.
Furthermore, the importance of state and academic institutions has largely been missing in earlier
research. Considering that people moved in and out of different occupations, the importance of
institutions is even more accentuated. These results indicate, more than before, that resource
dependencies, complementarities, and social interaction are crucial for inventive activity to take
place. In the late 19th century, this setting was the emerging large industrial firms that would become
the managerial capitalism of the early 20th century and the factories owned by individual proprietors
at the time were proprietary capitalism was still more of the norm. The shift from independent to
firm patenting visible in the patent statistics is more likely the result of an conscious decision by
firms to start taking out more patents and a more systematic transfer of employee-inventions to
the firm. In the Swedish case, as can be seen above in Figure 4, as more and more firms were
incorporated and ownership became less concentrated, it made more sense to register the patents
to this juridical entity than to individual persons.
In Table 6 we recall that in Table 2 we identified the occupational groups 0 and 2 as the groups
most firmly associated with firms in our data. Together with what we have shown regarding the
inventive careers of the individuals in our “Great Patentees” sample we now estimate an expanded
censored poisson model where we control for the different HISCO groups for the individuals that
we have been able to code accordingly. The individual/firm dummy is still negative and significant
as in Table 4, but we now see that both individuals that belong to Technical Professionals (i.e.
engineers and architechts) and individuals belonging to the Managerial group are associated with
higher quality patents measured as patent fees paid.
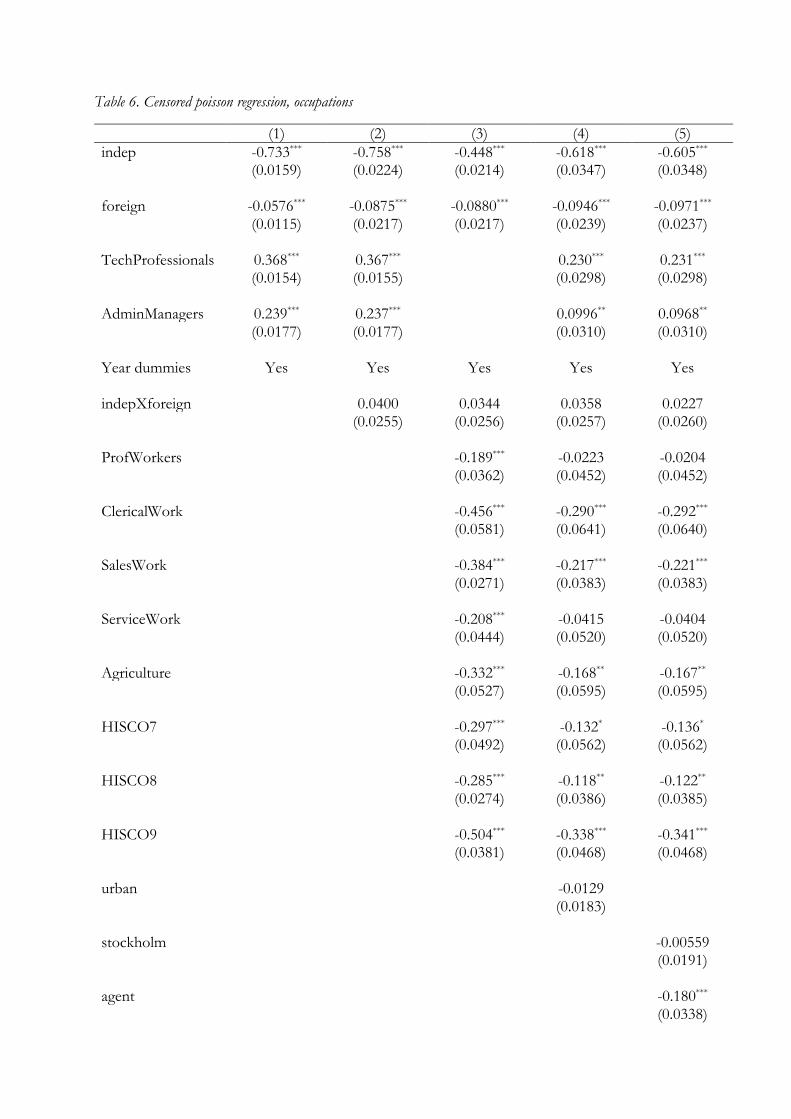
Table 6. Censored poisson regression, occupations
(1) (2) (3) (4) (5)
indep -0.733*** -0.758*** -0.448*** -0.618*** -0.605*** (0.0159) (0.0224) (0.0214) (0.0347) (0.0348) foreign -0.0576*** -0.0875*** -0.0880*** -0.0946*** -0.0971*** (0.0115) (0.0217) (0.0217) (0.0239) (0.0237) TechProfessionals 0.368*** 0.367*** 0.230*** 0.231*** (0.0154) (0.0155) (0.0298) (0.0298) AdminManagers 0.239*** 0.237*** 0.0996** 0.0968** (0.0177) (0.0177) (0.0310) (0.0310) Year dummies Yes Yes Yes Yes Yes indepXforeign 0.0400 0.0344 0.0358 0.0227 (0.0255) (0.0256) (0.0257) (0.0260) ProfWorkers -0.189*** -0.0223 -0.0204 (0.0362) (0.0452) (0.0452) ClericalWork -0.456*** -0.290*** -0.292*** (0.0581) (0.0641) (0.0640) SalesWork -0.384*** -0.217*** -0.221*** (0.0271) (0.0383) (0.0383) ServiceWork -0.208*** -0.0415 -0.0404 (0.0444) (0.0520) (0.0520) Agriculture -0.332*** -0.168** -0.167** (0.0527) (0.0595) (0.0595) HISCO7 -0.297*** -0.132* -0.136* (0.0492) (0.0562) (0.0562) HISCO8 -0.285*** -0.118** -0.122** (0.0274) (0.0386) (0.0385) HISCO9 -0.504*** -0.338*** -0.341*** (0.0381) (0.0468) (0.0468) urban -0.0129 (0.0183) stockholm -0.00559 (0.0191) agent -0.180*** (0.0338)
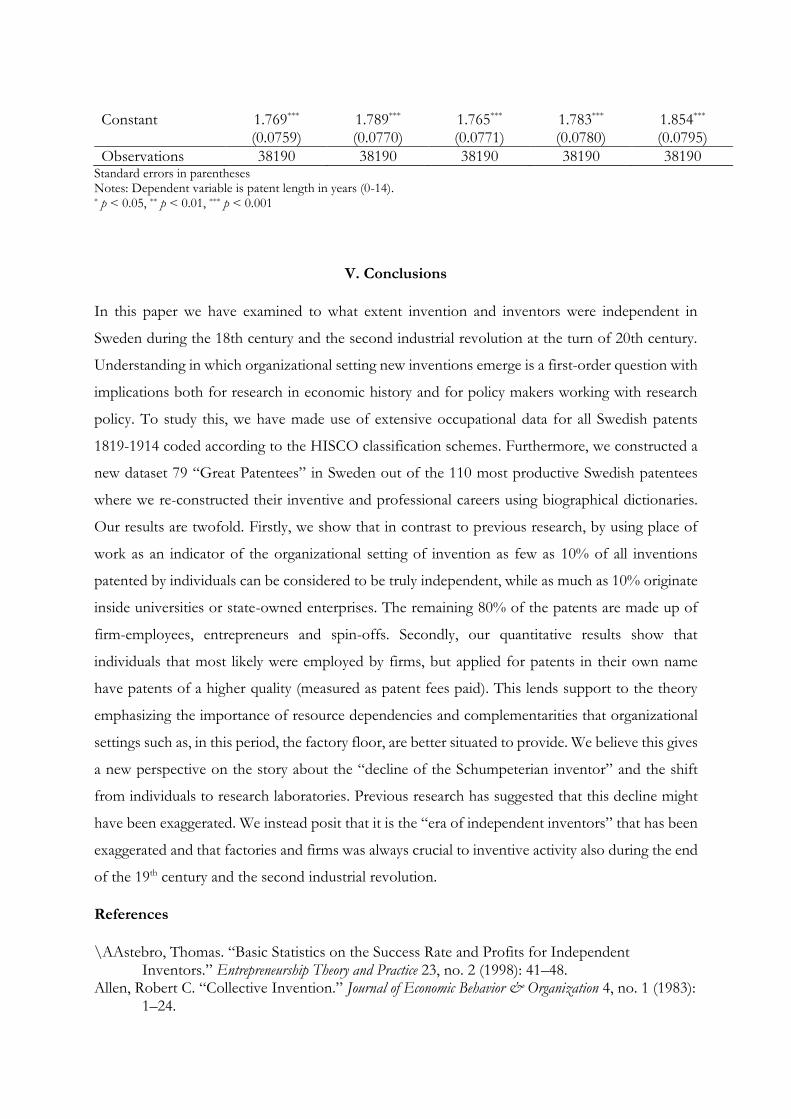
Constant 1.769*** 1.789*** 1.765*** 1.783*** 1.854*** (0.0759) (0.0770) (0.0771) (0.0780) (0.0795)
Observations 38190 38190 38190 38190 38190 Standard errors in parentheses Notes: Dependent variable is patent length in years (0-14). * p < 0.05, ** p < 0.01, *** p < 0.001
V. Conclusions
In this paper we have examined to what extent invention and inventors were independent in
Sweden during the 18th century and the second industrial revolution at the turn of 20th century.
Understanding in which organizational setting new inventions emerge is a first-order question with
implications both for research in economic history and for policy makers working with research
policy. To study this, we have made use of extensive occupational data for all Swedish patents
1819-1914 coded according to the HISCO classification schemes. Furthermore, we constructed a
new dataset 79 “Great Patentees” in Sweden out of the 110 most productive Swedish patentees
where we re-constructed their inventive and professional careers using biographical dictionaries.
Our results are twofold. Firstly, we show that in contrast to previous research, by using place of
work as an indicator of the organizational setting of invention as few as 10% of all inventions
patented by individuals can be considered to be truly independent, while as much as 10% originate
inside universities or state-owned enterprises. The remaining 80% of the patents are made up of
firm-employees, entrepreneurs and spin-offs. Secondly, our quantitative results show that
individuals that most likely were employed by firms, but applied for patents in their own name
have patents of a higher quality (measured as patent fees paid). This lends support to the theory
emphasizing the importance of resource dependencies and complementarities that organizational
settings such as, in this period, the factory floor, are better situated to provide. We believe this gives
a new perspective on the story about the “decline of the Schumpeterian inventor” and the shift
from individuals to research laboratories. Previous research has suggested that this decline might
have been exaggerated. We instead posit that it is the “era of independent inventors” that has been
exaggerated and that factories and firms was always crucial to inventive activity also during the end
of the 19th century and the second industrial revolution.
References
\AAstebro, Thomas. “Basic Statistics on the Success Rate and Profits for Independent Inventors.” Entrepreneurship Theory and Practice 23, no. 2 (1998): 41–48.
Allen, Robert C. “Collective Invention.” Journal of Economic Behavior & Organization 4, no. 1 (1983): 1–24.
Althin, Torsten. Gustaf De Laval-1845-1913: De Höga Hastigheternas Man. AB de Lavals Ångturbin, 1943.
Andersson, David E. The Emergence of Markets for Technology: Patent Transfers and Patenting in Sweden, 1819–1914. Doctoral Thesis 179. Uppsala: Department of Business Studies, 2016.
Andersson, David E., and Fredrik Tell. “From Fighting Monopolies to Promoting Industry: Patent Laws and Innovation in Sweden 1819-1914.” Economic History Yearbook, forthcoming.
———. “The Structure of Markets for Technology: New Evidence from Swedish Patent Data and Patent Advertisements 1885-1914.” Working Paper, 2015.
Andersson, David, Mounir Karadja, and Erik Prawitz. “Mass Migration, Cheap Labor, and Innovation,” 2016.
Avelius, Nils. Patentverket Från Gamla Tider till Nu: (1885-1967/68). Stockholm: Patentverkets tjänstemannasällskap, 1969.
Basberg, Bjørn L. “Amateur or Professional? A New Look at Nineteenth-Century Patentees in Norway.” Scandinavian Economic History Review 63, no. 1 (January 2, 2015): 24–44. https://doi.org/10.1080/03585522.2014.948047.
Bourelos, E., M. Magnusson, and M. McKelvey. “Investigating the Complexity Facing Academic Entrepreneurs in Science and Engineering: The Complementarities of Research Performance, Networks and Support Structures in Commercialisation.” Cambridge Journal of Economics 36, no. 3 (May 1, 2012): 751–80. https://doi.org/10.1093/cje/bes014.
Burhop, Carsten. “The Transfer of Patents in Imperial Germany.” The Journal of Economic History 70, no. 4 (2010): 921–939.
Chandler, Alfred D. Scale and Scope: The Dynamics of Industrial Enterprise. Cambridge, Mass.: Harvard University, 1990.
Hughes, Thomas P. American Genesis: A Century of Invention and Technological Enthusiasm, 1870-1970. University of Chicago Press, 2004.
———. “The Era of Independent Inventors.” In Science in Reflection, 151–168. Springer, 1988. Jaffe, Adam B., and Manuel Trajtenberg. Patents, Citations, and Innovations: A Window on the
Knowledge Economy. MIT Press, 2002. Jewkes, John. The Sources of Invention. Springer, 1969. Kenneth L. Sokoloff, and B. Zorina Khan. “The Democratization of Invention During Early
Industrialization: Evidence from the United States, 1790-1846.” The Journal of Economic History 50, no. 2 (1990): 363–78.
Khan, B. Zorina. The Democratization of Invention: Patents and Copyrights in American Economic Development, 1790-1920. Cambridge University Press, 2005.
Lamoreaux, Naomi R., and Kenneth L. Sokoloff. “Market Trade in Patents and the Rise of a Class of Specialized Inventors in the 19th-Century United States.” American Economic Review 91, no. 2 (May 2001): 39–44. https://doi.org/10.1257/aer.91.2.39.
Lazonick, William. Business Organization and the Myth of the Market Economy. Cambridge University Press, 1993.
Lissoni, Francesco. “Academic Inventors as Brokers.” Research Policy 39, no. 7 (September 2010): 843–57. https://doi.org/10.1016/j.respol.2010.04.005.
Ljungberg, Daniel, Evangelos Bourelos, and Maureen McKelvey. “Academic Inventors, Technological Profiles and Patent Value: An Analysis of Academic Patents Owned by Swedish-Based Firms.” Industry & Innovation 20, no. 5 (July 2013): 473–87. https://doi.org/10.1080/13662716.2013.824193.
Nicholas, Tom. “Independent Invention during the Rise of the Corporate Economy in Britain and Japan.” The Economic History Review 64, no. 3 (2011): 995–1023.
———. “Spatial Diversity in Invention: Evidence from the Early R&D Labs.” Journal of Economic Geography 9, no. 1 (January 1, 2009): 1–31. https://doi.org/10.1093/jeg/lbn042.
———. “The Role of Independent Invention in U.S. Technological Development, 1880–1930.” The Journal of Economic History 70, no. 1 (2010): 57–82.
Nuvolari, Alessandro. “Collective Invention during the British Industrial Revolution: The Case of the Cornish Pumping Engine.” Cambridge Journal of Economics 28, no. 3 (May 1, 2004): 347–63. https://doi.org/10.1093/cje/28.3.347.
Nuvolari, Alessandro, and Michelangelo Vasta. “Independent Invention in Italy during the Liberal Age, 1861–1913.” The Economic History Review 68, no. 3 (2015): 858–886.
Sandström, Christian G. Var Skapades Sveriges 100 Främsta Innovationer? Reforminstitutet, 2014. Sapsalis, Elefthérios, Bruno van Pottelsberghe de la Potterie, and Ran Navon. “Academic versus
Industry Patenting: An in-Depth Analysis of What Determines Patent Value.” Research Policy 35, no. 10 (December 2006): 1631–45. https://doi.org/10.1016/j.respol.2006.09.014.
Schankerman, Mark, and Ariel Pakes. “Estimates of the Value of Patent Rights in European Countries during the Post-1950 Period.” The Economic Journal 96 (1986): 1052–76.
Singh, Jasjit, and Lee Fleming. “Lone Inventors as Sources of Breakthroughs: Myth or Reality?” Management Science 56, no. 1 (October 16, 2009): 41–56. https://doi.org/10.1287/mnsc.1090.1072.
Svenska Akademiens Ordlista. 1st ed. Stockholm: Svenska Akademien, 1874. Teece, David J. “Profiting from Technological Innovation: Implications for Integration,
Collaboration, Licensing and Public Policy.” Research Policy 15, no. 6 (December 1, 1986): 285–305. https://doi.org/10.1016/0048-7333(86)90027-2.
Van Leeuwen, Marco H. D., Ineke Maas, and Andrew Miles. “Creating a Historical International Standard Classification of Occupations An Exercise in Multinational Interdisciplinary Cooperation.” Historical Methods: A Journal of Quantitative and Interdisciplinary History 37, no. 4 (September 2004): 186–97. https://doi.org/10.3200/HMTS.37.4.186-197.
———. HISCO Historical International Standard Classification of Occupations. Leuven: Leuven Univ Press, 2002.
APPENDIX
FIGURES
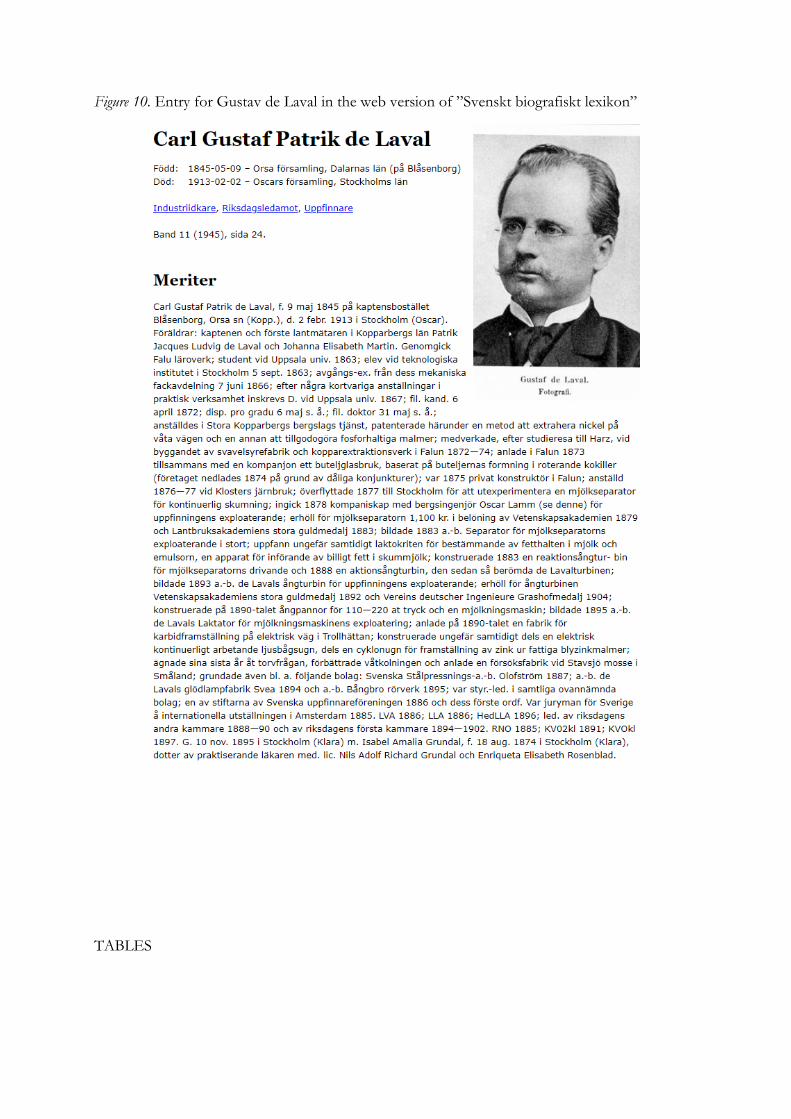
Figure 10. Entry for Gustav de Laval in the web version of ”Svenskt biografiskt lexikon”
TABLES
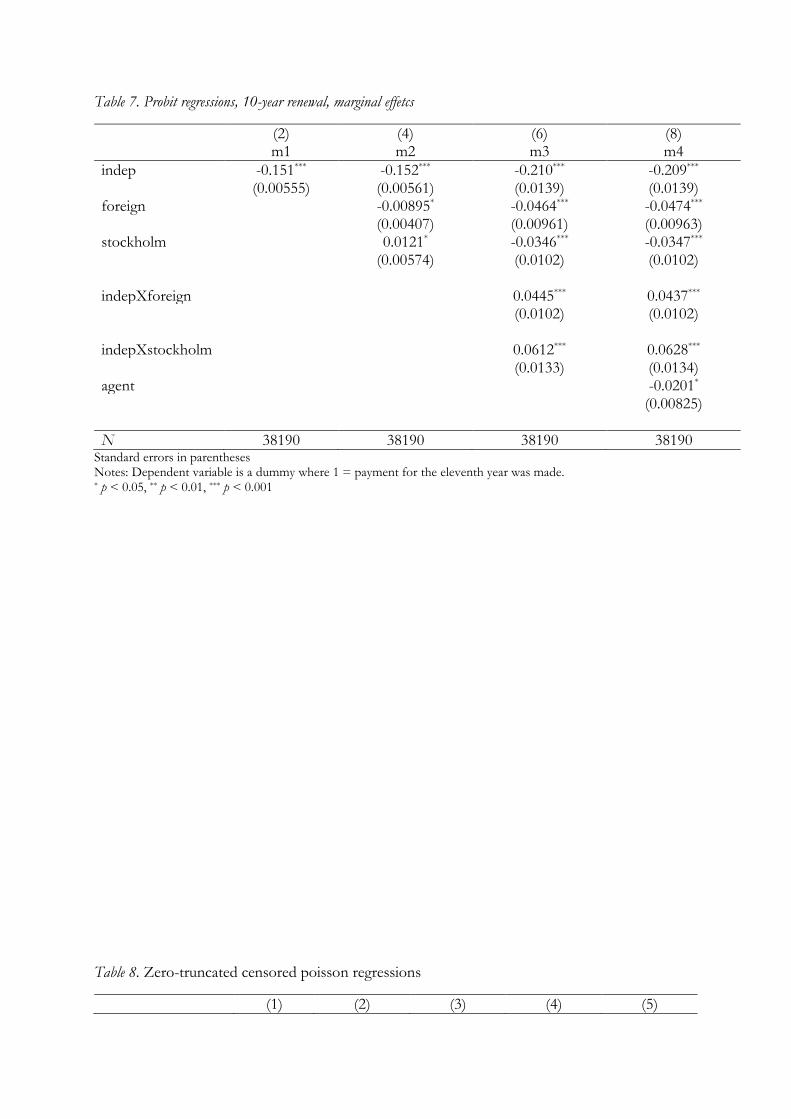
Table 7. Probit regressions, 10-year renewal, marginal effetcs
(2) (4) (6) (8) m1 m2 m3 m4
indep -0.151*** -0.152*** -0.210*** -0.209*** (0.00555) (0.00561) (0.0139) (0.0139) foreign -0.00895* -0.0464*** -0.0474*** (0.00407) (0.00961) (0.00963) stockholm 0.0121* -0.0346*** -0.0347*** (0.00574) (0.0102) (0.0102) indepXforeign 0.0445*** 0.0437*** (0.0102) (0.0102) indepXstockholm 0.0612*** 0.0628*** (0.0133) (0.0134) agent -0.0201* (0.00825)
N 38190 38190 38190 38190 Standard errors in parentheses Notes: Dependent variable is a dummy where 1 = payment for the eleventh year was made. * p < 0.05, ** p < 0.01, *** p < 0.001
Table 8. Zero-truncated censored poisson regressions
(1) (2) (3) (4) (5)
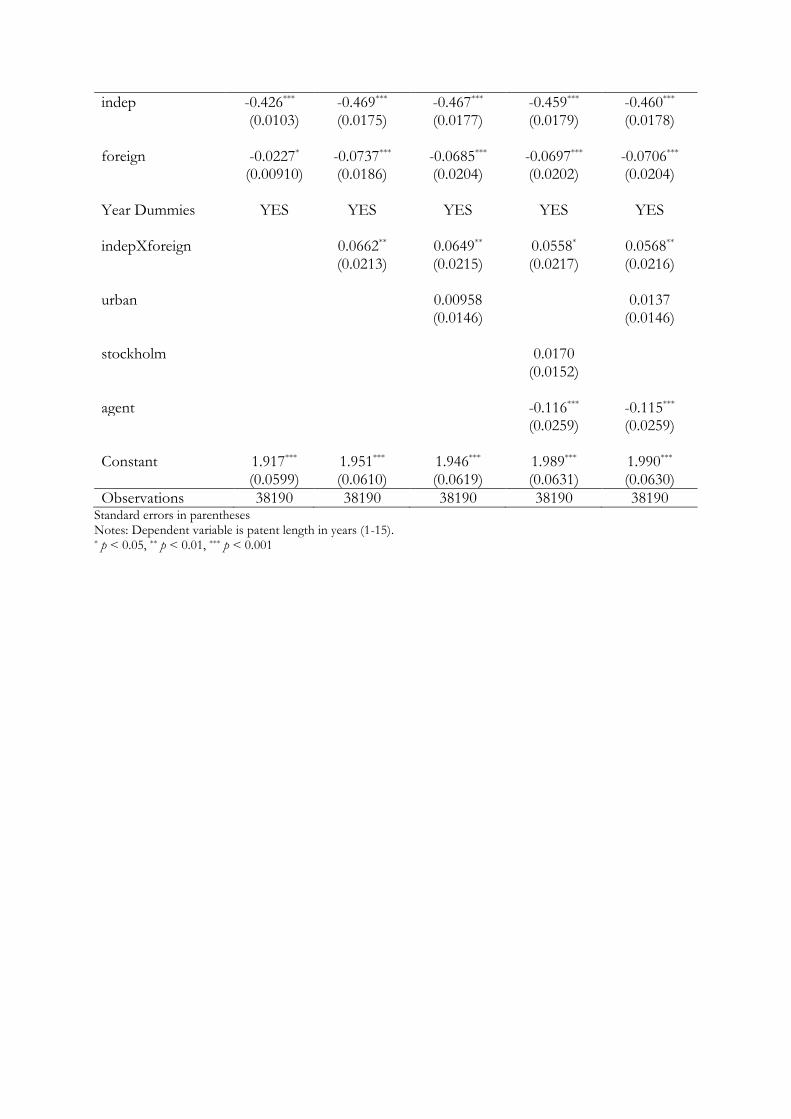
indep -0.426*** -0.469*** -0.467*** -0.459*** -0.460*** (0.0103) (0.0175) (0.0177) (0.0179) (0.0178) foreign -0.0227* -0.0737*** -0.0685*** -0.0697*** -0.0706*** (0.00910) (0.0186) (0.0204) (0.0202) (0.0204) Year Dummies YES YES YES YES YES indepXforeign 0.0662** 0.0649** 0.0558* 0.0568** (0.0213) (0.0215) (0.0217) (0.0216) urban 0.00958 0.0137 (0.0146) (0.0146) stockholm 0.0170 (0.0152) agent -0.116*** -0.115*** (0.0259) (0.0259) Constant 1.917*** 1.951*** 1.946*** 1.989*** 1.990*** (0.0599) (0.0610) (0.0619) (0.0631) (0.0630)
Observations 38190 38190 38190 38190 38190 Standard errors in parentheses Notes: Dependent variable is patent length in years (1-15). * p < 0.05, ** p < 0.01, *** p < 0.001