Embed Size (px)
Citation preview
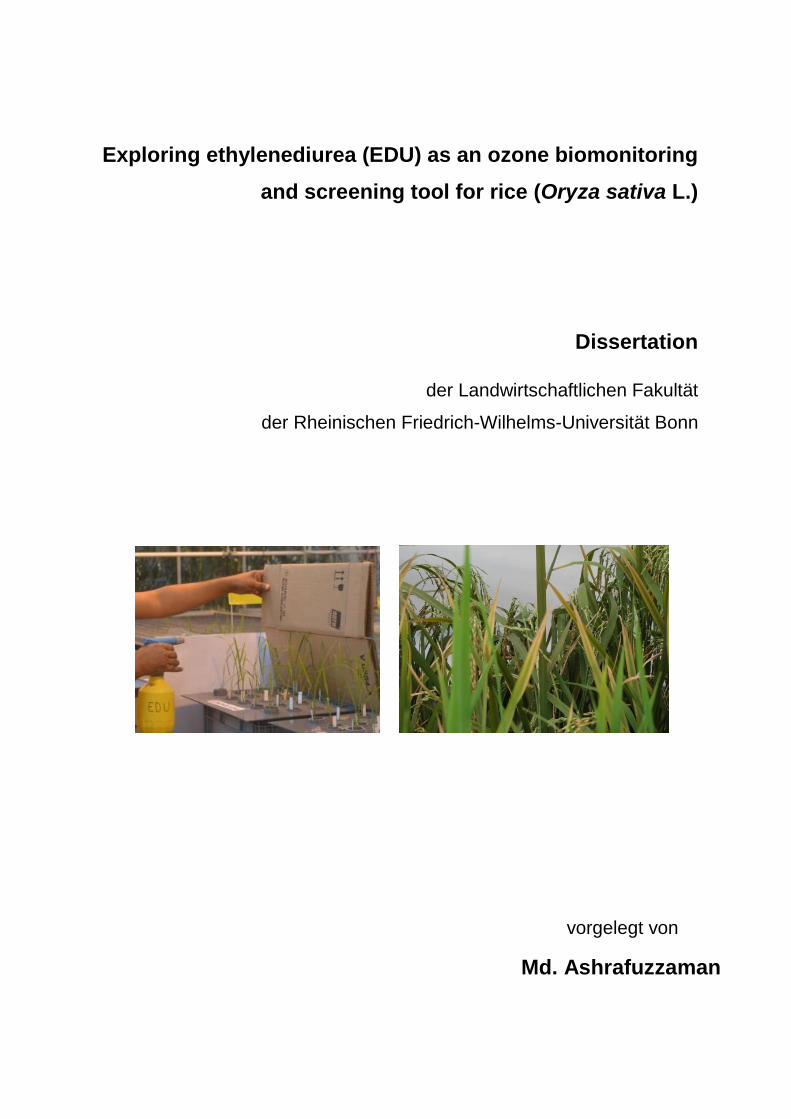
Exploring ethylenediurea (EDU) as an ozone biomonitoring
and screening tool for rice (Oryza sativa L.)
Dissertation
der Landwirtschaftlichen Fakultät
der Rheinischen Friedrich-Wilhelms-Universität Bonn
vorgelegt von
Md. Ashrafuzzaman
Institut für Nutzpflanzenwissenschaften und Ressourcenschutz
Exploring ethylenediurea (EDU) as an ozone biomonitoring
and screening tool for rice (Oryza sativa L.)
Dissertation
zur
Erlangung des Grades
Doktor der Agrarwissenschaften
(Dr. agr.)
der Landwirtschaftlichen Fakultät
der Rheinischen Friedrich-Wilhelms-Universität Bonn
vorgelegt von
Md. Ashrafuzzaman
aus Chuadanga, Bangladesh
Bonn, 2018
Printed and/or published with the support of the German Academic Exchange Service (DAAD)
Referent: Prof. Dr. Michael Frei
Koreferent: Prof. Dr. Frank Hochholdinger
Fachnahes Mitglied: PD Dr. Ali Ahmad Naz
Vorsitzender: Prof. Dr. Gabriel Schaaf
Tag der mündlichen Prüfung: 29.11.2018
Angefertigt mit Genehmigung der Landwirtschaftlichen Fakultät der Universität Bonn
Contents
1 Summary ............................................................................................................... 1
1.1 Summary ........................................................................................................ 1
1.2 Zusammenfassung ............................................................................................. 2
2 Introduction ............................................................................................................ 3
2.1 Tropospheric ozone: a major threat to global crop production ............................ 3
2.2 Emergence and distribution of tropospheric ozone ............................................. 4
2.3 Rice: staple food crop of half of the global population ........................................ 6
2.4 Tropospheric ozone: major constraint of Asian rice production .......................... 8
2.5 Ozone impacts evaluation systems .................................................................. 10
2.6 Aims of this study .............................................................................................. 14
3 Results ................................................................................................................. 15
3.1 Confounding effects and differential responses of EDU ................................... 15
3.1.1 EDU effects on plants with and without ozone stress .................................... 15
3.1.2 Differential responses towards EDU application ............................................ 16
3.2 Protection mechanisms (mode of action) of EDU against ozone phytotoxicity . 17
3.2.1 Nitrogen fertilization and constitutive activity of EDU ..................................... 17
3.2.3 Elucidation of EDU mediated indirect protection ............................................ 19
3.2.4 EDU fate on leaf surfaces .............................................................................. 19
3.2.5 Investigation of EDU specificity ...................................................................... 20
4 Discussion ........................................................................................................... 21
4.1 Hypothesis 1: EDU does not have any constitutive effects on crops while
mitigating phytotoxic effects of ozone ........................................................................ 21
4.2 Hypothesis 2: EDU mediated protection is regulated by surface protection
rather than direct effects on plant physiology ............................................................ 23
4.3 Hypothesis 3: EDU does not mitigate the effect of stresses other than ozone . 25
4.4 Lesson for future EDU research ....................................................................... 26
5 References .......................................................................................................... 27
6 Publications ......................................................................................................... 39
6.1 Ashrafuzzaman, M., Lubna, F. A., Holtkamp, F., Manning, W. J., Kraska, T., &
Frei, M. (2017). Diagnosing ozone stress and differential tolerance in rice (Oryza
sativa L.) with ethylenediurea (EDU). Environmental Pollution, 230, 339–350. ......... 40
6.2 Ashrafuzzaman M., Haque Z., Ali B., Mathew B., Yu P., Hochholdinger F., …
Frei M. (2018) Ethylenediurea (EDU) mitigates the negative effects of ozone in rice:
insights into its mode of action. Plant, Cell & Environment. 1-17. .............................. 54
6.3 Publications unrelated to this thesis .................................................................. 82
6.4 Conference participation ................................................................................... 82
6.5 Awards .............................................................................................................. 82
7 Curriculum vitae ................................................................................................... 83
8 Acknowledgment ................................................................................................. 84
Summary
1
1 Summary
1.1 Summary
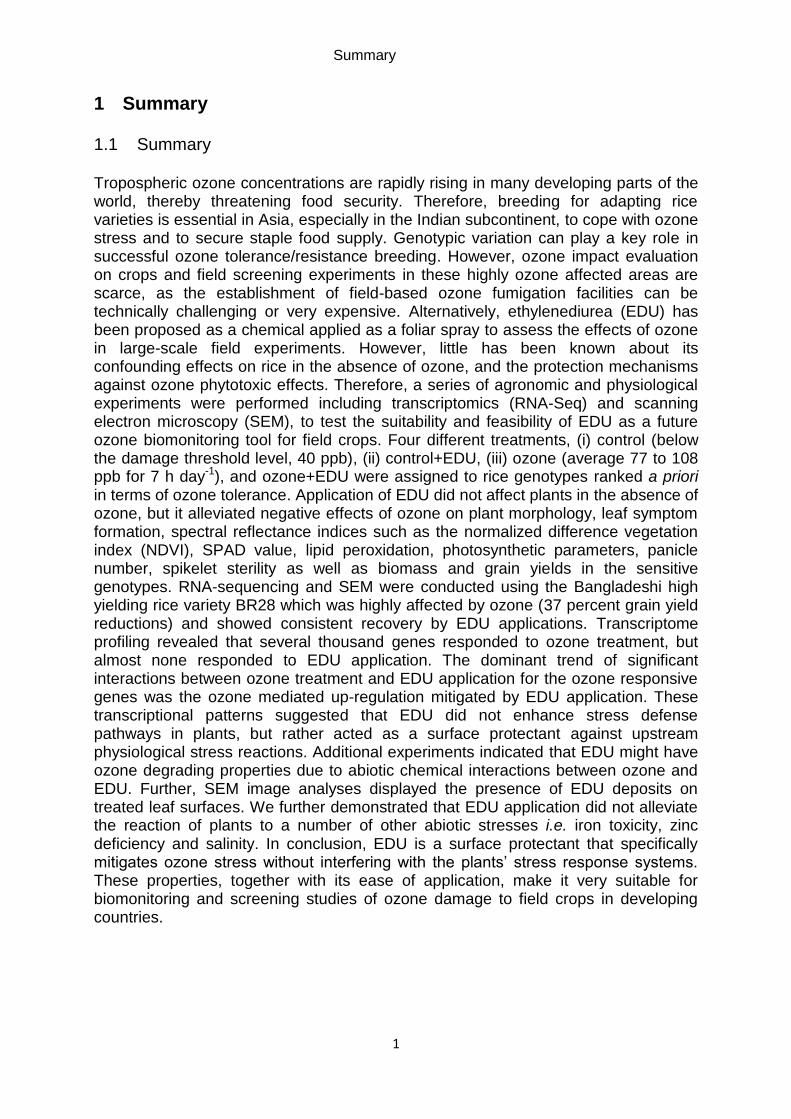
Tropospheric ozone concentrations are rapidly rising in many developing parts of the world, thereby threatening food security. Therefore, breeding for adapting rice varieties is essential in Asia, especially in the Indian subcontinent, to cope with ozone stress and to secure staple food supply. Genotypic variation can play a key role in successful ozone tolerance/resistance breeding. However, ozone impact evaluation on crops and field screening experiments in these highly ozone affected areas are scarce, as the establishment of field-based ozone fumigation facilities can be technically challenging or very expensive. Alternatively, ethylenediurea (EDU) has been proposed as a chemical applied as a foliar spray to assess the effects of ozone in large-scale field experiments. However, little has been known about its confounding effects on rice in the absence of ozone, and the protection mechanisms against ozone phytotoxic effects. Therefore, a series of agronomic and physiological experiments were performed including transcriptomics (RNA-Seq) and scanning electron microscopy (SEM), to test the suitability and feasibility of EDU as a future ozone biomonitoring tool for field crops. Four different treatments, (i) control (below the damage threshold level, 40 ppb), (ii) control+EDU, (iii) ozone (average 77 to 108 ppb for 7 h day-1), and ozone+EDU were assigned to rice genotypes ranked a priori in terms of ozone tolerance. Application of EDU did not affect plants in the absence of ozone, but it alleviated negative effects of ozone on plant morphology, leaf symptom formation, spectral reflectance indices such as the normalized difference vegetation index (NDVI), SPAD value, lipid peroxidation, photosynthetic parameters, panicle number, spikelet sterility as well as biomass and grain yields in the sensitive genotypes. RNA-sequencing and SEM were conducted using the Bangladeshi high yielding rice variety BR28 which was highly affected by ozone (37 percent grain yield reductions) and showed consistent recovery by EDU applications. Transcriptome profiling revealed that several thousand genes responded to ozone treatment, but almost none responded to EDU application. The dominant trend of significant interactions between ozone treatment and EDU application for the ozone responsive genes was the ozone mediated up-regulation mitigated by EDU application. These transcriptional patterns suggested that EDU did not enhance stress defense pathways in plants, but rather acted as a surface protectant against upstream physiological stress reactions. Additional experiments indicated that EDU might have ozone degrading properties due to abiotic chemical interactions between ozone and EDU. Further, SEM image analyses displayed the presence of EDU deposits on treated leaf surfaces. We further demonstrated that EDU application did not alleviate the reaction of plants to a number of other abiotic stresses i.e. iron toxicity, zinc deficiency and salinity. In conclusion, EDU is a surface protectant that specifically mitigates ozone stress without interfering with the plants’ stress response systems. These properties, together with its ease of application, make it very suitable for biomonitoring and screening studies of ozone damage to field crops in developing countries.
Summary
2
1.2 Zusammenfassung
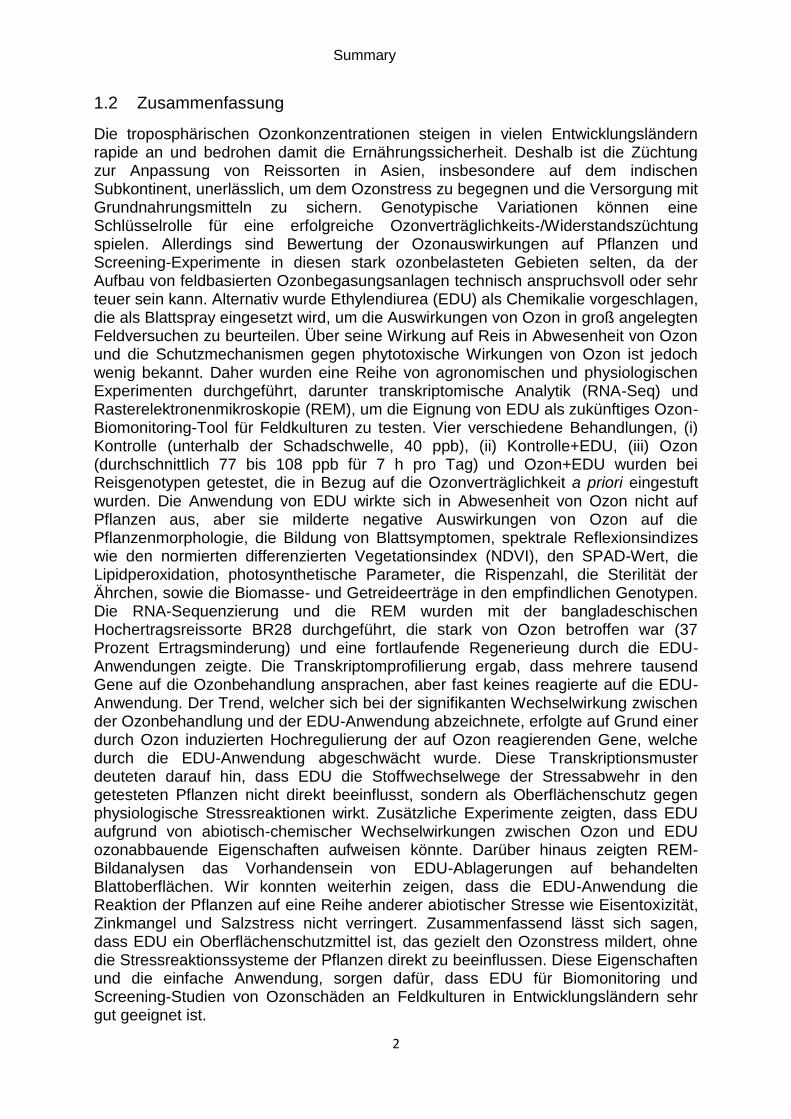
Die troposphärischen Ozonkonzentrationen steigen in vielen Entwicklungsländern rapide an und bedrohen damit die Ernährungssicherheit. Deshalb ist die Züchtung zur Anpassung von Reissorten in Asien, insbesondere auf dem indischen Subkontinent, unerlässlich, um dem Ozonstress zu begegnen und die Versorgung mit Grundnahrungsmitteln zu sichern. Genotypische Variationen können eine Schlüsselrolle für eine erfolgreiche Ozonverträglichkeits-/Widerstandszüchtung spielen. Allerdings sind Bewertung der Ozonauswirkungen auf Pflanzen und Screening-Experimente in diesen stark ozonbelasteten Gebieten selten, da der Aufbau von feldbasierten Ozonbegasungsanlagen technisch anspruchsvoll oder sehr teuer sein kann. Alternativ wurde Ethylendiurea (EDU) als Chemikalie vorgeschlagen, die als Blattspray eingesetzt wird, um die Auswirkungen von Ozon in groß angelegten Feldversuchen zu beurteilen. Über seine Wirkung auf Reis in Abwesenheit von Ozon und die Schutzmechanismen gegen phytotoxische Wirkungen von Ozon ist jedoch wenig bekannt. Daher wurden eine Reihe von agronomischen und physiologischen Experimenten durchgeführt, darunter transkriptomische Analytik (RNA-Seq) und Rasterelektronenmikroskopie (REM), um die Eignung von EDU als zukünftiges Ozon-Biomonitoring-Tool für Feldkulturen zu testen. Vier verschiedene Behandlungen, (i) Kontrolle (unterhalb der Schadschwelle, 40 ppb), (ii) Kontrolle+EDU, (iii) Ozon (durchschnittlich 77 bis 108 ppb für 7 h pro Tag) und Ozon+EDU wurden bei Reisgenotypen getestet, die in Bezug auf die Ozonverträglichkeit a priori eingestuft wurden. Die Anwendung von EDU wirkte sich in Abwesenheit von Ozon nicht auf Pflanzen aus, aber sie milderte negative Auswirkungen von Ozon auf die Pflanzenmorphologie, die Bildung von Blattsymptomen, spektrale Reflexionsindizes wie den normierten differenzierten Vegetationsindex (NDVI), den SPAD-Wert, die Lipidperoxidation, photosynthetische Parameter, die Rispenzahl, die Sterilität der Ährchen, sowie die Biomasse- und Getreideerträge in den empfindlichen Genotypen. Die RNA-Sequenzierung und die REM wurden mit der bangladeschischen Hochertragsreissorte BR28 durchgeführt, die stark von Ozon betroffen war (37 Prozent Ertragsminderung) und eine fortlaufende Regenerieung durch die EDU-Anwendungen zeigte. Die Transkriptomprofilierung ergab, dass mehrere tausend Gene auf die Ozonbehandlung ansprachen, aber fast keines reagierte auf die EDU-Anwendung. Der Trend, welcher sich bei der signifikanten Wechselwirkung zwischen der Ozonbehandlung und der EDU-Anwendung abzeichnete, erfolgte auf Grund einer durch Ozon induzierten Hochregulierung der auf Ozon reagierenden Gene, welche durch die EDU-Anwendung abgeschwächt wurde. Diese Transkriptionsmuster deuteten darauf hin, dass EDU die Stoffwechselwege der Stressabwehr in den getesteten Pflanzen nicht direkt beeinflusst, sondern als Oberflächenschutz gegen physiologische Stressreaktionen wirkt. Zusätzliche Experimente zeigten, dass EDU aufgrund von abiotisch-chemischer Wechselwirkungen zwischen Ozon und EDU ozonabbauende Eigenschaften aufweisen könnte. Darüber hinaus zeigten REM-Bildanalysen das Vorhandensein von EDU-Ablagerungen auf behandelten Blattoberflächen. Wir konnten weiterhin zeigen, dass die EDU-Anwendung die Reaktion der Pflanzen auf eine Reihe anderer abiotischer Stresse wie Eisentoxizität, Zinkmangel und Salzstress nicht verringert. Zusammenfassend lässt sich sagen, dass EDU ein Oberflächenschutzmittel ist, das gezielt den Ozonstress mildert, ohne die Stressreaktionssysteme der Pflanzen direkt zu beeinflussen. Diese Eigenschaften und die einfache Anwendung, sorgen dafür, dass EDU für Biomonitoring und Screening-Studien von Ozonschäden an Feldkulturen in Entwicklungsländern sehr gut geeignet ist.
Introduction
3
2 Introduction
2.1 Tropospheric ozone: a major threat to global crop production
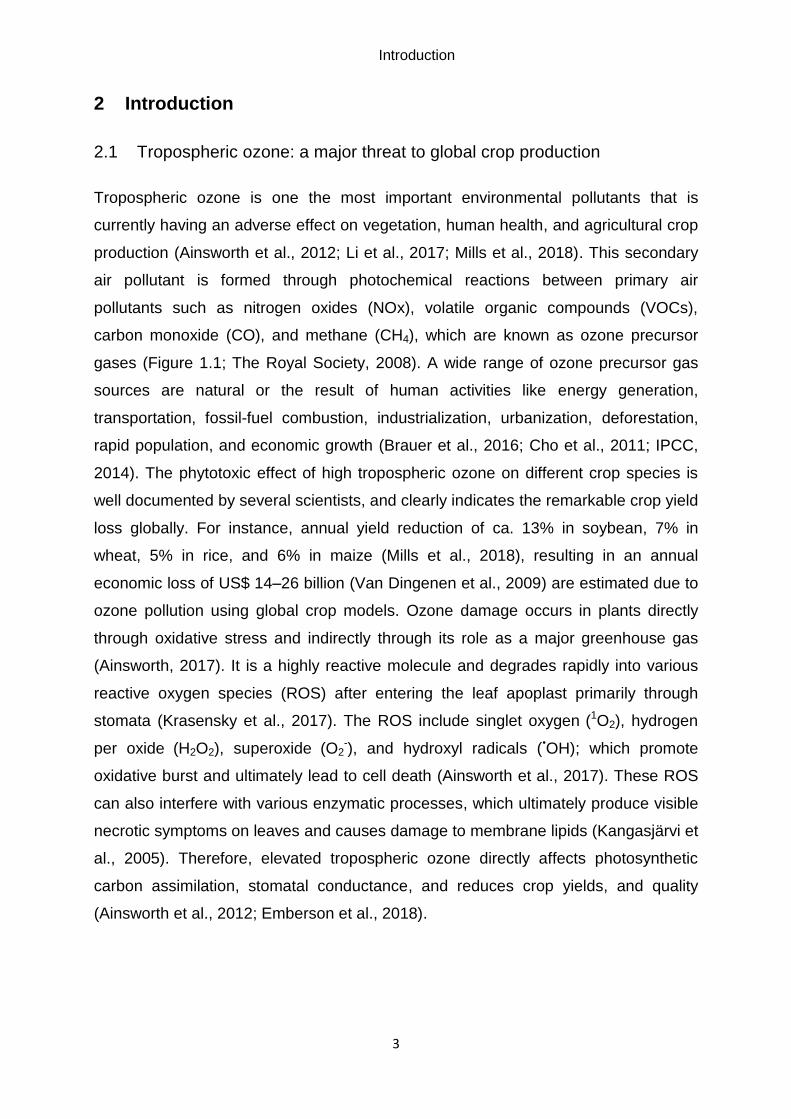
Tropospheric ozone is one the most important environmental pollutants that is
currently having an adverse effect on vegetation, human health, and agricultural crop
production (Ainsworth et al., 2012; Li et al., 2017; Mills et al., 2018). This secondary
air pollutant is formed through photochemical reactions between primary air
pollutants such as nitrogen oxides (NOx), volatile organic compounds (VOCs),
carbon monoxide (CO), and methane (CH4), which are known as ozone precursor
gases (Figure 1.1; The Royal Society, 2008). A wide range of ozone precursor gas
sources are natural or the result of human activities like energy generation,
transportation, fossil-fuel combustion, industrialization, urbanization, deforestation,
rapid population, and economic growth (Brauer et al., 2016; Cho et al., 2011; IPCC,
2014). The phytotoxic effect of high tropospheric ozone on different crop species is
well documented by several scientists, and clearly indicates the remarkable crop yield
loss globally. For instance, annual yield reduction of ca. 13% in soybean, 7% in
wheat, 5% in rice, and 6% in maize (Mills et al., 2018), resulting in an annual
economic loss of US$ 14–26 billion (Van Dingenen et al., 2009) are estimated due to
ozone pollution using global crop models. Ozone damage occurs in plants directly
through oxidative stress and indirectly through its role as a major greenhouse gas
(Ainsworth, 2017). It is a highly reactive molecule and degrades rapidly into various
reactive oxygen species (ROS) after entering the leaf apoplast primarily through
stomata (Krasensky et al., 2017). The ROS include singlet oxygen (1O2), hydrogen
per oxide (H2O2), superoxide (O2-), and hydroxyl radicals (•OH); which promote
oxidative burst and ultimately lead to cell death (Ainsworth et al., 2017). These ROS
can also interfere with various enzymatic processes, which ultimately produce visible
necrotic symptoms on leaves and causes damage to membrane lipids (Kangasjärvi et
al., 2005). Therefore, elevated tropospheric ozone directly affects photosynthetic
carbon assimilation, stomatal conductance, and reduces crop yields, and quality
(Ainsworth et al., 2012; Emberson et al., 2018).
Introduction
4
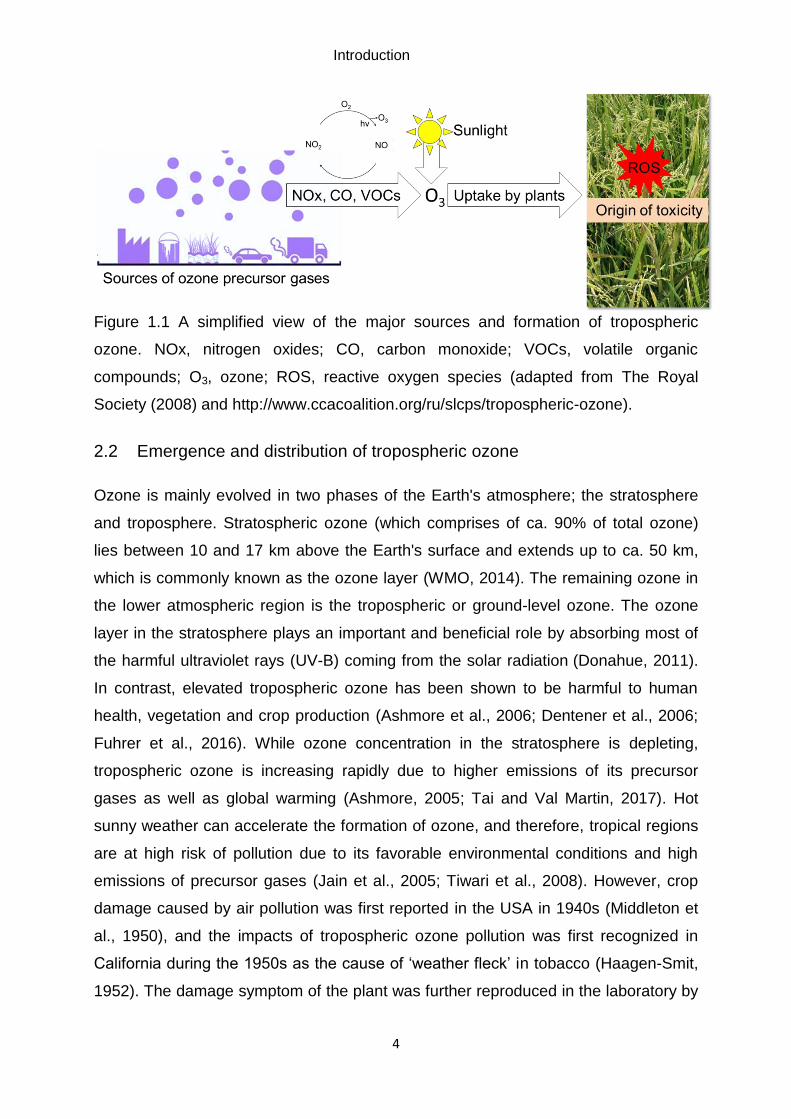
Figure 1.1 A simplified view of the major sources and formation of tropospheric
ozone. NOx, nitrogen oxides; CO, carbon monoxide; VOCs, volatile organic
compounds; O3, ozone; ROS, reactive oxygen species (adapted from The Royal
Society (2008) and http://www.ccacoalition.org/ru/slcps/tropospheric-ozone).
2.2 Emergence and distribution of tropospheric ozone
Ozone is mainly evolved in two phases of the Earth's atmosphere; the stratosphere
and troposphere. Stratospheric ozone (which comprises of ca. 90% of total ozone)
lies between 10 and 17 km above the Earth's surface and extends up to ca. 50 km,
which is commonly known as the ozone layer (WMO, 2014). The remaining ozone in
the lower atmospheric region is the tropospheric or ground-level ozone. The ozone
layer in the stratosphere plays an important and beneficial role by absorbing most of
the harmful ultraviolet rays (UV-B) coming from the solar radiation (Donahue, 2011).
In contrast, elevated tropospheric ozone has been shown to be harmful to human
health, vegetation and crop production (Ashmore et al., 2006; Dentener et al., 2006;
Fuhrer et al., 2016). While ozone concentration in the stratosphere is depleting,
tropospheric ozone is increasing rapidly due to higher emissions of its precursor
gases as well as global warming (Ashmore, 2005; Tai and Val Martin, 2017). Hot
sunny weather can accelerate the formation of ozone, and therefore, tropical regions
are at high risk of pollution due to its favorable environmental conditions and high
emissions of precursor gases (Jain et al., 2005; Tiwari et al., 2008). However, crop
damage caused by air pollution was first reported in the USA in 1940s (Middleton et
al., 1950), and the impacts of tropospheric ozone pollution was first recognized in
California during the 1950s as the cause of ‘weather fleck’ in tobacco (Haagen-Smit,
1952). The damage symptom of the plant was further reproduced in the laboratory by
Introduction
5
the reaction of organic trace gases or car exhaust with nitrogen oxides (NOx) in
presence of sunlight (Haagen-Smit and Fox, 1954; Heggestad and Middleton, 1959).
However, increasing tropospheric ozone concentrations and its damaging effects on
plants and vegetation in other parts of North America, Europe and Japan were
gradually reported by 1970s (The Royal Society, 2008).
Several projections indicated that in the past few decades, rising tropospheric ozone
concentrations were controlled by adopting various air-quality regulations in the
developed countries such as in Europe (Chang et al., 2017). In contrast, the ozone
pollution scenarios are rather severe in developing countries, especially rice
producing countries in Asia which are currently marked as ozone hotspot (Mills et al.,
2018). The pollution scenario will be exacerbated in the 21st century because of rapid
economic and population growth, higher emission of precursor gases and lack of air-
quality regulations (Brauer et al., 2016; Maas and Grennfelt, 2016). During the
summer season, high tropospheric ozone concentrations (ca. 100 ppb), far above the
damage threshold level (40 ppb) have been reported in many parts of China, India,
Pakistan, and Bangladesh (Brauer et al., 2016; Deb Roy et al., 2009; Ran et al.,
2009). However, ozone concentrations less than 40 ppb can also have adverse
effects on sensitive vegetation (Agathokleous et al., 2015; Sugai et al., 2018).
Therefore, several ozone phytotoxicity metrics mainly based on ozone exposure or
the accumulated stomatal ozone flux have been proposed and used so far globally
(Musselman et al., 2006; Pleijel et al., 2004); AOT40, SUM06, and W126 are the
ozone exposure based metrics, and the flux based available metrics are DO3SE,
AFstY, and PODY (CLRTAP, 2017; Emberson et al., 2001; Karlsson et al., 2004;
Wang and Mauzerall, 2004). Nevertheless, ozone risk assessment based on
modelled stomatal uptake or flux provides a stronger indication of ozone effects in
Europe compared to those based on concentrations (Mills et al., 2011; Pleijel et al.,
2004; Simpson et al., 2007). However, AOT40 (accumulated ozone exposure over a
threshold of 40 ppb) is the most widely reported critical index and is adopted by
several regulatory agencies for its simple calculation method and suitability for highly
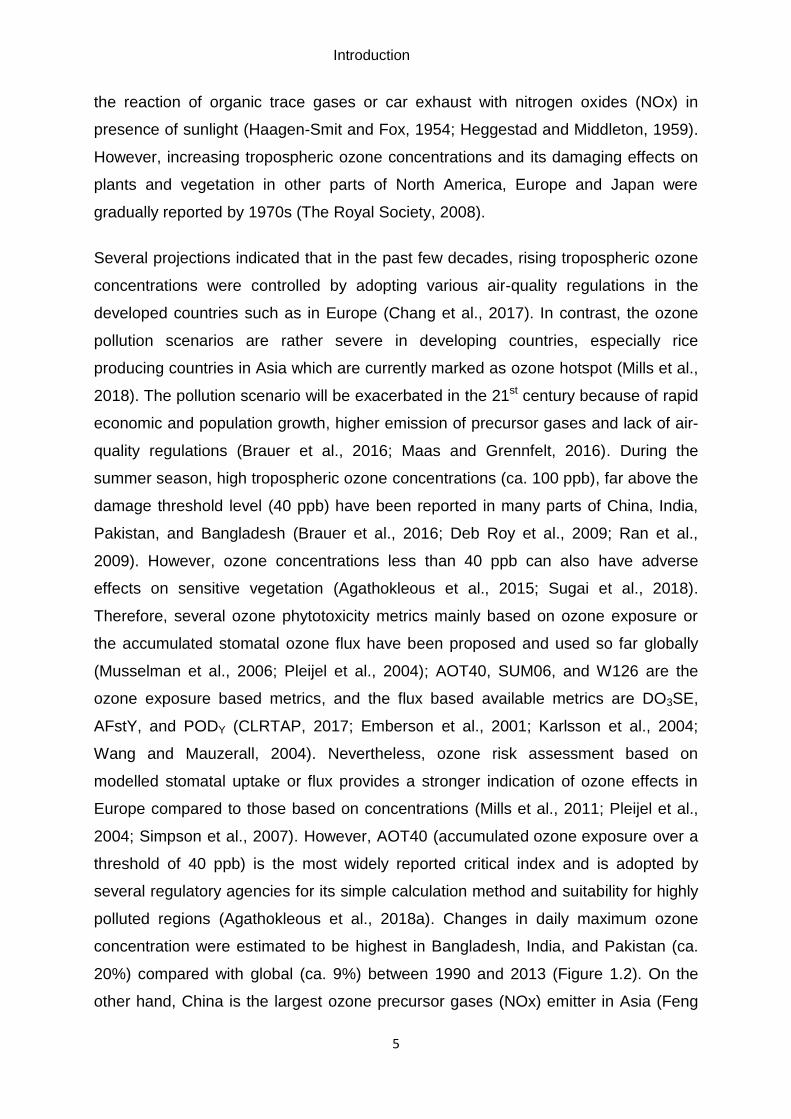
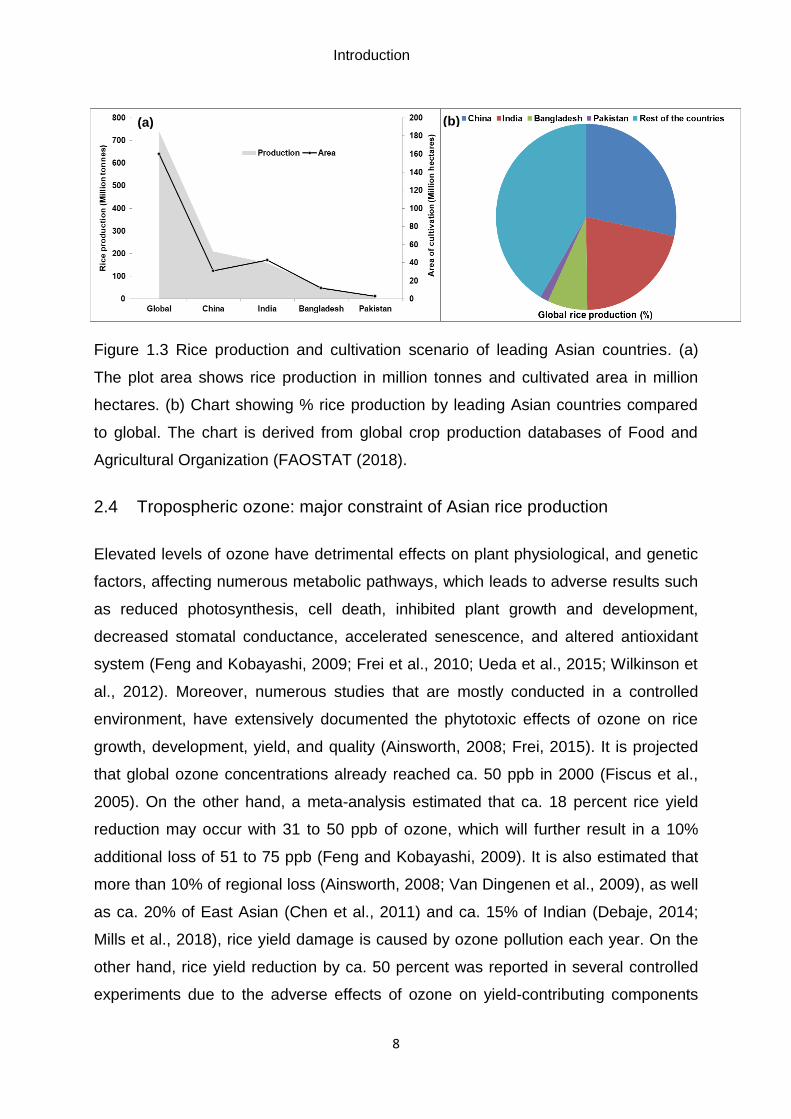
polluted regions (Agathokleous et al., 2018a). Changes in daily maximum ozone
concentration were estimated to be highest in Bangladesh, India, and Pakistan (ca.
20%) compared with global (ca. 9%) between 1990 and 2013 (Figure 1.2). On the
other hand, China is the largest ozone precursor gases (NOx) emitter in Asia (Feng
Introduction
6
0
10
20
30
40
50
60
70
80
Bangladesh India Pakistan Global
Ozo
ne
co
nce
ntr
ati
on
s (
pp
b)
Year (1990)
Year (2013)
% Change
et al, 2015). Therefore, it is obvious that crops and vegetation are endangered by
current tropospheric ozone concentrations in many parts of the world especially in
Asia and will be the major menace in the near future due to its rising trends.
Figure 1.2 Changes of average 1 h daily maximum ozone (ppb) concentrations
between the year of 1990 and 2013 (adapted from Brauer et al. (2016).
2.3 Rice: staple food crop of half of the global population
Rice (Oryza sativa L.) is the most widely grown and consumed food crop in Asia
(McCouch et al., 2016). It is a diploid species (n=12) and a self-pollinated crop. Rice
is classified in the genus Oryza and belongs to the grass (poaceae) family. Two
different types of cultivated rice are available globally; Oryza sativa which is grown
and popular in Asia, also known as Asian rice, and another Oryza glaberrima, grown
in several areas in Africa, also known as African rice. The genus Oryza has several
wild relatives, among them O. rufipogon, O. nivara and O. barthii are important (IRRI
Ricepedia, 2018). Several studies revealed that Asian rice was domesticated ca.
10,000 years ago in the form of its ancestor wild rice O. rufipogon in China, whereas
African rice ca. 3000 years ago from the ancestor O. barthii along the river Niger
(Huang et al., 2012; Kovach et al., 2007; Wang et al., 2014). O. sativa has two
popular cultivated sub species, O. sativa spp. japonica (sticky, short-grained) and O.
sativa spp. indica (nonsticky, long-grained). Ancient japonica sub species was first
domesticated in South China near the Pearl River (Huang et al., 2012). On the other
Introduction
7
hand, indica was developed and domesticated from the crosses between japonica
and wild relatives in South and Southeast Asia as it is genetically intermediate
between cultivated rice and wild rice from South China (Huang et al., 2012). The rice
genome size (O. sativa spp. japonica cv. Nipponbare) is ca. 430 Mb and full
sequences are publicly available through the rice annotation project database (RAP-
DB, http://rapdb.dna.affrc.go.jp/) and rice genome annotation project (RGAP,
http://rice.plantbiology.msu.edu/). In addition, the largest genome sequence
databases for ca. 3000 rice accessions are publicly available in the International Rice
Genebank Collection in IRRI (Li et al., 2014; Wang et al., 2018). Therefore, rice is
suitable for any genetic modifications and used as a model plant for the study of
cereal crops biology.
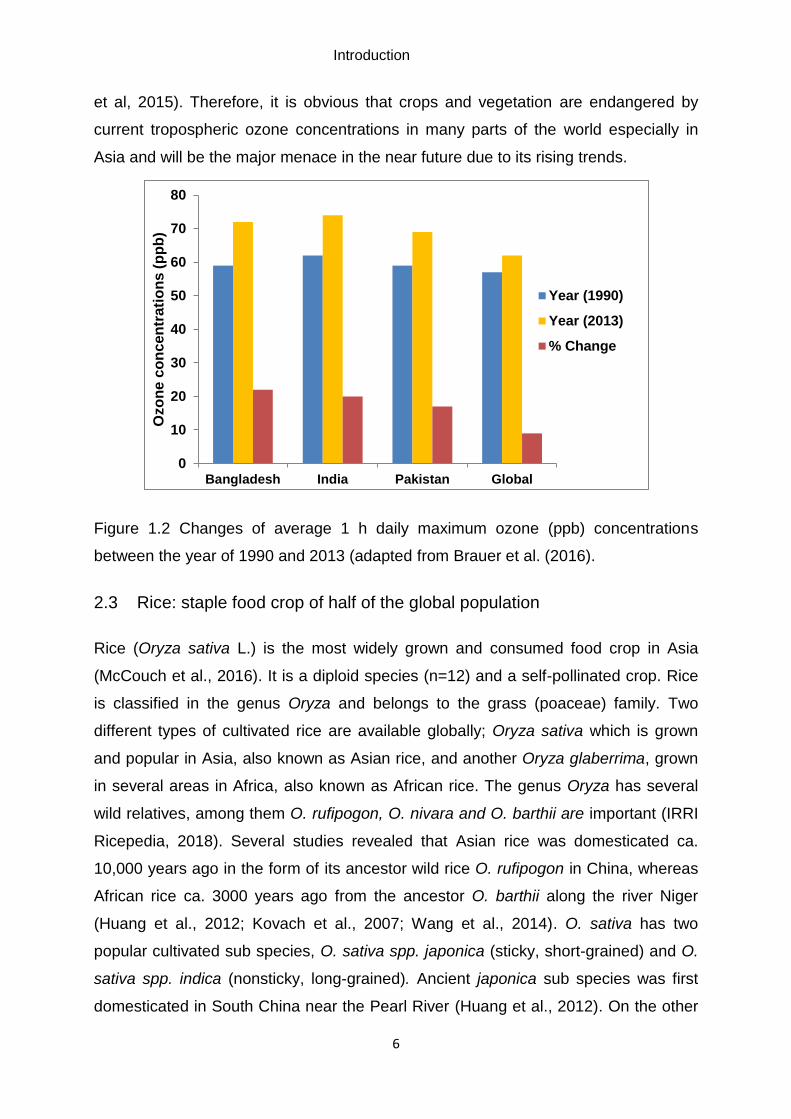
Rice is a carbohydrate-rich food (80% by weight) crop which also contains other
nutrients, such as in 100 gm of rice contents 7.13 gm
protein, 0.12 gm sugar, 2.88 mg vitamin B complex, 28
mg calcium and 115 mg of both phosphorus and
potassium (IRRI Ricepedia, 2018; USDA, 2018). There
are mainly three phases in the rice life cycle i.e.
vegetative, reproductive and ripening. The duration from
seed to maturity varies among the varieties, and
generally lies between 80 and 180 days (IRRI
Ricepedia, 2018). Rice is ranked the third highest (ca.
750 million tonnes) globally produced agricultural
commodity after maize and sugarcane (FOASTAT,
2018). The production (ca. 90% of the global rice) and
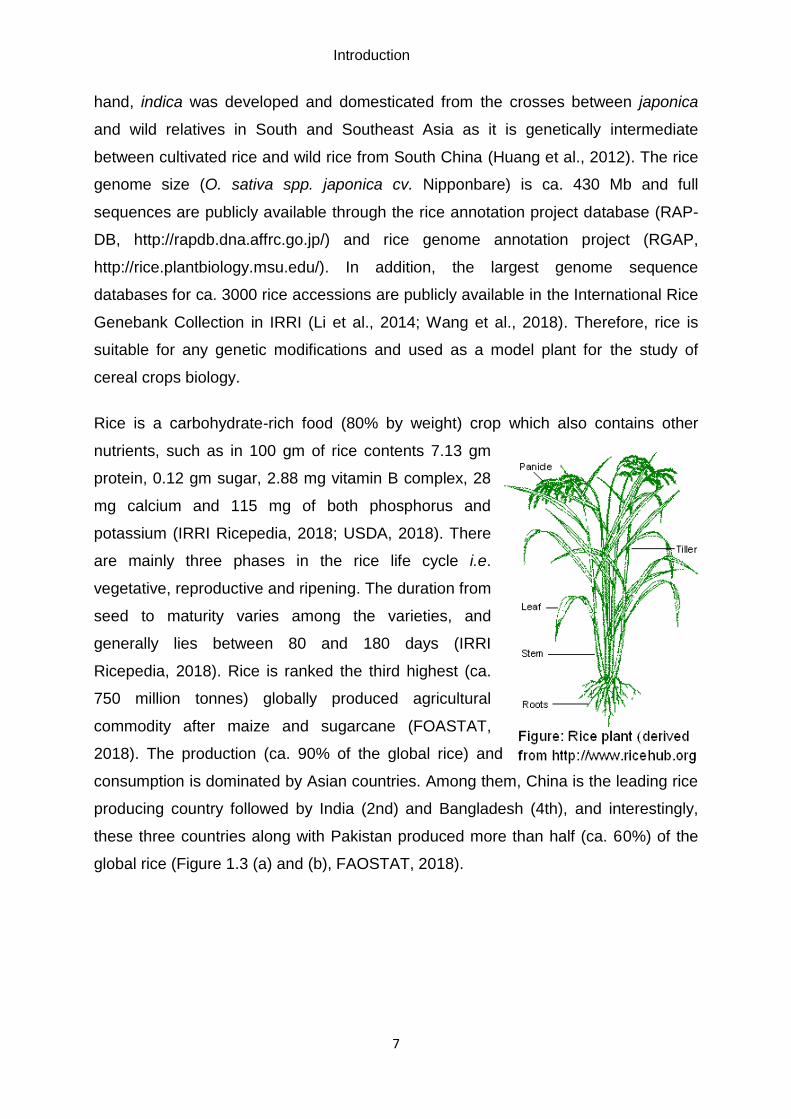
consumption is dominated by Asian countries. Among them, China is the leading rice
producing country followed by India (2nd) and Bangladesh (4th), and interestingly,
these three countries along with Pakistan produced more than half (ca. 60%) of the
global rice (Figure 1.3 (a) and (b), FAOSTAT, 2018).
Introduction
8
Figure 1.3 Rice production and cultivation scenario of leading Asian countries. (a)
The plot area shows rice production in million tonnes and cultivated area in million
hectares. (b) Chart showing % rice production by leading Asian countries compared
to global. The chart is derived from global crop production databases of Food and
Agricultural Organization (FAOSTAT (2018).
2.4 Tropospheric ozone: major constraint of Asian rice production
Elevated levels of ozone have detrimental effects on plant physiological, and genetic
factors, affecting numerous metabolic pathways, which leads to adverse results such
as reduced photosynthesis, cell death, inhibited plant growth and development,
decreased stomatal conductance, accelerated senescence, and altered antioxidant
system (Feng and Kobayashi, 2009; Frei et al., 2010; Ueda et al., 2015; Wilkinson et
al., 2012). Moreover, numerous studies that are mostly conducted in a controlled
environment, have extensively documented the phytotoxic effects of ozone on rice
growth, development, yield, and quality (Ainsworth, 2008; Frei, 2015). It is projected
that global ozone concentrations already reached ca. 50 ppb in 2000 (Fiscus et al.,
2005). On the other hand, a meta-analysis estimated that ca. 18 percent rice yield
reduction may occur with 31 to 50 ppb of ozone, which will further result in a 10%
additional loss of 51 to 75 ppb (Feng and Kobayashi, 2009). It is also estimated that
more than 10% of regional loss (Ainsworth, 2008; Van Dingenen et al., 2009), as well
as ca. 20% of East Asian (Chen et al., 2011) and ca. 15% of Indian (Debaje, 2014;
Mills et al., 2018), rice yield damage is caused by ozone pollution each year. On the
other hand, rice yield reduction by ca. 50 percent was reported in several controlled
experiments due to the adverse effects of ozone on yield-contributing components
(a) (b)
Introduction
9
compared to control (Akhtar et al., 2010; Rai et al., 2010; Sawada and Kohno, 2009).
For instance, lower number of spikelets per panicle and individual grain mass (Frei et
al., 2012; Wang et al., 2012), higher spikelet sterility (Yamaguchi et al., 2014) and
lower number of tiller (Akhtar et al., 2010; Frei et al., 2008). In addition, a recent
modeling study determined the total annual rice production loss in India to be 6.7
million tonnes (corresponding to 6.3 percent) due to ozone pollution, in which the
highest reduction (2.6 million tonnes) was estimated in the eastern part, considering
the average yield between the year 2011 and 2014 (Lal et al., 2017). Therefore, rising
tropospheric ozone is one of the major threats for growing rice in Asia.
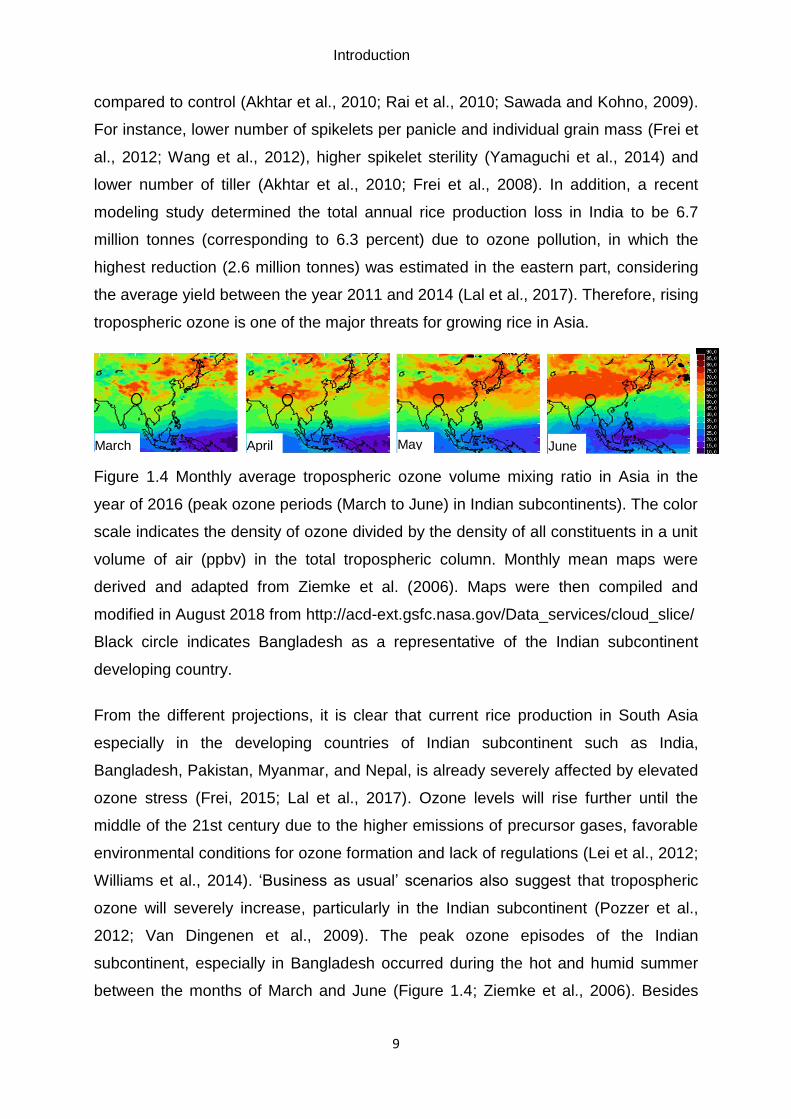
Figure 1.4 Monthly average tropospheric ozone volume mixing ratio in Asia in the
year of 2016 (peak ozone periods (March to June) in Indian subcontinents). The color
scale indicates the density of ozone divided by the density of all constituents in a unit
volume of air (ppbv) in the total tropospheric column. Monthly mean maps were
derived and adapted from Ziemke et al. (2006). Maps were then compiled and
modified in August 2018 from http://acd-ext.gsfc.nasa.gov/Data_services/cloud_slice/
Black circle indicates Bangladesh as a representative of the Indian subcontinent
developing country.
From the different projections, it is clear that current rice production in South Asia
especially in the developing countries of Indian subcontinent such as India,
Bangladesh, Pakistan, Myanmar, and Nepal, is already severely affected by elevated
ozone stress (Frei, 2015; Lal et al., 2017). Ozone levels will rise further until the
middle of the 21st century due to the higher emissions of precursor gases, favorable
environmental conditions for ozone formation and lack of regulations (Lei et al., 2012;
Williams et al., 2014). ‘Business as usual’ scenarios also suggest that tropospheric
ozone will severely increase, particularly in the Indian subcontinent (Pozzer et al.,
2012; Van Dingenen et al., 2009). The peak ozone episodes of the Indian
subcontinent, especially in Bangladesh occurred during the hot and humid summer
between the months of March and June (Figure 1.4; Ziemke et al., 2006). Besides
March April May June
Introduction
10
this, rice is produced almost all year round during two major seasons; the wet season
(June to November) generally known as Aman rice, in which high ozone level can
overlap with the crucial early vegetative stages including tillering. The other is dry
season (December to May) called Boro rice, in which reproductive growth stages
(flowering and grain filling) can encounter with high ozone episode (Frei, 2015).
Therefore, both rice growing seasons in these regions are at high risk, as different
growth phases of rice cultivation encounter and overlap with peak ozone episodes;
this represents a critical threat for rice yield and production (Frei, 2015). However,
field-based ozone damage evaluation is still lacking in these highly ozone prone
areas. Therefore, it is of paramount importance to develop and/or validate research
tools to monitor and evaluate ozone induced damage in crops and vegetation.
2.5 Ozone impacts evaluation systems
Adverse effects of ozone on plants and vegetation are mainly evaluated through sun-
lit plant growth chamber, open top chambers (OTC), and free air concentration
enrichment with ozone (FACE-O3), experimental systems so far (Kobayashi, 2015).
Sun-lit are environmentally controlled chambers in which ozone concentration can be
maintained at desired levels for the purpose of better understanding of the
mechanism of ozone damage at smaller scale (Kobayashi 2015). The OTC, first
introduced in the early 1970s by Heagle et al. (1973), are the most widely used
environmentally controlled system in which ozone concentration is maintained at a
desired level, with artificially generated air blowing with ozone into the chamber
compared to control (Figure 1.5 (a); Frei, 2015). FACE is another promising and more
realistic; a chamber-less system for field conditions at which air is enriched with
elevated ozone and is released into the wind through rings of pipes just above the
canopy at a certain increased level compared with the ambient ozone concentration
(Figure 1.5 (b); Morgan et al. 2004). Nevertheless, both OTC and FACE-ozone
systems have a number of limitations. For example, OTC may interfere in the ozone
impacts by modifying the microclimate (especially, temperature, humidity, CO2
concentration) due to ‘chamber effects’ which can differ from the actual field
conditions (Piikki et al., 2008; Kobayashi, 2015). Moreover, it is small in dimensions
and usually not suitable for larger scale applications (Macháčová, 2010). On the other
hand, FACE–ozone offers a unique opportunity to screen large numbers of genotype
Introduction
11
in field conditions but it can only compare between current ambient and elevated
ozone concentrations (Ainsworth et al., 2014; Pleijel, 2011). In addition, very few
studies have been conducted so far using FACE as only three FACE-ozone system
are available globally, mainly in the USA for soybean (Morgan et al., 2004), in China
for rice and wheat (Shi et al., 2009; Tang et al., 2011), and in Italy for tree species
(Paoletti and Carriero, 2016). Moreover, crop sensitivity towards ozone may differ
between OTC and FACE systems (Feng et al., 2018). However, both systems require
infrastructure, continuous electricity supply and are expensive, technically challenging
and laborious to maintain. Therefore, they are not easy to use and establish in many
areas of the highly ozone affected developing countries in the Indian subcontinent
(Kobayashi, 2015; Oksanen et al., 2013).
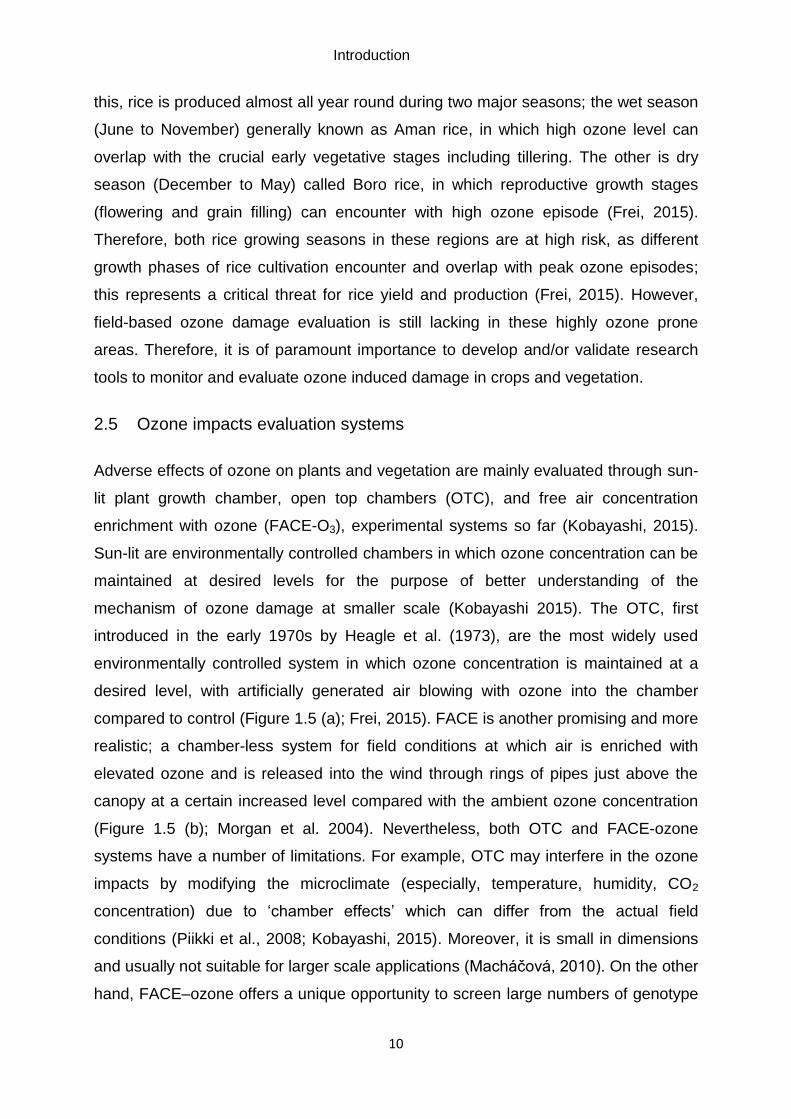
Figure 1.5 Photographs of open top chambers (OTC) and free air concentration
enrichment (FACE) experimental system. (a) OTC (source: collected from Dr.
Michael Frei), (b) FACE (source: Ainsworth (2017).
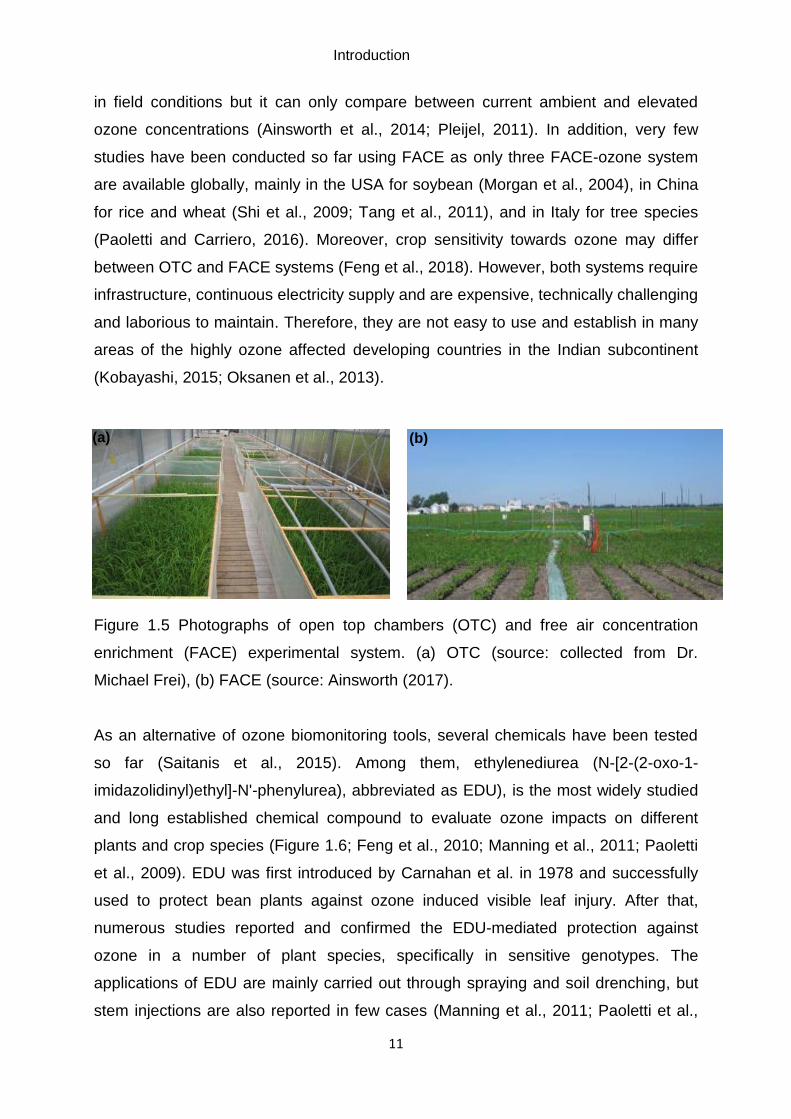
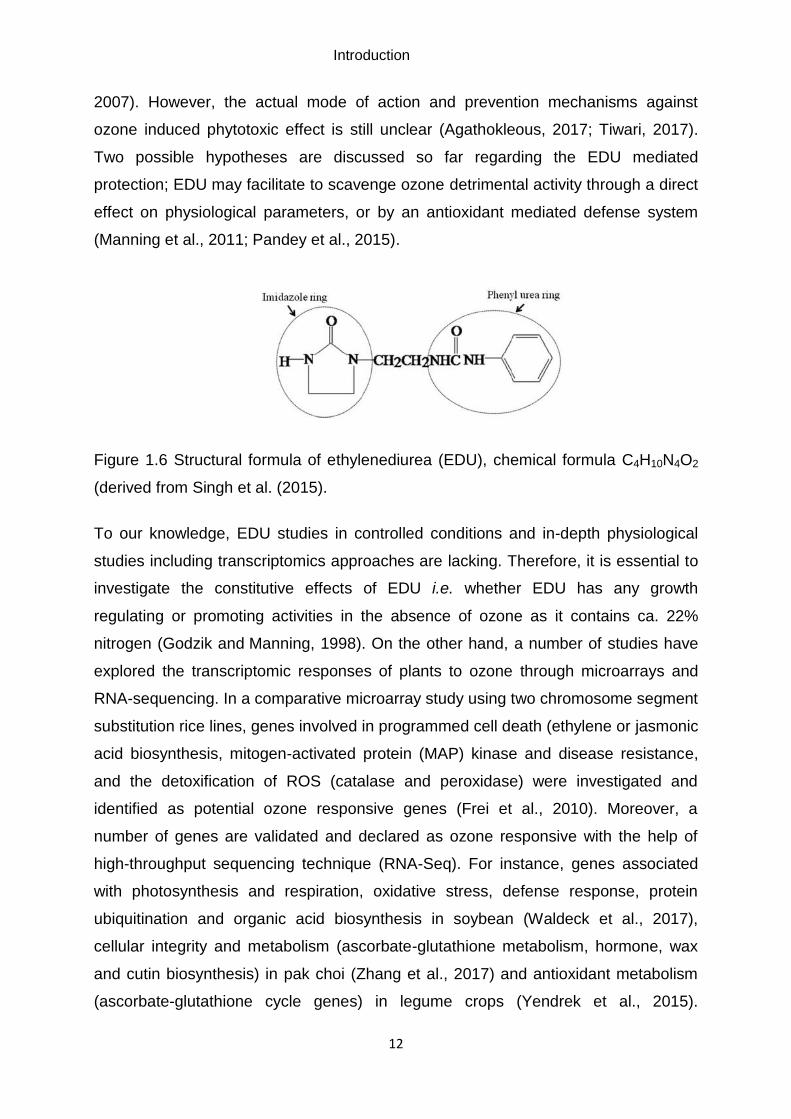
As an alternative of ozone biomonitoring tools, several chemicals have been tested
so far (Saitanis et al., 2015). Among them, ethylenediurea (N-[2-(2-oxo-1-
imidazolidinyl)ethyl]-N'-phenylurea), abbreviated as EDU), is the most widely studied
and long established chemical compound to evaluate ozone impacts on different
plants and crop species (Figure 1.6; Feng et al., 2010; Manning et al., 2011; Paoletti
et al., 2009). EDU was first introduced by Carnahan et al. in 1978 and successfully
used to protect bean plants against ozone induced visible leaf injury. After that,
numerous studies reported and confirmed the EDU-mediated protection against
ozone in a number of plant species, specifically in sensitive genotypes. The
applications of EDU are mainly carried out through spraying and soil drenching, but
stem injections are also reported in few cases (Manning et al., 2011; Paoletti et al.,
(a) (b)
Introduction
12
2007). However, the actual mode of action and prevention mechanisms against
ozone induced phytotoxic effect is still unclear (Agathokleous, 2017; Tiwari, 2017).
Two possible hypotheses are discussed so far regarding the EDU mediated
protection; EDU may facilitate to scavenge ozone detrimental activity through a direct
effect on physiological parameters, or by an antioxidant mediated defense system
(Manning et al., 2011; Pandey et al., 2015).
Figure 1.6 Structural formula of ethylenediurea (EDU), chemical formula C4H10N4O2
(derived from Singh et al. (2015).
To our knowledge, EDU studies in controlled conditions and in-depth physiological
studies including transcriptomics approaches are lacking. Therefore, it is essential to
investigate the constitutive effects of EDU i.e. whether EDU has any growth
regulating or promoting activities in the absence of ozone as it contains ca. 22%
nitrogen (Godzik and Manning, 1998). On the other hand, a number of studies have
explored the transcriptomic responses of plants to ozone through microarrays and
RNA-sequencing. In a comparative microarray study using two chromosome segment
substitution rice lines, genes involved in programmed cell death (ethylene or jasmonic
acid biosynthesis, mitogen-activated protein (MAP) kinase and disease resistance,
and the detoxification of ROS (catalase and peroxidase) were investigated and
identified as potential ozone responsive genes (Frei et al., 2010). Moreover, a
number of genes are validated and declared as ozone responsive with the help of
high-throughput sequencing technique (RNA-Seq). For instance, genes associated
with photosynthesis and respiration, oxidative stress, defense response, protein
ubiquitination and organic acid biosynthesis in soybean (Waldeck et al., 2017),
cellular integrity and metabolism (ascorbate-glutathione metabolism, hormone, wax
and cutin biosynthesis) in pak choi (Zhang et al., 2017) and antioxidant metabolism
(ascorbate-glutathione cycle genes) in legume crops (Yendrek et al., 2015).
Introduction
13
Therefore, it is obvious that large numbers of genes are ozone responsive in different
plant species. In addition, next generation deep sequencing techniques (e.g., RNA-
Seq) offer unique opportunities to reveal unbiased, highly reproducible and a far more
precise measurement of whole genome transcripts and have a large dynamic range
compared to the other closest sequencing platforms such as microarrays (Hurd and
Nelson, 2009; Wang et al., 2009). Thus, RNA sequencing provides an excellent tool
to explore global physiological responses to external stimuli such as ozone, EDU
application, and their interaction. Taken together, we designed and performed a
series of experiments including in-depth physiological, biochemical, transcriptome
(RNA-sequencing), scanning electron microscopy (SEM) and other related
approaches including four different treatments i.e. control, control+EDU, ozone and
ozone+EDU. For these purposes, we used a priori ranked different contrasting ozone
responsive rice genotypes. We also performed an additional experiment to
investigate the specificity of EDU towards different stresses i.e. salinity, iron toxicity,
and zinc deficiency. To this end, all conducted experiments were primarily aimed at
investigating and validating the suitability of EDU as an ozone biomonitoring tool
through its functional characterization.
Introduction
14
2.6 Aims of this study
This study mainly aimed to test the suitability and feasibility of EDU as a future ozone
biomonitoring tool for rice specifically for the highly ozone affected developing
countries in Indian subcontinent, which has a lack of conventional ozone
experimental facilities such as OTC and FACE-O3.
In detail, the following objectives were investigated
1. Differential responses of rice towards ethylenediurea (EDU) under ozone
stress
1.1 Assessment of confounding effects of EDU in absence of ozone
1.2 Evaluation of the suitability of EDU as an effective screening tool to
differentiate ozone sensitivity
2. Protection mechanisms of EDU against ozone phytotoxicity (insights into the
mode of action)
2.1 Investigation of EDU fertilization or growth regulating activities
2.2 Elucidation of direct/indirect effects of EDU on the activation of ozone
stress defense pathways genes
2.3 Alleviation of ozone damage effects with EDU application via indirect
protection mechanisms
2.4 Mitigation of the negative effects of the stresses other than ozone by EDU
application
Results
15
3 Results
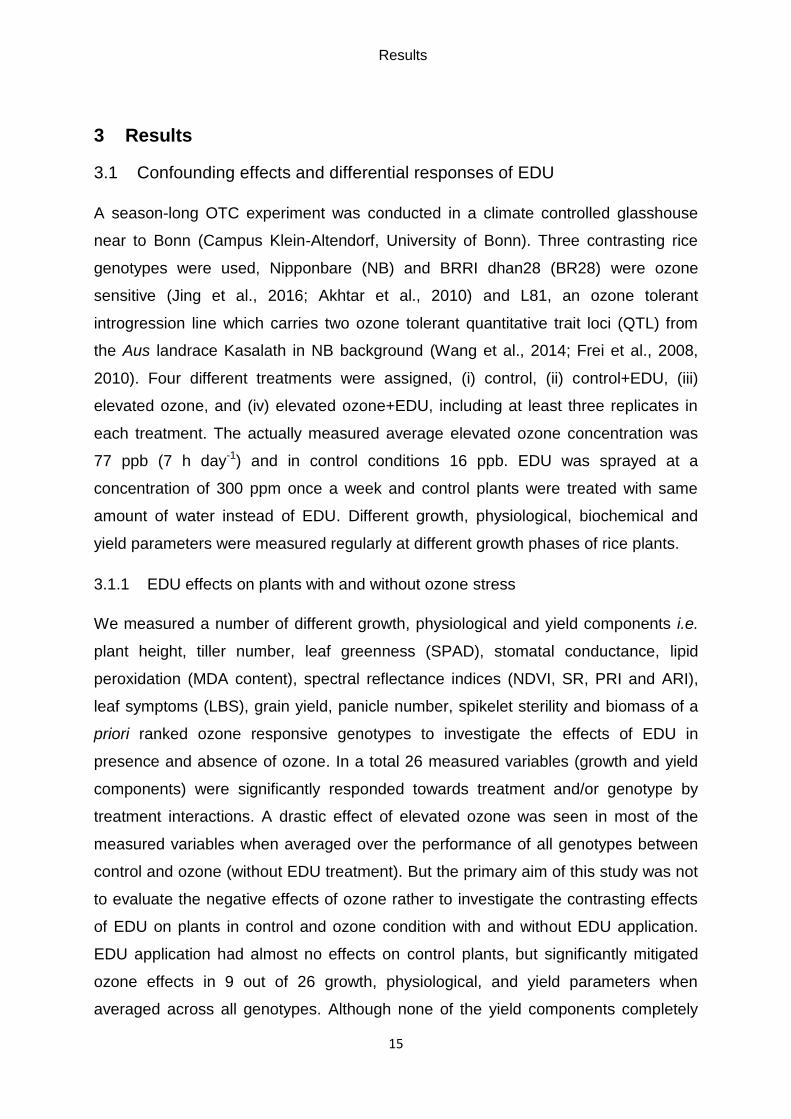
3.1 Confounding effects and differential responses of EDU
A season-long OTC experiment was conducted in a climate controlled glasshouse
near to Bonn (Campus Klein-Altendorf, University of Bonn). Three contrasting rice
genotypes were used, Nipponbare (NB) and BRRI dhan28 (BR28) were ozone
sensitive (Jing et al., 2016; Akhtar et al., 2010) and L81, an ozone tolerant
introgression line which carries two ozone tolerant quantitative trait loci (QTL) from
the Aus landrace Kasalath in NB background (Wang et al., 2014; Frei et al., 2008,
2010). Four different treatments were assigned, (i) control, (ii) control+EDU, (iii)
elevated ozone, and (iv) elevated ozone+EDU, including at least three replicates in
each treatment. The actually measured average elevated ozone concentration was
77 ppb (7 h day-1) and in control conditions 16 ppb. EDU was sprayed at a
concentration of 300 ppm once a week and control plants were treated with same
amount of water instead of EDU. Different growth, physiological, biochemical and
yield parameters were measured regularly at different growth phases of rice plants.
3.1.1 EDU effects on plants with and without ozone stress
We measured a number of different growth, physiological and yield components i.e.
plant height, tiller number, leaf greenness (SPAD), stomatal conductance, lipid
peroxidation (MDA content), spectral reflectance indices (NDVI, SR, PRI and ARI),
leaf symptoms (LBS), grain yield, panicle number, spikelet sterility and biomass of a
priori ranked ozone responsive genotypes to investigate the effects of EDU in
presence and absence of ozone. In a total 26 measured variables (growth and yield
components) were significantly responded towards treatment and/or genotype by
treatment interactions. A drastic effect of elevated ozone was seen in most of the
measured variables when averaged over the performance of all genotypes between
control and ozone (without EDU treatment). But the primary aim of this study was not
to evaluate the negative effects of ozone rather to investigate the contrasting effects
of EDU on plants in control and ozone condition with and without EDU application.
EDU application had almost no effects on control plants, but significantly mitigated
ozone effects in 9 out of 26 growth, physiological, and yield parameters when
averaged across all genotypes. Although none of the yield components completely
Results
16
recovered by EDU application compared to control, a clear positive effect of EDU on
ozone afflicted plants was observed in the investigated genotypes. For instance, in
the most important trait grain yield, 26% yield reduction was estimated due to ozone
compared with control in averaged over for all genotypes. In contrast, only 16% yield
loss was determined in ozone+EDU treated plants which clearly indicated the
alleviation of negative effects of ozone with a recovery of 10% of the original yield.
3.1.2 Differential responses towards EDU application
The investigated genotypes contrasting ozone response barely responded
differentially to EDU application in control conditions, but differential responses were
common in ozone with and without EDU treatment. We determined that ca. 50% of
measured variables (13 out of 22 and 12 out of 26) were EDU responsive in the
sensitive genotypes BR28 and NB, respectively in presence of ozone. On the other
hand, only ca. 15% variables (4 out of 26) were EDU responsive for the tolerant
genotype L81. Moreover, none of the yield components responded to EDU
application for tolerant L81. In contrast, a significant effect and alleviation by EDU
application for foliar injury, lipid peroxidation, leaf greenness (vegetation indices
NDVI, SR), panicle number, and grain yield were seen only in the ozone sensitive
genotypes BR28 and NB. However, the widely cultivated Bangladeshi modern-variety
BR28 exhibited the most drastic response to ozone, which was most consistently
recovered by the EDU application. For instance, we calculated the grain yield in
control condition for BR28 with and without EDU application ca. 7 tons/ha, while 37%
yield reduction was estimated due to ozone stress. On the other hand, 25% yield loss
was displayed in ozone+EDU condition with a recovery of 12% of the original yield by
EDU application.
These results and experimental details are described in the following publication Ashrafuzzaman, M., Lubna, F. A., Holtkamp, F., Manning, W. J., Kraska, T., & Frei,
M. (2017). Diagnosing ozone stress and differential tolerance in rice (Oryza sativa L.)
with ethylenediurea (EDU). Environmental Pollution, 230, 339–350.
Results
17
3.2 Protection mechanisms (mode of action) of EDU against ozone phytotoxicity
A series of experiments including growth, physiology, transcriptomics (RNA-Seq),
scanning electron microscopy (SEM) and other related experiments were performed
to explore the mode of action of EDU. Four different contrasting ozone responsive
genotypes were used, Bangladeshi ozone sensitive mega varieties BR28 and
BINA11, ozone sensitive Japanese NB genotype and ozone tolerant introgression
line L81. Four different treatments were assigned, (i) control, (ii) control+EDU, (iii)
elevated ozone, and (iv) elevated ozone+EDU, including at-least three replicates in
each treatment. The reordered average ozone concentration in the two fumigation
studies was ranged from 107 to 108 ppb (7 h day-1) and in control conditions 17 to 37
ppb. EDU was sprayed at a concentration of 300 ppm once a week and control plants
were treated with same amount of water instead of EDU. RNA-sequencing and SEM
was conducted using the ozone sensitive and EDU responsive genotype BR28,
including at least three replicates in each treatment. Finally, an additional experiment
was performed to test the EDU specificity in a diverse set of stresses (iron toxicity,
salinity and zinc deficiency) using the mega rice variety IR64 along with BR28 and
NB.
3.2.1 Nitrogen fertilization and constitutive activity of EDU Leaf nitrogen contents were measured to investigate whether EDU is a potential
source of nitrogen and/or acting as a growth promoting agent. Leaf nitrogen content
did not respond significantly to the treatment in any of the investigated genotypes
(control vs control+EDU and ozone vs ozone+EDU). However, nitrogen content was
significantly declined in ozone in the sensitive variety BR28. On the other hand,
significant ozone stress effects and alleviation by EDU application were seen in
different measured growth and physiological parameters (LBS, MDA, tiller number,
shoot length, shoot dry weight), specifically in the sensitive genotypes BR28, BINA11
and NB. In contrast, we did not observe any significant differential response in control
plants with and without EDU applications. In addition, in depth physiological
measurements (photosynthesis, stomatal conductance, Vcmax and Jmax) of the
ozone sensitive and EDU responsive BR28 variety also confirmed the amelioration of
the deleterious effects of ozone except for stomatal conductance while constitutive
effects were absent in the control plant with and without EDU application.
Results
18
3.2.2 Unravelling EDU mediated transcriptomic responses
In this study, the transcriptomics of BR28 genotype were compared in three biological
replicates with four different treatments i.e. control, control+EDU, ozone and
ozone+EDU. From the isolated RNA, Illumina cDNA libraries were constructed and
sequenced using Illumina HiSeq4000 sequencer. Finally, the reads were aligned and
mapped uniquely to the rice reference genome of Nipponbare after trimming and
removal of stacked reads. A total of 23,208 rice genes were nominated for the further
analyses, based on the expressed genes in at least one of the four treatments. For
the validation of gene expression data from the RNA-Seq, qRT-PCR in a subset of 18
different stress responsive genes and a multidimensional scaling (MDS) plot analyses
were conducted. The qPCR and RNA-Seq data were in a good agreement (R2=0.81)
and the control and control+EDU samples were clearly separated from the ozone and
ozone+EDU in the MDS plot. We conducted a two-way ANOVA to analyze gene
expression patterns including the factors ozone treatment (with the levels control and
ozone), and EDU application (with the levels with or without EDU) and also
determined pair-wise contrasts in each possible pair of the experimental conditions.
We calculated the differentially expressed genes (DEGs), including both of the cut off
thresholds level 5% and 10% false discovery rate (FDR). 933 ozone responsive
genes were identified at 5% FDR and it increased to 4676 at 10% FDR level. In
contrast, only 10 and 7 DEGs responded to EDU treatment and ozone x EDU
interaction, respectively at both 5% and 10% FDR level, which clearly indicated that
EDU had almost no direct effects on the global gene expression pattern of the
investigated rice genotype. In addition, around 74% identified ozone-responsive
DEGs (FDR <0.05) in this study were identical to those reported in a previous
microarray study by Frei et al. (2010). Interestingly, no DEGs were identified between
the pairwise contrast control vs control+EDU treatment at both FDR, which further
indicated the lack of constitutive effects of EDU on global gene expression profile. In
addition, almost no DEGs were identified in the control vs ozone+EDU and
control+EDU vs ozone+EDU conditions. In contrast, a large number of DEGs were
identified between control vs ozone (3182) and control+EDU vs ozone (3367) at 10%
FDR which reflected the drastic effect of ozone on global gene expression profile in
rice.
Results
19
Gene ontology (GO) enrichment analysis was conducted separately for the down-
regulated and up-regulated ozone responsive 933 DEGs at 5% FDR. Catalytic
activity, various types of binding, ligase, kinase and transferase activity were the
dominant GO terms in the category ‘molecular function’. Catalytic activity was the
only significant GO term for the down-regulated genes. Heat maps were generated to
summarize the expression profiles for EDU responsive, ozone x EDU interaction and
the pairwise contrast analysis ozone vs ozone+EDU DEGs along with functional
annotation. The predominant pattern in the expression of these genes was an
induction in the ozone treatment, which was offset by the application of EDU. Among
these, few typical stress-responsive genes were displayed such as glutathione-S-
transferase (LOC_Os01g27480), drought-induced protein (LOC_Os01g48190) or
immediate-early fungal elicitor protein CMPG1 (LOC_Os03g13740).
3.2.3 Elucidation of EDU mediated indirect protection
Due to the absence of any direct effect of EDU on rice global gene expression profile,
an additional experiment was conducted to test the hypothesis whether EDU has any
direct abiotic chemical interaction with ozone. Generated ozone (600 mg/h) was first
percolated through water and water+EDU (300 ppm) and then blown with a fan into
plastic pipes vertically distributed on an empty open-top chamber. The accumulated
ozone concentrations were measured at 1 min interval with a handheld ozone sensor
(series 500; Aeroqual Ltd. Auckland, New Zealand). Significant reductions (ca. 15
percent) of ozone concentrations were observed in water+EDU treatment compared
with only water, which indicates the potential of EDU to limit the concentrations by
abiotic chemical interactions.
3.2.4 EDU fate on leaf surfaces EDU can only reduce ozone concentrations if enough remnants are present on the
leaf surface. For this, we performed scanning electron microscopy (SEM) of leaves in
control and ozone with and without EDU applications (1 d and 7 d after the
treatment). Interestingly, visible deposits of amorphous crystal structures similar to
EDU crystals on a glass plate were displayed on the ozone+EDU treated leaves 7 d
after EDU application which was absent in control. Therefore, an additional
experiment including leaf surfaces treated with 600 and 300 ppm of EDU was
conducted to quantify and further analyses of the EDU deposits. A number of
Results
20
different shape and sized EDU amorphous particles (ca. 400 deposits cm-2 leaf area)
were seen on 1 d and 7 d after EDU treated leaf which was absent in control leaf
treated with only water. We also observed the spreading of the EDU particles on leaf
surface which might cover almost all the leaf area.
3.2.5 Investigation of EDU specificity
Finally, we designed and performed an experiment to test whether EDU can only
mitigate ozone stress and/or other stresses as well. Therefore, three stress
conditions were tested, i.e. Fe toxicity, Zn deficiency and salinity. Almost all
measured growth and physiological parameters (visible leaf symptoms, shoot and
root length, shoot and root dry weight and SPAD value) were significantly affected by
stresses compared to control when averaged over all investigated genotypes. In
contrast, no significant differences were observed between stress and stress+EDU
conditions. However, individual rice genotypes responded differentially to the
stresses, and BR28 exhibited more consistent damage against stresses compared to
the other two genotypes.
These results and experimental details are described in the following publications
Ashrafuzzaman M., Haque Z., Ali B., Mathew B., Yu P., Hochholdinger F., … Frei M.
(2018) Ethylenediurea (EDU) mitigates the negative effects of ozone in rice: insights
into its mode of action. Plant, Cell & Environment. 1-17.
Discussion
21
4 Discussion
We employed an average ozone concentration of 77 to 108 ppb during the treatment
period (7 h day-1) in a series of OTC experiments. Several rice producing Asian
countries especially on the Indian subcontinents are already experiencing a high level
of ozone exceeding this concentration in field during the cropping seasons, due to
increased levels of ozone precursor pollutants (Brauer et al., 2016; Deb Roy et al.,
2009). Several projections estimated that crop yields and productions especially rice
and wheat are greatly hampered in these highly ozone affected areas (Frei, 2015; Lal
et al, 2017; Mills et al., 2018). Nevertheless, lack of field-based evaluation due to
insufficient experimental facilities is a limiting factor for the actual ozone impact
assessment. Therefore, it is of paramount importance to test all possible alternative
tools for ozone impacts evaluation in these highly ozone prone areas as well as to
speed up the ozone tolerance or resistant breeding program. To elucidate the
confounding effects and mode of action of EDU against ozone phytotoxicity, following
three hypotheses were tested.
4.1 Hypothesis 1: EDU does not have any constitutive effects on crops while
mitigating phytotoxic effects of ozone
Absence of differential responses in control plants with and without EDU applications
were observed in almost all of the measured traits (a number of growth, physiological,
biochemical and yield parameters). Besides this, none of the genes were differentially
expressed between control and control+EDU conditions. In addition, EDU spraying
did not affect leaf nitrogen content in rice genotypes which was also confirmed in
willow plants (Agathokleous et al., 2018b). But, it has been mentioned earlier by
several researchers that EDU might act as a foliar fertilizer due to high percentage
(ca. 22%) of nitrogen contents (Godzik & Manning, 1998; Manning et al., 2011).
However, EDU application dose and nutrients status of the plant growing medium can
play a crucial role for the nitrogen contribution. For instance, high concentrations of
EDU (above 800 ppm) contributed to increased leaf nitrogen content of willow plants
grown in low nitrogen and organic matter free soil (Agathokleous et al., 2016a).
Another important aspect of EDU application is the toxicology i.e. effects towards
environment, flora and fauna. Acute toxicological tests were conducted with EDU in
Discussion
22
Control Control+EDU Ozone Ozone+EDU
rat at oral administration LD50 (14000 mg/kg) and no irritation and injury was reported
in skin (Guinea pig) and eye (rabbit), respectively (Manning et al., 2011). However,
high doses of EDU application (> 1000 ppm) might have adverse effects on plants
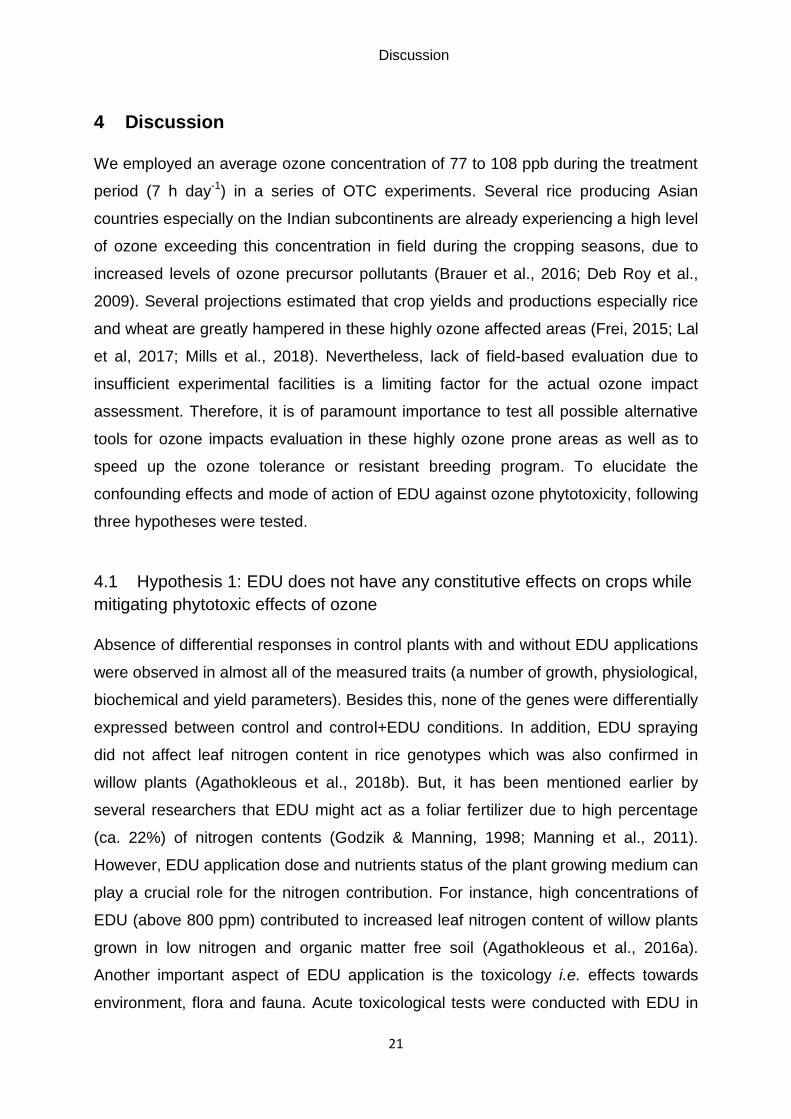
(Agathokleous et al., 2016b; Elagöz and Manning, 2005). On the other hand, a
drastic effect of ozone was observed in the morphology of the experimental rice
genotype which was partly offset by EDU applications in the sensitive genotypes,
specifically BR28 (Figure 4.1).
Figure 4.1 Morphology of the control and ozone rice plant with and without EDU
application of the ozone sensitive BR28 genotype (photographs were taken after 14 d
(7 h day-1) of elevated ozone treatment. Average measured elevated ozone
concentration was 107 ppb and in control condition 17 ppb.
Discussion
23
4.2 Hypothesis 2: EDU mediated protection is regulated by surface
protection rather than direct effects on plant physiology
Ozone primarily enters through leaf stomata and rapidly degrades into different ROS
elements in the apoplast (Kangasjärvi et al., 2005). On the other hand, EDU applied
by available methods (mainly through the spray and soil drench) is rapidly
translocated into leaf apoplastic regions and persists for eight days or more (Gatta et
al., 1997; Pasqualini et al., 2016). Therefore, EDU might have an important role in
regulating ozone stress defense pathways, which could be responsible for the EDU
mediated protection such as stimulation of antioxidants (Pandey et al., 2014, 2015).
But our transcriptomic analyses showed the reverse phenomenon, and almost none
of the genes responded significantly to EDU application (only 10 and 7 genes for
EDU and ozone x EDU interaction, respectively at FDR 10%). In contrast, several
thousand genes were identified as ozone responsive at 10% FDR. Around 74 percent
of these differentially expressed genes (DEGs) were also identical in a previous
microarray study in rice which was mainly involved in ethylene or jasmonic acid
metabolism, general disease resistance and antioxidant pathways (Frei et al., 2010).
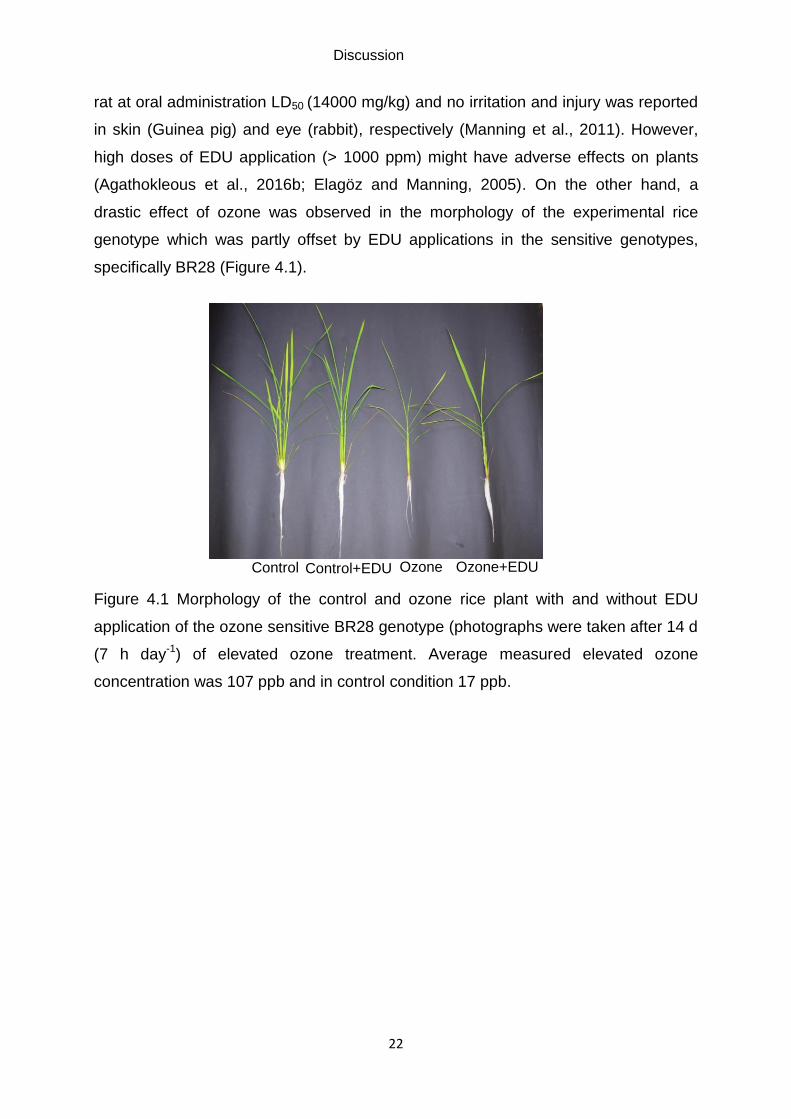
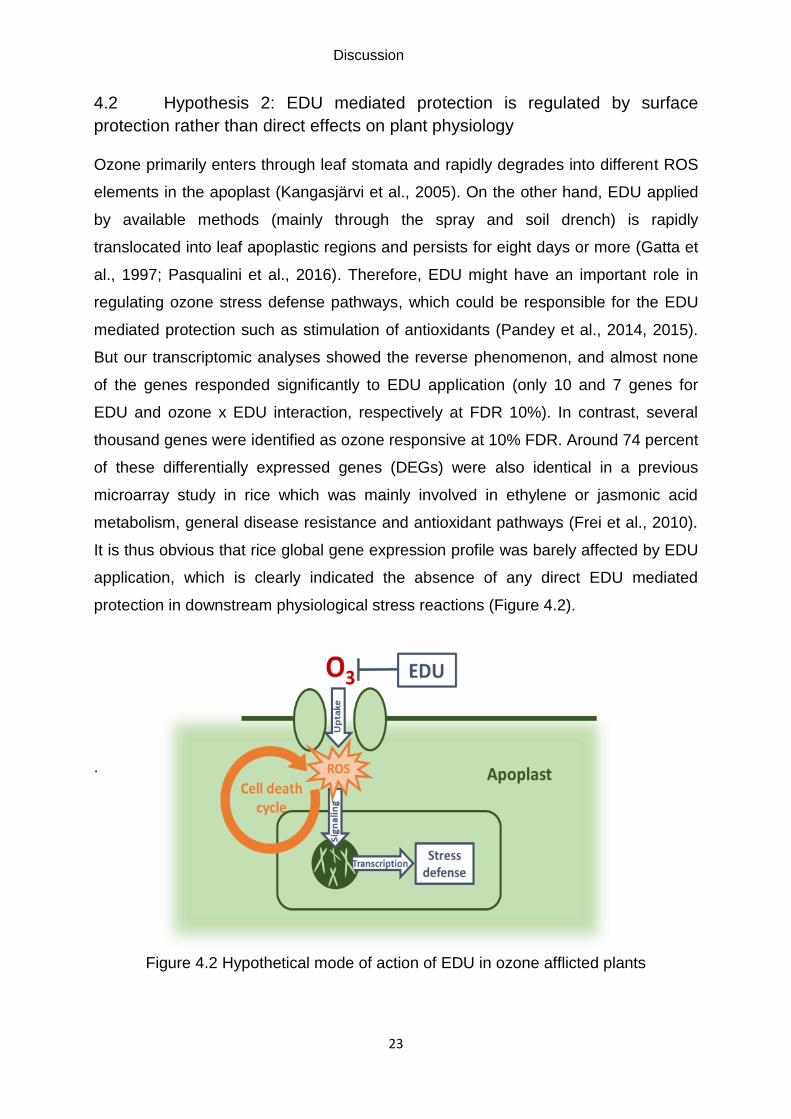
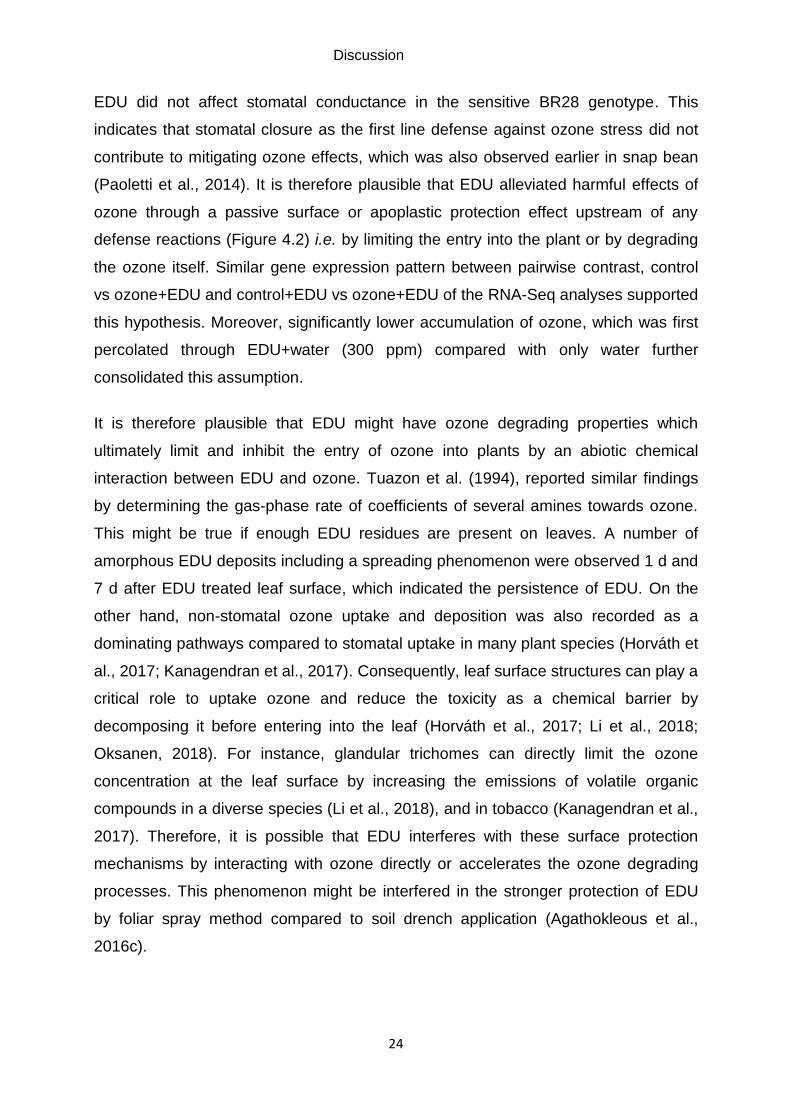
It is thus obvious that rice global gene expression profile was barely affected by EDU
application, which is clearly indicated the absence of any direct EDU mediated
protection in downstream physiological stress reactions (Figure 4.2).
.
Figure 4.2 Hypothetical mode of action of EDU in ozone afflicted plants
Discussion
24
EDU did not affect stomatal conductance in the sensitive BR28 genotype. This
indicates that stomatal closure as the first line defense against ozone stress did not
contribute to mitigating ozone effects, which was also observed earlier in snap bean
(Paoletti et al., 2014). It is therefore plausible that EDU alleviated harmful effects of
ozone through a passive surface or apoplastic protection effect upstream of any
defense reactions (Figure 4.2) i.e. by limiting the entry into the plant or by degrading
the ozone itself. Similar gene expression pattern between pairwise contrast, control
vs ozone+EDU and control+EDU vs ozone+EDU of the RNA-Seq analyses supported
this hypothesis. Moreover, significantly lower accumulation of ozone, which was first
percolated through EDU+water (300 ppm) compared with only water further
consolidated this assumption.
It is therefore plausible that EDU might have ozone degrading properties which
ultimately limit and inhibit the entry of ozone into plants by an abiotic chemical
interaction between EDU and ozone. Tuazon et al. (1994), reported similar findings
by determining the gas-phase rate of coefficients of several amines towards ozone.
This might be true if enough EDU residues are present on leaves. A number of
amorphous EDU deposits including a spreading phenomenon were observed 1 d and
7 d after EDU treated leaf surface, which indicated the persistence of EDU. On the
other hand, non-stomatal ozone uptake and deposition was also recorded as a
dominating pathways compared to stomatal uptake in many plant species (Horváth et
al., 2017; Kanagendran et al., 2017). Consequently, leaf surface structures can play a
critical role to uptake ozone and reduce the toxicity as a chemical barrier by
decomposing it before entering into the leaf (Horváth et al., 2017; Li et al., 2018;
Oksanen, 2018). For instance, glandular trichomes can directly limit the ozone
concentration at the leaf surface by increasing the emissions of volatile organic
compounds in a diverse species (Li et al., 2018), and in tobacco (Kanagendran et al.,
2017). Therefore, it is possible that EDU interferes with these surface protection
mechanisms by interacting with ozone directly or accelerates the ozone degrading
processes. This phenomenon might be interfered in the stronger protection of EDU
by foliar spray method compared to soil drench application (Agathokleous et al.,
2016c).
Discussion
25
4.3 Hypothesis 3: EDU does not mitigate the effect of stresses other than ozone Finally, we tested the specificity of EDU whether it responded towards other
commonly available stresses in the field to consolidate the use of EDU as an ozone
biomonitoring tool. In Asian rice growing countries including Bangladesh and India,
multiple stresses such as salinity or nutrient disorders can coincide with ozone during
the crop growing phase (Frei, 2015; Gregorio et al., 2002). However, none of the
tested stress conditions in our study (iron toxicity, salinity, and zinc deficiency)
responded significantly in rice due to EDU application, which was also confirmed
earlier for moderate drought stress in poplar plants (Xin et al., 2016). Therefore, our
experimental result clearly demonstrated that the EDU effect was ozone specific and
actively alleviated ozone mediated deleterious effects in rice plants.
Discussion
26
4.4 Lesson for future EDU research
Lack of available germplasm from the highly ozone-prone areas and translation of
controlled experiments into the field condition are the major limiting factors for ozone
tolerance breeding (Ainsworth, 2017). On the other hand, ozone-caused yield
reductions are under-estimated especially in Asian highly ozone affected areas due
to lack of farmers’ awareness and absence of simple diagnostic tools compared with
other stresses such as salinity, heat, and drought (Frei, 2015). Nevertheless, a few
studies have been conducted so far in India with EDU applications, mainly in rice
(Pandey et al., 2015), and wheat (Gupta et al., 2018), but no studies have been
reported from Bangladesh. So, there is an enormous scope to explore the ozone
impacts evaluation in plants and vegetation using EDU as a diagnosing tool.
Moreover, two Bangladeshi mega-varieties BR28 and BINA11 showed high
sensitivity to ozone in our study, in accordance with earlier predictions by Emberson
et al. (2009), that South Asian crop varieties are more sensitive to ozone compared to
North American ones. It will presumably be very difficult to adopt the air quality
regulations aimed to minimize the emission of ozone precursor gases in most of the
Asian countries, specifically Indian subcontinent due to rapid population and
economic growth. In contrast, it is projected that 12% ozone caused yield reduction
can be recovered by cultivating more ozone tolerant or resistant crop varieties in
2030 relative to the damage that occurred in 2000 (Avnery et al., 2013). Therefore,
EDU mediated ozone tolerance breeding in crops can be an effective strategy to
enhance crop yield and production, which will contribute to the food security of many
densely populated countries in Asia. In conclusion, our experimental result
encourages the use of EDU as an ozone biomonitoring tool to screen ozone
tolerance (less EDU-responsive) and sensitivity (more EDU-responsive), which can
facilitate the breeding schemes by generating ample of contrasting breeding
materials from the ambient field. However, further studies are warranted for the
commercial and cheap production of EDU and to explore its toxicological aspects.
References
27
5 References
Agathokleous, E., 2017. Perspectives for elucidating the ethylenediurea (EDU) mode
of action for protection against O3 phytotoxicity. Ecotoxicol. Environ. Saf. 142,
530–537.
Agathokleous, E., Kitao, M., Kinose, Y., 2018a. A review study on ozone phytotoxicity
metrics for setting critical levels in Asia. Asian J. Atmos. Environ. 12, 1–16.
Agathokleous, E., Paoletti, E., Manning, W.J., Kitao, M., Saitanis, C.J., Koike, T.,
2018b. High doses of ethylenediurea (EDU) as soil drenches did not increase
leaf N content or cause phytotoxicity in willow grown in fertile soil. Ecotoxicol.
Environ. Saf. 147, 574–584.
Agathokleous, E., Paoletti, E., Saitanis, C.J., Manning, W.J., Shi, C., Koike, T.,
2016a. High doses of ethylene diurea (EDU) are not toxic to willow and act as
nitrogen fertilizer. Sci. Total Environ. 566–567, 841–850.
Agathokleous, E., Mouzaki-Paxinou, A.-C., Saitanis, C.J., Paoletti, E., Manning, W.J.,
2016b. The first toxicological study of the antiozonant and research tool
ethylene diurea (EDU) using a Lemna minor L. bioassay: Hints to its mode of
action. Environ. Pollut. 213, 996–1006.
Agathokleous, E., Paoletti, E., Saitanis, C.J., Manning, W.J., Sugai, T., Koike, T.,
2016c. Impacts of ethylenediurea (EDU) soil drench and foliar spray in Salix
sachalinensis protection against O3 induced injury. Sci. Total Environ. 573,
1053–1062.
Agathokleous, E., Saitanis, C.J., Koike, T., 2015. Tropospheric O3, the nightmare of
wild plants: a review study. J. Agric. Meteorol. 71, 142–152.
Ainsworth, E., Yendrek, C.R., Sitch, S., Collins, W.J., Emberson, L.D., 2012. The
effects of tropospheric ozone on net primary productivity and implications for
climate change. Annu. Rev. Plant Biol. 63, 637–61.
Ainsworth, E.A., 2017. Understanding and improving global crop response to ozone
pollution. Plant J. 90, 886–897.
Ainsworth, E.A., 2008. Rice production in a changing climate: A meta-analysis of
responses to elevated carbon dioxide and elevated ozone concentration. Glob.
Chang. Biol. 14, 1642–1650.
References
28
Ainsworth, E.A., Serbin, S.P., Skoneczka, J.A., Townsend, P.A., 2014. Using leaf
optical properties to detect ozone effects on foliar biochemistry. Photosynth.
Res. 119, 65–76.
Akhtar, N., Yamaguchi, M., Inada, H., Hoshino, D., Kondo, T., Fukami, M., Funada,
R., Izuta, T., 2010. Effects of ozone on growth, yield and leaf gas exchange
rates of four Bangladeshi cultivars of rice (Oryza sativa L.). Environ. Pollut.
158, 2970–2975.
Ashmore, M., Toet, S., Emberson, L., 2006. Ozone - A significant threat to future
world food production? New Phytol. 170, 201–204.
Ashmore, M.R., 2005. Assessing the future global impacts of ozone on vegetation.
Plant, Cell Environ. 28, 949–964.
Avnery, S., Mauzerall, D.L., Fiore, A.M., 2013. Increasing global agricultural
production by reducing ozone damages via methane emission controls and
ozone-resistant cultivar selection. Glob. Chang. Biol. 19, 1285–1299.
Brauer, M., Freedman, G., Frostad, J., van Donkelaar, A., Martin, R. V., Dentener, F.,
van Dingenen, R., Estep, K., Amini, H., Apte, J.S., Balakrishnan, K.,
Barregard, L., Broday, D., Feigin, V., Ghosh, S., Hopke, P.K., Knibbs, L.D.,
Kokubo, Y., Liu, Y., Ma, S., Morawska, L., Texcalac Sangrador, J.L., Shaddick,
G., Anderson, H.R., Vos, T., Forouzanfar, M.H., Burnett, R.T., Cohen, A.,
2016. Ambient air pollution exposure estimation for the global burden of
disease 2013. Environ. Sci. Technol. 50, 79–88.
Chang, K. L., Petropavlovskikh, I., Copper, O.R., Schultz, M.G., Wang, T., 2017.
Regional trend analysis of surface ozone observations from monitoring
networks in eastern North America, Europe and East Asia. Elem Sci Anth. 5,
50.
Chen, C.P., Frei, M., Wissuwa, M., 2011. The OzT8 locus in rice protects leaf carbon
assimilation rate and photosynthetic capacity under ozone stress. Plant, Cell
Environ. 34, 1141–1149.
Cho, K., Tiwari, S., Agrawal, S.B., Torres, N.L., Agrawal, M., Sarkar, A., Shibato, J.,
Agrawal, G.K., Kubo, A., Rakwal, R., 2011. Tropospheric ozone and plants:
Absorption, responses, and consequences, in: Reviews of environmental
contamination and toxicology. 61–111.
References
29
CLRTAP (2017). Chapter 3 “Mapping critical levels for vegetation”. LRTAP
convention modelling and mapping manual. Retrieved from
http://icpvegetation.ceh.ac.uk/
Deb Roy, S., Beig, G., Ghude, S.D., 2009. Exposure-plant response of ambient
ozone over the tropical Indian region. Atmos. Chem. Phys. 9, 5253–5260.
Debaje, S.B., 2014. Estimated crop yield losses due to surface ozone exposure and
economic damage in India. Environ. Sci. Pollut. Res. 21, 7329–7338.
Dentener, F., Stevenson, D., Ellingsen, K., van Noije, T., Schultz, M., Amann, M.,
Atherton, C., Bell, N., Bergmann, D., Bey, I., Bouwman, L., Butler, T., Cofala,
J., Collins, B., Drevet, J., Doherty, R., Eickhout, B., Eskes, H., Fiore, A.,
Gauss, M., Hauglustaine, D., Horowitz, L., Isaksen, I.S.A., Josse, B.,
Lawrence, M., Krol, M., Lamarque, J.F., Montanaro, V., Müller, J.F., Peuch,
V.H., Pitari, G., Pyle, J., Rast, S., Rodriguez, J., Sanderson, M., Savage, N.H.,
Shindell, D., Strahan, S., Szopa, S., Sudo, K., Van Dingenen, R., Wild, O.,
Zeng, G., 2006. The global atmospheric environment for the next generation.
Environ. Sci. Technol. 40, 3586–3594.
Donahue, N.M., 2011. The reaction that wouldn’t quit. Nat. Chem. 3, 98–99.
Elagöz, V., Manning, W.J., 2005. Factors affecting the effects of EDU on growth and
yield of field-grown bush beans (Phaseolus vulgaris L.), with varying degrees
of sensitivity to ozone. Environ. Pollut. 136, 385–395.
Emberson, L.D., Ashmore, M.R., Simpson, D., Tuovinen, J.-P., Cambridge, H.M.,
2001. Modelling and mapping ozone deposition in Europe. Water. Air. Soil
Pollut. 130, 577–582.
Emberson, L.D., Büker, P., Ashmore, M.R., Mills, G., Jackson, L.S., Agrawal, M.,
Atikuzzaman, M.D., Cinderby, S., Engardt, M., Jamir, C., Kobayashi, K., Oanh,
N.T.K., Quadir, Q.F., Wahid, A., 2009. A comparison of North American and
Asian exposure-response data for ozone effects on crop yields. Atmos.
Environ. 43, 1945–1953.
Emberson, L.D., Pleijel, H., Ainsworth, E.A., Berg, M. Van Den, Ren, W., Osborne,
S., Mills, G., Pandey, D., Dentener, F., Büker, P., Ewert, F., Koeble, R.,
Dingenen, R. Van, 2018. Ozone effects on crops and consideration in crop
models. Eur. J. Agron. 1-16.
FAOSTAT, 2018. FAO statistical databases. available at: http://www.fao.org/faostat/
en/#data (accessed on 15 August 2018)
References
30
Feng, Z., Hu, E., Wang, X., Jiang, L., Liu, X., 2015. Ground-level O3 pollution and its
impacts on food crops in China: A review. Environ. Pollut. 199, 42–48.
Feng, Z., Kobayashi, K., 2009. Assessing the impacts of current and future
concentrations of surface ozone on crop yield with meta-analysis. Atmos.
Environ. 43, 1510–1519.
Feng, Z., Uddling, J., Tang, H., Zhu, J., Kobayashi, K., 2018. Comparison of crop
yield sensitivity to ozone between open-top chamber and free-air experiments.
Glob. Chang. Biol. 24, 2231–2238.
Feng, Z., Wang, S., Szantoi, Z., Chen, S., Wang, X., 2010. Protection of plants from
ambient ozone by applications of ethylenediurea (EDU): A meta-analytic
review. Environ. Pollut. 158, 3236–3242.
Fiscus, E.L., Booker, F.L., Burkey, K.O., 2005. Crop responses to ozone: Uptake,
modes of action, carbon assimilation and partitioning. Plant, Cell Environ. 28,
997–1011.
Frei, M., 2015. Breeding of ozone resistant rice: Relevance, approaches and
challenges. Environ. Pollut. 197, 144–155.
Frei, M., Kohno, Y., Tietze, S., Jekle, M., Hussein, M.A., Becker, T., Becker, K., 2012.
The response of rice grain quality to ozone exposure during growth depends
on ozone level and genotype. Environ. Pollut. 163, 199–206.
Frei, M., Tanaka, J.P., Chen, C.P., Wissuwa, M., 2010. Mechanisms of ozone
tolerance in rice: Characterization of two QTLs affecting leaf bronzing by gene
expression profiling and biochemical analyses. J. Exp. Bot. 61, 1405–1417.
Frei, M., Tanaka, J.P., Wissuwa, M., 2008. Genotypic variation in tolerance to
elevated ozone in rice: Dissection of distinct genetic factors linked to tolerance
mechanisms. J. Exp. Bot. 59, 3741–3752.
Fuhrer, J., Val Martin, M., Mills, G., Heald, C.L., Harmens, H., Hayes, F., Sharps, K.,
Bender, J., Ashmore, M.R., 2016. Current and future ozone risks to global
terrestrial biodiversity and ecosystem processes. Ecol. Evol. 1–15.
Gatta, L., Mancino, L., Federico, R., 1997. Translocation and persistence of EDU
(ethylenediurea) in plants: The relationship with its role in ozone damage.
Environ. Pollut. 96, 445–448.
Godzik, B., Manning, W.J., 1998. Relative effectiveness of ethylenediurea, and
constitutent amounts of urea and phenylurea in ethylenediurea, in prevention
of ozone injury to tobacco. Environ. Pollut. 103, 1–6.
References
31
Gregorio, G.B., Senadhira, D., Mendoza, R.D., Manigbas, N.L., Roxas, J.P., Guerta,
C.Q., 2002. Progress in breeding for salinity tolerance and associated abiotic
stresses in rice. F. Crop. Res. 76, 91–101.
Gupta, S.K., Sharma, M., Majumder, B., Maurya, V.K., Lohani, M., Deeba, F.,
Pandey, V., 2018. Impact of Ethylene diurea (EDU) on growth, yield and
proteome of two winter wheat varieties under high ambient ozone
phytotoxicity. Chemosphere 196, 161–173.
Haagen-Smit, A.J., 1952. Chemistry and Physiology of Los Angeles Smog. Ind. Eng.
Chem. 44, 1342–1346.
Haagen-Smit, A.J., Fox, M.M., 1954. Photochemical ozone formation with
hydrocarbons and automobile exhaust. Air Repair 4, 105–136.
Heagle, A.S., Body, D.E., Heck, W.W., 1973. An open-top field chamber to assess
the impact of air pollution on plants. J. Environ. Qual. 2, 365–368.
Heggestad, H.E., Middleton, J.T., 1959. Ozone in high concentrations as cause of
tobacco leaf Injury. Science 129, 208–210.
Horváth, L., Koncz, P., Móring, A., Nagy, Z., Pintér, K., Weidinger, T., 2017. An
attempt to partition stomatal and non-stomatal ozone deposition parts on a
short grassland. Boundary-Layer Meteorol. 1–24.
Huang, X., Kurata, N., Wei, X., Wang, Z.-X., Wang, A., Zhao, Q., Zhao, Y., Liu, K.,
Lu, H., Li, W., Guo, Y., Lu, Y., Zhou, C., Fan, D., Weng, Q., Zhu, C., Huang,
T., Zhang, L., Wang, Y., Feng, L., Furuumi, H., Kubo, T., Miyabayashi, T.,
Yuan, X., Xu, Q., Dong, G., Zhan, Q., Li, C., Fujiyama, A., Toyoda, A., Lu, T.,
Feng, Q., Qian, Q., Li, J., Han, B., 2012a. A map of rice genome variation
reveals the origin of cultivated rice. Nature 490, 497–501.
Hurd, P.J., Nelson, C.J., 2009. Advantages of next-generation sequencing versus the
microarray in epigenetic research. Briefings Funct. Genomics Proteomics 8,
174–183.
IPCC, 2014. Intergovernmental Panel on Climate Change 2014-Mitigation of climate
change. IPCC 5th assessment report, Bonn, Germany.
IRRI Ricepedia, 2018. International Rice Research Institute Ricepedia. Retrieved
from http://ricepedia.org/
Jain, S.L., Arya, B.C., Kumar, A., Ghude, S.D., Kulkarni, P.S., 2005. Observational
study of surface ozone at New Delhi, India. Int. J. Remote Sens. 26, 3515–
3524.
References
32
Jing, L., Dombinov, V., Shen, S., Wu, Y., Yang, L., Wang, Y., Frei, M., 2016.
Physiological and genotype-specific factors associated with grain quality
changes in rice exposed to high ozone. Environ. Pollut. 210, 397–408.
Kanagendran, A., Pazouki, L., Li, S., Liu, B., Kännaste, A., Niinemets, Ü., 2017.
Ozone-triggered surface uptake and stress volatile emissions in Nicotiana
tabacum ‘Wisconsin.’ J. Exp. Bot. 69, 681–697.
Kangasjärvi, J., Jaspers, P., Kollist, H., 2005. Signalling and cell death in ozone-
exposed plants. Plant, Cell Environ. 28, 1021–1036.
Karlsson, P.E., Uddling, J., Braun, S., Broadmeadow, M., Elvira, S., Gimeno, B.S., Le
Thiec, D., Oksanen, E., Vandermeiren, K., Wilkinson, M., Emberson, L., 2004.
New critical levels for ozone effects on young trees based on AOT40 and
simulated cumulative leaf uptake of ozone. Atmos. Environ. 38, 2283–2294.
Kobayashi, K., 2015. FACE-ing the challenges of increasing surface ozone
concentration in Asia. J. Agric. Meteorol. 71, 161–166.
Kovach, M.J., Sweeney, M.T., McCouch, S.R., 2007. New insights into the history of
rice domestication. Trends Genet. 23, 578–587.
Krasensky, J., Carmody, M., Sierla, M., Kangasjärvi, J., 2017. Ozone and reactive
oxygen species, In: eLS. John Wiley & Sons, Ltd: Chichester, UK. 1–9.
Lal, S., Venkataramani, S., Naja, M., Kuniyal, J.C., Mandal, T.K., Bhuyan, P.K.,
Kumari, K.M., Tripathi, S.N., Sarkar, U., Das, T., Swamy, Y.V., Gopal, K.R.,
Gadhavi, H., Kumar, M.K.S., 2017. Loss of crop yields in India due to surface
ozone: an estimation based on a network of observations. Environ. Sci. Pollut.
Res. 24, 20972–20981.
Lei, H., Wuebbles, D.J., Liang, X.-Z., 2012. Projected risk of high ozone episodes in
2050. Atmos. Environ. 59, 567–577.
Li, J.Y., Wang, J., Zeigler, R.S., 2014. The 3,000 rice genomes project: new
opportunities and challenges for future rice research. Gigascience 3, 8.
Li, P., Feng, Z., Catalayud, V., Yuan, X., Xu, Y., Paoletti, E., 2017. A meta-analysis
on growth, physiological and biochemical responses of woody species to
ground-level ozone highlights the role of plant functional types. Plant. Cell
Environ. 2369–2380.
References
33
Li, S., Tosens, T., Harley, P.C., Jiang, Y., Kanagendran, A., Grosberg, M., Jaamets,
K., Niinemets, Ü., 2018. Glandular trichomes as a barrier against atmospheric
oxidative stress: Relationships with ozone uptake, leaf damage, and emission
of LOX products across a diverse set of species. Plant. Cell Environ. 1–15.
Maas, R. P., & Grennfelt, R. P. (2016). Towards cleaner air. Scientific assessment
report 2016. EMEP steering body and working group on effects of the
convention on long range transboundary air pollution, UNECE.
Macháčová, K., 2010. Open top chamber and free air CO2 Enrichment - approaches
to investigate tree responses to elevated CO2. IForest 3, 102–105.
Manning, W.J., Paoletti, E., Sandermann, H., Ernst, D., 2011. Ethylenediurea (EDU):
A research tool for assessment and verification of the effects of ground level
ozone on plants under natural conditions. Environ. Pollut. 159, 3283–3293.
McCouch, S.R., Wright, M.H., Tung, C.-W., Maron, L.G., McNally, K.L., Fitzgerald,
M., Singh, N., DeClerck, G., Agosto-Perez, F., Korniliev, P., Greenberg, A.J.,
Naredo, M.E.B., Mercado, S.M.Q., Harrington, S.E., Shi, Y., Branchini, D.A.,
Kuser-Falcão, P.R., Leung, H., Ebana, K., Yano, M., Eizenga, G., McClung,
A., Mezey, J., 2016. Open access resources for genome-wide association
mapping in rice. Nat. Commun. 7, 10532.
Middleton, J.T., Kendrick, J.B.J., Schwalm, H.W., 1950. Injury to herbaceous plants
by smog or air pollution. Plant Dis. 32.
Mills, G., Pleijel, H., Braun, S., Büker, P., Bermejo, V., Calvo, E., Danielsson, H.,
Emberson, L., Fernández, I.G., Grünhage, L., Harmens, H., Hayes, F.,
Karlsson, P.-E., Simpson, D., 2011. New stomatal flux-based critical levels for
ozone effects on vegetation. Atmos. Environ. 45, 5064–5068.
Mills, G., Sharps, K., Simpson, D., Pleijel, H., Frei, M., Burkey, K., Emberson, L.,
Uddling, J., Broberg, M., Feng, Z., Kobayashi, K., Agrawal, M., 2018. Closing
the global ozone yield gap: Quantification and cobenefits for multistress
tolerance. Glob. Chang. Biol. 1–26.
Morgan, P.B., Bernacchi, C.J., Ort, D.R., Long, S.P., 2004. An in vivo analysis of the
effect of season-long open-air elevation of ozone to anticipated 2050 levels on
photosynthesis in soybean. Plant Physiol. 135, 2348–2357.
Musselman, R.C., Lefohn, A.S., Massman, W.J., Heath, R.L., 2006. A critical review
and analysis of the use of exposure and flux-based ozone indices for
predicting vegetation effects. Atmos. Environ. 40, 1869–1888.
References
34
Oksanen, E., 2018. Trichomes form an important first line of defence against adverse
environment new evidence for ozone stress mitigation. Plant. Cell Environ.
41(7):1497-1499
Oksanen, E., Pandey, V., Pandey, A.K., Keski-Saari, S., Kontunen-Soppela, S.,
Sharma, C., 2013. Impacts of increasing ozone on Indian plants. Environ.
Pollut. 177, 189–200.
Pandey, A.K., Majumder, B., Keski-Saari, S., Kontunen-Soppela, S., Mishra, A.,
Sahu, N., Pandey, V., Oksanen, E., 2015. Searching for common responsive
parameters for ozone tolerance in 18 rice cultivars in India: Results from
ethylenediurea studies. Sci. Total Environ. 532, 230–238.
Pandey, A.K., Majumder, B., Keski-Saari, S., Kontunen-Soppela, S., Pandey, V.,
Oksanen, E., 2014. Differences in responses of two mustard cultivars to
ethylenediurea (EDU) at high ambient ozone concentrations in India. Agric.
Ecosyst. Environ. 196, 158–166.
Paoletti, E., Carriero, G., 2016. A new-generation 3D ozone FACE (Free Air
Controlled Exposure). Sci. Total Environ. 21–25.
Paoletti, E., Castagna, A., Ederli, L., Pasqualini, S., Ranieri, A., Manning, W.J., 2014.
Gene expression in snapbeans exposed to ozone and protected by
ethylenediurea. Environ. Pollut. 193, 1–5.
Paoletti, E., Contran, N., Manning, W.J., Ferrara, A.M., 2009. Use of the antiozonant
ethylenediurea (EDU) in Italy: Verification of the effects of ambient ozone on
crop plants and trees and investigation of EDU’s mode of action. Environ.
Pollut. 157, 1453–1460.
Paoletti, E., Manning, W.J., Spaziani, F., Tagliaferro, F., 2007. Gravitational infusion
of ethylenediurea (EDU) into trunks protected adult European ash trees
(Fraxinus excelsior L.) from foliar ozone injury. Environ. Pollut. 145, 869–873.
Pasqualini, S., Paoletti, E., Cruciani, G., Pellegrino, R., Ederli, L., 2016. Effects of
different routes of application on ethylenediurea persistence in tobacco leaves,
Environmental Pollution.
Piikki, K., De Temmerman, L., Högy, P., Pleijel, H., 2008. The open-top chamber
impact on vapour pressure deficit and its consequences for stomatal ozone
uptake. Atmos. Environ. 42, 6513–6522.
Pleijel, H., 2011. Reduced ozone by air filtration consistently improved grain yield in
wheat. Environ. Pollut. 159, 897–902.

References
35
Pleijel, H., Danielsson, H., Ojanperä, K., Temmerman, L.D., Högy, P., Badiani, M.,
Karlsson, P., 2004. Relationships between ozone exposure and yield loss in
European wheat and potato a comparison of concentration and flux-based
exposure indices. Atmos. Environ. 38, 2259–2269.
Pozzer, A., Zimmermann, P., Doering, U.M., van Aardenne, J., Tost, H., Dentener, F.,
Janssens-Maenhout, G., Lelieveld, J., 2012. Effects of business-as-usual
anthropogenic emissions on air quality. Atmos. Chem. Phys. 12, 6915–6937.
Rai, R., Agrawal, M., Agrawal, S.B., 2010. Threat to food security under current levels
of ground level ozone: A case study for Indian cultivars of rice. Atmos. Environ.
44, 4272–4282.
Ran, L., Zhao, C., Geng, F., Tie, X., Tang, X., Peng, L., Zhou, G., Yu, Q., Xu, J.,
Guenther, A., 2009. Ozone photochemical production in urban Shanghai,
China: Analysis based on ground level observations. J. Geophys. Res. 114,
D15301.
Saitanis, C.J., Lekkas, D. V., Agathokleous, E., Flouri, F., 2015. Screening
agrochemicals as potential protectants of plants against ozone phytotoxicity.
Environ. Pollut. 197, 247–255.
Sawada, H., Kohno, Y., 2009. Differential ozone sensitivity of rice cultivars as
indicated by visible injury and grain yield. Plant Biol. 11, 70–75.
Shi, G., Yang, L., Wang, Y., Kobayashi, K., Zhu, J., Tang, H., Pan, S., Chen, T., Liu,
G., Wang, Y., 2009. Impact of elevated ozone concentration on yield of four
Chinese rice cultivars under fully open-air field conditions. Agric. Ecosyst.
Environ. 131, 178–184.
Simpson, D., Ashmore, M.R., Emberson, L., Tuovinen, J.-P., 2007. A comparison of
two different approaches for mapping potential ozone damage to vegetation. A
model study. Environ. Pollut. 146, 715–725.
Singh, A.A., Singh, S., Agrawal, M., Agrawal, S.B., 2015. Assessment of ethylene
diurea-induced protection in plants against ozone phytotoxicity. Rev. Environ.
Contam. Toxicol. 233:129-84.
Sugai, T., Kam, D.-G., Agathokleous, E., Watanabe, M., Kita, K., Koike, T., 2018.
Growth and photosynthetic response of two larches exposed to O3 mixing
ratios ranging from preindustrial to near future. Photosynthetica 56, 901–910.
References
36
Tai, A.P.K., Val Martin, M., 2017. Impacts of ozone air pollution and temperature
extremes on crop yields: Spatial variability, adaptation and implications for
future food security. Atmos. Environ. 169, 11–21.
Tang, H., Liu, G., Han, Y., Zhu, J., Kobayashi, K., 2011. A system for free-air ozone
concentration elevation with rice and wheat: Control performance and ozone
exposure regime. Atmos. Environ. 45, 6276–6282.
The Royal Society, 2008. Ground-level ozone in the 21st century: Future trends,
impacts and policy implications. The Royal Society, London.
Tiwari, S., 2017. Ethylenediurea as a potential tool in evaluating ozone phytotoxicity:
a review study on physiological, biochemical and morphological responses of
plants. Environ. Sci. Pollut. Res. 24, 14019–14039.
Tiwari, S., Rai, R., Agrawal, M., 2008. Annual and seasonal variations in tropospheric
ozone concentrations around Varanasi. Int. J. Remote Sens. 29, 4499–4514.
Tuazon, E.C., Atkinson, R., Aschmann, S.M., Arey, J., 1994. Kinetics and products of
the gas-phase reactions of O3 with amines and related compounds. Res.
Chem. Intermed. 20, 303–320.
Ueda, Y., Siddique, S., Frei, M., 2015. A novel gene, Ozone-responsive apoplastic
protein1, enhances cell death in ozone stress in rice. Plant Physiol. 169, 873–
889.
USDA, 2018. United States Department of Agriculture. Nutrient data laboratory.
Retrieved from https://ndb.nal.usda.gov/ndb/search/list
Van Dingenen, R., Dentener, F.J., Raes, F., Krol, M.C., Emberson, L., Cofala, J.,
2009. The global impact of ozone on agricultural crop yields under current and
future air quality legislation. Atmos. Environ. 43, 604–618.
Waldeck, N., Burkey, K., Carter, T., Dickey, D., Song, Q., Taliercio, E., 2017. RNA-
Seq study reveals genetic responses of diverse wild soybean accessions to
increased ozone levels. BMC Genomics 18, 498.
Wang, M., Yu, Y., Haberer, G., Marri, P.R., Fan, C., Goicoechea, J.L., Zuccolo, A.,
Song, X., Kudrna, D., Ammiraju, J.S.S., Cossu, R.M., Maldonado, C., Chen, J.,
Lee, S., Sisneros, N., de Baynast, K., Golser, W., Wissotski, M., Kim, W.,
Sanchez, P., Ndjiondjop, M.-N., Sanni, K., Long, M., Carney, J., Panaud, O.,
Wicker, T., Machado, C.A., Chen, M., Mayer, K.F.X., Rounsley, S., Wing, R.A.,
2014. The genome sequence of African rice (Oryza glaberrima) and evidence
for independent domestication. Nat. Genet. 46, 982–988.
References
37
Wang, W., Mauleon, R., Hu, Z., Chebotarov, D., Tai, S., Wu, Z., Li, M., Zheng, T.,
Fuentes, R.R., Zhang, F., Mansueto, L., Copetti, D., Sanciangco, M., Palis,
K.C., Xu, J., Sun, C., Fu, B., Zhang, H., Gao, Y., Zhao, X., Shen, F., Cui, X.,
Yu, H., Li, Z., Chen, M., Detras, J., Zhou, Y., Zhang, X., Zhao, Y., Kudrna, D.,
Wang, C., Li, R., Jia, B., Lu, J., He, X., Dong, Z., Xu, J., Li, Y., Wang, M., Shi,
J., Li, J., Zhang, D., Lee, S., Hu, W., Poliakov, A., Dubchak, I., Ulat, V.J.,
Borja, F.N., Mendoza, J.R., Ali, J., Li, J., Gao, Q., Niu, Y., Yue, Z., Naredo,
M.E.B., Talag, J., Wang, X., Li, J., Fang, X., Yin, Y., Glaszmann, J.-C., Zhang,
J., Li, J., Hamilton, R.S., Wing, R.A., Ruan, J., Zhang, G., Wei, C., Alexandrov,
N., McNally, K.L., Li, Z., Leung, H., 2018. Genomic variation in 3,010 diverse
accessions of Asian cultivated rice. Nature 557, 43–49.
Wang, X., Mauzerall, D.L., 2004. Characterizing distributions of surface ozone and its
impact on grain production in China, Japan and South Korea: 1990 and 2020.
Atmos. Environ. 38, 4383–4402.
Wang, X., Zhang, Q., Zheng, F., Zheng, Q., Yao, F., Chen, Z., Zhang, W., Hou, P.,
Feng, Z., Song, W., Feng, Z., Lu, F., 2012. Effects of elevated O3
concentration on winter wheat and rice yields in the Yangtze River Delta,
China. Environ. Pollut. 171, 118–125.
Wang, Y., Yang, L., Höller, M., Zaisheng, S., Pariasca-Tanaka, J., Wissuwa, M., Frei,
M., 2014. Pyramiding of ozone tolerance QTLs OzT8 and OzT9 confers
improved tolerance to season-long ozone exposure in rice. Environ. Exp. Bot.
104, 26–33.
Wang, Z., Gerstein, M., Snyder, M., 2009. RNA-Seq: a revolutionary tool for
transcriptomics. Nat. Rev. Genet. 10, 57–63.
Wilkinson, S., Mills, G., Illidge, R., Davies, W.J., 2012. How is ozone pollution
reducing our food supply? J. Exp. Bot. 63, 527–536.
Williams, J.E., Hodnebrog, Ø., Van Velthoven, P.F.J., Berntsen, T.K., Dessens, O.,
Gauss, M., Grewe, V., Isaksen, I.S.A., Olivié, D., Prather, M.J., Tang, Q.,
2014. The influence of future non-mitigated road transport emissions on
regional ozone exceedences at global scale. Atmos. Environ. 89, 633–641.
WMO, 2014. World Meteorological Organization. Assessment for decision-makers:
scientific assessment of ozone depletion: Global ozone research and
monitoring project—report no. 56, Geneva, Switzerland.
References
38
Xin, Y., Yuan, X., Shang, B., Manning, W.J., Yang, A., Wang, Y., Feng, Z., 2016.
Moderate drought did not affect the effectiveness of ethylenediurea (EDU) in
protecting Populus cathayana from ambient ozone. Sci. Total Environ. 569–
570, 1536–1544.
Yamaguchi, M., Hoshino, D., Inada, H., Akhtar, N., Sumioka, C., Takeda, K., Izuta,
T., 2014. Evaluation of the effects of ozone on yield of Japanese rice (Oryza
sativa L.) based on stomatal ozone uptake. Environ. Pollut. 184, 472–480.
Yendrek, C.R., Koester, R.P., Ainsworth, E.A., 2015. A comparative analysis of
transcriptomic, biochemical, and physiological responses to elevated ozone
identifies species-specific mechanisms of resilience in legume crops. J. Exp.
Bot. 66, 7101–7112.
Zhang, L., Xu, B., Wu, T., Wen, M., Fan, L., Feng, Z., Paoletti, E., 2017.
Transcriptomic analysis of Pak Choi under acute ozone exposure revealed
regulatory mechanism against ozone stress. BMC Plant Biol. 17, 236.
Ziemke, J.R., Chandra, S., Duncan, B.N., Froidevaux, L., Bhartia, P.K., Levelt, P.F.,
Waters, J.W., 2006. Tropospheric ozone determined from Aura OMI and MLS:
Evaluation of measurements and comparison with the Global Modeling
Initiative’s Chemical Transport Model. J. Geophys. Res. 111, D19303.
Publications
39
6 Publications
6.1 Ashrafuzzaman, M., Lubna, F. A., Holtkamp, F., Manning, W. J., Kraska,
T., & Frei, M. (2017). Diagnosing ozone stress and differential tolerance in rice
(Oryza sativa L.) with ethylenediurea (EDU). Environmental Pollution, 230,
339–350.
Own contribution: Leading the experiment and carried out whole work with the help of F.H. and F.A.L.
and partly contributed in the conceptual design. I prepared all tables, figures and graphs. I interpreted
the data and wrote the manuscript with the help of M.F. The manuscript was revised by M.F. and all
other co-authors.
6.2 Ashrafuzzaman M., Haque Z., Ali B., Mathew B., Yu P., Hochholdinger
F., … Frei M. (2018) Ethylenediurea (EDU) mitigates the negative effects of
ozone in rice: insights into its mode of action. Plant, Cell & Environment. 1-17.
Own contribution: I carried out all the experiments with the help of Z.H. and partly contributed in the
conceptual design. I prepared all tables, figures and graphs. I interpreted the data and wrote the
manuscript with the help of M.F. RNA-Seq data analysis contributed by P.Y. and H.J.E. contributed to
scanning electron microscopy. The manuscript was revised by M.F. and all other co-authors.
Publications
40
Diagnosing ozone stress and differential tolerance in rice (Oryza sativa L.) with
ethylenediurea (EDU)
Ashrafuzzaman, M., Lubna, F. A., Holtkamp, F., Manning, W. J., Kraska, T., & Frei, M.
Environmental Pollution, 2017, 230, 339–350
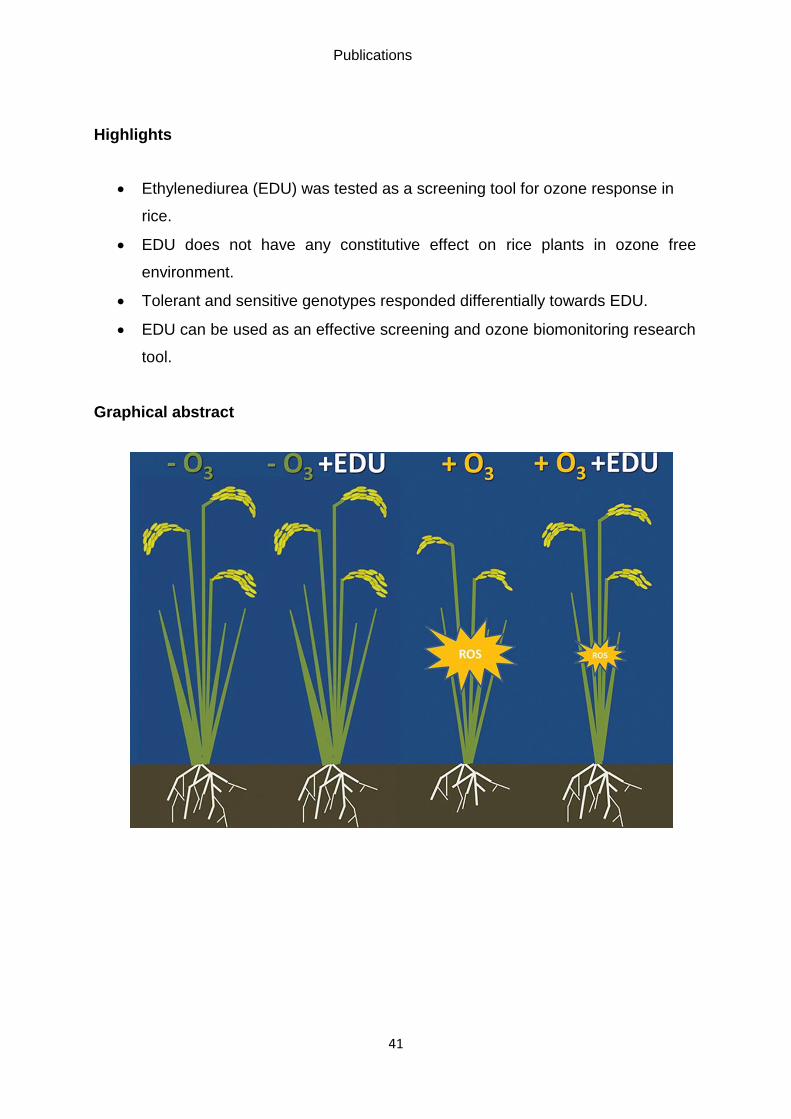
Publications
41
Highlights
Ethylenediurea (EDU) was tested as a screening tool for ozone response in
rice.
EDU does not have any constitutive effect on rice plants in ozone free
environment.
Tolerant and sensitive genotypes responded differentially towards EDU.
EDU can be used as an effective screening and ozone biomonitoring research
tool.
Graphical abstract
lable at ScienceDirect
Environmental Pollution 230 (2017) 339e350
Contents lists avai
Environmental Pollution
journal homepage: www.elsevier .com/locate/envpol
Diagnosing ozone stress and differential tolerance in rice (Oryza sativaL.) with ethylenediurea (EDU)*
Md. Ashrafuzzaman a, b, Farzana Afrose Lubna a, Felix Holtkamp a, William J. Manning c,Thorsten Kraska d, Michael Frei a, *
a Institute of Crop Sciences and Resource Conservation (INRES) Plant Nutrition, University of Bonn, Bonn, Germanyb Department of Genetic Engineering and Biotechnology, Shahjalal University of Science and Technology, Sylhet, Bangladeshc Stockbridge School of Agriculture, University of Massachusetts, USAd Field Lab Campus Klein-Altendorf, University of Bonn, Rheinbach, Germany
a r t i c l e i n f o
Article history:Received 27 March 2017Received in revised form12 May 2017Accepted 17 June 2017
Keywords:Air pollutionBreedingCerealsFood securityGlobal changePhenotyping
* This paper has been recommended for acceptanc* Corresponding author. INRES Plant Nutrition, Un
Kreiten Strasse 13, 53115 Bonn, Germany.E-mail address: [email protected] (M. Frei).
http://dx.doi.org/10.1016/j.envpol.2017.06.0550269-7491/© 2017 Elsevier Ltd. All rights reserved.
a b s t r a c t
Rising tropospheric ozone concentrations in Asia necessitate the breeding of adapted rice varieties toensure food security. However, breeding requires field-based evaluation of ample plant material, whichcan be technically challenging or very costly when using ozone fumigation facilities. The chemicalethylenediurea (EDU) has been proposed for estimating the effects of ozone in large-scale field appli-cations, but controlled experiments investigating constitutive effects on rice or its suitability to detectgenotypic differences in ozone tolerance are missing. This study comprised a controlled open topchamber experiment with four treatments (i) control (average ozone concentration 16 ppb), (ii) controlwith EDU application, (iii) ozone stress (average 77 ppb for 7 h daily throughout the season), and (iv)ozone stress with EDU application. Three contrasting rice genotypes were tested, i.e. the tolerant line L81and the sensitive Nipponbare and BR28. The ozone treatment had significant negative effects on plantgrowth (height and tillering), stomatal conductance, SPAD value, spectral reflectance indices such as thenormalized difference vegetation index (NDVI), lipid peroxidation, as well as biomass and grain yields.These negative effects were more pronounced in the a priori sensitive varieties, especially the widelygrown Bangladeshi variety BR28, which showed grain yield reductions by 37 percent. EDU applicationhad almost no effects on plants in the absence of ozone, but partly mitigated ozone effects on foliarsymptoms, lipid peroxidation, SPAD value, stomatal conductance, several spectral reflectance parame-ters, panicle number, grain yield, and spikelet sterility. EDU responses were more pronounced in sen-sitive genotypes than in the tolerant L81. In conclusion, EDU had no constitutive effects on rice and partlyoffset negative ozone effects, especially in sensitive varieties. It can thus be used to diagnose ozonedamage in field grown rice and for distinguishing tolerant (less EDU-responsive) and sensitive (moreEDU-responsive) genotypes.
© 2017 Elsevier Ltd. All rights reserved.
1. Introduction
Tropospheric ozone (O3) poses a major emerging threat toglobal crop production due to its high phytotoxicity (Tai et al., 2014;Agathokleous et al., 2015a; Ainsworth, 2016). It is one of the mostwidespread secondary air pollutants, formed through photo-chemical reactions of precursor gases such as nitrous oxides,
e by Dr. Yong Sik Ok.iversity of Bonn, Karlrobert-
volatile organic compounds, carbon monoxide and methane (TheRoyal Society, 2008; Paoletti et al., 2014). Detrimental effects ofcurrent ambient ozone levels on vegetation including crop growthand yields have been estimated to cause global economic losses inthe range of 14e26 billion US$ (Ashmore, 2005; Feng andKobayashi, 2009; Van Dingenen et al., 2009; Mills and Harmens,2011; Avnery et al., 2013). In addition, several model projectionspredicted that East and South Asian developing countries(including Bangladesh) will be most strongly affected by tropo-spheric ozone in the coming decades due to insufficient environ-mental legislation, rapid economic growth and industrialdevelopment (Emberson et al., 2009; Van Dingenen et al., 2009;
Md. Ashrafuzzaman et al. / Environmental Pollution 230 (2017) 339e350340
Avnery et al., 2011; Pozzer et al., 2012; IPCC, 2014). Among the tenmost populated countries in the world, the change in dailymaximum average ozone concentration was the highest (21.3%) inBangladesh, between 1990 (59.4 ppb) and 2013 (72.0 ppb) (Braueret al., 2016). This trend occurred due to higher emission of ozoneprecursor gases (Chakraborty et al., 2015; Brauer et al., 2016) arisingfrom unprecedented increases of motor vehicles, conventionalbrick-making kilns, and fossil fuels combustion without any regu-lation, in combination with favorable climatic conditions for ozoneformation (Akhtar et al., 2010).
Ozone adversely affects crop productivity directly throughoxidative damage to cells and indirectly as a greenhouse gasaccelerating global warming (Ainsworth, 2016). Rice is the mostimportant staple food crop in Asia, including Bangladesh (Akhtaret al., 2010; Alexandratos and Bruinsma, 2012), the 4th largestrice growing country globally (FAOSTAT, 2013). An estimated 3.7%of global and more than 10% of regional rice yields are lost due torising ozone, which will exacerbate in near future with furtherincreases in ozone levels (Ainsworth, 2008; Van Dingenen et al.,2009; Frei, 2015). In South Asia rice is cultivated almost yearround with two major seasons, and both growing seasons canoverlap with the peak ambient ozone episodes (Frei, 2015).Although no field studies have been done so far to determine ozoneimpacts on rice production, significant yield reduction of Bangla-deshi rice cultivars have been reported in controlled environmentsystems due to elevated ozone (chronic stress, ozone concentrationwas 60 and 100 ppb) (Akhtar et al., 2010). Therefore, it is essentialto develop an effective and reliable research tool which can be usedto quantify ozone impacts in the field and to screen a wide range ofgenotypes grown in ozone affected developing areas such asBangladesh.
Three types of experimental systems have been used so far forthe quantification of ozone impacts on plants: sun-lit plant growthchambers, open top chambers (OTC) and free air concentrationenrichment (FACE) (Frei, 2015; Kobayashi, 2015). Sun-lit plantgrowth chambers are environmentally controlled chambers inwhich ozone concentrations can be maintained at desired levels forthe purpose of better understanding mechanism of ozone damage(Kobayashi, 2015). OTC were first introduced in the early 1970s byHeagle et al. (1973), and are widely used controlled-environmentsystems, in which ozone concentrations are maintained at desiredlevels with artificially generated air blowing ozone into thechambers (Frei, 2015). They have been criticized for causing a‘chamber effect’ thereby modifying the ozone impacts by changingthe microclimate (especially, temperature, humidity, CO2 concen-tration), which can differ from the field conditions (Morgan et al.,2006; Piikki et al., 2008; Kobayashi, 2015). Another promisingand more realistic approach is free air concentration enrichment(FACE), a chamber-less system for evaluating plant performance infield conditions (Morgan et al., 2004). Despite that, only few studieshave been conducted so far with FACE-ozone systems, for examplein the USA for soybean (Morgan et al., 2004) and in China for riceand wheat (Shi et al., 2009; Feng et al., 2011, 2016; Tang et al., 2011).Maintaining FACE experiments is expensive, technically chal-lenging and laborious (Frei, 2015). Therefore, this approach is lesssuitable for developing countries such as Bangladesh due to lack ofreliable electricity and infrastructure facilities (Oksanen et al., 2013;Kobayashi, 2015). FACE also has the limitation that it only comparesambient to elevated ozone levels, but unlike chamber experimentsoffers no possibility of estimating effects of current ambient ozonelevels (Pleijel, 2011).
As an alternative to FACE systems, a synthetic chemical, ethyl-enediurea (N-[2-(2-oxo-1-imidazolidinyl) ethyl]-N'-phenylurea,abbreviated as EDU) also termed as antiozonant, has been proposedto evaluate the differential responses of plants and crop species
towards ozone damage (Paoletti et al., 2009; Feng et al., 2010;Manning et al., 2011; Agathokleous et al., 2015b). The EDU pro-tection against ozone injury was first reported in bean plants(Carnahan et al., 1978). However, the actual mode of action andprevention mechanisms of EDU against phytotoxic effects of ozonestill remain elusive (Paoletti et al., 2009; Manning et al., 2011). It issuggested that EDU may facilitate the scavenging of detrimentalozone activity through a direct effect on physiological parameters,or by antioxidant-mediated defense reactions (Manning et al.,2011; Pandey et al., 2015). As EDU can be applied flexibly byspraying on plants, it may constitute a convenient tool to screen alarge number of rice genotypes in field experiments. However, thisapproach assumes that EDU has an ozone-specific, but no consti-tutive effect on plants. With few exceptions (such as a study onclover by Karlsson et al., 1995) most EDU studies have been con-ducted in ambient ozone conditions without any ozone-free con-trol. Therefore, prior to the use in large scale field experiments,specific EDU doses applied to crops should be validated to mitigateozone effects, without having any effects on plants in the absence ofozone.
To this end, the current study was designed to test contrastingrice genotypes (two a priori ozone sensitive and one ozone-tolerant), and to explore the constitutive effect of EDU in theabsence or presence of ozone on physiological parameters, growthand rice yield components. Our specific hypotheses were that (i)EDUwill play an important role in protecting ozone-stressed plantsagainst phytotoxicity without any constitutive effect, i.e. controlplants will not be responsive towards EDU; (ii) ozone sensitivegenotypes will be more responsive towards EDU in presence ofozone than the tolerant genotype.
2. Materials and methods
2.1. Plant materials and growth condition
The experiment was carried out in a climate controlled glass-house near Bonn (Campus Klein-Altendorf, University of Bonn),Germany, from April to October 2016. Three different rice geno-types were used for this study (i) Nipponbare (NB), an ozone sen-sitive Japanese modern rice variety (Jing et al., 2016) (ii) L81, anozone tolerant introgression line (Wang et al., 2014), which carriestwo ozone tolerant quantitative trait loci (QTL) from the Aus land-race Kasalath (Frei et al., 2008, 2010) in the genetic background ofNB (iii) BRRI dhan28 (BR28), an ozone sensitive and high yieldingmodern rice variety developed by the Bangladesh Rice ResearchInstitute, which is widely cultivated by Bangladeshi farmers(Akhtar et al., 2010). Seeds were germinated in the dark for 3 d at28 �C and then transferred to a glasshouse under natural light.Seedlings were placed in a mesh floating on solutions containing0.5 mM CaCl2 and 10 mM FeCl3 until transplantation. Three-week-old seedlings were transplanted into three experimental poldersmeasuring 6 m � 2 m filled with a local clay-silt luvisol soil with16% clay, 77% silt, 7% sand, 1.2% organic carbon and pH 6.3 (Uedaet al., 2015a). Constant water level of at least 3 cm was main-tained from 10 d after transplanting throughout the growth season.The polders were previously sealed with PVC sheets at 50 cm soildepth (Frei et al., 2016) and had been used for flooded rice culti-vation in three consecutive years before this experiment. Temper-ature and relative humidity were measured continuously at 2-minintervals (sensor type 224.401, RAMGmbHMess-und Regeltechnik,Herrsching, Germany), and CO2 was measured at 10-min intervals(sensor type GMT 222EONOAON1AOB, Vaisala, Helsinki, Finland),respectively. The average daytime (7.00 he19.00 h) and nighttime(19.00 he7.00 h) temperatures were 27.8 �C and 20.6 �C, averagerelative humidity was 54.5% and 81.8%, respectively. The average
Md. Ashrafuzzaman et al. / Environmental Pollution 230 (2017) 339e350 341
CO2 concentration was 455/578 ppm (day/night) respectively.Artificial lighting was installed above the plots to ensure a mini-mum photosynthetic photon flux density of 400 mmol m�2 s�1
during the daytime.Each polder (6m� 2m)was first subdivided into two 3m� 2m
areas assigned to control and ozone treatment, respectively, andfurther subdivided into 1-m2 subplots assigned to the individualgenotypes (in a total 36 subplots in 3 polders). Within each controland ozone treatment area, three subplots (one for each genotype)were assigned to the EDU treatment and three to non-EDU treat-ment. Seedlings were planted following the straight rowmethod at20 cm � 20 cm spacing leading to 25 plants of each genotype ineach subplot (IRRI, 2016). The middle 9 plants were used formeasuring final yields, whereas the border plants were used for thedestructive measurements (sample collection). To ensure sufficientnutrient supply, plants were provided with fertilizer at ratesequivalent to 40 kg K ha�1 and 21 kg P ha�1 to each polder as basalfertilizer at the beginning of the season, and 60 kg N ha�1 (as urea,applied in three splits as for basal, 20 and 40 days aftertransplanting ¼ DAT20 and DAT40). No chemical insecticides andpesticides were used during the whole growth period and weedswere uprooted manually.
The following treatments were implemented (i) Control, (ii)Control þ ethylenediurea (EDU), (iii) Elevated ozone, and (iv)Elevated ozone þ EDU. Each polder was surrounded by an open topchamber (1.30 m height) sealed with a transparent PVC sheet, withan additional sheet in the middle to separate control and ozonetreatments. Starting from five weeks after transplanting, half of thecontrol plants and half of the ozone treated plants were sprayedwith ethylenediurea (EDU) at a concentration of 300 ppm once aweek, as suggested in previous studies (Wang et al., 2007; Fenget al., 2010; Pandey et al., 2015). Weekly intervals were selectedto ensure continuous effects, as EDU was reported to persist in theleaf apoplast for eight days or more (Paoletti et al., 2009).Approximately, 0.188, 0.300 and 0.375 g EDU were sprayed weeklyper m�2 area (1 subplot) at the seedling, vegetative and repro-ductive growth stage of plants respectively, for complete saturationof canopies. Water was sprayed on the non-EDU treated plantsinstead of EDU.
2.2. Ozone treatment and monitoring
Five weeks after transplanting, ozone fumigation was started ata target level of 80 ppb for 7 h every day (9.00 he16.00 h) to inducechronic stress. Comparable ambient levels were reported in manyin Asian countries including Bangladesh, India and China (Yamajiet al., 2006; Feng et al., 2015; Frei, 2015). Ozone was generated byusing custom-made ozone generators (UB 01; Gemke TechnikGmbH, Ennepetal, Germany), in which dried air was passedthrough silica gels as an input. The ozone output was regulated byan ozone monitor (K100 W; Dr A. Kuntze GmbH, Meerbusch, Ger-many) and detected by an ozone sensor (GE 760 ozone; Dr A.Kuntze GmbH) placed inside the fumigation chambers. Thegenerated ozone was first blown with a fan into a central plasticpipe, which was further connected with three parallel perforatedpipes running above the plant canopy at a distance of 40 cm fromeach other. The ozone concentrations in different areas of thepolders were monitored with an independent handheld ozonemonitor (series 500; Aeroqual Ltd. Auckland, New Zealand) at 5-min intervals. The actually measured average daytime ozone con-centration was 77 ppb ± 0.49 SE (standard error) in the ozonetreatment whereas the average concentration in control conditionswas 16 ppb ± 0.24 SE. The calculated AOT40 (accumulated exposureover a threshold of 40 ppb) values differed for the genotypes due todifferent harvest times and were 23.6, 30.6 and 33.7 ppm-h for
BR28, L81 and NB, respectively.Plant height (PH), tiller number (TN) and SPAD values were
measured in two-week intervals. A SPAD 502 instrument (KonicaMinolta, Osaka, Japan) was used for the SPAD value measurement.Three different points were measured at 20 cm distance from thetip of the last youngest fully expanded leaf of the three randomlyselected plants from each subplot and the average of the threepoints was calculated. Stomatal conductance measurements wereperformed in several time points representing different growthphases. Measurements on the youngest fully expanded leaves ofone selected plant in each sub-plot were performed on sunny daysbetween 9:30 h to 12:00 h using a leaf porometer (Model SC1,Decagon Devices, Pullman, WA). Spectral reflectance of leaves wasmeasured with a handheld spectro-radiometer PolyPen RP400(Photon Systems Instruments, Drasov, Czech Republic). The mea-surements were performed on the youngest fully expanded leavesof three randomly selected plants in each sub-plot on sunny days.Four vegetation indices were determined, (i) Normalized differencevegetation index (NDVI) ¼ (RNIR-RRED)/(RNIR þ RRED), (Rouse et al.,1974), (ii) Simple ratio index (SR) ¼ RNIR/RRED, (Jordan, 1969), (iii)Photochemical reflectance index (PRI) ¼ (R531- R570)/(R531þR570)(Pe~nuelas et al., 1995), and (iv) Anthocyanin reflectance index(ARI) ¼ (R550)�1 - (R700)�1 (Gitelson et al., 2001). In the vegetationindices, R refers to reflectance and subscript indicates the wave-bands in nanometers. For NIR and RED, we used a defined wavelength of 780 nm and 630 nm respectively.
Visible leaf symptoms of ozone stress were quantified at finalharvesting in the nine central plants of each subplot. The three ricegenotypes differed in maturity period and were harvested sepa-rately. A leaf bronzing score (LBS) ranging from 0 to 10was assignedto each plant to evaluate leaf symptoms (Ueda et al., 2015a), inwhich 0 indicated no ozone-induced symptoms in any of the leavesand the highest value 10 would indicate that the whole plant wasseverely damaged by ozone stress. For determination of biomassand yield components, the border plants were removed first andthe panicles of the middle 9 plants were counted, separated fromthe shoots and dried at 60 �C for at least 72 h to complete dryness.The shoot samples (straw) were also dried at 60 �C and weighed.The total weight (grain with panicles) was measured and grainswere separated from the panicles and weighed again for onlygrains. Thereafter, filled and unfilled spikelets were separatedmanually. Both filled and unfilled spikelets were counted using aseed counter (Chopin, Marcelin Berthelot, France). Grain sterilitywas calculated as the number of sterile spikelets relative to the totalnumber of spikelets. Thousand kernel weight (TKW)was calculatedfrom five subsamples of twenty randomly chosen kernels in eachsample. Harvest index was expressed as the percentage of filledgrains relative to total biomass. Finally, grain yield in kg per hectarewas extrapolated based on the 0.36 m2 area used for yielddetermination.
2.3. Biochemical assays
For biochemical measurements, the two youngest fullyexpanded leaves from randomly selected five border plants in eachsubplot were collected and pooled for one representative sample.Samples were taken twice in two different growth phases (vege-tative and flowering). The collection of samples was performed inone day between 10:00 h and 12:00 h with liquid nitrogen andstored at �80 �C until further analysis.
2.3.1. Malondialdehyde (MDA) quantificationThe amount of MDA was measured as described previously
(Hodges et al., 1999; H€oller et al., 2014) and used as an indicator ofoxidative stress. Extraction was performed from approximately
Md. Ashrafuzzaman et al. / Environmental Pollution 230 (2017) 339e350342
100 mg of ground tissues with 1.5 mL of 0.1% (w/v) Trichloroaceticacid (TCA). Samples were then centrifuged at 4 �C and 20.000 g for20 min and the supernatants were divided into two aliquots of500 mL. These were mixed with same amount of 20% (w/v) TCA,0.01% (w/v) 2,6-di-tert-butyl-4-methylphenol and 0.65% (w/v)thiobarbituric acid (TBA) was also added in one aliquot. Themixture was then heated to 95 �C for 30 min, and the absorbancemeasured at 440, 532, and 600 nm. Blank samples were also pre-pared with 0.1% (w/v) TCA solution instead of sample supernatant,and the absorbance was subtracted from each sample value.
2.3.2. Ascorbate (AsA) assayExtraction and quantification of AsA were performed according
to Ueda et al. (2013). The reduced AsA content was measured withthe addition of 10 mL of 0.01 units mL�1 ascorbate oxidase to amixture of 10 mL of extracted AsA and 80 mL of 0.1 M potassiumphosphate buffer (pH 7.0) at 265 nmwave length. The oxidized AsAcontent was measured at 265 nmwave length after the addition of10 mL of 4 mM dithiothreitol (DTT), a reducing agent to a mixture of10 mL of extracted AsA and 80 mL of 0.1 M potassium phosphatebuffer (pH 7.8). Based on the extinction coefficient ofε ¼ 14.3 mM�1 cm�1 the AsA content was calculated.
2.4. Statistical analysis
All statistical analyses including analysis of variance (ANOVA)were performed using a mixed model analysis in PROC MIXED ofSAS 9.4 (SAS Institute Inc. Cary, NC). A mixed model was designed(Piepho et al., 2003) with genotype, treatment and their interactionset as fixed effects, whereas polders and polder by genotype in-teractions were considered as random effects (Frei et al., 2011).Mean comparison was performed by Tukey's test for posthocadjustment, and P values less than 0.05 were considered assignificant.
3. Results
This section will focus on those traits which showed significantresponses to ozone and EDU as indicated by significant treatmenteffects and/or genotype by treatment interactions. Significant ef-fects were seen in 20 variables measured during the growth season(Table 1), and in six yield components (Table 2).
Due to differences in phenology, the three rice genotypes BR28,L81and NB were harvested at different time points at 127 DAT, 154DAT and 166 DAT respectively. As a visible representation ofoxidative stress, LBS showed highly significant effects on thetreatment, genotype and interaction level (Table 1). Analysis ofgenotype specific treatment responses revealed significant EDU-response in symptom formation only for the sensitive genotypesBR28 and NB (Fig. 1). Significant increases in MDA due to ozonewere seen in the sensitive genotypes BR28 and NB but not in thetolerant L81 (Fig. 2). Interestingly, EDU application mitigatedozone-induced lipid peroxidation as shown by significantly lowerMDA concentration in the ozone þ EDU treatment compared to theozone treatment, while no effect of EDU on MDA was seen in theabsence of ozone (Table 1, Fig. 2). Together these data demonstratedthat ozone caused oxidative stress in the sensitive rice genotypes,which was mitigated by the application of EDU. We did not observeany significant treatment effect or treatment by genotype interac-tion in total ascorbate measurements (Supplementary Fig. S1).
Averaged over all three genotypes, tiller number did notsignificantly respond to the treatment (Table 1), although signifi-cant negative ozone-responses were seen in the sensitive BR28 andNB (Fig. 3). Only NB showed significantly enhanced tiller numberdue to EDU application compared to the ozone treatment (Fig. 3A).
Similarly, a significant treatment main effect on plant height wasseen only on the last measuring day at DAT107, where ozonesignificantly reduced plant height (Table 1). The effects of ozonetreatment on plant height increased progressively leading to sig-nificant height reductions towards the end of the growth in eachgenotype (Fig. 3). Only the tolerant L81 showed a significantresponse to EDU in terms of plant height (Fig. 3). In summary, plantgrowth traits were negatively affected only after prolonged ozonefumigation and were more responsive in the sensitive genotypes,while EDU mitigated negative ozone effects in some instances.
On most measuring days, negative effects of ozone on physio-logical traits were observed. SPAD value was significantly lower inthe ozone treatment than in the control except for DAT95 (Table 1).On the last two measuring days, SPAD was significantly higher inEDU treated plants when compared to the ozone treatment(Table 1). Individual genotypes responded differently to the treat-ments. The sensitive BR28 exhibited an early negative response tothe ozone treatment and significant alleviation due to EDU appli-cation even on DAT66. Similar responses were only seen at DAT115and DAT133 in NB and L81 (Fig. 4A). Stomatal conductance wasmeasured as a proxy for photosynthetic gas exchange. The treat-ment main effects were significant or close to significant (DAT93),while a significant ozone-mitigating effect of EDU was seen only onDAT106 when values were averaged over all three genotypes(Table 1). Analysis of treatment responses in individual genotypesrevealed an early effect in BR28 at DAT93, followed by NB onDAT106, but only from DAT133 in L81. Positive effects of EDUapplication in the presence of ozone were seen in all three geno-types on different measuring days (Fig. 4B).
Vegetation indices NDVI and SR were measured as proxies forbroadband greenness (chlorophyll contents, foliage greenness), PRIand ARI for the estimation of photosynthetic light use efficiencyand stress related pigments (carotenoids and anthocyanins). Con-trasting treatment effects for the selected indices were seen onlyafter the plants were exposed to substantial amount of ozone atDAT109. Significant stress effects compared to control and (partial)recovery with the application of EDU were observed for all fourselected reflectance indices based on the averaged performances ofthe three genotypes (Table 1). However, the sensitive genotypesBR28 and NB showed more pronounced responses towards EDUapplication compared to tolerant L81 (Fig. 5). Specifically, theapplication of EDU significantly mitigated ozone effect in bothsensitive genotypes for the reflectance indices NDVI and SR (Fig. 5Aand B). On the other hand, EDU significantly alleviated ozone effectfor the indices PRI and ARI only for the sensitive genotype BR28(Fig. 5C and D). No effect of EDU on spectral reflectance wasdetected in the absence of ozone for all genotypes. Moreover, EDUdid not show any significant stress mitigation effect for the tolerantgenotype L81 for all selected reflectance indices (Fig. 5). In generalthese observations of growth and physiological traits clearly sug-gested that EDU did not play any role as a growth promoting orregulating agent in control plants but specifically mitigated nega-tive ozone effects on different measuring days in all genotypes,especially the sensitive ones.
After harvesting, several yield components were determined,six of which showed significant treatment effects due to declines inthe ozone treatment compared to the control (Table 2). Similar tomorphological and physiological traits, none of the yield parame-ters was affected by EDU application in the absence of ozone. Evenwithin the ozone treatments, EDU did not significantly improveyield components when the averages of all three genotypes werecompared (Table 2). However, this was different when the treat-ment responses of individual genotypes were observed (Fig. 6). Thesensitive BR28 showed negative responses to ozone in all yieldcomponents except thousand kernel weight, but also a significant
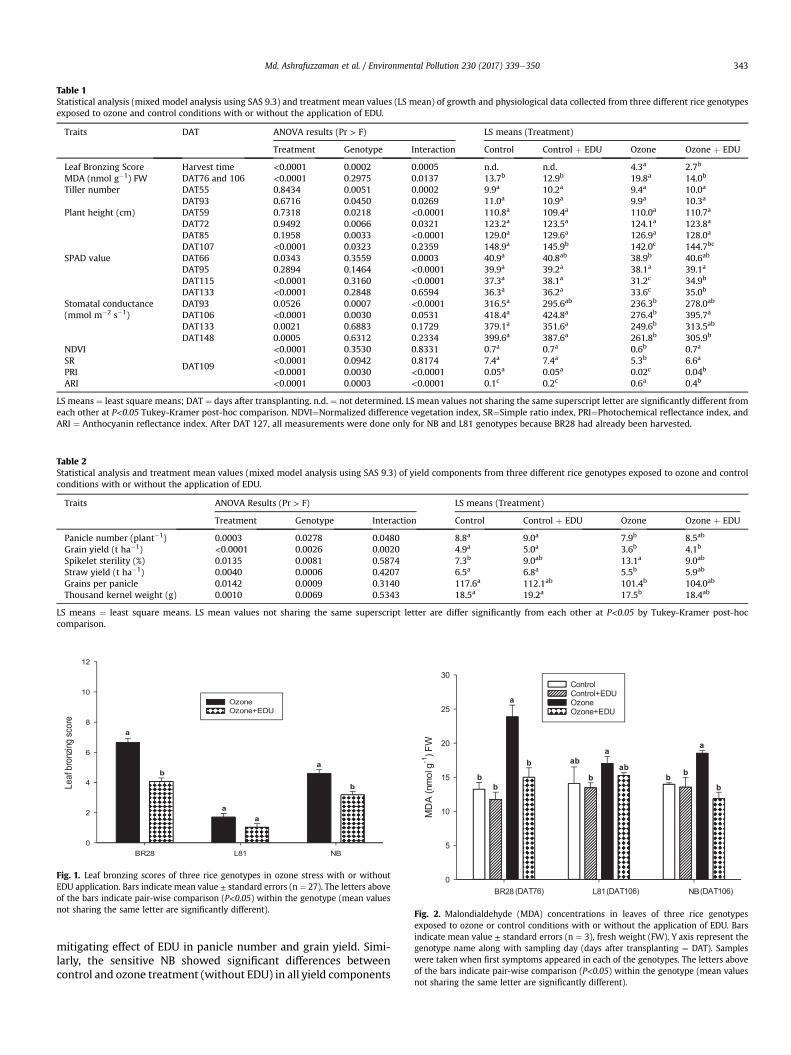
Table 1Statistical analysis (mixed model analysis using SAS 9.3) and treatment mean values (LS mean) of growth and physiological data collected from three different rice genotypesexposed to ozone and control conditions with or without the application of EDU.
Traits DAT ANOVA results (Pr > F) LS means (Treatment)
Treatment Genotype Interaction Control Control þ EDU Ozone Ozone þ EDU
Leaf Bronzing Score Harvest time <0.0001 0.0002 0.0005 n.d. n.d. 4.3a 2.7b
MDA (nmol g�1) FW DAT76 and 106 <0.0001 0.2975 0.0137 13.7b 12.9b 19.8a 14.0b
Tiller number DAT55 0.8434 0.0051 0.0002 9.9a 10.2a 9.4a 10.0a
DAT93 0.6716 0.0450 0.0269 11.0a 10.9a 9.9a 10.3a
Plant height (cm) DAT59 0.7318 0.0218 <0.0001 110.8a 109.4a 110.0a 110.7a
DAT72 0.9492 0.0066 0.0321 123.2a 123.5a 124.1a 123.8a
DAT85 0.1958 0.0033 <0.0001 129.0a 129.6a 126.9a 128.0a
DAT107 <0.0001 0.0323 0.2359 148.9a 145.9b 142.0c 144.7bc
SPAD value DAT66 0.0343 0.3559 0.0003 40.9a 40.8ab 38.9b 40.6ab
DAT95 0.2894 0.1464 <0.0001 39.9a 39.2a 38.1a 39.1a
DAT115 <0.0001 0.3160 <0.0001 37.3a 38.1a 31.2c 34.9b
DAT133 <0.0001 0.2848 0.6594 36.3a 36.2a 33.6c 35.0b
Stomatal conductance(mmol m�2 s�1)
DAT93 0.0526 0.0007 <0.0001 316.5a 295.6ab 236.3b 278.0ab
DAT106 <0.0001 0.0030 0.0531 418.4a 424.8a 276.4b 395.7a
DAT133 0.0021 0.6883 0.1729 379.1a 351.6a 249.6b 313.5ab
DAT148 0.0005 0.6312 0.2334 399.6a 387.6a 261.8b 305.9b
NDVI
DAT109
<0.0001 0.3530 0.8331 0.7a 0.7a 0.6b 0.7a
SR <0.0001 0.0942 0.8174 7.4a 7.4a 5.3b 6.6a
PRI <0.0001 0.0030 <0.0001 0.05a 0.05a 0.02c 0.04b
ARI <0.0001 0.0003 <0.0001 0.1c 0.2c 0.6a 0.4b
LS means ¼ least square means; DAT ¼ days after transplanting. n.d. ¼ not determined. LS mean values not sharing the same superscript letter are significantly different fromeach other at P<0.05 Tukey-Kramer post-hoc comparison. NDVI¼Normalized difference vegetation index, SR¼Simple ratio index, PRI¼Photochemical reflectance index, andARI ¼ Anthocyanin reflectance index. After DAT 127, all measurements were done only for NB and L81 genotypes because BR28 had already been harvested.
Table 2Statistical analysis and treatment mean values (mixed model analysis using SAS 9.3) of yield components from three different rice genotypes exposed to ozone and controlconditions with or without the application of EDU.
Traits ANOVA Results (Pr > F) LS means (Treatment)
Treatment Genotype Interaction Control Control þ EDU Ozone Ozone þ EDU
Panicle number (plant�1) 0.0003 0.0278 0.0480 8.8a 9.0a 7.9b 8.5ab
Grain yield (t ha�1) <0.0001 0.0026 0.0020 4.9a 5.0a 3.6b 4.1b
Spikelet sterility (%) 0.0135 0.0081 0.5874 7.3b 9.0ab 13.1a 9.0ab
Straw yield (t ha�1) 0.0040 0.0006 0.4207 6.5a 6.8a 5.5b 5.9ab
Grains per panicle 0.0142 0.0009 0.3140 117.6a 112.1ab 101.4b 104.0ab
Thousand kernel weight (g) 0.0010 0.0069 0.5343 18.5a 19.2a 17.5b 18.4ab
LS means ¼ least square means. LS mean values not sharing the same superscript letter are differ significantly from each other at P<0.05 by Tukey-Kramer post-hoccomparison.
BR28 L81 NB
Leaf
bro
nzing
scor
e
0
2
4
6
8
10
12
Ozone Ozone+EDU
a
b
aa
a
b
Fig. 1. Leaf bronzing scores of three rice genotypes in ozone stress with or withoutEDU application. Bars indicate mean value ± standard errors (n ¼ 27). The letters aboveof the bars indicate pair-wise comparison (P<0.05) within the genotype (mean valuesnot sharing the same letter are significantly different).
BR28 L81 NB
MD
A (n
mol
g-1
) FW
0
5
10
15
20
25
30Control Control+EDUOzone Ozone+EDU
(DAT76) (DAT106) (DAT106)
a
bb
ba
ab
bab
b
a
b
b
Fig. 2. Malondialdehyde (MDA) concentrations in leaves of three rice genotypesexposed to ozone or control conditions with or without the application of EDU. Barsindicate mean value ± standard errors (n ¼ 3), fresh weight (FW). Y axis represent thegenotype name along with sampling day (days after transplanting ¼ DAT). Sampleswere taken when first symptoms appeared in each of the genotypes. The letters aboveof the bars indicate pair-wise comparison (P<0.05) within the genotype (mean valuesnot sharing the same letter are significantly different).
Md. Ashrafuzzaman et al. / Environmental Pollution 230 (2017) 339e350 343
mitigating effect of EDU in panicle number and grain yield. Simi-larly, the sensitive NB showed significant differences betweencontrol and ozone treatment (without EDU) in all yield components
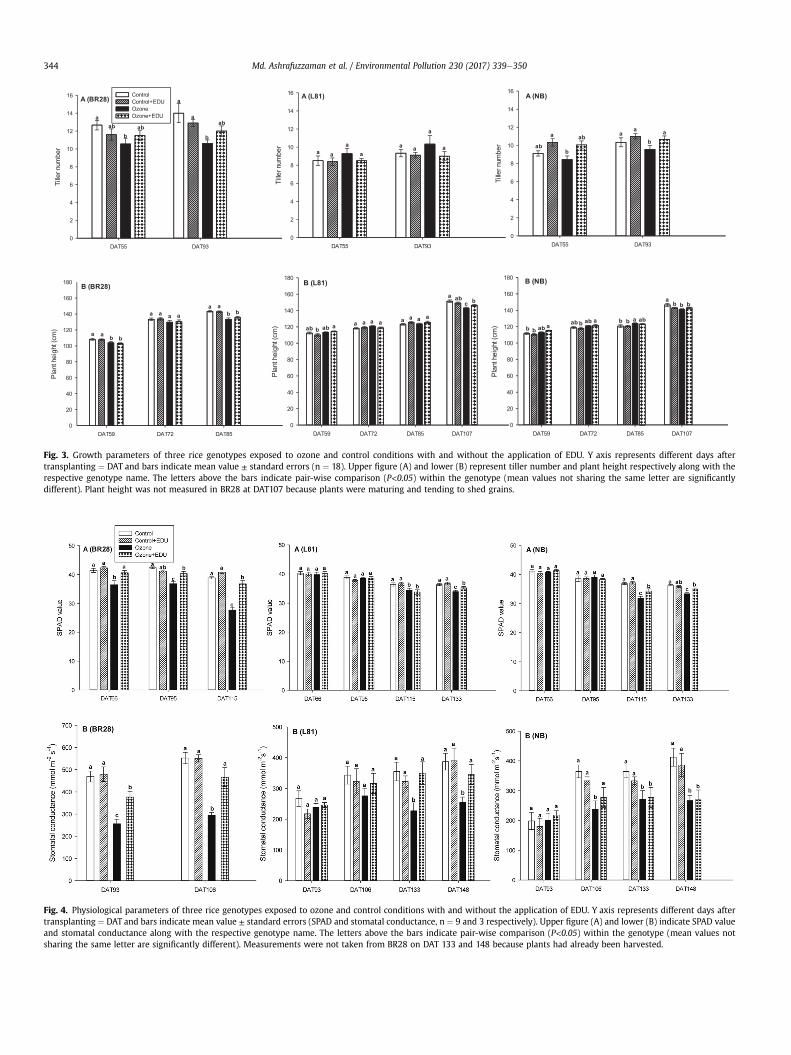
DAT59 DAT72 DAT85
Pla
nt h
eigh
t (cm
)
0
20
40
60
80
100
120
140
160
180 B (BR28)
a a b b
a a a aa a
b b
DAT55 DAT93
Tille
r num
ber
0
2
4
6
8
10
12
14
16 Control Control+EDU Ozone Ozone+EDU a
abb
ab
A (BR28) a
b
aab
DAT55 DAT93
Tille
r num
ber
0
2
4
6
8
10
12
14
16 A (L81)
a aa
aa
a
a a
DAT55 DAT93
Tille
r num
ber
0
2
4
6
8
10
12
14
16A (NB)
a abab
b
aa a
b
DAT59 DAT72 DAT85 DAT107
Pla
nt h
eigh
t (cm
)
0
20
40
60
80
100
120
140
160
180B (L81)
aabbaba a a a a a a a
a abc b
DAT59 DAT72 DAT85 DAT107
Pla
nt h
eigh
t (cm
)
0
20
40
60
80
100
120
140
160
180
b b ab a ab b aab a abb b
ab b b
B (NB)
Fig. 3. Growth parameters of three rice genotypes exposed to ozone and control conditions with and without the application of EDU. Y axis represents different days aftertransplanting ¼ DAT and bars indicate mean value ± standard errors (n ¼ 18). Upper figure (A) and lower (B) represent tiller number and plant height respectively along with therespective genotype name. The letters above the bars indicate pair-wise comparison (P<0.05) within the genotype (mean values not sharing the same letter are significantlydifferent). Plant height was not measured in BR28 at DAT107 because plants were maturing and tending to shed grains.
Fig. 4. Physiological parameters of three rice genotypes exposed to ozone and control conditions with and without the application of EDU. Y axis represents different days aftertransplanting ¼ DAT and bars indicate mean value ± standard errors (SPAD and stomatal conductance, n ¼ 9 and 3 respectively). Upper figure (A) and lower (B) indicate SPAD valueand stomatal conductance along with the respective genotype name. The letters above the bars indicate pair-wise comparison (P<0.05) within the genotype (mean values notsharing the same letter are significantly different). Measurements were not taken from BR28 on DAT 133 and 148 because plants had already been harvested.
Md. Ashrafuzzaman et al. / Environmental Pollution 230 (2017) 339e350344
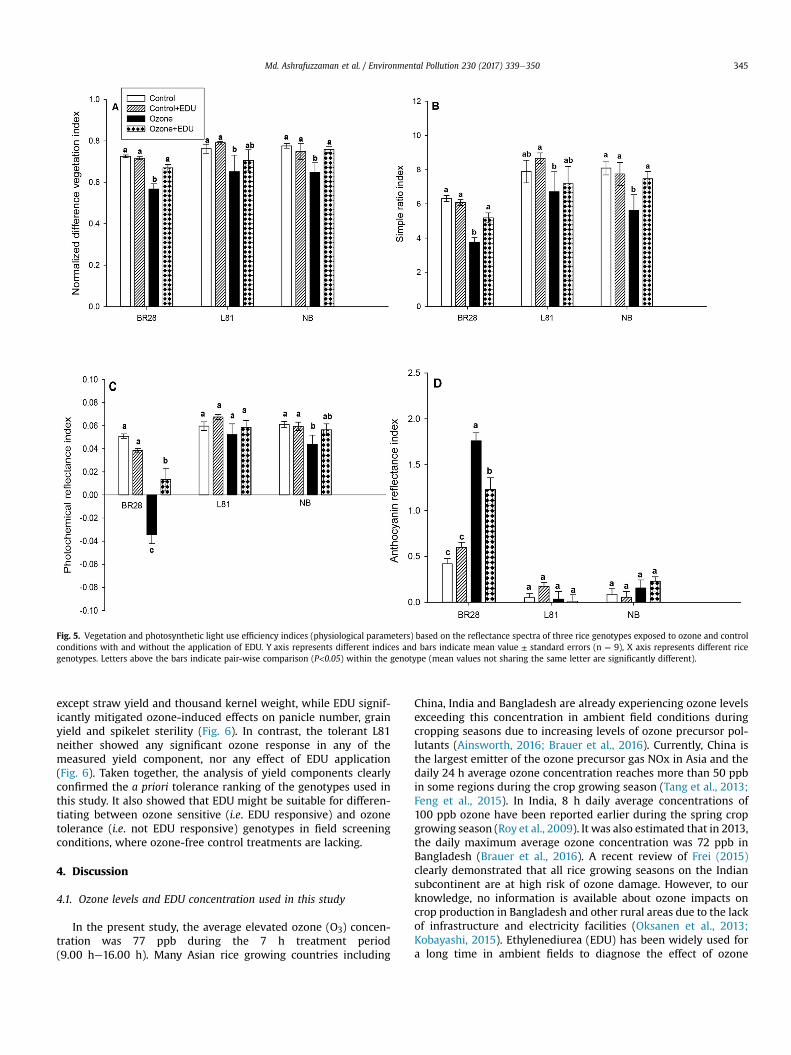
Fig. 5. Vegetation and photosynthetic light use efficiency indices (physiological parameters) based on the reflectance spectra of three rice genotypes exposed to ozone and controlconditions with and without the application of EDU. Y axis represents different indices and bars indicate mean value ± standard errors (n ¼ 9), X axis represents different ricegenotypes. Letters above the bars indicate pair-wise comparison (P<0.05) within the genotype (mean values not sharing the same letter are significantly different).
Md. Ashrafuzzaman et al. / Environmental Pollution 230 (2017) 339e350 345
except straw yield and thousand kernel weight, while EDU signif-icantly mitigated ozone-induced effects on panicle number, grainyield and spikelet sterility (Fig. 6). In contrast, the tolerant L81neither showed any significant ozone response in any of themeasured yield component, nor any effect of EDU application(Fig. 6). Taken together, the analysis of yield components clearlyconfirmed the a priori tolerance ranking of the genotypes used inthis study. It also showed that EDU might be suitable for differen-tiating between ozone sensitive (i.e. EDU responsive) and ozonetolerance (i.e. not EDU responsive) genotypes in field screeningconditions, where ozone-free control treatments are lacking.
4. Discussion
4.1. Ozone levels and EDU concentration used in this study
In the present study, the average elevated ozone (O3) concen-tration was 77 ppb during the 7 h treatment period(9.00 he16.00 h). Many Asian rice growing countries including
China, India and Bangladesh are already experiencing ozone levelsexceeding this concentration in ambient field conditions duringcropping seasons due to increasing levels of ozone precursor pol-lutants (Ainsworth, 2016; Brauer et al., 2016). Currently, China isthe largest emitter of the ozone precursor gas NOx in Asia and thedaily 24 h average ozone concentration reaches more than 50 ppbin some regions during the crop growing season (Tang et al., 2013;Feng et al., 2015). In India, 8 h daily average concentrations of100 ppb ozone have been reported earlier during the spring cropgrowing season (Roy et al., 2009). It was also estimated that in 2013,the daily maximum average ozone concentration was 72 ppb inBangladesh (Brauer et al., 2016). A recent review of Frei (2015)clearly demonstrated that all rice growing seasons on the Indiansubcontinent are at high risk of ozone damage. However, to ourknowledge, no information is available about ozone impacts oncrop production in Bangladesh and other rural areas due to the lackof infrastructure and electricity facilities (Oksanen et al., 2013;Kobayashi, 2015). Ethylenediurea (EDU) has been widely used fora long time in ambient fields to diagnose the effect of ozone
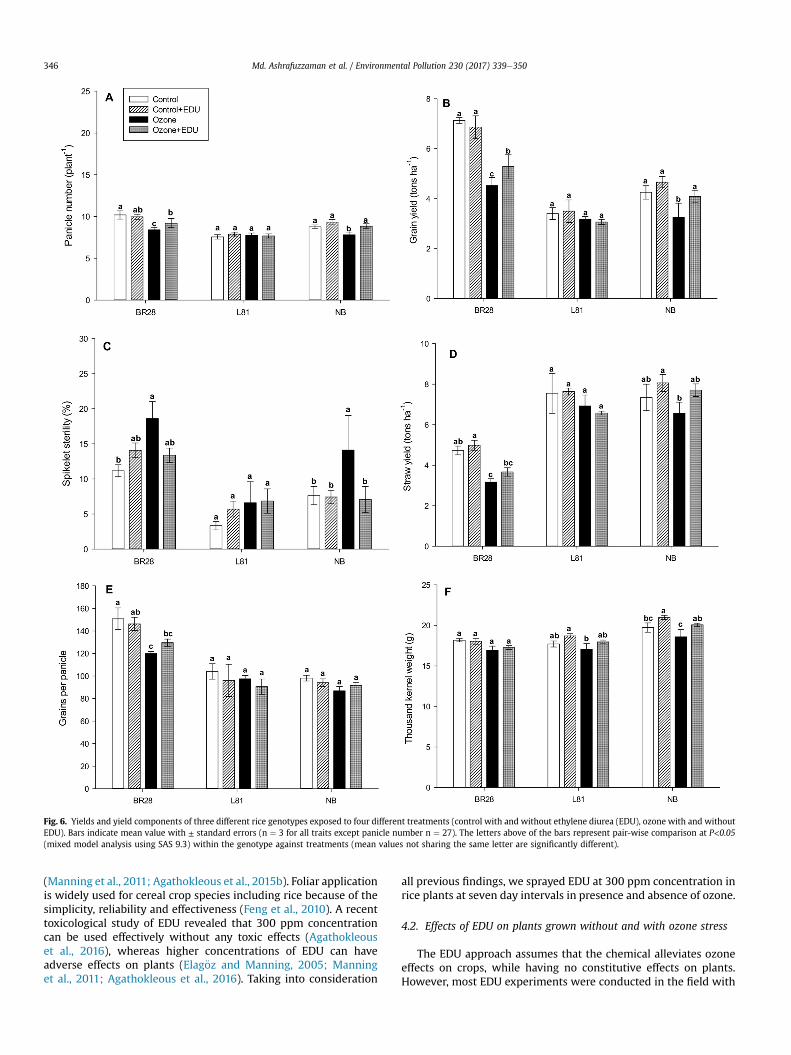
Fig. 6. Yields and yield components of three different rice genotypes exposed to four different treatments (control with and without ethylene diurea (EDU), ozone with and withoutEDU). Bars indicate mean value with ± standard errors (n ¼ 3 for all traits except panicle number n ¼ 27). The letters above of the bars represent pair-wise comparison at P<0.05(mixed model analysis using SAS 9.3) within the genotype against treatments (mean values not sharing the same letter are significantly different).
Md. Ashrafuzzaman et al. / Environmental Pollution 230 (2017) 339e350346
(Manning et al., 2011; Agathokleous et al., 2015b). Foliar applicationis widely used for cereal crop species including rice because of thesimplicity, reliability and effectiveness (Feng et al., 2010). A recenttoxicological study of EDU revealed that 300 ppm concentrationcan be used effectively without any toxic effects (Agathokleouset al., 2016), whereas higher concentrations of EDU can haveadverse effects on plants (Elag€oz and Manning, 2005; Manninget al., 2011; Agathokleous et al., 2016). Taking into consideration
all previous findings, we sprayed EDU at 300 ppm concentration inrice plants at seven day intervals in presence and absence of ozone.
4.2. Effects of EDU on plants grown without and with ozone stress
The EDU approach assumes that the chemical alleviates ozoneeffects on crops, while having no constitutive effects on plants.However, most EDU experiments were conducted in the field with
Md. Ashrafuzzaman et al. / Environmental Pollution 230 (2017) 339e350 347
ambient ozone conditions, lacking an ozone-free control (Manninget al., 2011). One major concern is whether EDU, a nitrogen con-taining compound, has any fertilization and/or growth regulatingactivity in plants irrespective of ozone. It contains around 22% ofnitrogen (Godzik and Manning, 1998). Consequently, the amount ofEDU applied in this study contained 6.9, 8.9 and 9.9 g nitrogen,equivalent to 1.9, 2.4 and 2.7 kg N ha�1 in the genotypes BR28, L81and NB respectively. This amount of nitrogen via EDU is smallcompared to the nitrogen fertilizer (60 kg N ha�1) applied as urea,suggesting that a foliar fertilizing effect can probably be neglected.This assumption is confirmed by the lack of response to EDU in theabsence of ozone in most of the physiological or yield variables.Among 26 variables, significant differences between the controland control þ EDU treatment were seen only in one variable (plantheight, DAT107) (Table 1). None of the traits were significantlyaffected by EDU in BR28 and L81 in control conditions, whilemerely a slight plant height reduction (DAT107) and increase ofthousand kernel weight was observed in NB in control plants withEDU treatment (Fig. 3B and Fig. 6F). Therefore, our experimentalresults indicated barely any constitutive effects of the applied EDUdose, and justify its use in studying specific ozone effects in rice aspreviously confirmed in potato (Foster et al., 1983) and tobaccoplants (Godzik and Manning, 1998).
In contrast, EDU application had significant effects on a numberof physiological, growth and yield traits in presence of ozone. Forexample, a 37 percent reduction of visible leaf injury and a 29percent decrease in MDA concentration were observed(Supplementary Table S1). In snap bean around 20 percent of ozonecaused foliar injury was offset by EDU application in ambient fields(Yuan et al., 2015). Similarly, EDU significantly mitigated ozone-induced lipid peroxidation in several crop species such as wheat(Singh et al., 2009), carrots (Tiwari and Agrawal, 2010), soybean(Rai et al., 2015) and the vegetative phase of rice (Pandey et al.,2015) in ambient fields. Although the actual function of EDU inprotecting plants from ozone injury is still unclear, it was suggestedthat both direct effects on physiological parameters and indirecteffects on the capacity to scavenge ROSmay play a vital role (Tiwariand Agrawal, 2009; Pandey et al., 2014). In terms of growth pa-rameters, EDU had positive effects on plant height in the ozonetreatment, which confirms previous findings in mung bean(Agrawal et al., 2005) and tropical soybean (Rai et al., 2015) grownin an ambient rural site of India. In addition EDU stimulated tillernumber in stress conditions similar to observations made in wheat(Tiwari et al., 2005). Also, stomatal conductance was enhanced byEDU application in the later growth phase (Fig. 4B). Stomatal re-sponses to ozone have been interpreted as a response to inhibitedcarbon assimilation due to damage of photosynthetic enzymes(Paoletti and Grulke, 2005), or as direct involvement of ROS instomatal aperture (Sierla et al., 2016). Because the positive effects ofEDU occurred rather late in the development of the plants in ourstudy, it seems more plausible that EDU mitigated chronic damageof the photosynthetic apparatus.
We also employed several non-invasive phenotyping techniquesto estimate ozone and EDU effects on foliar pigments. Althoughvegetation indices are extensively used on the plant community orecosystem level, they can also be employed at the individual plantlevel to detect early environmental stresses and leaf pigment statusthrough non-destructive measurements (Sims and Gamon, 2002;Meroni et al., 2008, 2009; L�opez-L�opez et al., 2016). Leaf green-ness is highly correlated with chlorophyll concentration and wasrepresented in our measurements taken with a chlorophyll meter(SPAD), as well the spectral reflectance indices NDVI and SR (Simsand Gamon, 2002). Ozone-induced loss of chlorophyll in rice wasconsistent with previous measurements using destructive analyt-ical techniques by Wang et al. (2014), while EDU application
mitigated ozone-induced chlorophyll degradation in our study(Fig. 4A and Fig. 5A, B). Another class of pigments affected by ozoneis carotenoids. The PRI can be interpreted as an indirect estimationof chlorophyll/carotenoid concentration and photosynthetic radi-ation use efficiency (PRUE) (Garbulsky et al., 2011). Our resultsusing rice thus confirm previous reports, where EDU had a positiveeffect on leaf chlorophyll and carotenoid concentrations in ozone-affected soybean (Rai et al., 2015) and wheat (Singh et al., 2009)in ambient fields. Anthocyanins are another class of photo-protective pigments that are often induced as a result of environ-mental stresses, including ozone (Foot et al., 1996; Gitelson et al.,2009). Their foliar concentration can be estimated non-destructively by employing the ARI (Gitelson et al., 2001). An in-crease in anthocyanins was thus particularly pronounced in thesensitive BR28, but significantly mitigated by the application ofEDU (Fig. 5D). Together, these measurements suggested great po-tential of using remote sensing and non-destructive phenotypingtechniques in detecting ozone effects on rice pigments, as well asdetecting EDU responses.
As a consequence of enhanced growth and physiological traits,several yield components were positively affected by EDU appli-cation, e.g. higher panicle number (8%) and grain yield (14%).Various studies reported increased yield with the application ofEDU in different crop species in ambient fields (Summarized bySingh et al., 2015), including rice (Pandey et al., 2015). Ourcontrolled experiment including an ozone-free control allows forquantification of the EDU-induced yield loss recovery. Whencomparing yield losses in the ozone treatment (26% compared tocontrol) to those in the ozone þ EDU treatment (16% compared tocontrol), a recovery of 10% of the original yield in control conditionswas observed.
Taken together our data suggest a specific effect of EDU inprotecting rice plants against ozone, although we cannot excludethe possibility that EDU might also protect plants from otherstresses (e.g. salinity or drought), which were absent in our studybut might occur in field conditions. A recent study suggested thatEDU effectiveness against ozone was not altered by moderatedrought in ambient field in sensitive poplar plants (Xin et al., 2016).Nevertheless, further research on non-specific stress-protectiveeffects of EDU is required in the future.
4.3. Suitability of EDU to screen for ozone sensitivity/tolerance inrice
One of the objectives of this study was to test whether EDUwould be a suitable tool for distinguishing ozone tolerant andsensitive rice genotypes, which could eventually be used for field-based screening and breeding. To this end, we used three rice ge-notypes a priori ranked in terms of ozone tolerance to investigatehow they respond to EDU application. L81 is an ozone tolerantintrogression line developed by Wang et al. (2014), containing twoozone tolerance QTLs, OzT8 and OzT9 (Frei et al., 2008, 2010) in thegenetic background of Nipponbare. It was suggested that the pyr-amiding of these QTLs helps plants to maintain higher yield per-formance in ozone stress by enhancing the net photosynthetic rate,higher chlorophyll levels and biomass, and reductions in visiblesymptoms and lipid peroxidation (Wang et al., 2014). These ad-vantages were confirmed in our present study. Furthermore, Uedaet al. (2015b), recently identified a novel gene, ozone-responsiveapoplastic protein (OsORAP1), which was suggested to underliethe QTL, OzT9. Consistent with our hypothesis, contrasting re-sponses of sensitive and tolerant genotypes to EDU applicationwere observed with respect to growth, physiological and yieldparameters. In fact, LBS, MDA, SPAD value, stomatal conductance,and spectral reflectance indices were significantly affected by EDU
Md. Ashrafuzzaman et al. / Environmental Pollution 230 (2017) 339e350348
application based on averaged performance of all genotypes(Table 1) in stress conditions. In addition, agronomically importanttraits such as panicle number, grain yield and spikelet sterility wereEDU responsive in the sensitive genotypes BR28 and NB respec-tively, while only few traits, i.e. plant height, SPAD value and sto-matal conductance were EDU responsive in the tolerant genotypeL81 in the presence of ozone (Supplementary Table S2). Moreover,none of the yield components in the tolerant genotype L81 wasaffected in stress conditions by EDU application (Fig. 6). In addition,significant stress effects and mitigation by EDU application forfoliar injury, lipid peroxidation, vegetation indices NDVI, SR, paniclenumber, and grain yield were seen only in the ozone-sensitivegenotypes of BR28 and NB. According to our findings, the widelycultivated Bangladeshi mega-variety BR28 displayed the mostdrastic response to ozone, which was most consistently amelio-rated by EDU application. This is consistent with previous studiessuggesting that South Asian crop varieties are rather sensitive toozone (Emberson et al., 2009; Feng et al., 2010). Taken together, ourresults thus suggest that ozone tolerance and sensitivity of differentgenotypes can be ranked based on EDU-responsiveness.
5. Conclusion
Ozone tolerance breeding approaches are greatly hampered bythe lack of available germplasm from ozone affected areas andtranslation of laboratory experiments to the field (Ainsworth,2016). The results of this study encourage the use of EDU as atool to screen for ozone tolerance in rice, which can help to facili-tate breeding schemes using large numbers of field grown plants.This can be an important step forward on the development of ozonetolerant rice varieties, which will contribute to the food security ofmany highly populated countries in Asia.
Acknowledgments
The authors acknowledge German Academic Exchange Service(DAAD) for providing PhD fellowship and Bangladesh Rice ResearchInstitute for providing seeds of BR28.
Appendix A. Supplementary data
Supplementary data related to this article can be found at http://dx.doi.org/10.1016/j.envpol.2017.06.055.
References
Agathokleous, E., Saitanis, C.J., Koike, T., 2015a. Tropospheric O3, the nightmare ofwild plants: a review study. J. Agric. Meteorol. 71, 142e152. http://dx.doi.org/10.2480/agrmet.D-14-00008.
Agathokleous, E., Koike, T., Watanabe, M., Hoshika, Y., Saitanis, C.J., 2015b. Ethylene-di-urea (EDU), an effective phytoproctectant against O3 deleterious effects and avaluable research tool. J. Agric. Meteorol. 71, 185e195. http://dx.doi.org/10.2480/agrmet.D-14-00017.
Agathokleous, E., Mouzaki-Paxinou, A.C., Saitanis, C.J., Paoletti, E., Manning, W.J.,2016. The first toxicological study of the antiozonant and research tool ethylenediurea (EDU) using a Lemna minor L. bioassay: hints to its mode of action.Environ. Pollut. 213, 996e1006. http://dx.doi.org/10.1016/j.envpol.2015.12.051.
Agrawal, S.B., Singh, A., Rathore, D., 2005. Role of ethylene diurea (EDU) in assessingimpact of ozone on Vigna radiata L. plants in a suburban area of Allahabad(India). Chemosphere 61, 218e228. http://dx.doi.org/10.1016/j.chemosphere.2005.01.087.
Ainsworth, E.A., 2016. Understanding and improving global crop response to ozonepollution. Plant J. 1e12. http://dx.doi.org/10.1111/tpj.13298.
Ainsworth, E.A., 2008. Rice production in a changing climate: a meta-analysis ofresponses to elevated carbon dioxide and elevated ozone concentration. Glob.Chang. Biol. 14, 1642e1650. http://dx.doi.org/10.1111/j.1365-2486.2008.01594.x.
Akhtar, N., Yamaguchi, M., Inada, H., Hoshino, D., Kondo, T., Fukami, M., Funada, R.,Izuta, T., 2010. Effects of ozone on growth, yield and leaf gas exchange rates offour Bangladeshi cultivars of rice (Oryza sativa L.). Environ. Pollut. 158,2970e2975. http://dx.doi.org/10.1016/j.envpol.2010.05.026.
Alexandratos, N., Bruinsma, J., 2012. World Agriculture towards 2030/2050: the2012 Revision. ESA Working Paper No. 12e03. FAO, Rome.
Ashmore, M.R., 2005. Assessing the future global impacts of ozone on vegetation.Plant, Cell. Environ. 28, 949e964. http://dx.doi.org/10.1111/j.1365-3040.2005.01341.x.
Avnery, S., Mauzerall, D.L., Fiore, A.M., 2013. Increasing global agricultural pro-duction by reducing ozone damages via methane emission controls and ozone-resistant cultivar selection. Glob. Chang. Biol. 19, 1285e1299. http://dx.doi.org/10.1111/gcb.12118.
Avnery, S., Mauzerall, D.L., Liu, J., Horowitz, L.W., 2011. Global crop yield reductionsdue to surface ozone exposure: 1. year 2000 crop production losses and eco-nomic damage. Atmos. Environ. 45, 2284e2296. http://dx.doi.org/10.1016/j.atmosenv.2010.11.045.
Brauer, M., Freedman, G., Frostad, J., van Donkelaar, A., Martin, R.V., Dentener, F., vanDingenen, R., Estep, K., Amini, H., Apte, J.S., Balakrishnan, K., Barregard, L.,Broday, D., Feigin, V., Ghosh, S., Hopke, P.K., Knibbs, L.D., Kokubo, Y., Liu, Y.,Ma, S., Morawska, L., Texcalac Sangrador, J.L., Shaddick, G., Anderson, H.R.,Vos, T., Forouzanfar, M.H., Burnett, R.T., Cohen, A., 2016. Ambient air pollutionexposure estimation for the global burden of disease 2013. Environ. Sci. Tech-nol. 50, 79e88. http://dx.doi.org/10.1021/acs.est.5b03709.
Carnahan, J.E., Jenner, E.L., Wat, E.K.W., 1978. Prevention of ozone injury to plants bya new protectant chemical. Phytopathology 68, 1225e1229.
Chakraborty, T., Beig, G., Dentener, F.J., Wild, O., 2015. Atmospheric transport ofozone between southern and eastern Asia. Sci. Total Environ. 523, 28e39.http://dx.doi.org/10.1016/j.scitotenv.2015.03.066.
Elag€oz, V., Manning, W.J., 2005. Factors affecting the effects of EDU on growth andyield of field-grown bush beans (Phaseolus vulgaris L.), with varying degrees ofsensitivity to ozone. Environ. Pollut. 136, 385e395. http://dx.doi.org/10.1016/j.envpol.2005.01.022.
Emberson, L.D., Büker, P., Ashmore, M.R., Mills, G., Jackson, L.S., Agrawal, M.,Atikuzzaman, M.D., Cinderby, S., Engardt, M., Jamir, C., Kobayashi, K.,Oanh, N.T.K., Quadir, Q.F., Wahid, A., 2009. A comparison of North American andAsian exposure-response data for ozone effects on crop yields. Atmos. Environ.43, 1945e1953. http://dx.doi.org/10.1016/j.atmosenv.2009.01.005.
FAOSTAT, 2013. FAO statistical databases. Available online at: http://faostat.fao.org/.Feng, Z., Kobayashi, K., 2009. Assessing the impacts of current and future concen-
trations of surface ozone on crop yield with meta-analysis. Atmos. Environ. 43,1510e1519. http://dx.doi.org/10.1016/j.atmosenv.2008.11.033.
Feng, Z., Wang, S., Szantoi, Z., Chen, S., Wang, X., 2010. Protection of plants fromambient ozone by applications of ethylenediurea (EDU): a meta-analytic re-view. Environ. Pollut. 158, 3236e3242. http://dx.doi.org/10.1016/j.envpol.2010.07.009.
Feng, Z., Pang, J., Kobayashi, K., Zhu, J., Ort, D.R., 2011. Differential responses in twovarieties of winter wheat to elevated ozone concentration under fully open-airfield conditions. Glob. Chang. Biol. 17, 580e591. http://dx.doi.org/10.1111/j.1365-2486.2010.02184.x.
Feng, Z., Hu, E., Wang, X., Jiang, L., Liu, X., 2015. Ground-level O3 pollution and itsimpacts on food crops in China: a review. Environ. Pollut. 199, 42e48. http://dx.doi.org/10.1016/j.envpol.2015.01.016.
Feng, Z., Wang, L., Pleijel, H., Zhu, J., Kobayashi, K., 2016. Differential effects of ozoneon photosynthesis of winter wheat among cultivars depend on antioxidativeenzymes rather than stomatal conductance. Sci. Total Environ. 572, 404e411.http://dx.doi.org/10.1016/j.scitotenv.2016.08.083.
Foot, J.P., Caporn, S.J.M., Lee, J.A., Ashenden, T.W., 1996. The effect of long-termozone fumigation on the growth, physiology and frost sensitivity of Callunavulgaris. New Phytol. 133, 503e511. http://dx.doi.org/10.1111/j.1469-8137.1996.tb01918.x.
Foster, K.W., Guerard, J.P., Oshima, R.J., Bishop, J.C., Timm, H., 1983. Differentialozone susceptibility of Centennial Russet and White Rose potato as demon-strated by fumigation and antioxidant treatments. Am. Potato J. 60, 127e139.
Frei, M., 2015. Breeding of ozone resistant rice: relevance, approaches and chal-lenges. Environ. Pollut. 197, 144e155. http://dx.doi.org/10.1016/j.envpol.2014.12.011.
Frei, M., Kohno, Y., Wissuwa, M., Makkar, H.P.S., Becker, K., 2011. Negative effects oftropospheric ozone on the feed value of rice straw are mitigated by an ozonetolerance QTL. Glob. Chang. Biol. 17, 2319e2329. http://dx.doi.org/10.1111/j.1365-2486.2010.02379.x.
Frei, M., Tanaka, J.P., Chen, C.P., Wissuwa, M., 2010. Mechanisms of ozone tolerancein rice: characterization of two QTLs affecting leaf bronzing by gene expressionprofiling and biochemical analyses. J. Exp. Bot. 61, 1405e1417. http://dx.doi.org/10.1093/jxb/erq007.
Frei, M., Tanaka, J.P., Wissuwa, M., 2008. Genotypic variation in tolerance to elevatedozone in rice: dissection of distinct genetic factors linked to tolerance mecha-nisms. J. Exp. Bot. 59, 3741e3752. http://dx.doi.org/10.1093/jxb/ern222.
Frei, M., Tetteh, R.N., Razafindrazaka, A.L., Fuh, M.A., Wu, L.B., Becker, M., 2016.Responses of rice to chronic and acute iron toxicity: genotypic differences andbiofortification aspects. Plant Soil 408, 149e161. http://dx.doi.org/10.1007/s11104-016-2918-x.
Garbulsky, M.F., Pe~nuelas, J., Gamon, J., Inoue, Y., Filella, I., 2011. The photochemicalreflectance index (PRI) and the remote sensing of leaf, canopy and ecosystemradiation use efficiencies. a review and meta-analysis. Remote Sens. Environ.115, 281e297. http://dx.doi.org/10.1016/j.rse.2010.08.023.
Gitelson, A.A., Chivkunova, O.B., Merzlyak, M.N., 2009. Nondestructive estimation ofanthocyanins and chlorophylls in anthocyanic leaves. Am. J. Bot. 96, 1861e1868.http://dx.doi.org/10.3732/ajb.0800395.
Md. Ashrafuzzaman et al. / Environmental Pollution 230 (2017) 339e350 349
Gitelson, A.A., Merzlyak, M.N., Chivkunova, O.B., 2001. Optical properties andnondestructive estimation of anthocyanin content in plant leaves. Photochem.Photobiol. 74, 38e45.
Godzik, B., Manning, W.J., 1998. Relative effectiveness of ethylenediurea, and con-stitutent amounts of urea and phenylurea in ethylenediurea, in prevention ofozone injury to tobacco. Environ. Pollut. 103, 1e6.
Heagle, A.S., Body, D.E., Heck, W.W., 1973. An open-top field chamber to assess theimpact of air pollution on plants. J. Environ. Qual. 2, 365e368.
Hodges, D.M., DeLong, J.M., Forney, C.F., Prange, R.K., 1999. Improving the thio-barbituric acid-reactive-substances assay for estimating lipid peroxidation inplant tissues containing anthocyanin and other interfering compounds. Planta207, 604e611. http://dx.doi.org/10.1007/s004250050524.
H€oller, S., Meyer, A., Frei, M., 2014. Zinc deficiency differentially affects redox ho-meostasis of rice genotypes contrasting in ascorbate level. J. Plant Physiol. 171,1748e1756. http://dx.doi.org/10.1016/j.jplph.2014.08.012.
IPCC, 2014. Climate change 2014-mitigation of climate change. IPSS 5th assessmentreport, Bonn, Germany.
IRRI, 2016. Website of the International Rice Research Institute (IRRI). RiceKnowledge Bank. Available online at: http://www.knowledgebank.irri.org/step-by-step-production/growth/planting/transplanting (Last Accessed on 22February 2016).
Jing, L., Dombinov, V., Shen, S., Wu, Y., Yang, L., Wang, Y., Frei, M., 2016. Physiologicaland genotype-specific factors associated with grain quality changes in riceexposed to high ozone. Environ. Pollut. 210, 397e408. http://dx.doi.org/10.1016/j.envpol.2016.01.023.
Jordan, C.F., 1969. Derivation of leaf-area index from quality of light on the forestfloor. Ecology 50, 663e666.
Karlsson, G.P., Sellden, G., Skarby, L., Pleijel, H., 1995. Clover as an indicator plant forphytotoxic ozone concentrations: visible injury in relation to species, leaf ageand exposure dynamics. New Phytol. 129, 355e365. http://dx.doi.org/10.1111/j.1469-8137.1995.tb04306.x.
Kobayashi, K., 2015. FACE-ing the challenges of increasing surface ozone concen-tration in Asia. J. Agric. Meteorol. 71, 161e166. http://dx.doi.org/10.2480/agr-met.D-15-00100.
L�opez-L�opez, M., Calder�on, R., Gonz�alez-Dugo, V., Zarco-Tejada, P.J., Fereres, E., 2016.Early detection and quantification of almond red leaf blotch using high-resolution hyperspectral and thermal imagery. Remote Sens. 8 http://dx.doi.org/10.3390/rs8040276.
Manning, W.J., Paoletti, E., Sandermann, H., Ernst, D., 2011. Ethylenediurea (EDU): aresearch tool for assessment and verification of the effects of ground levelozone on plants under natural conditions. Environ. Pollut. 159, 3283e3293.http://dx.doi.org/10.1016/j.envpol.2011.07.005.
Meroni, M., Panigada, C., Rossini, M., Picchi, V., Cogliati, S., Colombo, R., 2009. Usingoptical remote sensing techniques to track the development of ozone-inducedstress. Environ. Pollut. 157, 1413e1420. http://dx.doi.org/10.1016/j.envpol.2008.09.018.
Meroni, M., Picchi, V., Rossini, M., Cogliati, S., Panigada, C., Nali, C., Lorenzini, G.,Colombo, R., 2008. Leaf level early assessment of ozone injuries by passivefluorescence and photochemical reflectance index. Int. J. Remote Sens. 29,5409e5422. http://dx.doi.org/10.1080/01431160802036292.
Mills, G., Harmens, H., 2011. Ozone Pollution: a Hidden Threat to Food Security. ICPVeg. Centre for Ecology and Hydrology, Bangor, UK.
Morgan, P.B., Bernacchi, C.J., Ort, D.R., Long, S.P., 2004. An in vivo analysis of theeffect of season-long open-air elevation of ozone to anticipated 2050 levels onphotosynthesis in soybean. Plant Physiol. 135, 2348e2357. http://dx.doi.org/10.1104/pp.104.043968.
Morgan, P.B., Mies, T.A., Bollero, G.A., Nelson, R.L., Long, S.P., 2006. Season-longelevation of ozone concentration to projected 2050 levels under fully open-airconditions substantially decreases the growth and production of soybean. NewPhytol. 170, 333e343. http://dx.doi.org/10.1111/j.1469-8137.2006.01679.x.
Oksanen, E., Pandey, V., Pandey, A.K., Keski-Saari, S., Kontunen-Soppela, S.,Sharma, C., 2013. Impacts of increasing ozone on Indian plants. Environ. Pollut.177, 189e200. http://dx.doi.org/10.1016/j.envpol.2013.02.010.
Pandey, A.K., Majumder, B., Keski-Saari, S., Kontunen-Soppela, S., Mishra, A.,Sahu, N., Pandey, V., Oksanen, E., 2015. Searching for common responsive pa-rameters for ozone tolerance in 18 rice cultivars in India: results from ethyl-enediurea studies. Sci. Total Environ. 532, 230e238. http://dx.doi.org/10.1016/j.scitotenv.2015.05.040.
Pandey, A.K., Majumder, B., Keski-Saari, S., Kontunen-Soppela, S., Pandey, V.,Oksanen, E., 2014. Differences in responses of two mustard cultivars to ethyl-enediurea (EDU) at high ambient ozone concentrations in India. Agric. Ecosyst.Environ. 196, 158e166.
Paoletti, E., Castagna, A., Ederli, L., Pasqualini, S., Ranieri, A., Manning, W.J., 2014.Gene expression in snapbeans exposed to ozone and protected by ethyl-enediurea. Environ. Pollut. 193, 1e5. http://dx.doi.org/10.1016/j.envpol.2014.06.001.
Paoletti, E., Contran, N., Manning, W.J., Ferrara, A.M., 2009. Use of the antiozonantethylenediurea (EDU) in Italy: verification of the effects of ambient ozone oncrop plants and trees and investigation of EDU's mode of action. Environ. Pollut.157, 1453e1460. http://dx.doi.org/10.1016/j.envpol.2008.09.021.
Paoletti, E., Grulke, N.E., 2005. Does living in elevated CO2 ameliorate tree responseto ozone? A review on stomatal responses. Environ. Pollut. 137, 483e493.http://dx.doi.org/10.1016/j.envpol.2005.01.035.
Pe~nuelas, J., Filella, I., Gamon, J.A., 1995. Assessment of photosynthetic radiation-useefficiency with spectral reflectance. New Phytol. 131, 291e296.
Piepho, H.P., Buchse, A., Emrich, K., 2003. A hitchhiker's guide to mixed models forrandomized experiments. J. Agron. Crop Sci. 189, 310e322. http://dx.doi.org/10.1046/j.1439-037X.2003.00049.x.
Piikki, K., De Temmerman, L., H€ogy, P., Pleijel, H., 2008. The open-top chamberimpact on vapour pressure deficit and its consequences for stomatal ozoneuptake. Atmos. Environ. 42, 6513e6522. http://dx.doi.org/10.1016/j.atmosenv.2008.04.014.
Pleijel, H., 2011. Reduced ozone by air filtration consistently improved grain yield inwheat. Environ. Pollut. 159, 897e902. http://dx.doi.org/10.1016/j.envpol.2010.12.020.
Pozzer, A., Zimmermann, P., Doering, U.M., Van Aardenne, J., Tost, H., Dentener, F.,Janssens-Maenhout, G., Lelieveld, J., 2012. Effects of business-as-usual anthro-pogenic emissions on air quality. Atmos. Chem. Phys. 12, 6915e6937. http://dx.doi.org/10.5194/acp-12-6915-2012.
Rai, R., Agrawal, M., Kumar Choudhary, K., Agrawal, S.B., Emberson, L., Büker, P.,2015. Application of ethylene diurea (EDU) in assessing the response of atropical soybean cultivar to ambient O3: nitrogen metabolism, antioxidants,reproductive development and yield. Ecotoxicol. Environ. Saf. 112, 29e38.http://dx.doi.org/10.1016/j.ecoenv.2014.10.031.
Rouse, J.W., Hass, R.H., Schell, J.A., Deering, D.W., 1974. Monitoring vegetation sys-tems in the great plains with ERTS. Third Earth Resour. Technol. Satell. Symp. 1,309e317 doi:citeulike-article-id:12009708.
Roy, S.D., Beig, G., Ghude, S.D., 2009. Exposure-plant response of ambient ozoneover the tropical Indian region. Atmos. Chem. Phys. 9, 5253e5260. http://dx.doi.org/10.5194/acp-9-5253-2009.
Shi, G., Yang, L., Wang, Y., Kobayashi, K., Zhu, J., Tang, H., Pan, S., Chen, T., Liu, G.,Wang, Y., 2009. Impact of elevated ozone concentration on yield of four Chineserice cultivars under fully open-air field conditions. Agric. Ecosyst. Environ. 131,178e184. http://dx.doi.org/10.1016/j.agee.2009.01.009.
Sierla, M., Waszczak, C., Vahisalu, T., Kangasj€arvi, J., 2016. Reactive oxygen species inthe regulation of stomatal movements. Plant Physiol. 171, 1569e1580. http://dx.doi.org/10.1104/pp.16.00328.
Sims, D.A., Gamon, J.A., 2002. Relationships between leaf pigment content andspectral reflectance across a wide range of species, leaf structures and devel-opmental stages. Remote Sens. Environ. 81, 337e354. http://dx.doi.org/10.1016/S0034-4257(02)00010-X.
Singh, A.A., Singh, S., Agrawal, M., Agrawal, S.B., 2015. Assessment of ethylenediurea-induced protection in plants against ozone phytotoxicity. Rev. Environ.Contam. Toxicol. http://dx.doi.org/10.1007/978-3-319-10479-9_4.
Singh, S., Agrawal, S.B., Agrawal, M., 2009. Differential protection of ethylenediurea(EDU) against ambient ozone for five cultivars of tropical wheat. Environ. Pollut.157, 2359e2367. http://dx.doi.org/10.1016/j.envpol.2009.03.029.
Tai, A.P.K., Martin, M.V., Heald, C.L., 2014. Threat to future global food security fromclimate change and ozone air pollution. Nat. Clim. Chang. 4, 817e821. http://dx.doi.org/10.1038/nclimate2317.
Tang, H., Liu, G., Han, Y., Zhu, J., Kobayashi, K., 2011. A system for free-air ozoneconcentration elevation with rice and wheat: control performance and ozoneexposure regime. Atmos. Environ. 45, 6276e6282. http://dx.doi.org/10.1016/j.atmosenv.2011.08.059.
Tang, H., Takigawa, M., Liu, G., Zhu, J., Kobayashi, K., 2013. A projection of ozone-induced wheat production loss in China and India for the years 2000 and2020 with exposure-based and flux-based approaches. Glob. Chang. Biol. 19,2739e2752. http://dx.doi.org/10.1111/gcb.12252.
The Royal Society, 2008. Ground-level Ozone in the 21st Century: future Trends,Impacts and Policy Implications. The Royal Society, London.
Tiwari, S., Agrawal, M., 2010. Effectiveness of different EDU concentrations inameliorating ozone stress in carrot plants. Ecotoxicol. Environ. Saf. 73,1018e1027. http://dx.doi.org/10.1016/j.ecoenv.2010.03.008.
Tiwari, S., Agrawal, M., 2009. Protection of palak (Beta vulgaris L. var Allgreen)plants from ozone injury by ethylenediurea (EDU): roles of biochemical andphysiological variations in alleviating the adverse impacts. Chemosphere 75,1492e1499. http://dx.doi.org/10.1016/j.chemosphere.2009.02.034.
Tiwari, S., Agrawal, M., Manning, W.J., 2005. Assessing the impact of ambient ozoneon growth and productivity of two cultivars of wheat in India using three ratesof application of ethylenediurea (EDU). Environ. Pollut. 138, 153e160. http://dx.doi.org/10.1016/j.envpol.2005.02.008.
Ueda, Y., Frimpong, F., Qi, Y., Matthus, E., Wu, L., H€oller, S., Kraska, T., Frei, M., 2015a.Genetic dissection of ozone tolerance in rice (Oryza sativa L.) by a genome-wideassociation study. J. Exp. Bot. 66, 293e306. http://dx.doi.org/10.1093/jxb/eru419.
Ueda, Y., Siddique, S., Frei, M., 2015b. A novel gene OsORAP1 enhances cell death inozone stress in rice (Oryza sativa L.). Plant physiol. 169, 873e889. http://dx.doi.org/10.1104/pp.15.00956.
Ueda, Y., Wu, L., Frei, M., 2013. A critical comparison of two high-throughputascorbate analyses methods for plant samples. Plant Physiol. Biochem. 70,418e423. http://dx.doi.org/10.1016/j.plaphy.2013.06.006.
Van Dingenen, R., Dentener, F.J., Raes, F., Krol, M.C., Emberson, L., Cofala, J., 2009.The global impact of ozone on agricultural crop yields under current and futureair quality legislation. Atmos. Environ. 43, 604e618. http://dx.doi.org/10.1016/j.atmosenv.2008.10.033.
Wang, X., Zheng, Q., Yao, F., Chen, Z., Feng, Z., Manning, W.J., 2007. Assessing theimpact of ambient ozone on growth and yield of a rice (Oryza sativa L.) and awheat (Triticum aestivum L.) cultivar grown in the Yangtze Delta, China, usingthree rates of application of ethylenediurea (EDU). Environ. Pollut. 148,390e395. http://dx.doi.org/10.1016/j.envpol.2006.12.014.

Md. Ashrafuzzaman et al. / Environmental Pollution 230 (2017) 339e350350
Wang, Y., Yang, L., H€oller, M., Zaisheng, S., Pariasca-Tanaka, J., Wissuwa, M., Frei, M.,2014. Pyramiding of ozone tolerance QTLs OzT8 and OzT9 confers improvedtolerance to season-long ozone exposure in rice. Environ. Exp. Bot. 104, 26e33.http://dx.doi.org/10.1016/j.envexpbot.2014.03.005.
Xin, Y., Yuan, X., Shang, B., Manning, W.J., Yang, A., Wang, Y., Feng, Z., 2016. Mod-erate drought did not affect the effectiveness of ethylenediurea (EDU) in pro-tecting Populus cathayana from ambient ozone. Sci. Total Environ. 569-570,1536e1544. http://dx.doi.org/10.1016/j.scitotenv.2016.06.247.
Yamaji, K., Ohara, T., Uno, I., Tanimoto, H., Kurokawa, J.I., Akimoto, H., 2006. Analysis
of the seasonal variation of ozone in the boundary layer in East Asia using thecommunity multi-scale air quality model: what controls surface ozone levelsover Japan? Atmos. Environ. 40, 1856e1868. http://dx.doi.org/10.1016/j.atmosenv.2005.10.067.
Yuan, X., Calatayud, V., Jiang, L., Manning, W.J., Hayes, F., Tian, Y., Feng, Z., 2015.Assessing the effects of ambient ozone in China on snap bean genotypes byusing ethylenediurea (EDU). Environ. Pollut. 205, 199e208. http://dx.doi.org/10.1016/j.envpol.2015.05.043.
Publications
54
Ethylenediurea (EDU) mitigates the negative effects of ozone in rice: insights
into its mode of action
Ashrafuzzaman M., Haque Z., Ali B., Mathew B., Yu P., Hochholdinger F., … & Frei M.
Plant, Cell & Environment, 2018, 1-17.
Publications
55
Highlights
The application of ethylenediurea (EDU) as a foliar spray mitigated ozone stress in
rice plants, without affecting their transcriptional profile directly. We concluded that
EDU acts as a passive surface protectant that can be used to specifically monitor
ozone damage in field experiments.
Received: 9 April 2018 Accepted: 6 August 2018
DOI: 10.1111/pce.13423
OR I G I N A L A R T I C L E
Ethylenediurea (EDU) mitigates the negative effects of ozone inrice: Insights into its mode of action
Md. Ashrafuzzaman1,2 | Zahidul Haque1 | Basharat Ali1 | Boby Mathew1 | Peng Yu1 |
Frank Hochholdinger1 | Joao Braga de Abreu Neto3 | Max R. McGillen4 |
Hans‐Jürgen Ensikat5 | William J. Manning6 | Michael Frei1
1 Institute of Crop Science and Resource
Conservation (INRES), University of Bonn,
Bonn, Germany
2Department of Genetic Engineering and
Biotechnology, Shahjalal University of Science
and Technology, Sylhet, Bangladesh
3Department of Genetics, Universidade
Federal do Rio Grande do Sul, Porto Alegre,
Brazil
4 School of Chemistry, University of Bristol,
Bristol, UK
5Nees Institute for Biodiversity of Plants,
University of Bonn, Bonn, Germany
6Stockbridge School of Agriculture, University
of Massachusetts, Amherst, Massachusetts
Correspondence
Michael Frei, INRES Plant Nutrition, University
of Bonn, Karlrobert‐Kreiten Strasse 13, 53115
Bonn, Germany.
Email: mfrei@uni‐bonn.de
Plant Cell Environ. 2018;0–18.
Abstract
Monitoring of ozone damage to crops plays an increasingly important role for the
food security of many developing countries. Ethylenediurea (EDU) could be a tool
to assess ozone damage to vegetation on field scale, but its physiological mode of
action remains unclear. This study investigated mechanisms underlying the ozone‐
protection effect of EDU in controlled chamber experiments. Ozone sensitive and tol-
erant rice genotypes were exposed to ozone (108 ppb, 7 hr day−1) and control condi-
tions. EDU alleviated ozone effects on plant morphology, foliar symptoms, lipid
peroxidation, and photosynthetic parameters in sensitive genotypes. Transcriptome
profiling by RNA sequencing revealed that thousands of genes responded to ozone
in a sensitive variety, but almost none responded to EDU. Significant interactions
between ozone and EDU application occurred mostly in ozone responsive genes, in
which up‐regulation was mitigated by EDU application. Further experiments docu-
mented ozone degrading properties of EDU, as well as EDU deposits on leaf surfaces
possibly related to surface protection. EDU application did not mitigate the reaction
of plants to other abiotic stresses, including iron toxicity, zinc deficiency, and salinity.
This study provided evidence that EDU is a surface protectant that specifically miti-
gates ozone stress without interfering directly with the plants' stress response
systems.
KEYWORDS
air pollution, food security, gene expression, global change, phenotyping, RNA‐Seq, tolerance
breeding
1 | INTRODUCTION
Increasing tropospheric ozone pollution poses a major threat to global
crop production and food security (Tai, Martin, & Heald, 2014; Tai &
Val Martin, 2017). Global yield losses due to ozone pollution have
been estimated in a range of 4%–17% for wheat, 10%–14% for soy-
bean, and 3%–6% for maize with a total estimated annual economic
loss of US$ 12–21 billion based on global crop models (Avnery,
Mauzerall, Liu, & Horowitz, 2011). Ozone was first recognized as a
detrimental air pollutant in North America during the 1950s and
wileyonlinelibrary.com/jou
gradually noticed in Europe and Japan in the 1970s (Haagen‐Smit,
1952; The Royal Society, 2008). However, Asian countries, including
Bangladesh, India, Myanmar, and Nepal, will be the most vulnerable
in the upcoming decades due to rapidly growing populations and
economies, and the lack of legislation to control the emission of ozone
precursor gases such as nitrogen oxides (NOx), carbon monoxide,
methane, and volatile organic compounds (Brauer et al., 2016;
Emberson et al., 2009; Mills et al., 2018; Van Dingenen et al., 2009).
Nevertheless, experimental evidence documenting crop responses
and yield losses in these heavily ozone‐affected areas is scarce
© 2018 John Wiley & Sons Ltdrnal/pce 1
2 ASHRAFUZZAMAN ET AL.
(Kobayashi, 2015; Oksanen et al., 2013). Rice (Oryza sativa L.) is the
staple food crop for more than half of the world population and most
widely grown and consumed in Asia (Alexandratos & Bruinsma, 2012;
FAOSTAT, 2018). Around 4% of global and more than 10% of regional
rice yield losses have been estimated due to ozone stress (Ainsworth,
2008; Van Dingenen et al., 2009). These yield losses will be exacer-
bated tremendously in the near future, as the rice cropping seasons
overlap with the peak ambient ozone concentrations in South and East
Asia, especially in India and Bangladesh, the second and fourth largest
rice‐producing countries globally (FAOSTAT, 2018; Frei, 2015). There-
fore, it is of paramount importance to explore ozone tolerance and
breeding options in rice to reduce yield losses as an effective strategy
to secure food supply regionally, especially in Asia but also on the
global scale.
Crop damage by ozone occurs directly through ozone‐induced
oxidative stress (Ainsworth, 2017). Plants take up ozone into the
apoplast primarily through the stomata, where it rapidly degrades
and generates reactive oxygen species (ROS) that interfere with vari-
ous physiological and enzymatic processes (Kangasjärvi, Jaspers, &
Kollist, 2005; Krasensky, Carmody, Sierla, & Kangasjärvi, 2017). Ozone
impacts on crop plants are often investigated by using open‐top cham-
bers (OTC) or free air concentration enrichment with ozone (FACE‐O3;
Feng, Uddling, Tang, Zhu, & Kobayashi, 2018; Frei, 2015). Both exper-
imental systems require infrastructure and reliable electricity supply
that is often not available in field locations of ozone‐affected develop-
ing countries (Kobayashi, 2015; Oksanen et al., 2013). In addition,
both experimental systems have their inherent weaknesses. OTC sys-
tems are usually small in dimension and therefore unsuitable for larger
scale field experiments (Macháčová, 2010). In addition, they affect the
microclimate plants are exposed to and may thus entail a “chamber
effect” (Morgan, Mies, Bollero, Nelson, & Long, 2006; Piikki, De
Temmerman, Högy, & Pleijel, 2008). FACE experiments can help to
overcome these limitations, but they are more expensive, technically
challenging to maintain, and can only compare between current ambi-
ent and elevated ozone concentrations (Frei, 2015; Pleijel, 2011).
Moreover, a recent meta‐analysis revealed that the assessment of
crop sensitivity towards ozone can differ between OTC and FACE
experiments (Feng et al., 2018). As an alternative research tool, the
chemical compound ethylenediurea (EDU; N‐[2‐(2‐oxo‐1‐
imidazolidinyl) ethyl]‐N′‐phenylurea), first introduced by Carnahan,
Jenner, and Wat (1978), has been used for a long time to assess ozone
impacts on plants (Feng, Wang, Szantoi, Chen, & Wang, 2010; Man-
ning, Paoletti, Sandermann, & Ernst, 2011; Paoletti, Contran, Manning,
& Ferrara, 2009). Its major advantage is the simplicity of application, as
it is just repeatedly sprayed on leaves, which is assumed to protect
plants from ozone damage, thereby providing a “control” without
ozone damage. However, although EDU has long been established
and numerous studies have provided evidence of its ozone‐alleviating
effect in diverse plant species, it has barely been critically tested in
controlled conditions, and its mode of action is not well‐understood
(Agathokleous, 2017; Manning et al., 2011). To our knowledge, no
study has analysed transcriptomic responses of any plant species to
EDU in order to survey its physiological effects on plants.
A number of previous studies have reported transcriptomic
responses of plants to ozone. A large number of genes involved in
programmed cell death (ethylene or jasmonic acid biosynthesis, mito-
gen‐activated protein kinase, and disease resistance) and detoxifica-
tion of ROS (catalase and peroxidase) were identified as ozone
responsive in a comparative microarray study using two chromosome
segment substitution rice lines (Frei et al., 2010). More recent studies
employed high‐throughput sequencing techniques (RNA‐Seq) to mon-
itor transcriptomic responses to ozone. This led to the identification of
ozone responsive genes and pathways associated with photosynthesis
and respiration, oxidative stress, defence response, protein
ubiquitination, and organic acid biosynthesis in soybean (Waldeck
et al., 2017), cellular integrity, and metabolism (ascorbate (AsA)‐gluta-
thione metabolism, hormone, wax, and cutin biosynthesis) in pak choi
(Zhang et al., 2017) and antioxidant metabolism (AsA‐glutathione cycle
genes) in legume crops (Yendrek, Koester, & Ainsworth, 2015). It is
thus obvious that large numbers of genes are ozone responsive in dif-
ferent plant species. Fully quantitative transcriptome sequencing tech-
niques such as RNA‐Seq offer an excellent tool to explore global
physiological responses to external stimuli such as ozone, EDU appli-
cation, and their interaction.
In order to consolidate the use of EDU as a research tool in future
studies, specifically in developing countries, this study aimed at
unravelling the mode of action of EDU as an ozone‐protectant based
on transcriptome sequencing and a series of related experiments. To
this end, a two‐factorial experiment was conducted, in which an
ozone‐sensitive rice genotype was exposed to ozone with and without
EDU application. Two alternative hypotheses were investigated: (a) If
EDU had any direct effects on the activation of stress defence path-
ways, this would manifest in altered expression patterns of the associ-
ated genes. (b) Alternatively, if the protective effect of EDU was rather
as a passive surface protectant, EDU would not directly affect gene
expression patterns but rather mitigate the effects of ozone on the
activation of stress response pathways.
2 | MATERIALS AND METHODS
2.1 | Experimental conditions
All experiments were carried out in greenhouses of the University of
Bonn, Germany. Seeds were germinated at 30 °C in the dark. The
seedlings were then transferred to a mesh floating on solutions con-
taining 0.5 mM CaCl2 and 10 μM FeCl3 and placed under natural light
in the greenhouse. After growing for 2 weeks, the seedlings were
transplanted into 60‐L plastic containers filled with half‐strength mod-
ified Yoshida solution (Yoshida, Forno, Cock, & G. K., 1976).
Transplanted seedlings were maintained in half‐strength solution for
1 week, which was subsequently replaced weekly with full‐strength
solutions. The pH was adjusted twice a week to 5.5. Supplementary
lighting was provided in the greenhouse from 7 a.m. to 8 p.m. every
day to ensure a minimum photosynthetic photon flux density (PPFD)
of 300 μmol m−2 s−1. The minimum temperature of the greenhouse
was set to 28/22 °C (day/night). Four different treatments were
implemented: (a) control, (b) control+EDU, (c) stress, and (d) stress
+EDU. In all experiments, at the time of stress treatments, half of
the control plants and half of the stressed plants were sprayed with
ASHRAFUZZAMAN ET AL. 3
300 ppm EDU once a week, as suggested in previous studies
(Ashrafuzzaman et al., 2017; Pandey et al., 2015). Weekly intervals
were selected to ensure a continuous effect of EDU, which can persist
in the leaf apoplast for 8 days or more without entering the cell (Gatta,
Mancino, & Federico, 1997; Paoletti et al., 2009). For this, approxi-
mately 75 mg EDU (250 ml of EDU solution) were sprayed weekly
per 0.24 m2 area (one container) for complete saturation of canopies.
The same volume of water was sprayed on the non‐EDU‐treated
plants instead of EDU.
2.2 | Plant materials
Five different rice genotypes were used in the three different experi-
ments. Experiment 1 was carried out using two ozone sensitive rice
genotypes, Nipponbare (NB) and Bangladesh Rice Research Institute
dhan28 (BR28; Akhtar et al., 2010; Ashrafuzzaman et al., 2017; Jing
et al., 2016), an ozone tolerant introgression line L81 (Wang et al.,
2014), and a submergence tolerant genotype Bangladesh Institute of
Nuclear Agriculture Dhan 11 (BINA11; IRRI, 2016). BR28 and BINA11
are Bangladeshi high‐yielding modern rice varieties developed by the
Bangladesh Rice Research Institute and Bangladesh Institute of
Nuclear Agriculture, respectively, and NB is a Japanese japonica rice
variety. The ozone tolerant L81 genotype carries introgressions of
two ozone tolerant quantitative trait loci from the Aus landrace
Kasalath (Frei et al., 2010; Frei, Tanaka, & Wissuwa, 2008) in the
genetic background of NB. The in‐depth physiological and tran-
scriptome studies (RNA‐Seq) in Experiment 1, and scanning electron
microscopy (SEM), were conducted with the ozone sensitive and
EDU‐responsive genotype BR28 (Ashrafuzzaman et al., 2017). In
Experiment 3, NB and BR28 genotypes were used along with world's
most popular and widely grown rice variety IR64 (Ballini et al., 2007) in
multiple stresses with and without the application of EDU.
The specific experiments were conducted as detailed below.
2.3 | Experiment 1
This experiment was carried out during the months of March and April
2017. The measured average daytime (7 a.m. to 8 p.m.) and night‐time
(8 p.m. to 7 a.m.) temperatures were 28 and 21 °C, average relative
humidity was 41% and 54%, respectively. Four independent chambers
were assigned to elevated ozone treatment, and control plants were
placed in four identical chambers without ozone fumigation to ensure
the same microclimate in both treatments. Plants were fumigated for
8 days at a target ozone concentration of 110 ppb. The recorded aver-
age daytime (9 a.m. to 4 p.m.) ozone concentration was
108 ± 0.46 ppb (average ± standard error) in the ozone treatment,
whereas the average concentration in control (nonfiltered air) condi-
tions was 37 ± 0.29 ppb. Control plants were exposed to ambient
ozone concentrations, but in the control conditions, the ambient
ozone concentrations were maintained below the damage threshold
level (40 ppb). Two randomly selected plants of each genotype from
each treatment chamber were collected, and shoots (whole plant with-
out root) were pooled for one representative sample. Then, the sam-
ples were flash‐frozen in liquid nitrogen and stored at −80 °C for
RNA extraction (transcriptome analysis) and biochemical analyses.
The collection of samples was performed in 1 day between 10 a.m.
and 12 p.m. after the second round of EDU application (approximately
16 hr after EDU application). The samples were collected within 24 hr
of EDU application because it is suggested that EDU can effectively
inhibit ozone‐induced ROS generation within 24 hr, which ultimately
prevents leaf lesions formation (Paoletti et al., 2014).
Visible leaf symptoms of ozone stress were quantified as leaf
bronzing score (LBS) ranging from 0 (no damage) to 10 (dead leaf),
which was assigned to three fully expanded leaves (lower to higher)
of each plant separately (Ueda et al., 2015). Tillers were counted
before sample collection and harvesting, at which time shoot and root
length was determined. Shoot samples were then placed in an oven at
60 °C for at least 72 hr for complete dryness, and dry weight was mea-
sured. Leaf nitrogen concentration was determined using an Elemental
Analyser EuroEA 3000 Series (HEKAtech GmbH, Wegberg, Germany)
after grinding dried samples to a fine powder.
2.4 | Experiment 2
This was carried out in the months of September and October 2017.
The measured average daytime and night‐time temperatures were
29 and 22 °C, and average relative humidity ranged from 42% to
55%, respectively. Two independent chambers were fumigated with
elevated ozone, and control plants were placed in identical chambers
without ozone fumigation. Plants were fumigated for 16 days at a tar-
get ozone concentration of 110 ppb. The measured average daytime
(9 a.m. to 4 p.m.) ozone concentration was 107 ± 0.44 ppb in the
ozone treatment whereas the average concentration in control condi-
tions was 17 ± 0.33 ppb.
2.5 | Ozone treatment and monitoring
Ozone fumigation was conducted in OTC (1.5‐m width × 1‐m
length × 1.3‐m height) and (1‐m width × 1‐m length × 1.3‐m height)
covered by transparent plastic sheets (Ueda, Siddique, & Frei, 2015).
Ozone was generated by using custom‐made ozone generators (UB
01; Gemke Technik GmbH, Ennepetal, Germany) after drying air with
silica gel. The generated ozone was first percolated through water to
remove nitrogen oxides, and then ozone‐enriched air was blown into
the chambers and evenly distributed via perforated plastic tubes run-
ning above the plant canopy. The ozone output was regulated by an
ozone monitor (K100 W; Dr. A. Kuntze GmbH, Meerbusch, Germany)
and detected by an ozone sensor (GE 760 ozone; Dr. A. Kuntze
GmbH, Meerbusch, Germany) placed inside the fumigation chambers.
In addition, the ozone concentrations in different areas of the chamber
were monitored with an independent handheld ozone monitor (series
500; Aeroqual Ltd. Auckland, New Zealand) at 2‐min intervals.
2.6 | Experiment 3
This was carried out in the months of September and October 2017.
The measured average daytime and night‐time temperatures were
27 and 18 °C, respectively; average relative humidity was 40% (day)
and 65% (night). Different stresses, that is, salt stress, iron toxicity,
and zinc deficiency, were assigned to separate hydroponic tanks with
and without the application of EDU including two replications per
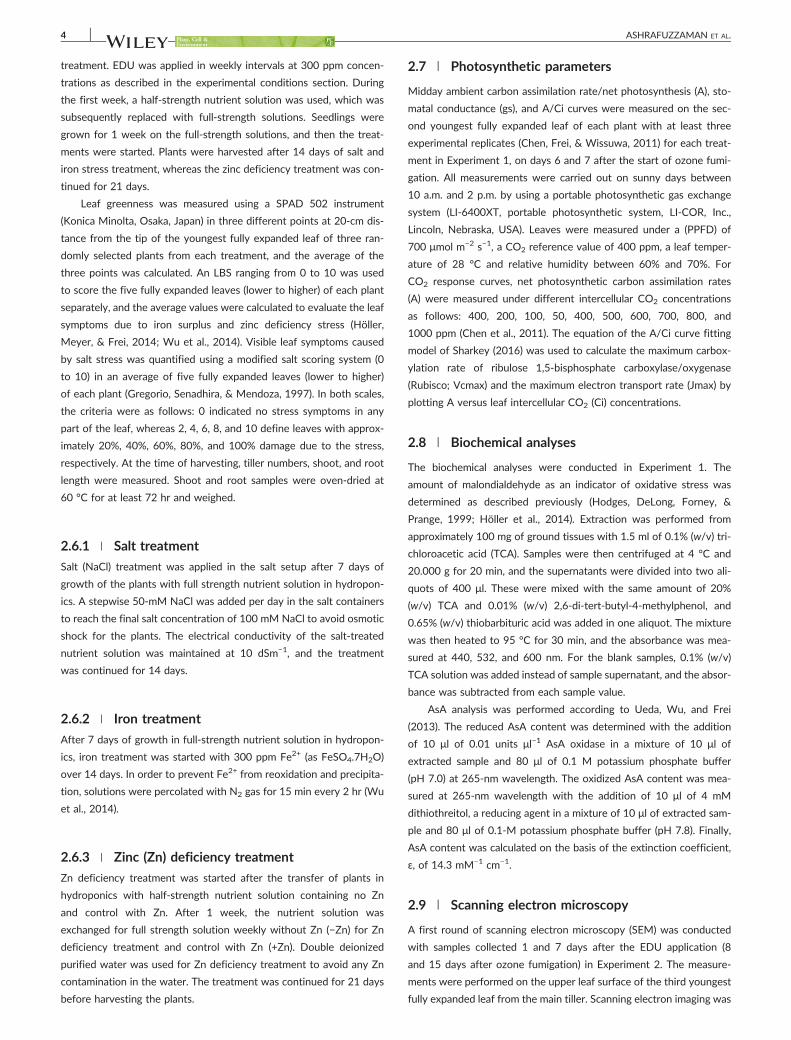
4 ASHRAFUZZAMAN ET AL.
treatment. EDU was applied in weekly intervals at 300 ppm concen-
trations as described in the experimental conditions section. During
the first week, a half‐strength nutrient solution was used, which was
subsequently replaced with full‐strength solutions. Seedlings were
grown for 1 week on the full‐strength solutions, and then the treat-
ments were started. Plants were harvested after 14 days of salt and
iron stress treatment, whereas the zinc deficiency treatment was con-
tinued for 21 days.
Leaf greenness was measured using a SPAD 502 instrument
(Konica Minolta, Osaka, Japan) in three different points at 20‐cm dis-
tance from the tip of the youngest fully expanded leaf of three ran-
domly selected plants from each treatment, and the average of the
three points was calculated. An LBS ranging from 0 to 10 was used
to score the five fully expanded leaves (lower to higher) of each plant
separately, and the average values were calculated to evaluate the leaf
symptoms due to iron surplus and zinc deficiency stress (Höller,
Meyer, & Frei, 2014; Wu et al., 2014). Visible leaf symptoms caused
by salt stress was quantified using a modified salt scoring system (0
to 10) in an average of five fully expanded leaves (lower to higher)
of each plant (Gregorio, Senadhira, & Mendoza, 1997). In both scales,
the criteria were as follows: 0 indicated no stress symptoms in any
part of the leaf, whereas 2, 4, 6, 8, and 10 define leaves with approx-
imately 20%, 40%, 60%, 80%, and 100% damage due to the stress,
respectively. At the time of harvesting, tiller numbers, shoot, and root
length were measured. Shoot and root samples were oven‐dried at
60 °C for at least 72 hr and weighed.
2.6.1 | Salt treatment
Salt (NaCl) treatment was applied in the salt setup after 7 days of
growth of the plants with full strength nutrient solution in hydropon-
ics. A stepwise 50‐mM NaCl was added per day in the salt containers
to reach the final salt concentration of 100 mM NaCl to avoid osmotic
shock for the plants. The electrical conductivity of the salt‐treated
nutrient solution was maintained at 10 dSm−1, and the treatment
was continued for 14 days.
2.6.2 | Iron treatment
After 7 days of growth in full‐strength nutrient solution in hydropon-
ics, iron treatment was started with 300 ppm Fe2+ (as FeSO4.7H2O)
over 14 days. In order to prevent Fe2+ from reoxidation and precipita-
tion, solutions were percolated with N2 gas for 15 min every 2 hr (Wu
et al., 2014).
2.6.3 | Zinc (Zn) deficiency treatment
Zn deficiency treatment was started after the transfer of plants in
hydroponics with half‐strength nutrient solution containing no Zn
and control with Zn. After 1 week, the nutrient solution was
exchanged for full strength solution weekly without Zn (−Zn) for Zn
deficiency treatment and control with Zn (+Zn). Double deionized
purified water was used for Zn deficiency treatment to avoid any Zn
contamination in the water. The treatment was continued for 21 days
before harvesting the plants.
2.7 | Photosynthetic parameters
Midday ambient carbon assimilation rate/net photosynthesis (A), sto-
matal conductance (gs), and A/Ci curves were measured on the sec-
ond youngest fully expanded leaf of each plant with at least three
experimental replicates (Chen, Frei, & Wissuwa, 2011) for each treat-
ment in Experiment 1, on days 6 and 7 after the start of ozone fumi-
gation. All measurements were carried out on sunny days between
10 a.m. and 2 p.m. by using a portable photosynthetic gas exchange
system (LI‐6400XT, portable photosynthetic system, LI‐COR, Inc.,
Lincoln, Nebraska, USA). Leaves were measured under a (PPFD) of
700 μmol m−2 s−1, a CO2 reference value of 400 ppm, a leaf temper-
ature of 28 °C and relative humidity between 60% and 70%. For
CO2 response curves, net photosynthetic carbon assimilation rates
(A) were measured under different intercellular CO2 concentrations
as follows: 400, 200, 100, 50, 400, 500, 600, 700, 800, and
1000 ppm (Chen et al., 2011). The equation of the A/Ci curve fitting
model of Sharkey (2016) was used to calculate the maximum carbox-
ylation rate of ribulose 1,5‐bisphosphate carboxylase/oxygenase
(Rubisco; Vcmax) and the maximum electron transport rate (Jmax) by
plotting A versus leaf intercellular CO2 (Ci) concentrations.
2.8 | Biochemical analyses
The biochemical analyses were conducted in Experiment 1. The
amount of malondialdehyde as an indicator of oxidative stress was
determined as described previously (Hodges, DeLong, Forney, &
Prange, 1999; Höller et al., 2014). Extraction was performed from
approximately 100 mg of ground tissues with 1.5 ml of 0.1% (w/v) tri-
chloroacetic acid (TCA). Samples were then centrifuged at 4 °C and
20.000 g for 20 min, and the supernatants were divided into two ali-
quots of 400 μl. These were mixed with the same amount of 20%
(w/v) TCA and 0.01% (w/v) 2,6‐di‐tert‐butyl‐4‐methylphenol, and
0.65% (w/v) thiobarbituric acid was added in one aliquot. The mixture
was then heated to 95 °C for 30 min, and the absorbance was mea-
sured at 440, 532, and 600 nm. For the blank samples, 0.1% (w/v)
TCA solution was added instead of sample supernatant, and the absor-
bance was subtracted from each sample value.
AsA analysis was performed according to Ueda, Wu, and Frei
(2013). The reduced AsA content was determined with the addition
of 10 μl of 0.01 units μl−1 AsA oxidase in a mixture of 10 μl of
extracted sample and 80 μl of 0.1 M potassium phosphate buffer
(pH 7.0) at 265‐nm wavelength. The oxidized AsA content was mea-
sured at 265‐nm wavelength with the addition of 10 μl of 4 mM
dithiothreitol, a reducing agent in a mixture of 10 μl of extracted sam-
ple and 80 μl of 0.1‐M potassium phosphate buffer (pH 7.8). Finally,
AsA content was calculated on the basis of the extinction coefficient,
ε, of 14.3 mM−1 cm−1.
2.9 | Scanning electron microscopy
A first round of scanning electron microscopy (SEM) was conducted
with samples collected 1 and 7 days after the EDU application (8
and 15 days after ozone fumigation) in Experiment 2. The measure-
ments were performed on the upper leaf surface of the third youngest
fully expanded leaf from the main tiller. Scanning electron imaging was
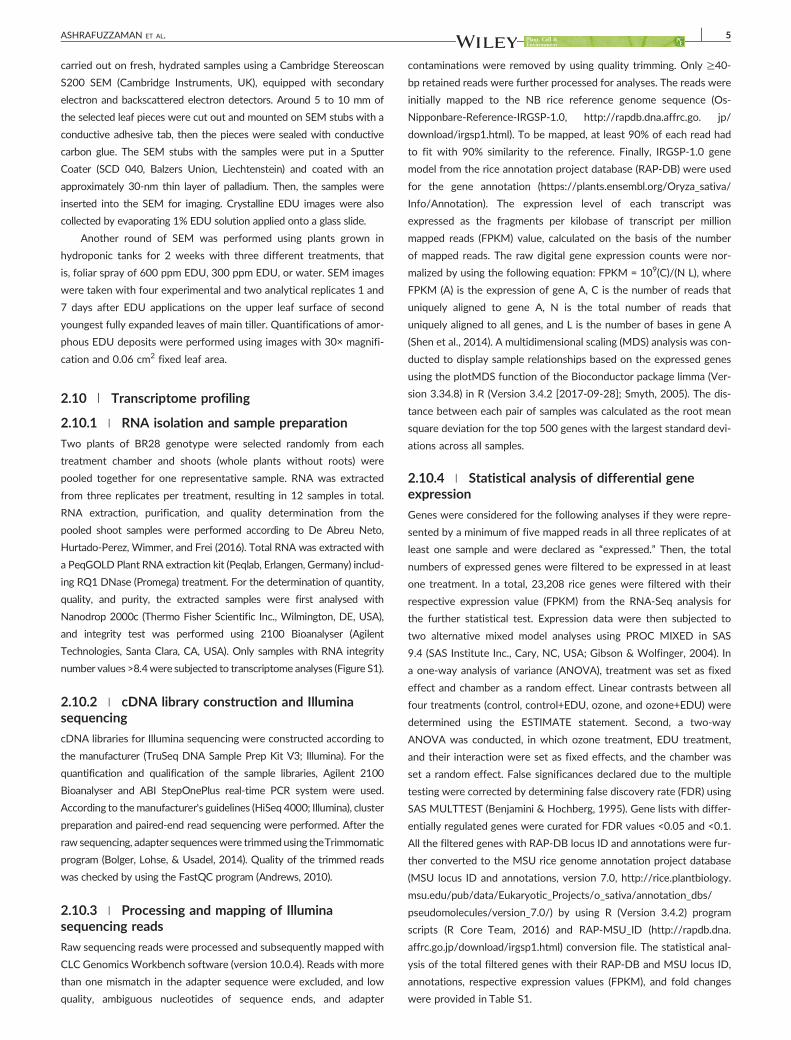
ASHRAFUZZAMAN ET AL. 5
carried out on fresh, hydrated samples using a Cambridge Stereoscan
S200 SEM (Cambridge Instruments, UK), equipped with secondary
electron and backscattered electron detectors. Around 5 to 10 mm of
the selected leaf pieces were cut out and mounted on SEM stubs with a
conductive adhesive tab, then the pieces were sealed with conductive
carbon glue. The SEM stubs with the samples were put in a Sputter
Coater (SCD 040, Balzers Union, Liechtenstein) and coated with an
approximately 30‐nm thin layer of palladium. Then, the samples were
inserted into the SEM for imaging. Crystalline EDU images were also
collected by evaporating 1% EDU solution applied onto a glass slide.
Another round of SEM was performed using plants grown in
hydroponic tanks for 2 weeks with three different treatments, that
is, foliar spray of 600 ppm EDU, 300 ppm EDU, or water. SEM images
were taken with four experimental and two analytical replicates 1 and
7 days after EDU applications on the upper leaf surface of second
youngest fully expanded leaves of main tiller. Quantifications of amor-
phous EDU deposits were performed using images with 30× magnifi-
cation and 0.06 cm2 fixed leaf area.
2.10 | Transcriptome profiling
2.10.1 | RNA isolation and sample preparation
Two plants of BR28 genotype were selected randomly from each
treatment chamber and shoots (whole plants without roots) were
pooled together for one representative sample. RNA was extracted
from three replicates per treatment, resulting in 12 samples in total.
RNA extraction, purification, and quality determination from the
pooled shoot samples were performed according to De Abreu Neto,
Hurtado‐Perez, Wimmer, and Frei (2016). Total RNA was extracted with
a PeqGOLD Plant RNA extraction kit (Peqlab, Erlangen, Germany) includ-
ing RQ1 DNase (Promega) treatment. For the determination of quantity,
quality, and purity, the extracted samples were first analysed with
Nanodrop 2000c (Thermo Fisher Scientific Inc., Wilmington, DE, USA),
and integrity test was performed using 2100 Bioanalyser (Agilent
Technologies, Santa Clara, CA, USA). Only samples with RNA integrity
number values >8.4were subjected to transcriptome analyses (Figure S1).
2.10.2 | cDNA library construction and Illuminasequencing
cDNA libraries for Illumina sequencing were constructed according to
the manufacturer (TruSeq DNA Sample Prep Kit V3; Illumina). For the
quantification and qualification of the sample libraries, Agilent 2100
Bioanalyser and ABI StepOnePlus real‐time PCR system were used.
According to themanufacturer's guidelines (HiSeq 4000; Illumina), cluster
preparation and paired‐end read sequencing were performed. After the
raw sequencing, adapter sequenceswere trimmedusing theTrimmomatic
program (Bolger, Lohse, & Usadel, 2014). Quality of the trimmed reads
was checked by using the FastQC program (Andrews, 2010).
2.10.3 | Processing and mapping of Illuminasequencing reads
Raw sequencing reads were processed and subsequently mapped with
CLC Genomics Workbench software (version 10.0.4). Reads with more
than one mismatch in the adapter sequence were excluded, and low
quality, ambiguous nucleotides of sequence ends, and adapter
contaminations were removed by using quality trimming. Only ≥40‐
bp retained reads were further processed for analyses. The reads were
initially mapped to the NB rice reference genome sequence (Os‐
Nipponbare‐Reference‐IRGSP‐1.0, http://rapdb.dna.affrc.go. jp/
download/irgsp1.html). To be mapped, at least 90% of each read had
to fit with 90% similarity to the reference. Finally, IRGSP‐1.0 gene
model from the rice annotation project database (RAP‐DB) were used
for the gene annotation (https://plants.ensembl.org/Oryza_sativa/
Info/Annotation). The expression level of each transcript was
expressed as the fragments per kilobase of transcript per million
mapped reads (FPKM) value, calculated on the basis of the number
of mapped reads. The raw digital gene expression counts were nor-
malized by using the following equation: FPKM = 109(C)/(N L), where
FPKM (A) is the expression of gene A, C is the number of reads that
uniquely aligned to gene A, N is the total number of reads that
uniquely aligned to all genes, and L is the number of bases in gene A
(Shen et al., 2014). A multidimensional scaling (MDS) analysis was con-
ducted to display sample relationships based on the expressed genes
using the plotMDS function of the Bioconductor package limma (Ver-
sion 3.34.8) in R (Version 3.4.2 [2017‐09‐28]; Smyth, 2005). The dis-
tance between each pair of samples was calculated as the root mean
square deviation for the top 500 genes with the largest standard devi-
ations across all samples.
2.10.4 | Statistical analysis of differential geneexpression
Genes were considered for the following analyses if they were repre-
sented by a minimum of five mapped reads in all three replicates of at
least one sample and were declared as “expressed.” Then, the total
numbers of expressed genes were filtered to be expressed in at least
one treatment. In a total, 23,208 rice genes were filtered with their
respective expression value (FPKM) from the RNA‐Seq analysis for
the further statistical test. Expression data were then subjected to
two alternative mixed model analyses using PROC MIXED in SAS
9.4 (SAS Institute Inc., Cary, NC, USA; Gibson & Wolfinger, 2004). In
a one‐way analysis of variance (ANOVA), treatment was set as fixed
effect and chamber as a random effect. Linear contrasts between all
four treatments (control, control+EDU, ozone, and ozone+EDU) were
determined using the ESTIMATE statement. Second, a two‐way
ANOVA was conducted, in which ozone treatment, EDU treatment,
and their interaction were set as fixed effects, and the chamber was
set a random effect. False significances declared due to the multiple
testing were corrected by determining false discovery rate (FDR) using
SAS MULTTEST (Benjamini & Hochberg, 1995). Gene lists with differ-
entially regulated genes were curated for FDR values <0.05 and <0.1.
All the filtered genes with RAP‐DB locus ID and annotations were fur-
ther converted to the MSU rice genome annotation project database
(MSU locus ID and annotations, version 7.0, http://rice.plantbiology.
msu.edu/pub/data/Eukaryotic_Projects/o_sativa/annotation_dbs/
pseudomolecules/version_7.0/) by using R (Version 3.4.2) program
scripts (R Core Team, 2016) and RAP‐MSU_ID (http://rapdb.dna.
affrc.go.jp/download/irgsp1.html) conversion file. The statistical anal-
ysis of the total filtered genes with their RAP‐DB and MSU locus ID,
annotations, respective expression values (FPKM), and fold changes
were provided in Table S1.
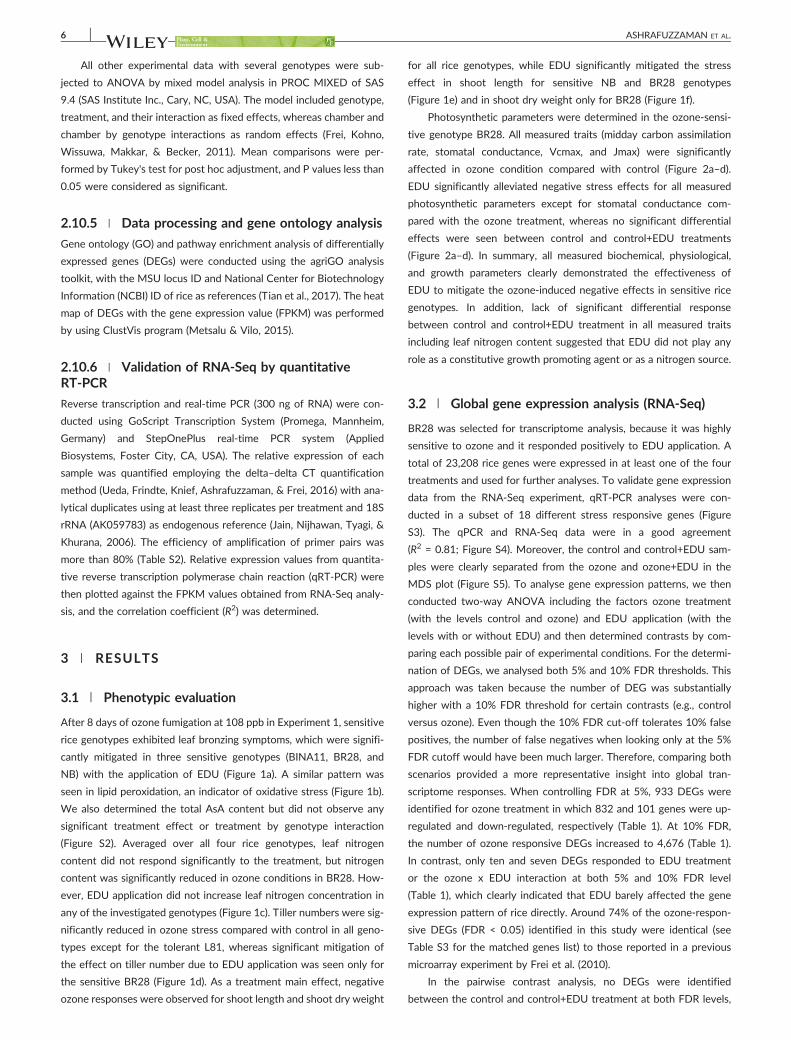
6 ASHRAFUZZAMAN ET AL.
All other experimental data with several genotypes were sub-
jected to ANOVA by mixed model analysis in PROC MIXED of SAS
9.4 (SAS Institute Inc., Cary, NC, USA). The model included genotype,
treatment, and their interaction as fixed effects, whereas chamber and
chamber by genotype interactions as random effects (Frei, Kohno,
Wissuwa, Makkar, & Becker, 2011). Mean comparisons were per-
formed by Tukey's test for post hoc adjustment, and P values less than
0.05 were considered as significant.
2.10.5 | Data processing and gene ontology analysis
Gene ontology (GO) and pathway enrichment analysis of differentially
expressed genes (DEGs) were conducted using the agriGO analysis
toolkit, with the MSU locus ID and National Center for Biotechnology
Information (NCBI) ID of rice as references (Tian et al., 2017). The heat
map of DEGs with the gene expression value (FPKM) was performed
by using ClustVis program (Metsalu & Vilo, 2015).
2.10.6 | Validation of RNA‐Seq by quantitativeRT‐PCR
Reverse transcription and real‐time PCR (300 ng of RNA) were con-
ducted using GoScript Transcription System (Promega, Mannheim,
Germany) and StepOnePlus real‐time PCR system (Applied
Biosystems, Foster City, CA, USA). The relative expression of each
sample was quantified employing the delta–delta CT quantification
method (Ueda, Frindte, Knief, Ashrafuzzaman, & Frei, 2016) with ana-
lytical duplicates using at least three replicates per treatment and 18S
rRNA (AK059783) as endogenous reference (Jain, Nijhawan, Tyagi, &
Khurana, 2006). The efficiency of amplification of primer pairs was
more than 80% (Table S2). Relative expression values from quantita-
tive reverse transcription polymerase chain reaction (qRT‐PCR) were
then plotted against the FPKM values obtained from RNA‐Seq analy-
sis, and the correlation coefficient (R2) was determined.
3 | RESULTS
3.1 | Phenotypic evaluation
After 8 days of ozone fumigation at 108 ppb in Experiment 1, sensitive
rice genotypes exhibited leaf bronzing symptoms, which were signifi-
cantly mitigated in three sensitive genotypes (BINA11, BR28, and
NB) with the application of EDU (Figure 1a). A similar pattern was
seen in lipid peroxidation, an indicator of oxidative stress (Figure 1b).
We also determined the total AsA content but did not observe any
significant treatment effect or treatment by genotype interaction
(Figure S2). Averaged over all four rice genotypes, leaf nitrogen
content did not respond significantly to the treatment, but nitrogen
content was significantly reduced in ozone conditions in BR28. How-
ever, EDU application did not increase leaf nitrogen concentration in
any of the investigated genotypes (Figure 1c). Tiller numbers were sig-
nificantly reduced in ozone stress compared with control in all geno-
types except for the tolerant L81, whereas significant mitigation of
the effect on tiller number due to EDU application was seen only for
the sensitive BR28 (Figure 1d). As a treatment main effect, negative
ozone responses were observed for shoot length and shoot dry weight
for all rice genotypes, while EDU significantly mitigated the stress
effect in shoot length for sensitive NB and BR28 genotypes
(Figure 1e) and in shoot dry weight only for BR28 (Figure 1f).
Photosynthetic parameters were determined in the ozone‐sensi-
tive genotype BR28. All measured traits (midday carbon assimilation
rate, stomatal conductance, Vcmax, and Jmax) were significantly
affected in ozone condition compared with control (Figure 2a–d).
EDU significantly alleviated negative stress effects for all measured
photosynthetic parameters except for stomatal conductance com-
pared with the ozone treatment, whereas no significant differential
effects were seen between control and control+EDU treatments
(Figure 2a–d). In summary, all measured biochemical, physiological,
and growth parameters clearly demonstrated the effectiveness of
EDU to mitigate the ozone‐induced negative effects in sensitive rice
genotypes. In addition, lack of significant differential response
between control and control+EDU treatment in all measured traits
including leaf nitrogen content suggested that EDU did not play any
role as a constitutive growth promoting agent or as a nitrogen source.
3.2 | Global gene expression analysis (RNA‐Seq)
BR28 was selected for transcriptome analysis, because it was highly
sensitive to ozone and it responded positively to EDU application. A
total of 23,208 rice genes were expressed in at least one of the four
treatments and used for further analyses. To validate gene expression
data from the RNA‐Seq experiment, qRT‐PCR analyses were con-
ducted in a subset of 18 different stress responsive genes (Figure
S3). The qPCR and RNA‐Seq data were in a good agreement
(R2 = 0.81; Figure S4). Moreover, the control and control+EDU sam-
ples were clearly separated from the ozone and ozone+EDU in the
MDS plot (Figure S5). To analyse gene expression patterns, we then
conducted two‐way ANOVA including the factors ozone treatment
(with the levels control and ozone) and EDU application (with the
levels with or without EDU) and then determined contrasts by com-
paring each possible pair of experimental conditions. For the determi-
nation of DEGs, we analysed both 5% and 10% FDR thresholds. This
approach was taken because the number of DEG was substantially
higher with a 10% FDR threshold for certain contrasts (e.g., control
versus ozone). Even though the 10% FDR cut‐off tolerates 10% false
positives, the number of false negatives when looking only at the 5%
FDR cutoff would have been much larger. Therefore, comparing both
scenarios provided a more representative insight into global tran-
scriptome responses. When controlling FDR at 5%, 933 DEGs were
identified for ozone treatment in which 832 and 101 genes were up‐
regulated and down‐regulated, respectively (Table 1). At 10% FDR,
the number of ozone responsive DEGs increased to 4,676 (Table 1).
In contrast, only ten and seven DEGs responded to EDU treatment
or the ozone x EDU interaction at both 5% and 10% FDR level
(Table 1), which clearly indicated that EDU barely affected the gene
expression pattern of rice directly. Around 74% of the ozone‐respon-
sive DEGs (FDR < 0.05) identified in this study were identical (see
Table S3 for the matched genes list) to those reported in a previous
microarray experiment by Frei et al. (2010).
In the pairwise contrast analysis, no DEGs were identified
between the control and control+EDU treatment at both FDR levels,
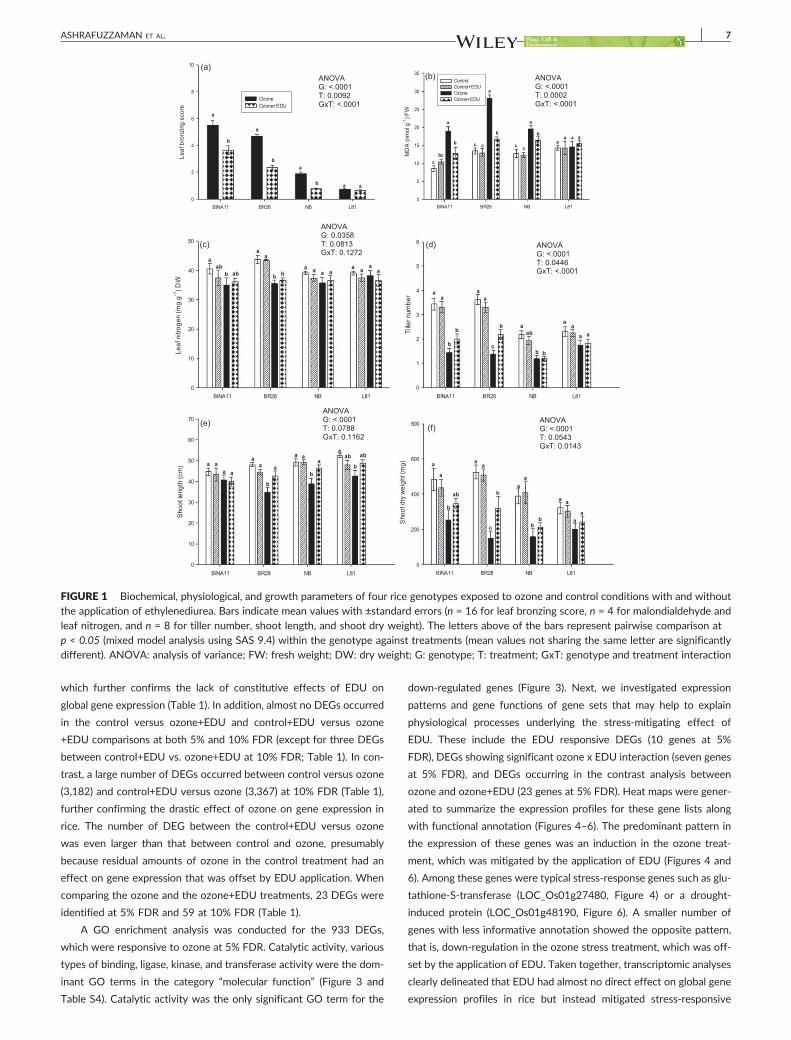
FIGURE 1 Biochemical, physiological, and growth parameters of four rice genotypes exposed to ozone and control conditions with and withoutthe application of ethylenediurea. Bars indicate mean values with ±standard errors (n = 16 for leaf bronzing score, n = 4 for malondialdehyde andleaf nitrogen, and n = 8 for tiller number, shoot length, and shoot dry weight). The letters above of the bars represent pairwise comparison atp < 0.05 (mixed model analysis using SAS 9.4) within the genotype against treatments (mean values not sharing the same letter are significantlydifferent). ANOVA: analysis of variance; FW: fresh weight; DW: dry weight; G: genotype; T: treatment; GxT: genotype and treatment interaction
ASHRAFUZZAMAN ET AL. 7
which further confirms the lack of constitutive effects of EDU on
global gene expression (Table 1). In addition, almost no DEGs occurred
in the control versus ozone+EDU and control+EDU versus ozone
+EDU comparisons at both 5% and 10% FDR (except for three DEGs
between control+EDU vs. ozone+EDU at 10% FDR; Table 1). In con-
trast, a large number of DEGs occurred between control versus ozone
(3,182) and control+EDU versus ozone (3,367) at 10% FDR (Table 1),
further confirming the drastic effect of ozone on gene expression in
rice. The number of DEG between the control+EDU versus ozone
was even larger than that between control and ozone, presumably
because residual amounts of ozone in the control treatment had an
effect on gene expression that was offset by EDU application. When
comparing the ozone and the ozone+EDU treatments, 23 DEGs were
identified at 5% FDR and 59 at 10% FDR (Table 1).
A GO enrichment analysis was conducted for the 933 DEGs,
which were responsive to ozone at 5% FDR. Catalytic activity, various
types of binding, ligase, kinase, and transferase activity were the dom-
inant GO terms in the category “molecular function” (Figure 3 and
Table S4). Catalytic activity was the only significant GO term for the
down‐regulated genes (Figure 3). Next, we investigated expression
patterns and gene functions of gene sets that may help to explain
physiological processes underlying the stress‐mitigating effect of
EDU. These include the EDU responsive DEGs (10 genes at 5%
FDR), DEGs showing significant ozone x EDU interaction (seven genes
at 5% FDR), and DEGs occurring in the contrast analysis between
ozone and ozone+EDU (23 genes at 5% FDR). Heat maps were gener-
ated to summarize the expression profiles for these gene lists along
with functional annotation (Figures 4–6). The predominant pattern in
the expression of these genes was an induction in the ozone treat-
ment, which was mitigated by the application of EDU (Figures 4 and
6). Among these genes were typical stress‐response genes such as glu-
tathione‐S‐transferase (LOC_Os01g27480, Figure 4) or a drought‐
induced protein (LOC_Os01g48190, Figure 6). A smaller number of
genes with less informative annotation showed the opposite pattern,
that is, down‐regulation in the ozone stress treatment, which was off-
set by the application of EDU. Taken together, transcriptomic analyses
clearly delineated that EDU had almost no direct effect on global gene
expression profiles in rice but instead mitigated stress‐responsive
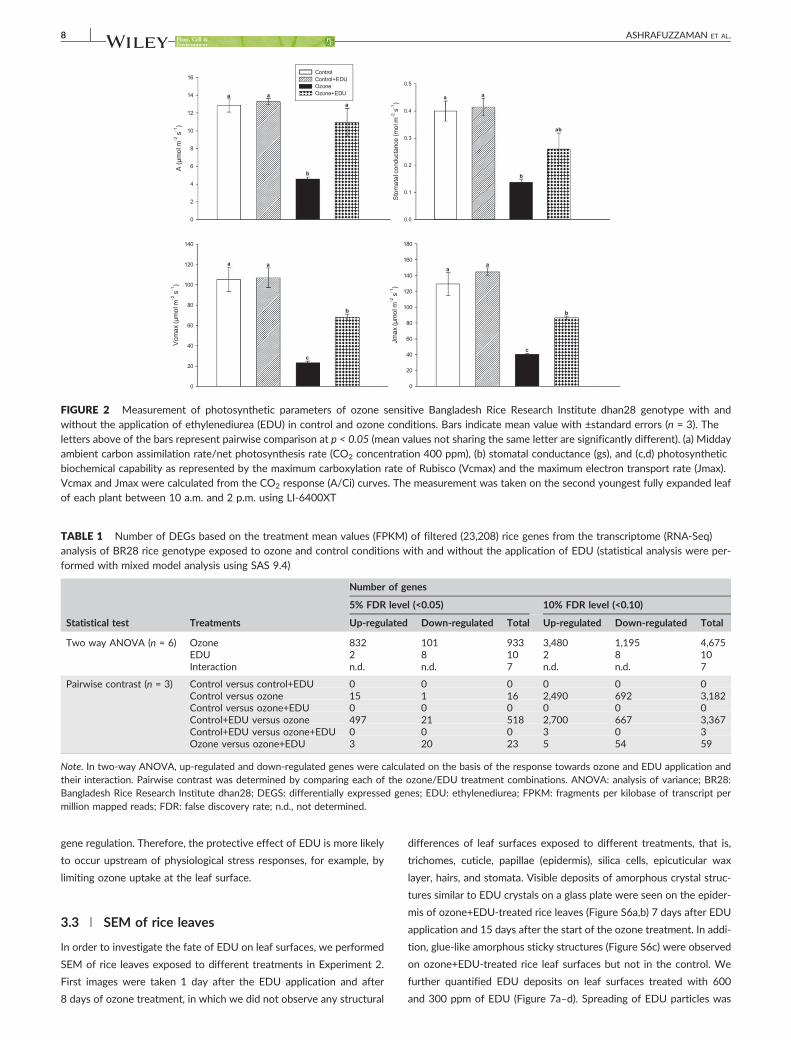
TABLE 1 Number of DEGs based on the treatment mean values (FPKM) of filtered (23,208) rice genes from the transcriptome (RNA‐Seq)analysis of BR28 rice genotype exposed to ozone and control conditions with and without the application of EDU (statistical analysis were per-formed with mixed model analysis using SAS 9.4)
Statistical test Treatments
Number of genes
5% FDR level (<0.05) 10% FDR level (<0.10)
Up‐regulated Down‐regulated Total Up‐regulated Down‐regulated Total
Two way ANOVA (n = 6) Ozone 832 101 933 3,480 1,195 4,675EDU 2 8 10 2 8 10Interaction n.d. n.d. 7 n.d. n.d. 7
Pairwise contrast (n = 3) Control versus control+EDU 0 0 0 0 0 0Control versus ozone 15 1 16 2,490 692 3,182Control versus ozone+EDU 0 0 0 0 0 0Control+EDU versus ozone 497 21 518 2,700 667 3,367Control+EDU versus ozone+EDU 0 0 0 3 0 3Ozone versus ozone+EDU 3 20 23 5 54 59
Note. In two‐way ANOVA, up‐regulated and down‐regulated genes were calculated on the basis of the response towards ozone and EDU application andtheir interaction. Pairwise contrast was determined by comparing each of the ozone/EDU treatment combinations. ANOVA: analysis of variance; BR28:Bangladesh Rice Research Institute dhan28; DEGS: differentially expressed genes; EDU: ethylenediurea; FPKM: fragments per kilobase of transcript permillion mapped reads; FDR: false discovery rate; n.d., not determined.
FIGURE 2 Measurement of photosynthetic parameters of ozone sensitive Bangladesh Rice Research Institute dhan28 genotype with andwithout the application of ethylenediurea (EDU) in control and ozone conditions. Bars indicate mean value with ±standard errors (n = 3). Theletters above of the bars represent pairwise comparison at p < 0.05 (mean values not sharing the same letter are significantly different). (a) Middayambient carbon assimilation rate/net photosynthesis rate (CO2 concentration 400 ppm), (b) stomatal conductance (gs), and (c,d) photosyntheticbiochemical capability as represented by the maximum carboxylation rate of Rubisco (Vcmax) and the maximum electron transport rate (Jmax).Vcmax and Jmax were calculated from the CO2 response (A/Ci) curves. The measurement was taken on the second youngest fully expanded leafof each plant between 10 a.m. and 2 p.m. using LI‐6400XT
8 ASHRAFUZZAMAN ET AL.
gene regulation. Therefore, the protective effect of EDU is more likely
to occur upstream of physiological stress responses, for example, by
limiting ozone uptake at the leaf surface.
3.3 | SEM of rice leaves
In order to investigate the fate of EDU on leaf surfaces, we performed
SEM of rice leaves exposed to different treatments in Experiment 2.
First images were taken 1 day after the EDU application and after
8 days of ozone treatment, in which we did not observe any structural
differences of leaf surfaces exposed to different treatments, that is,
trichomes, cuticle, papillae (epidermis), silica cells, epicuticular wax
layer, hairs, and stomata. Visible deposits of amorphous crystal struc-
tures similar to EDU crystals on a glass plate were seen on the epider-
mis of ozone+EDU‐treated rice leaves (Figure S6a,b) 7 days after EDU
application and 15 days after the start of the ozone treatment. In addi-
tion, glue‐like amorphous sticky structures (Figure S6c) were observed
on ozone+EDU‐treated rice leaf surfaces but not in the control. We
further quantified EDU deposits on leaf surfaces treated with 600
and 300 ppm of EDU (Figure 7a–d). Spreading of EDU particles was
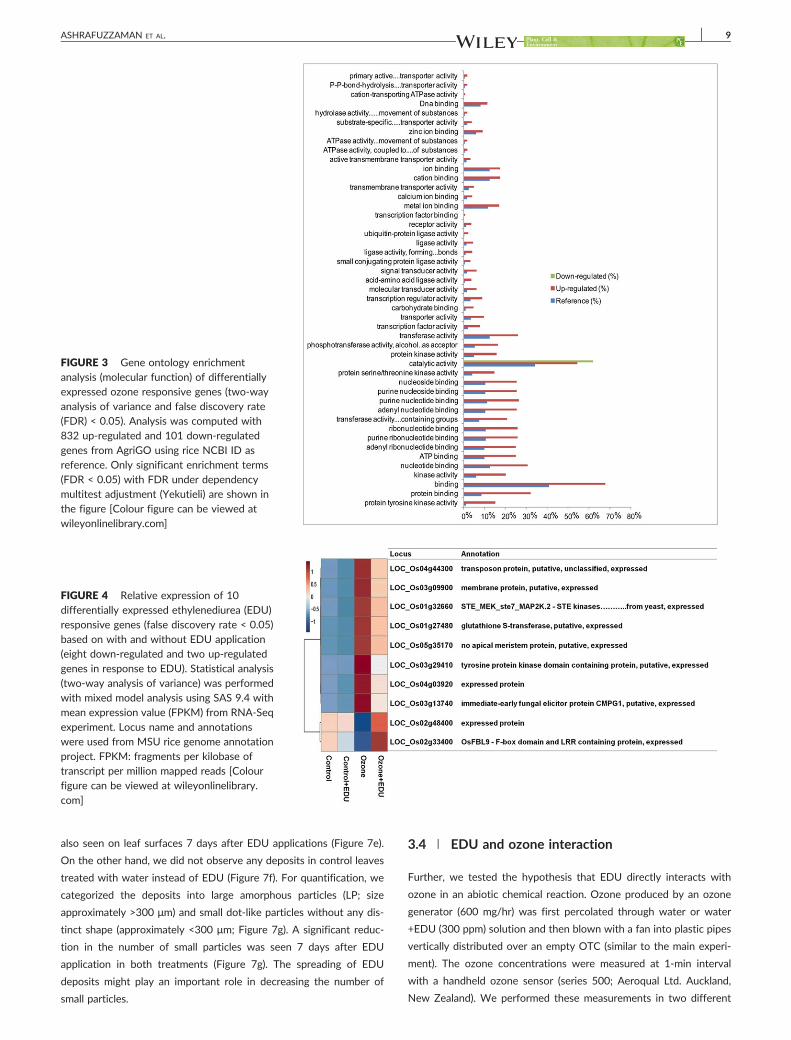
FIGURE 3 Gene ontology enrichmentanalysis (molecular function) of differentiallyexpressed ozone responsive genes (two‐wayanalysis of variance and false discovery rate(FDR) < 0.05). Analysis was computed with832 up‐regulated and 101 down‐regulatedgenes from AgriGO using rice NCBI ID asreference. Only significant enrichment terms(FDR < 0.05) with FDR under dependencymultitest adjustment (Yekutieli) are shown inthe figure [Colour figure can be viewed atwileyonlinelibrary.com]
FIGURE 4 Relative expression of 10differentially expressed ethylenediurea (EDU)responsive genes (false discovery rate < 0.05)based on with and without EDU application(eight down‐regulated and two up‐regulatedgenes in response to EDU). Statistical analysis(two‐way analysis of variance) was performedwith mixed model analysis using SAS 9.4 withmean expression value (FPKM) from RNA‐Seqexperiment. Locus name and annotationswere used from MSU rice genome annotationproject. FPKM: fragments per kilobase oftranscript per million mapped reads [Colourfigure can be viewed at wileyonlinelibrary.com]
ASHRAFUZZAMAN ET AL. 9
also seen on leaf surfaces 7 days after EDU applications (Figure 7e).
On the other hand, we did not observe any deposits in control leaves
treated with water instead of EDU (Figure 7f). For quantification, we
categorized the deposits into large amorphous particles (LP; size
approximately >300 μm) and small dot‐like particles without any dis-
tinct shape (approximately <300 μm; Figure 7g). A significant reduc-
tion in the number of small particles was seen 7 days after EDU
application in both treatments (Figure 7g). The spreading of EDU
deposits might play an important role in decreasing the number of
small particles.
3.4 | EDU and ozone interaction
Further, we tested the hypothesis that EDU directly interacts with
ozone in an abiotic chemical reaction. Ozone produced by an ozone
generator (600 mg/hr) was first percolated through water or water
+EDU (300 ppm) solution and then blown with a fan into plastic pipes
vertically distributed over an empty OTC (similar to the main experi-
ment). The ozone concentrations were measured at 1‐min interval
with a handheld ozone sensor (series 500; Aeroqual Ltd. Auckland,
New Zealand). We performed these measurements in two different
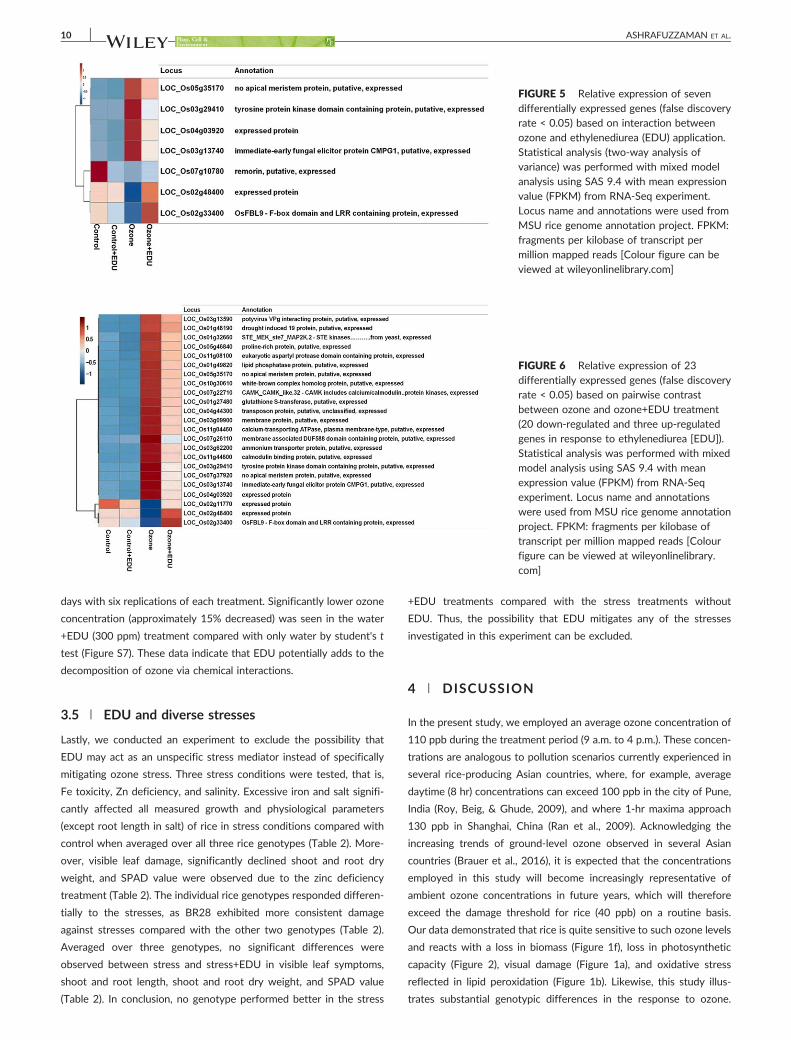
FIGURE 5 Relative expression of sevendifferentially expressed genes (false discoveryrate < 0.05) based on interaction betweenozone and ethylenediurea (EDU) application.Statistical analysis (two‐way analysis ofvariance) was performed with mixed modelanalysis using SAS 9.4 with mean expressionvalue (FPKM) from RNA‐Seq experiment.Locus name and annotations were used fromMSU rice genome annotation project. FPKM:fragments per kilobase of transcript permillion mapped reads [Colour figure can beviewed at wileyonlinelibrary.com]
FIGURE 6 Relative expression of 23differentially expressed genes (false discoveryrate < 0.05) based on pairwise contrastbetween ozone and ozone+EDU treatment(20 down‐regulated and three up‐regulatedgenes in response to ethylenediurea [EDU]).Statistical analysis was performed with mixedmodel analysis using SAS 9.4 with meanexpression value (FPKM) from RNA‐Seqexperiment. Locus name and annotationswere used from MSU rice genome annotationproject. FPKM: fragments per kilobase oftranscript per million mapped reads [Colourfigure can be viewed at wileyonlinelibrary.com]
10 ASHRAFUZZAMAN ET AL.
days with six replications of each treatment. Significantly lower ozone
concentration (approximately 15% decreased) was seen in the water
+EDU (300 ppm) treatment compared with only water by student's t
test (Figure S7). These data indicate that EDU potentially adds to the
decomposition of ozone via chemical interactions.
3.5 | EDU and diverse stresses
Lastly, we conducted an experiment to exclude the possibility that
EDU may act as an unspecific stress mediator instead of specifically
mitigating ozone stress. Three stress conditions were tested, that is,
Fe toxicity, Zn deficiency, and salinity. Excessive iron and salt signifi-
cantly affected all measured growth and physiological parameters
(except root length in salt) of rice in stress conditions compared with
control when averaged over all three rice genotypes (Table 2). More-
over, visible leaf damage, significantly declined shoot and root dry
weight, and SPAD value were observed due to the zinc deficiency
treatment (Table 2). The individual rice genotypes responded differen-
tially to the stresses, as BR28 exhibited more consistent damage
against stresses compared with the other two genotypes (Table 2).
Averaged over three genotypes, no significant differences were
observed between stress and stress+EDU in visible leaf symptoms,
shoot and root length, shoot and root dry weight, and SPAD value
(Table 2). In conclusion, no genotype performed better in the stress
+EDU treatments compared with the stress treatments without
EDU. Thus, the possibility that EDU mitigates any of the stresses
investigated in this experiment can be excluded.
4 | DISCUSSION
In the present study, we employed an average ozone concentration of
110 ppb during the treatment period (9 a.m. to 4 p.m.). These concen-
trations are analogous to pollution scenarios currently experienced in
several rice‐producing Asian countries, where, for example, average
daytime (8 hr) concentrations can exceed 100 ppb in the city of Pune,
India (Roy, Beig, & Ghude, 2009), and where 1‐hr maxima approach
130 ppb in Shanghai, China (Ran et al., 2009). Acknowledging the
increasing trends of ground‐level ozone observed in several Asian
countries (Brauer et al., 2016), it is expected that the concentrations
employed in this study will become increasingly representative of
ambient ozone concentrations in future years, which will therefore
exceed the damage threshold for rice (40 ppb) on a routine basis.
Our data demonstrated that rice is quite sensitive to such ozone levels
and reacts with a loss in biomass (Figure 1f), loss in photosynthetic
capacity (Figure 2), visual damage (Figure 1a), and oxidative stress
reflected in lipid peroxidation (Figure 1b). Likewise, this study illus-
trates substantial genotypic differences in the response to ozone.
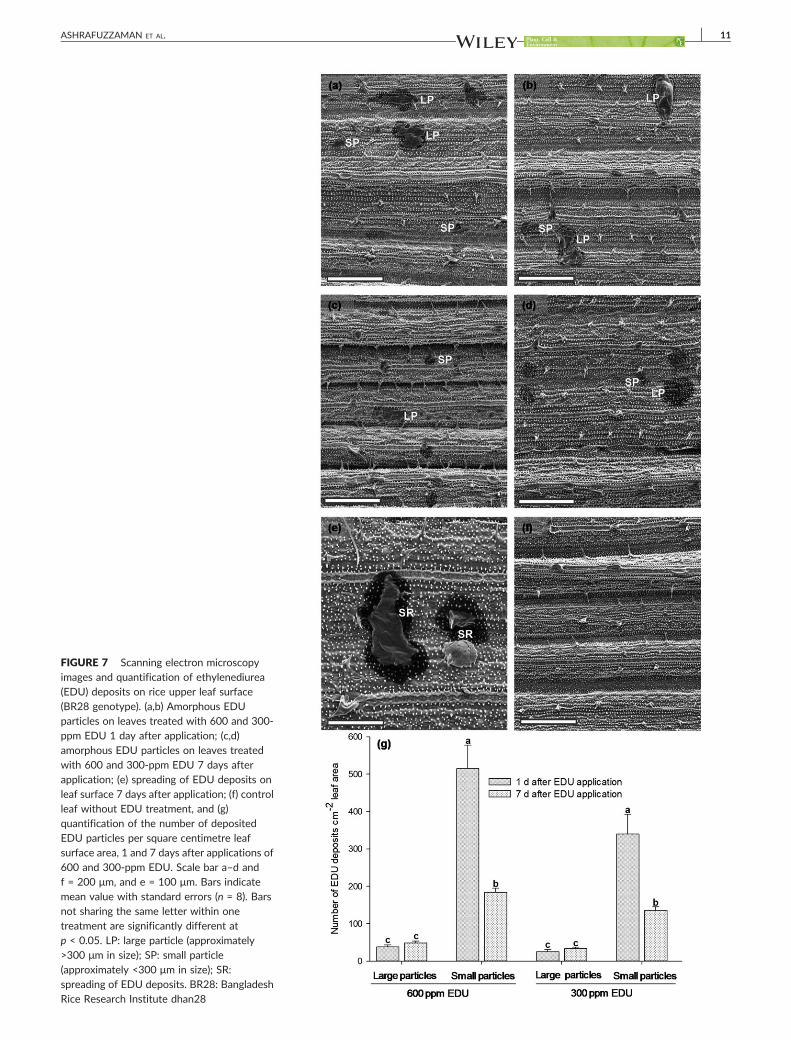
FIGURE 7 Scanning electron microscopyimages and quantification of ethylenediurea(EDU) deposits on rice upper leaf surface(BR28 genotype). (a,b) Amorphous EDUparticles on leaves treated with 600 and 300‐ppm EDU 1 day after application; (c,d)amorphous EDU particles on leaves treatedwith 600 and 300‐ppm EDU 7 days afterapplication; (e) spreading of EDU deposits onleaf surface 7 days after application; (f) controlleaf without EDU treatment, and (g)quantification of the number of depositedEDU particles per square centimetre leafsurface area, 1 and 7 days after applications of600 and 300‐ppm EDU. Scale bar a–d andf = 200 μm, and e = 100 μm. Bars indicatemean value with standard errors (n = 8). Barsnot sharing the same letter within onetreatment are significantly different atp < 0.05. LP: large particle (approximately>300 μm in size); SP: small particle(approximately <300 μm in size); SR:spreading of EDU deposits. BR28: BangladeshRice Research Institute dhan28
ASHRAFUZZAMAN ET AL. 11
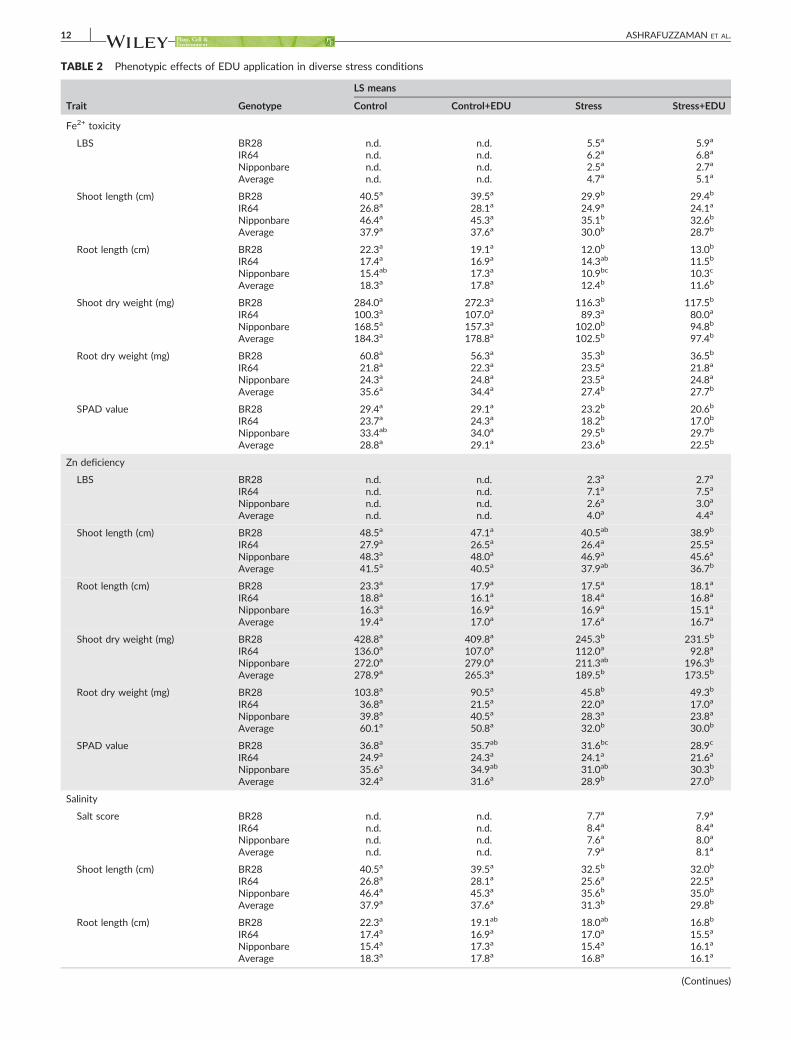
TABLE 2 Phenotypic effects of EDU application in diverse stress conditions
Trait Genotype
LS means
Control Control+EDU Stress Stress+EDU
Fe2+ toxicity
LBS BR28 n.d. n.d. 5.5a 5.9a
IR64 n.d. n.d. 6.2a 6.8a
Nipponbare n.d. n.d. 2.5a 2.7a
Average n.d. n.d. 4.7a 5.1a
Shoot length (cm) BR28 40.5a 39.5a 29.9b 29.4b
IR64 26.8a 28.1a 24.9a 24.1a
Nipponbare 46.4a 45.3a 35.1b 32.6b
Average 37.9a 37.6a 30.0b 28.7b
Root length (cm) BR28 22.3a 19.1a 12.0b 13.0b
IR64 17.4a 16.9a 14.3ab 11.5b
Nipponbare 15.4ab 17.3a 10.9bc 10.3c
Average 18.3a 17.8a 12.4b 11.6b
Shoot dry weight (mg) BR28 284.0a 272.3a 116.3b 117.5b
IR64 100.3a 107.0a 89.3a 80.0a
Nipponbare 168.5a 157.3a 102.0b 94.8b
Average 184.3a 178.8a 102.5b 97.4b
Root dry weight (mg) BR28 60.8a 56.3a 35.3b 36.5b
IR64 21.8a 22.3a 23.5a 21.8a
Nipponbare 24.3a 24.8a 23.5a 24.8a
Average 35.6a 34.4a 27.4b 27.7b
SPAD value BR28 29.4a 29.1a 23.2b 20.6b
IR64 23.7a 24.3a 18.2b 17.0b
Nipponbare 33.4ab 34.0a 29.5b 29.7b
Average 28.8a 29.1a 23.6b 22.5b
Zn deficiency
LBS BR28 n.d. n.d. 2.3a 2.7a
IR64 n.d. n.d. 7.1a 7.5a
Nipponbare n.d. n.d. 2.6a 3.0a
Average n.d. n.d. 4.0a 4.4a
Shoot length (cm) BR28 48.5a 47.1a 40.5ab 38.9b
IR64 27.9a 26.5a 26.4a 25.5a
Nipponbare 48.3a 48.0a 46.9a 45.6a
Average 41.5a 40.5a 37.9ab 36.7b
Root length (cm) BR28 23.3a 17.9a 17.5a 18.1a
IR64 18.8a 16.1a 18.4a 16.8a
Nipponbare 16.3a 16.9a 16.9a 15.1a
Average 19.4a 17.0a 17.6a 16.7a
Shoot dry weight (mg) BR28 428.8a 409.8a 245.3b 231.5b
IR64 136.0a 107.0a 112.0a 92.8a
Nipponbare 272.0a 279.0a 211.3ab 196.3b
Average 278.9a 265.3a 189.5b 173.5b
Root dry weight (mg) BR28 103.8a 90.5a 45.8b 49.3b
IR64 36.8a 21.5a 22.0a 17.0a
Nipponbare 39.8a 40.5a 28.3a 23.8a
Average 60.1a 50.8a 32.0b 30.0b
SPAD value BR28 36.8a 35.7ab 31.6bc 28.9c
IR64 24.9a 24.3a 24.1a 21.6a
Nipponbare 35.6a 34.9ab 31.0ab 30.3b
Average 32.4a 31.6a 28.9b 27.0b
Salinity
Salt score BR28 n.d. n.d. 7.7a 7.9a
IR64 n.d. n.d. 8.4a 8.4a
Nipponbare n.d. n.d. 7.6a 8.0a
Average n.d. n.d. 7.9a 8.1a
Shoot length (cm) BR28 40.5a 39.5a 32.5b 32.0b
IR64 26.8a 28.1a 25.6a 22.5a
Nipponbare 46.4a 45.3a 35.6b 35.0b
Average 37.9a 37.6a 31.3b 29.8b
Root length (cm) BR28 22.3a 19.1ab 18.0ab 16.8b
IR64 17.4a 16.9a 17.0a 15.5a
Nipponbare 15.4a 17.3a 15.4a 16.1a
Average 18.3a 17.8a 16.8a 16.1a
(Continues)
12 ASHRAFUZZAMAN ET AL.
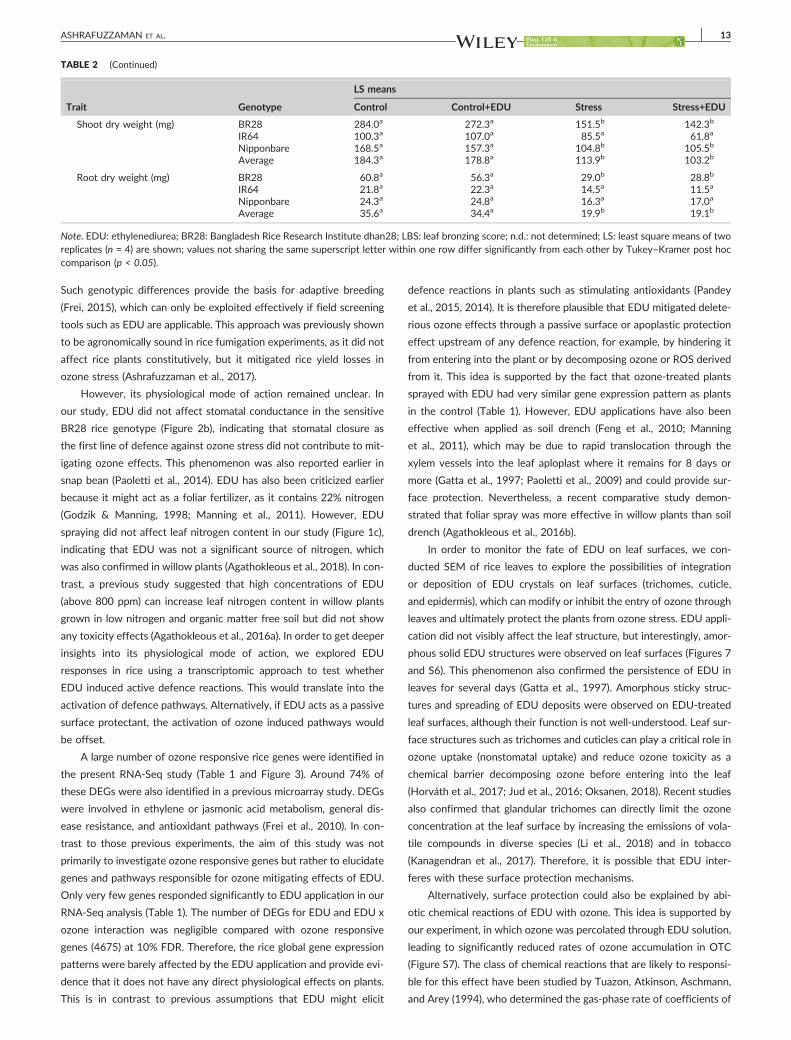
TABLE 2 (Continued)
Trait Genotype
LS means
Control Control+EDU Stress Stress+EDU
Shoot dry weight (mg) BR28 284.0a 272.3a 151.5b 142.3b
IR64 100.3a 107.0a 85.5a 61.8a
Nipponbare 168.5a 157.3a 104.8b 105.5b
Average 184.3a 178.8a 113.9b 103.2b
Root dry weight (mg) BR28 60.8a 56.3a 29.0b 28.8b
IR64 21.8a 22.3a 14.5a 11.5a
Nipponbare 24.3a 24.8a 16.3a 17.0a
Average 35.6a 34.4a 19.9b 19.1b
Note. EDU: ethylenediurea; BR28: Bangladesh Rice Research Institute dhan28; LBS: leaf bronzing score; n.d.: not determined; LS: least square means of tworeplicates (n = 4) are shown; values not sharing the same superscript letter within one row differ significantly from each other by Tukey–Kramer post hoccomparison (p < 0.05).
ASHRAFUZZAMAN ET AL. 13
Such genotypic differences provide the basis for adaptive breeding
(Frei, 2015), which can only be exploited effectively if field screening
tools such as EDU are applicable. This approach was previously shown
to be agronomically sound in rice fumigation experiments, as it did not
affect rice plants constitutively, but it mitigated rice yield losses in
ozone stress (Ashrafuzzaman et al., 2017).
However, its physiological mode of action remained unclear. In
our study, EDU did not affect stomatal conductance in the sensitive
BR28 rice genotype (Figure 2b), indicating that stomatal closure as
the first line of defence against ozone stress did not contribute to mit-
igating ozone effects. This phenomenon was also reported earlier in
snap bean (Paoletti et al., 2014). EDU has also been criticized earlier
because it might act as a foliar fertilizer, as it contains 22% nitrogen
(Godzik & Manning, 1998; Manning et al., 2011). However, EDU
spraying did not affect leaf nitrogen content in our study (Figure 1c),
indicating that EDU was not a significant source of nitrogen, which
was also confirmed in willow plants (Agathokleous et al., 2018). In con-
trast, a previous study suggested that high concentrations of EDU
(above 800 ppm) can increase leaf nitrogen content in willow plants
grown in low nitrogen and organic matter free soil but did not show
any toxicity effects (Agathokleous et al., 2016a). In order to get deeper
insights into its physiological mode of action, we explored EDU
responses in rice using a transcriptomic approach to test whether
EDU induced active defence reactions. This would translate into the
activation of defence pathways. Alternatively, if EDU acts as a passive
surface protectant, the activation of ozone induced pathways would
be offset.
A large number of ozone responsive rice genes were identified in
the present RNA‐Seq study (Table 1 and Figure 3). Around 74% of
these DEGs were also identified in a previous microarray study. DEGs
were involved in ethylene or jasmonic acid metabolism, general dis-
ease resistance, and antioxidant pathways (Frei et al., 2010). In con-
trast to those previous experiments, the aim of this study was not
primarily to investigate ozone responsive genes but rather to elucidate
genes and pathways responsible for ozone mitigating effects of EDU.
Only very few genes responded significantly to EDU application in our
RNA‐Seq analysis (Table 1). The number of DEGs for EDU and EDU x
ozone interaction was negligible compared with ozone responsive
genes (4675) at 10% FDR. Therefore, the rice global gene expression
patterns were barely affected by the EDU application and provide evi-
dence that it does not have any direct physiological effects on plants.
This is in contrast to previous assumptions that EDU might elicit
defence reactions in plants such as stimulating antioxidants (Pandey
et al., 2015, 2014). It is therefore plausible that EDU mitigated delete-
rious ozone effects through a passive surface or apoplastic protection
effect upstream of any defence reaction, for example, by hindering it
from entering into the plant or by decomposing ozone or ROS derived
from it. This idea is supported by the fact that ozone‐treated plants
sprayed with EDU had very similar gene expression pattern as plants
in the control (Table 1). However, EDU applications have also been
effective when applied as soil drench (Feng et al., 2010; Manning
et al., 2011), which may be due to rapid translocation through the
xylem vessels into the leaf aploplast where it remains for 8 days or
more (Gatta et al., 1997; Paoletti et al., 2009) and could provide sur-
face protection. Nevertheless, a recent comparative study demon-
strated that foliar spray was more effective in willow plants than soil
drench (Agathokleous et al., 2016b).
In order to monitor the fate of EDU on leaf surfaces, we con-
ducted SEM of rice leaves to explore the possibilities of integration
or deposition of EDU crystals on leaf surfaces (trichomes, cuticle,
and epidermis), which can modify or inhibit the entry of ozone through
leaves and ultimately protect the plants from ozone stress. EDU appli-
cation did not visibly affect the leaf structure, but interestingly, amor-
phous solid EDU structures were observed on leaf surfaces (Figures 7
and S6). This phenomenon also confirmed the persistence of EDU in
leaves for several days (Gatta et al., 1997). Amorphous sticky struc-
tures and spreading of EDU deposits were observed on EDU‐treated
leaf surfaces, although their function is not well‐understood. Leaf sur-
face structures such as trichomes and cuticles can play a critical role in
ozone uptake (nonstomatal uptake) and reduce ozone toxicity as a
chemical barrier decomposing ozone before entering into the leaf
(Horváth et al., 2017; Jud et al., 2016; Oksanen, 2018). Recent studies
also confirmed that glandular trichomes can directly limit the ozone
concentration at the leaf surface by increasing the emissions of vola-
tile compounds in diverse species (Li et al., 2018) and in tobacco
(Kanagendran et al., 2017). Therefore, it is possible that EDU inter-
feres with these surface protection mechanisms.
Alternatively, surface protection could also be explained by abi-
otic chemical reactions of EDU with ozone. This idea is supported by
our experiment, in which ozone was percolated through EDU solution,
leading to significantly reduced rates of ozone accumulation in OTC
(Figure S7). The class of chemical reactions that are likely to responsi-
ble for this effect have been studied by Tuazon, Atkinson, Aschmann,
and Arey (1994), who determined the gas‐phase rate of coefficients of
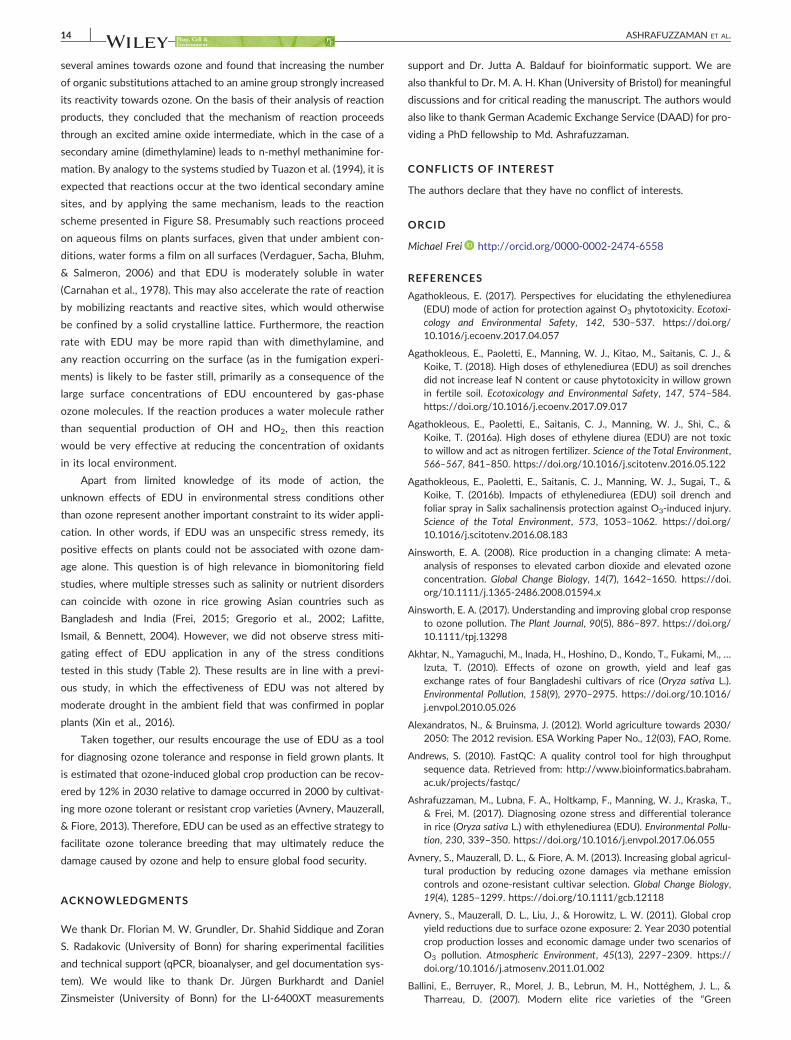
14 ASHRAFUZZAMAN ET AL.
several amines towards ozone and found that increasing the number
of organic substitutions attached to an amine group strongly increased
its reactivity towards ozone. On the basis of their analysis of reaction
products, they concluded that the mechanism of reaction proceeds
through an excited amine oxide intermediate, which in the case of a
secondary amine (dimethylamine) leads to n‐methyl methanimine for-
mation. By analogy to the systems studied by Tuazon et al. (1994), it is
expected that reactions occur at the two identical secondary amine
sites, and by applying the same mechanism, leads to the reaction
scheme presented in Figure S8. Presumably such reactions proceed
on aqueous films on plants surfaces, given that under ambient con-
ditions, water forms a film on all surfaces (Verdaguer, Sacha, Bluhm,
& Salmeron, 2006) and that EDU is moderately soluble in water
(Carnahan et al., 1978). This may also accelerate the rate of reaction
by mobilizing reactants and reactive sites, which would otherwise
be confined by a solid crystalline lattice. Furthermore, the reaction
rate with EDU may be more rapid than with dimethylamine, and
any reaction occurring on the surface (as in the fumigation experi-
ments) is likely to be faster still, primarily as a consequence of the
large surface concentrations of EDU encountered by gas‐phase
ozone molecules. If the reaction produces a water molecule rather
than sequential production of OH and HO2, then this reaction
would be very effective at reducing the concentration of oxidants
in its local environment.
Apart from limited knowledge of its mode of action, the
unknown effects of EDU in environmental stress conditions other
than ozone represent another important constraint to its wider appli-
cation. In other words, if EDU was an unspecific stress remedy, its
positive effects on plants could not be associated with ozone dam-
age alone. This question is of high relevance in biomonitoring field
studies, where multiple stresses such as salinity or nutrient disorders
can coincide with ozone in rice growing Asian countries such as
Bangladesh and India (Frei, 2015; Gregorio et al., 2002; Lafitte,
Ismail, & Bennett, 2004). However, we did not observe stress miti-
gating effect of EDU application in any of the stress conditions
tested in this study (Table 2). These results are in line with a previ-
ous study, in which the effectiveness of EDU was not altered by
moderate drought in the ambient field that was confirmed in poplar
plants (Xin et al., 2016).
Taken together, our results encourage the use of EDU as a tool
for diagnosing ozone tolerance and response in field grown plants. It
is estimated that ozone‐induced global crop production can be recov-
ered by 12% in 2030 relative to damage occurred in 2000 by cultivat-
ing more ozone tolerant or resistant crop varieties (Avnery, Mauzerall,
& Fiore, 2013). Therefore, EDU can be used as an effective strategy to
facilitate ozone tolerance breeding that may ultimately reduce the
damage caused by ozone and help to ensure global food security.
ACKNOWLEDGMENTS
We thank Dr. Florian M. W. Grundler, Dr. Shahid Siddique and Zoran
S. Radakovic (University of Bonn) for sharing experimental facilities
and technical support (qPCR, bioanalyser, and gel documentation sys-
tem). We would like to thank Dr. Jürgen Burkhardt and Daniel
Zinsmeister (University of Bonn) for the LI‐6400XT measurements
support and Dr. Jutta A. Baldauf for bioinformatic support. We are
also thankful to Dr. M. A. H. Khan (University of Bristol) for meaningful
discussions and for critical reading the manuscript. The authors would
also like to thank German Academic Exchange Service (DAAD) for pro-
viding a PhD fellowship to Md. Ashrafuzzaman.
CONFLICTS OF INTEREST
The authors declare that they have no conflict of interests.
ORCID
Michael Frei http://orcid.org/0000-0002-2474-6558
REFERENCES
Agathokleous, E. (2017). Perspectives for elucidating the ethylenediurea(EDU) mode of action for protection against O3 phytotoxicity. Ecotoxi-cology and Environmental Safety, 142, 530–537. https://doi.org/10.1016/j.ecoenv.2017.04.057
Agathokleous, E., Paoletti, E., Manning, W. J., Kitao, M., Saitanis, C. J., &Koike, T. (2018). High doses of ethylenediurea (EDU) as soil drenchesdid not increase leaf N content or cause phytotoxicity in willow grownin fertile soil. Ecotoxicology and Environmental Safety, 147, 574–584.https://doi.org/10.1016/j.ecoenv.2017.09.017
Agathokleous, E., Paoletti, E., Saitanis, C. J., Manning, W. J., Shi, C., &Koike, T. (2016a). High doses of ethylene diurea (EDU) are not toxicto willow and act as nitrogen fertilizer. Science of the Total Environment,566–567, 841–850. https://doi.org/10.1016/j.scitotenv.2016.05.122
Agathokleous, E., Paoletti, E., Saitanis, C. J., Manning, W. J., Sugai, T., &Koike, T. (2016b). Impacts of ethylenediurea (EDU) soil drench andfoliar spray in Salix sachalinensis protection against O3‐induced injury.Science of the Total Environment, 573, 1053–1062. https://doi.org/10.1016/j.scitotenv.2016.08.183
Ainsworth, E. A. (2008). Rice production in a changing climate: A meta‐analysis of responses to elevated carbon dioxide and elevated ozoneconcentration. Global Change Biology, 14(7), 1642–1650. https://doi.org/10.1111/j.1365‐2486.2008.01594.x
Ainsworth, E. A. (2017). Understanding and improving global crop responseto ozone pollution. The Plant Journal, 90(5), 886–897. https://doi.org/10.1111/tpj.13298
Akhtar, N., Yamaguchi, M., Inada, H., Hoshino, D., Kondo, T., Fukami, M., …Izuta, T. (2010). Effects of ozone on growth, yield and leaf gasexchange rates of four Bangladeshi cultivars of rice (Oryza sativa L.).Environmental Pollution, 158(9), 2970–2975. https://doi.org/10.1016/j.envpol.2010.05.026
Alexandratos, N., & Bruinsma, J. (2012). World agriculture towards 2030/2050: The 2012 revision. ESA Working Paper No., 12(03), FAO, Rome.
Andrews, S. (2010). FastQC: A quality control tool for high throughputsequence data. Retrieved from: http://www.bioinformatics.babraham.ac.uk/projects/fastqc/
Ashrafuzzaman, M., Lubna, F. A., Holtkamp, F., Manning, W. J., Kraska, T.,& Frei, M. (2017). Diagnosing ozone stress and differential tolerancein rice (Oryza sativa L.) with ethylenediurea (EDU). Environmental Pollu-tion, 230, 339–350. https://doi.org/10.1016/j.envpol.2017.06.055
Avnery, S., Mauzerall, D. L., & Fiore, A. M. (2013). Increasing global agricul-tural production by reducing ozone damages via methane emissioncontrols and ozone‐resistant cultivar selection. Global Change Biology,19(4), 1285–1299. https://doi.org/10.1111/gcb.12118
Avnery, S., Mauzerall, D. L., Liu, J., & Horowitz, L. W. (2011). Global cropyield reductions due to surface ozone exposure: 2. Year 2030 potentialcrop production losses and economic damage under two scenarios ofO3 pollution. Atmospheric Environment, 45(13), 2297–2309. https://doi.org/10.1016/j.atmosenv.2011.01.002
Ballini, E., Berruyer, R., Morel, J. B., Lebrun, M. H., Nottéghem, J. L., &Tharreau, D. (2007). Modern elite rice varieties of the “Green
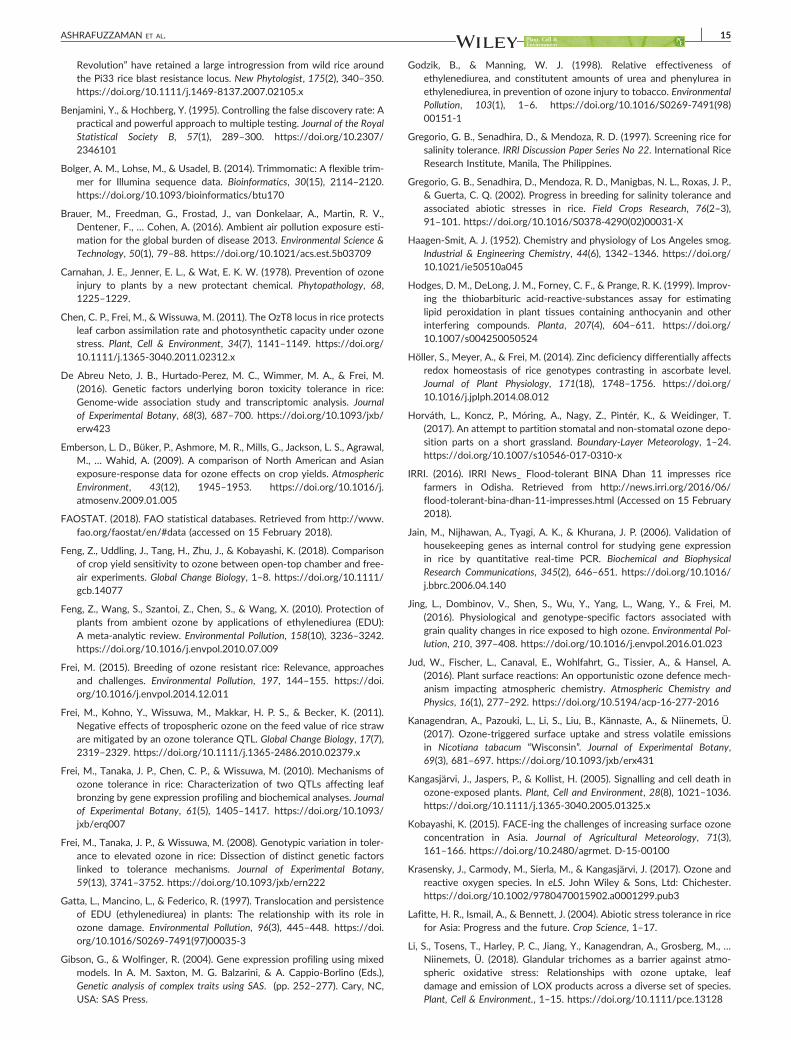
ASHRAFUZZAMAN ET AL. 15
Revolution” have retained a large introgression from wild rice aroundthe Pi33 rice blast resistance locus. New Phytologist, 175(2), 340–350.https://doi.org/10.1111/j.1469‐8137.2007.02105.x
Benjamini, Y., & Hochberg, Y. (1995). Controlling the false discovery rate: Apractical and powerful approach to multiple testing. Journal of the RoyalStatistical Society B, 57(1), 289–300. https://doi.org/10.2307/2346101
Bolger, A. M., Lohse, M., & Usadel, B. (2014). Trimmomatic: A flexible trim-mer for Illumina sequence data. Bioinformatics, 30(15), 2114–2120.https://doi.org/10.1093/bioinformatics/btu170
Brauer, M., Freedman, G., Frostad, J., van Donkelaar, A., Martin, R. V.,Dentener, F., … Cohen, A. (2016). Ambient air pollution exposure esti-mation for the global burden of disease 2013. Environmental Science &Technology, 50(1), 79–88. https://doi.org/10.1021/acs.est.5b03709
Carnahan, J. E., Jenner, E. L., & Wat, E. K. W. (1978). Prevention of ozoneinjury to plants by a new protectant chemical. Phytopathology, 68,1225–1229.
Chen, C. P., Frei, M., & Wissuwa, M. (2011). The OzT8 locus in rice protectsleaf carbon assimilation rate and photosynthetic capacity under ozonestress. Plant, Cell & Environment, 34(7), 1141–1149. https://doi.org/10.1111/j.1365‐3040.2011.02312.x
De Abreu Neto, J. B., Hurtado‐Perez, M. C., Wimmer, M. A., & Frei, M.(2016). Genetic factors underlying boron toxicity tolerance in rice:Genome‐wide association study and transcriptomic analysis. Journalof Experimental Botany, 68(3), 687–700. https://doi.org/10.1093/jxb/erw423
Emberson, L. D., Büker, P., Ashmore, M. R., Mills, G., Jackson, L. S., Agrawal,M., … Wahid, A. (2009). A comparison of North American and Asianexposure‐response data for ozone effects on crop yields. AtmosphericEnvironment, 43(12), 1945–1953. https://doi.org/10.1016/j.atmosenv.2009.01.005
FAOSTAT. (2018). FAO statistical databases. Retrieved from http://www.fao.org/faostat/en/#data (accessed on 15 February 2018).
Feng, Z., Uddling, J., Tang, H., Zhu, J., & Kobayashi, K. (2018). Comparisonof crop yield sensitivity to ozone between open‐top chamber and free‐air experiments. Global Change Biology, 1–8. https://doi.org/10.1111/gcb.14077
Feng, Z., Wang, S., Szantoi, Z., Chen, S., & Wang, X. (2010). Protection ofplants from ambient ozone by applications of ethylenediurea (EDU):A meta‐analytic review. Environmental Pollution, 158(10), 3236–3242.https://doi.org/10.1016/j.envpol.2010.07.009
Frei, M. (2015). Breeding of ozone resistant rice: Relevance, approachesand challenges. Environmental Pollution, 197, 144–155. https://doi.org/10.1016/j.envpol.2014.12.011
Frei, M., Kohno, Y., Wissuwa, M., Makkar, H. P. S., & Becker, K. (2011).Negative effects of tropospheric ozone on the feed value of rice straware mitigated by an ozone tolerance QTL. Global Change Biology, 17(7),2319–2329. https://doi.org/10.1111/j.1365‐2486.2010.02379.x
Frei, M., Tanaka, J. P., Chen, C. P., & Wissuwa, M. (2010). Mechanisms ofozone tolerance in rice: Characterization of two QTLs affecting leafbronzing by gene expression profiling and biochemical analyses. Journalof Experimental Botany, 61(5), 1405–1417. https://doi.org/10.1093/jxb/erq007
Frei, M., Tanaka, J. P., & Wissuwa, M. (2008). Genotypic variation in toler-ance to elevated ozone in rice: Dissection of distinct genetic factorslinked to tolerance mechanisms. Journal of Experimental Botany,59(13), 3741–3752. https://doi.org/10.1093/jxb/ern222
Gatta, L., Mancino, L., & Federico, R. (1997). Translocation and persistenceof EDU (ethylenediurea) in plants: The relationship with its role inozone damage. Environmental Pollution, 96(3), 445–448. https://doi.org/10.1016/S0269‐7491(97)00035‐3
Gibson, G., & Wolfinger, R. (2004). Gene expression profiling using mixedmodels. In A. M. Saxton, M. G. Balzarini, & A. Cappio‐Borlino (Eds.),Genetic analysis of complex traits using SAS. (pp. 252–277). Cary, NC,USA: SAS Press.
Godzik, B., & Manning, W. J. (1998). Relative effectiveness ofethylenediurea, and constitutent amounts of urea and phenylurea inethylenediurea, in prevention of ozone injury to tobacco. EnvironmentalPollution, 103(1), 1–6. https://doi.org/10.1016/S0269‐7491(98)00151‐1
Gregorio, G. B., Senadhira, D., & Mendoza, R. D. (1997). Screening rice forsalinity tolerance. IRRl Discussion Paper Series No 22. International RiceResearch Institute, Manila, The Philippines.
Gregorio, G. B., Senadhira, D., Mendoza, R. D., Manigbas, N. L., Roxas, J. P.,& Guerta, C. Q. (2002). Progress in breeding for salinity tolerance andassociated abiotic stresses in rice. Field Crops Research, 76(2–3),91–101. https://doi.org/10.1016/S0378‐4290(02)00031‐X
Haagen‐Smit, A. J. (1952). Chemistry and physiology of Los Angeles smog.Industrial & Engineering Chemistry, 44(6), 1342–1346. https://doi.org/10.1021/ie50510a045
Hodges, D. M., DeLong, J. M., Forney, C. F., & Prange, R. K. (1999). Improv-ing the thiobarbituric acid‐reactive‐substances assay for estimatinglipid peroxidation in plant tissues containing anthocyanin and otherinterfering compounds. Planta, 207(4), 604–611. https://doi.org/10.1007/s004250050524
Höller, S., Meyer, A., & Frei, M. (2014). Zinc deficiency differentially affectsredox homeostasis of rice genotypes contrasting in ascorbate level.Journal of Plant Physiology, 171(18), 1748–1756. https://doi.org/10.1016/j.jplph.2014.08.012
Horváth, L., Koncz, P., Móring, A., Nagy, Z., Pintér, K., & Weidinger, T.(2017). An attempt to partition stomatal and non‐stomatal ozone depo-sition parts on a short grassland. Boundary‐Layer Meteorology, 1–24.https://doi.org/10.1007/s10546‐017‐0310‐x
IRRI. (2016). IRRI News_ Flood‐tolerant BINA Dhan 11 impresses ricefarmers in Odisha. Retrieved from http://news.irri.org/2016/06/flood‐tolerant‐bina‐dhan‐11‐impresses.html (Accessed on 15 February2018).
Jain, M., Nijhawan, A., Tyagi, A. K., & Khurana, J. P. (2006). Validation ofhousekeeping genes as internal control for studying gene expressionin rice by quantitative real‐time PCR. Biochemical and BiophysicalResearch Communications, 345(2), 646–651. https://doi.org/10.1016/j.bbrc.2006.04.140
Jing, L., Dombinov, V., Shen, S., Wu, Y., Yang, L., Wang, Y., & Frei, M.(2016). Physiological and genotype‐specific factors associated withgrain quality changes in rice exposed to high ozone. Environmental Pol-lution, 210, 397–408. https://doi.org/10.1016/j.envpol.2016.01.023
Jud, W., Fischer, L., Canaval, E., Wohlfahrt, G., Tissier, A., & Hansel, A.(2016). Plant surface reactions: An opportunistic ozone defence mech-anism impacting atmospheric chemistry. Atmospheric Chemistry andPhysics, 16(1), 277–292. https://doi.org/10.5194/acp‐16‐277‐2016
Kanagendran, A., Pazouki, L., Li, S., Liu, B., Kännaste, A., & Niinemets, Ü.(2017). Ozone‐triggered surface uptake and stress volatile emissionsin Nicotiana tabacum “Wisconsin”. Journal of Experimental Botany,69(3), 681–697. https://doi.org/10.1093/jxb/erx431
Kangasjärvi, J., Jaspers, P., & Kollist, H. (2005). Signalling and cell death inozone‐exposed plants. Plant, Cell and Environment, 28(8), 1021–1036.https://doi.org/10.1111/j.1365‐3040.2005.01325.x
Kobayashi, K. (2015). FACE‐ing the challenges of increasing surface ozoneconcentration in Asia. Journal of Agricultural Meteorology, 71(3),161–166. https://doi.org/10.2480/agrmet. D‐15‐00100
Krasensky, J., Carmody, M., Sierla, M., & Kangasjärvi, J. (2017). Ozone andreactive oxygen species. In eLS. John Wiley & Sons, Ltd: Chichester.https://doi.org/10.1002/9780470015902.a0001299.pub3
Lafitte, H. R., Ismail, A., & Bennett, J. (2004). Abiotic stress tolerance in ricefor Asia: Progress and the future. Crop Science, 1–17.
Li, S., Tosens, T., Harley, P. C., Jiang, Y., Kanagendran, A., Grosberg, M., …Niinemets, Ü. (2018). Glandular trichomes as a barrier against atmo-spheric oxidative stress: Relationships with ozone uptake, leafdamage and emission of LOX products across a diverse set of species.Plant, Cell & Environment., 1–15. https://doi.org/10.1111/pce.13128
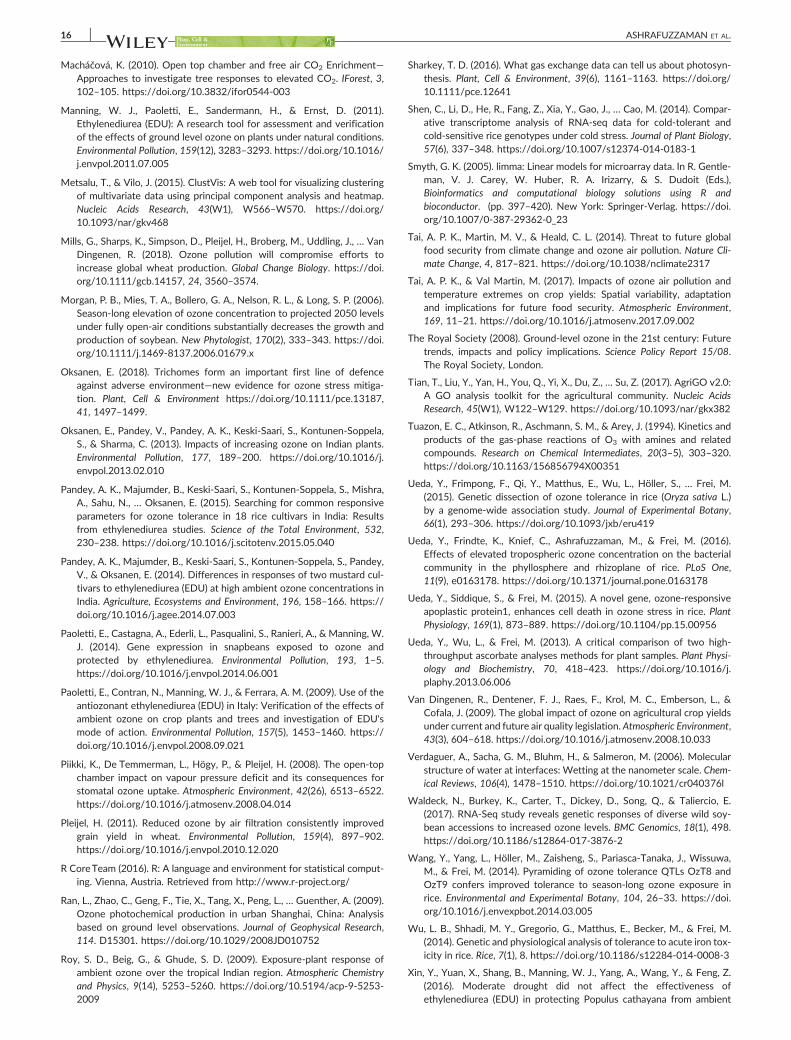
16 ASHRAFUZZAMAN ET AL.
Macháčová, K. (2010). Open top chamber and free air CO2 Enrichment—Approaches to investigate tree responses to elevated CO2. IForest, 3,102–105. https://doi.org/10.3832/ifor0544‐003
Manning, W. J., Paoletti, E., Sandermann, H., & Ernst, D. (2011).Ethylenediurea (EDU): A research tool for assessment and verificationof the effects of ground level ozone on plants under natural conditions.Environmental Pollution, 159(12), 3283–3293. https://doi.org/10.1016/j.envpol.2011.07.005
Metsalu, T., & Vilo, J. (2015). ClustVis: A web tool for visualizing clusteringof multivariate data using principal component analysis and heatmap.Nucleic Acids Research, 43(W1), W566–W570. https://doi.org/10.1093/nar/gkv468
Mills, G., Sharps, K., Simpson, D., Pleijel, H., Broberg, M., Uddling, J., … VanDingenen, R. (2018). Ozone pollution will compromise efforts toincrease global wheat production. Global Change Biology. https://doi.org/10.1111/gcb.14157, 24, 3560–3574.
Morgan, P. B., Mies, T. A., Bollero, G. A., Nelson, R. L., & Long, S. P. (2006).Season‐long elevation of ozone concentration to projected 2050 levelsunder fully open‐air conditions substantially decreases the growth andproduction of soybean. New Phytologist, 170(2), 333–343. https://doi.org/10.1111/j.1469‐8137.2006.01679.x
Oksanen, E. (2018). Trichomes form an important first line of defenceagainst adverse environment—new evidence for ozone stress mitiga-tion. Plant, Cell & Environment https://doi.org/10.1111/pce.13187,41, 1497–1499.
Oksanen, E., Pandey, V., Pandey, A. K., Keski‐Saari, S., Kontunen‐Soppela,S., & Sharma, C. (2013). Impacts of increasing ozone on Indian plants.Environmental Pollution, 177, 189–200. https://doi.org/10.1016/j.envpol.2013.02.010
Pandey, A. K., Majumder, B., Keski‐Saari, S., Kontunen‐Soppela, S., Mishra,A., Sahu, N., … Oksanen, E. (2015). Searching for common responsiveparameters for ozone tolerance in 18 rice cultivars in India: Resultsfrom ethylenediurea studies. Science of the Total Environment, 532,230–238. https://doi.org/10.1016/j.scitotenv.2015.05.040
Pandey, A. K., Majumder, B., Keski‐Saari, S., Kontunen‐Soppela, S., Pandey,V., & Oksanen, E. (2014). Differences in responses of two mustard cul-tivars to ethylenediurea (EDU) at high ambient ozone concentrations inIndia. Agriculture, Ecosystems and Environment, 196, 158–166. https://doi.org/10.1016/j.agee.2014.07.003
Paoletti, E., Castagna, A., Ederli, L., Pasqualini, S., Ranieri, A., & Manning, W.J. (2014). Gene expression in snapbeans exposed to ozone andprotected by ethylenediurea. Environmental Pollution, 193, 1–5.https://doi.org/10.1016/j.envpol.2014.06.001
Paoletti, E., Contran, N., Manning, W. J., & Ferrara, A. M. (2009). Use of theantiozonant ethylenediurea (EDU) in Italy: Verification of the effects ofambient ozone on crop plants and trees and investigation of EDU'smode of action. Environmental Pollution, 157(5), 1453–1460. https://doi.org/10.1016/j.envpol.2008.09.021
Piikki, K., De Temmerman, L., Högy, P., & Pleijel, H. (2008). The open‐topchamber impact on vapour pressure deficit and its consequences forstomatal ozone uptake. Atmospheric Environment, 42(26), 6513–6522.https://doi.org/10.1016/j.atmosenv.2008.04.014
Pleijel, H. (2011). Reduced ozone by air filtration consistently improvedgrain yield in wheat. Environmental Pollution, 159(4), 897–902.https://doi.org/10.1016/j.envpol.2010.12.020
R CoreTeam (2016). R: A language and environment for statistical comput-ing. Vienna, Austria. Retrieved from http://www.r‐project.org/
Ran, L., Zhao, C., Geng, F., Tie, X., Tang, X., Peng, L., … Guenther, A. (2009).Ozone photochemical production in urban Shanghai, China: Analysisbased on ground level observations. Journal of Geophysical Research,114. D15301. https://doi.org/10.1029/2008JD010752
Roy, S. D., Beig, G., & Ghude, S. D. (2009). Exposure‐plant response ofambient ozone over the tropical Indian region. Atmospheric Chemistryand Physics, 9(14), 5253–5260. https://doi.org/10.5194/acp‐9‐5253‐2009
Sharkey, T. D. (2016). What gas exchange data can tell us about photosyn-thesis. Plant, Cell & Environment, 39(6), 1161–1163. https://doi.org/10.1111/pce.12641
Shen, C., Li, D., He, R., Fang, Z., Xia, Y., Gao, J., … Cao, M. (2014). Compar-ative transcriptome analysis of RNA‐seq data for cold‐tolerant andcold‐sensitive rice genotypes under cold stress. Journal of Plant Biology,57(6), 337–348. https://doi.org/10.1007/s12374‐014‐0183‐1
Smyth, G. K. (2005). limma: Linear models for microarray data. In R. Gentle-man, V. J. Carey, W. Huber, R. A. Irizarry, & S. Dudoit (Eds.),Bioinformatics and computational biology solutions using R andbioconductor. (pp. 397–420). New York: Springer‐Verlag. https://doi.org/10.1007/0‐387‐29362‐0_23
Tai, A. P. K., Martin, M. V., & Heald, C. L. (2014). Threat to future globalfood security from climate change and ozone air pollution. Nature Cli-mate Change, 4, 817–821. https://doi.org/10.1038/nclimate2317
Tai, A. P. K., & Val Martin, M. (2017). Impacts of ozone air pollution andtemperature extremes on crop yields: Spatial variability, adaptationand implications for future food security. Atmospheric Environment,169, 11–21. https://doi.org/10.1016/j.atmosenv.2017.09.002
The Royal Society (2008). Ground‐level ozone in the 21st century: Futuretrends, impacts and policy implications. Science Policy Report 15/08.The Royal Society, London.
Tian, T., Liu, Y., Yan, H., You, Q., Yi, X., Du, Z., … Su, Z. (2017). AgriGO v2.0:A GO analysis toolkit for the agricultural community. Nucleic AcidsResearch, 45(W1), W122–W129. https://doi.org/10.1093/nar/gkx382
Tuazon, E. C., Atkinson, R., Aschmann, S. M., & Arey, J. (1994). Kinetics andproducts of the gas‐phase reactions of O3 with amines and relatedcompounds. Research on Chemical Intermediates, 20(3–5), 303–320.https://doi.org/10.1163/156856794X00351
Ueda, Y., Frimpong, F., Qi, Y., Matthus, E., Wu, L., Höller, S., … Frei, M.(2015). Genetic dissection of ozone tolerance in rice (Oryza sativa L.)by a genome‐wide association study. Journal of Experimental Botany,66(1), 293–306. https://doi.org/10.1093/jxb/eru419
Ueda, Y., Frindte, K., Knief, C., Ashrafuzzaman, M., & Frei, M. (2016).Effects of elevated tropospheric ozone concentration on the bacterialcommunity in the phyllosphere and rhizoplane of rice. PLoS One,11(9), e0163178. https://doi.org/10.1371/journal.pone.0163178
Ueda, Y., Siddique, S., & Frei, M. (2015). A novel gene, ozone‐responsiveapoplastic protein1, enhances cell death in ozone stress in rice. PlantPhysiology, 169(1), 873–889. https://doi.org/10.1104/pp.15.00956
Ueda, Y., Wu, L., & Frei, M. (2013). A critical comparison of two high‐throughput ascorbate analyses methods for plant samples. Plant Physi-ology and Biochemistry, 70, 418–423. https://doi.org/10.1016/j.plaphy.2013.06.006
Van Dingenen, R., Dentener, F. J., Raes, F., Krol, M. C., Emberson, L., &Cofala, J. (2009). The global impact of ozone on agricultural crop yieldsunder current and future air quality legislation. Atmospheric Environment,43(3), 604–618. https://doi.org/10.1016/j.atmosenv.2008.10.033
Verdaguer, A., Sacha, G. M., Bluhm, H., & Salmeron, M. (2006). Molecularstructure of water at interfaces: Wetting at the nanometer scale. Chem-ical Reviews, 106(4), 1478–1510. https://doi.org/10.1021/cr040376l
Waldeck, N., Burkey, K., Carter, T., Dickey, D., Song, Q., & Taliercio, E.(2017). RNA‐Seq study reveals genetic responses of diverse wild soy-bean accessions to increased ozone levels. BMC Genomics, 18(1), 498.https://doi.org/10.1186/s12864‐017‐3876‐2
Wang, Y., Yang, L., Höller, M., Zaisheng, S., Pariasca‐Tanaka, J., Wissuwa,M., & Frei, M. (2014). Pyramiding of ozone tolerance QTLs OzT8 andOzT9 confers improved tolerance to season‐long ozone exposure inrice. Environmental and Experimental Botany, 104, 26–33. https://doi.org/10.1016/j.envexpbot.2014.03.005
Wu, L. B., Shhadi, M. Y., Gregorio, G., Matthus, E., Becker, M., & Frei, M.(2014). Genetic and physiological analysis of tolerance to acute iron tox-icity in rice. Rice, 7(1), 8. https://doi.org/10.1186/s12284‐014‐0008‐3
Xin, Y., Yuan, X., Shang, B., Manning, W. J., Yang, A., Wang, Y., & Feng, Z.(2016). Moderate drought did not affect the effectiveness ofethylenediurea (EDU) in protecting Populus cathayana from ambient
ASHRAFUZZAMAN ET AL. 17
ozone. Science of the Total Environment, 569–570, 1536–1544. https://doi.org/10.1016/j.scitotenv.2016.06.247
Yendrek, C. R., Koester, R. P., & Ainsworth, E. A. (2015). A comparativeanalysis of transcriptomic, biochemical, and physiological responses toelevated ozone identifies species‐specific mechanisms of resilience inlegume crops. Journal of Experimental Botany, 66(22), 7101–7112.https://doi.org/10.1093/jxb/erv404
Yoshida, S., Forno, D. A., Cock, J. H., & G. K. (1976). Laboratory manual forphysiological studies of rice. Manila, The Philippines: International RiceResearch Institute.
Zhang, L., Xu, B., Wu, T., Wen, M., Fan, L., Feng, Z., & Paoletti, E. (2017).Transcriptomic analysis of Pak Choi under acute ozone exposurerevealed regulatory mechanism against ozone stress. BMC Plant Biol-ogy, 17(1), 236. https://doi.org/10.1186/s12870‐017‐1202‐4
SUPPORTING INFORMATION
Additional supporting information may be found online in the
Supporting Information section at the end of the article.
How to cite this article: Ashrafuzzaman M, Haque Z, Ali B,
et al. Ethylenediurea (EDU) mitigates the negative effects of
ozone in rice: Insights into its mode of action. Plant Cell
Environ. 2018;1–17. https://doi.org/10.1111/pce.13423
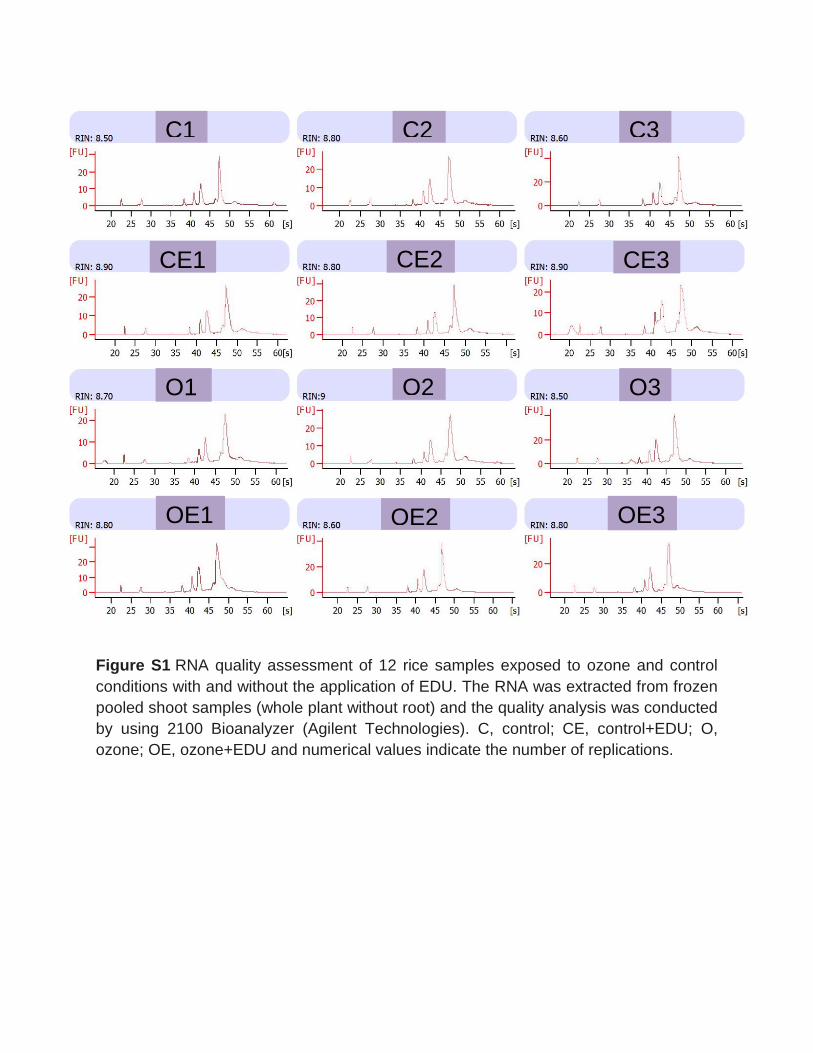
Figure S1 RNA quality assessment of 12 rice samples exposed to ozone and control
conditions with and without the application of EDU. The RNA was extracted from frozen
pooled shoot samples (whole plant without root) and the quality analysis was conducted
by using 2100 Bioanalyzer (Agilent Technologies). C, control; CE, control+EDU; O,
ozone; OE, ozone+EDU and numerical values indicate the number of replications.
C1 C2 C3
CE1 CE2 CE3
O1 O2 O3
OE1 OE2 OE3
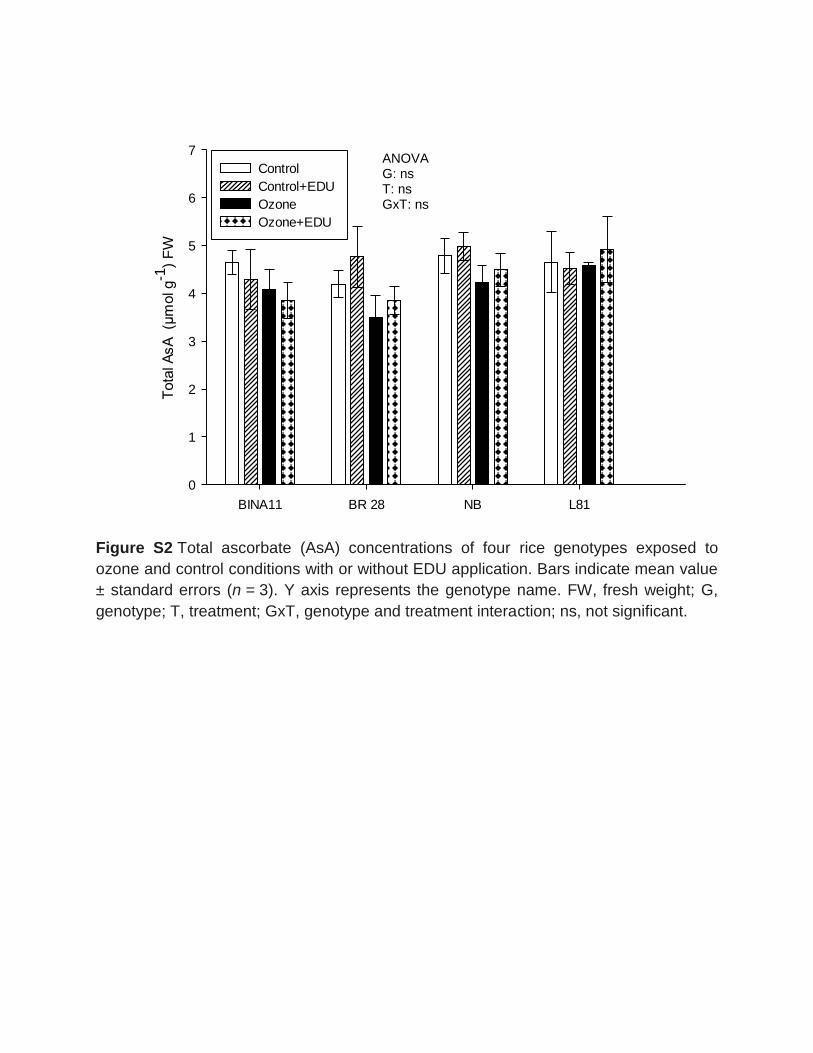
Figure S2 Total ascorbate (AsA) concentrations of four rice genotypes exposed to
ozone and control conditions with or without EDU application. Bars indicate mean value
± standard errors (n = 3). Y axis represents the genotype name. FW, fresh weight; G,
genotype; T, treatment; GxT, genotype and treatment interaction; ns, not significant.
BINA11 BR 28 NB L81
Tota
l A
sA
(µ
mol g-1
) F
W
0
1
2
3
4
5
6
7
Control
Control+EDU
Ozone
Ozone+EDU
ANOVA G: ns T: ns GxT: ns
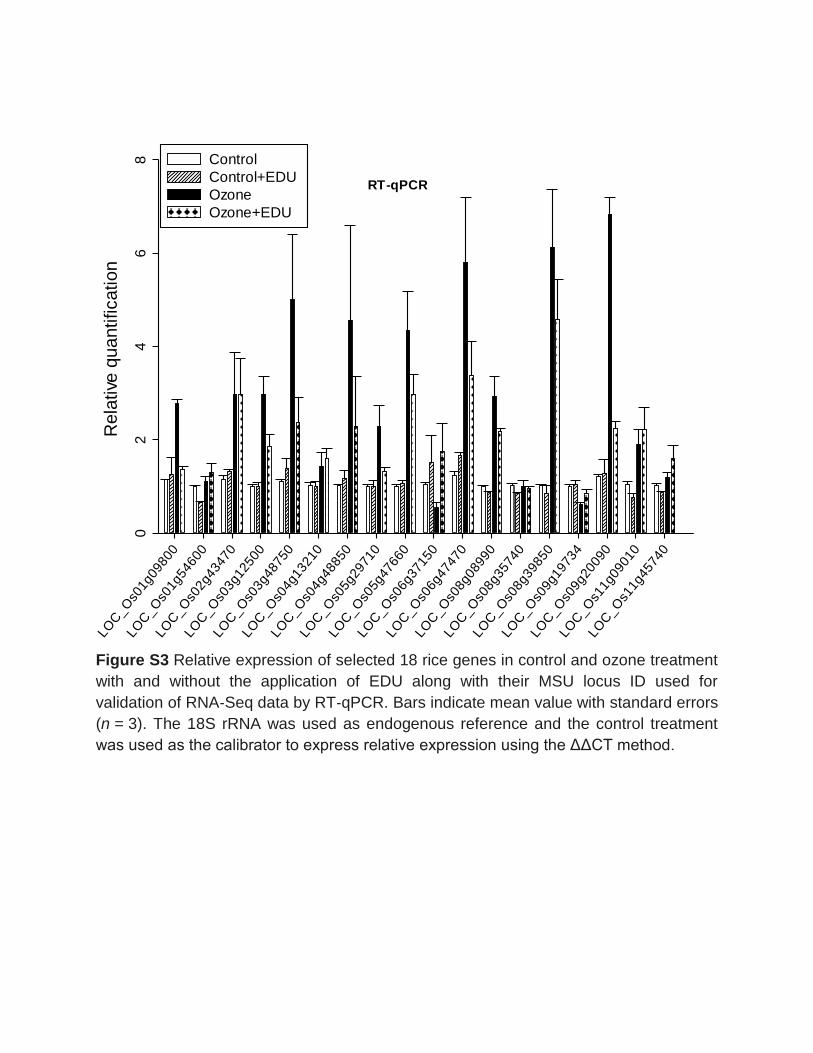
Figure S3 Relative expression of selected 18 rice genes in control and ozone treatment
with and without the application of EDU along with their MSU locus ID used for
validation of RNA‐Seq data by RT‐qPCR. Bars indicate mean value with standard errors
(n = 3). The 18S rRNA was used as endogenous reference and the control treatment
was used as the calibrator to express relative expression using the ΔΔCT method.
LOC
_Os0
1g09
800
LOC
_Os0
1g54
600
LOC
_Os0
2g43
470
LOC
_Os0
3g12
500
LOC
_Os0
3g48
750
LOC
_Os0
4g13
210
LOC
_Os0
4g48
850
LOC
_Os0
5g29
710
LOC
_Os0
5g47
660
LOC
_Os0
6g37
150
LOC
_Os0
6g47
470
LOC
_Os0
8g08
990
LOC
_Os0
8g35
740
LOC
_Os0
8g39
850
LOC
_Os0
9g19
734
LOC
_Os0
9g20
090
LOC
_Os1
1g09
010
LOC
_Os1
1g45
740
Re
lative
qua
ntifica
tio
n
02
46
8 Control
Control+EDU
Ozone
Ozone+EDU
RT-qPCR
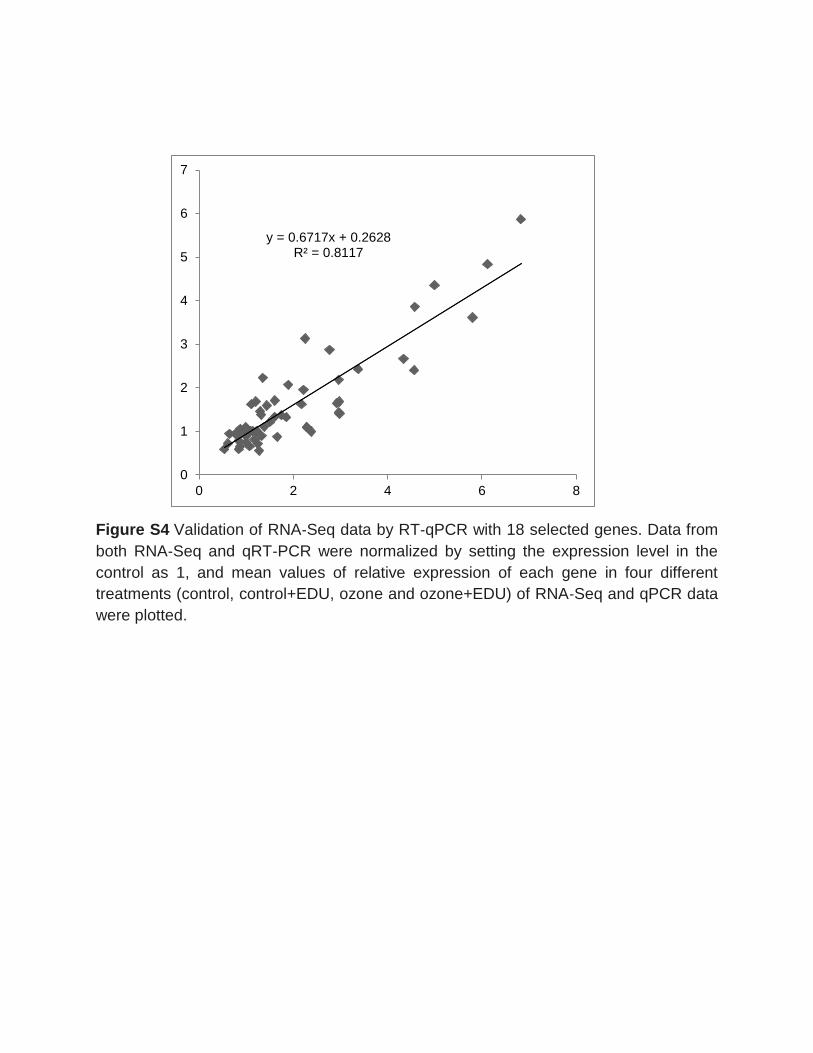
y = 0.6717x + 0.2628 R² = 0.8117
0
1
2
3
4
5
6
7
0 2 4 6 8
Figure S4 Validation of RNA‐Seq data by RT‐qPCR with 18 selected genes. Data from
both RNA‐Seq and qRT‐PCR were normalized by setting the expression level in the
control as 1, and mean values of relative expression of each gene in four different
treatments (control, control+EDU, ozone and ozone+EDU) of RNA‐Seq and qPCR data
were plotted.
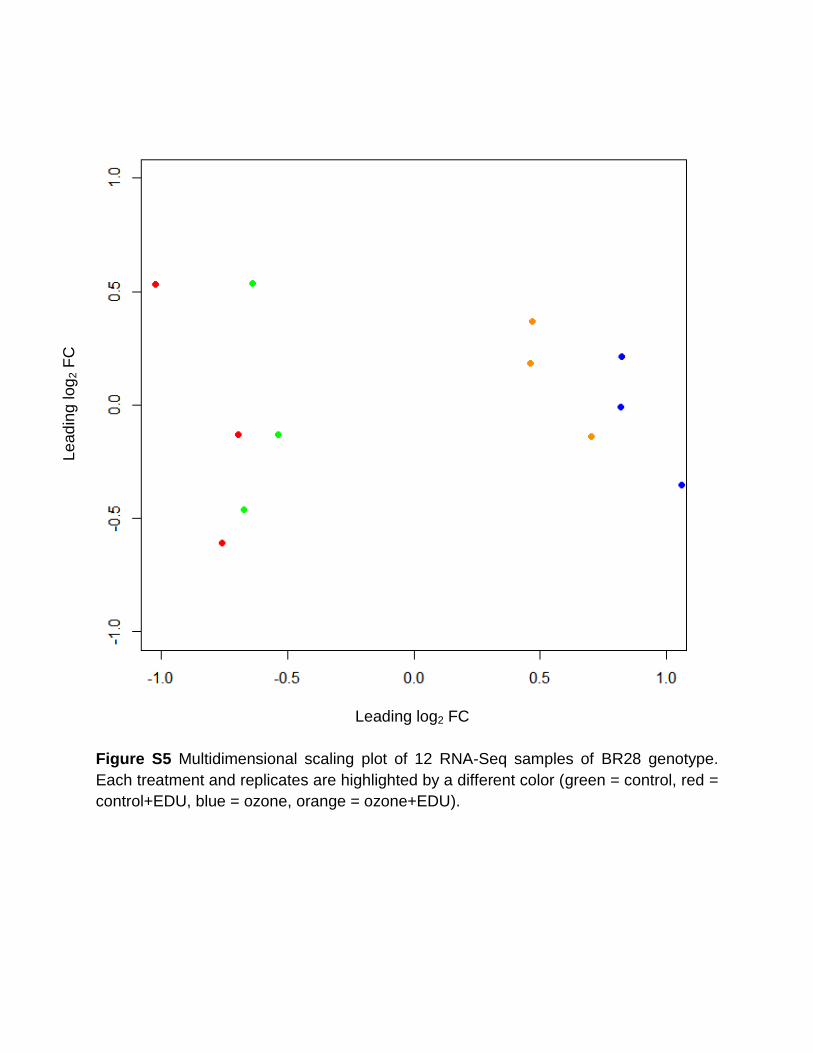
Leading log2 FC
Le
ad
ing
log
2 F
C
Figure S5 Multidimensional scaling plot of 12 RNA-Seq samples of BR28 genotype.
Each treatment and replicates are highlighted by a different color (green = control, red =
control+EDU, blue = ozone, orange = ozone+EDU).
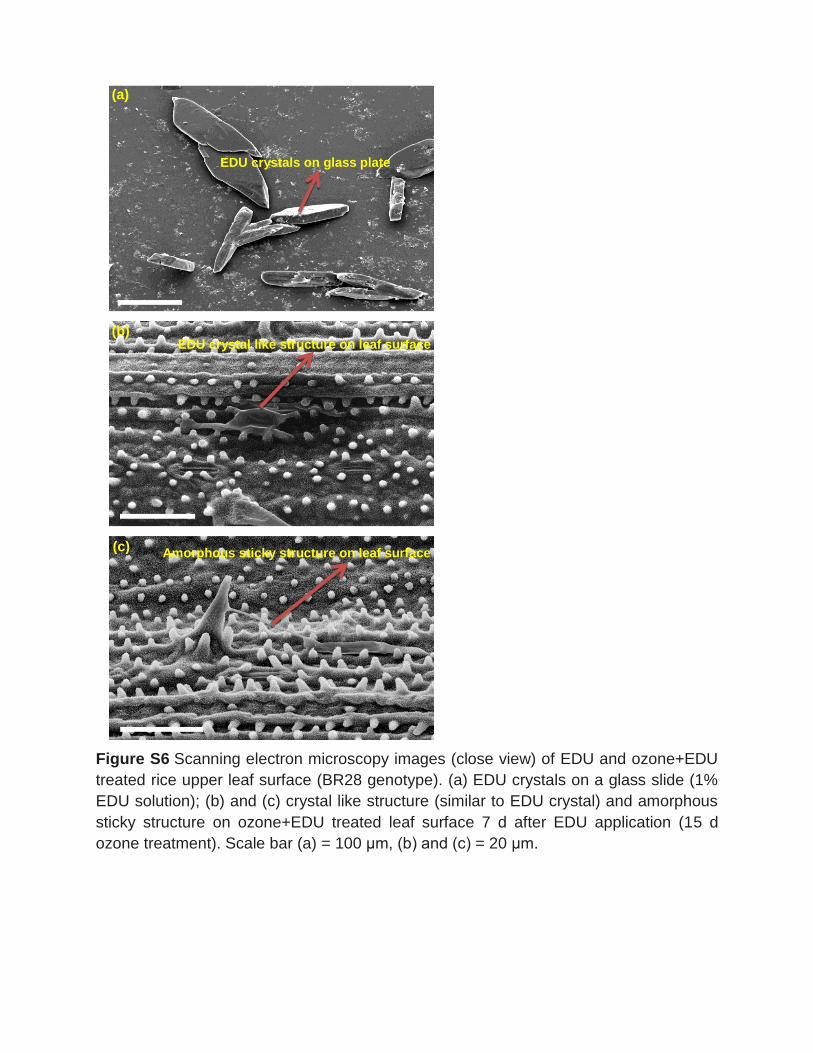
Figure S6 Scanning electron microscopy images (close view) of EDU and ozone+EDU
treated rice upper leaf surface (BR28 genotype). (a) EDU crystals on a glass slide (1%
EDU solution); (b) and (c) crystal like structure (similar to EDU crystal) and amorphous
sticky structure on ozone+EDU treated leaf surface 7 d after EDU application (15 d
ozone treatment). Scale bar (a) = 100 μm, (b) and (c) = 20 μm.
(a)
(b)
(c) Amorphous sticky structure on leaf surface
EDU crystal like structure on leaf surface
EDU crystals on glass plate
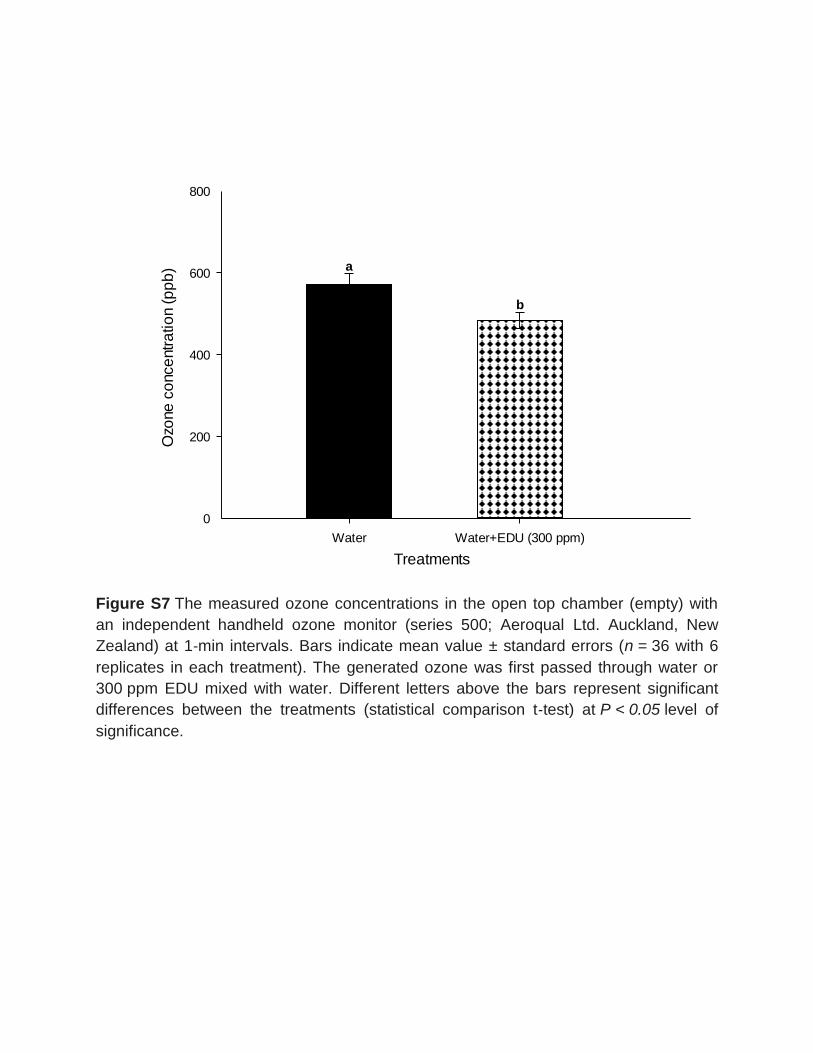
Figure S7 The measured ozone concentrations in the open top chamber (empty) with
an independent handheld ozone monitor (series 500; Aeroqual Ltd. Auckland, New
Zealand) at 1‐min intervals. Bars indicate mean value ± standard errors (n = 36 with 6
replicates in each treatment). The generated ozone was first passed through water or
300 ppm EDU mixed with water. Different letters above the bars represent significant
differences between the treatments (statistical comparison t‐test) at P < 0.05 level of
significance.
Treatments
Water Water+EDU (300 ppm)
Ozo
ne
co
nce
ntr
atio
n (
pp
b)
0
200
400
600
800
a
b
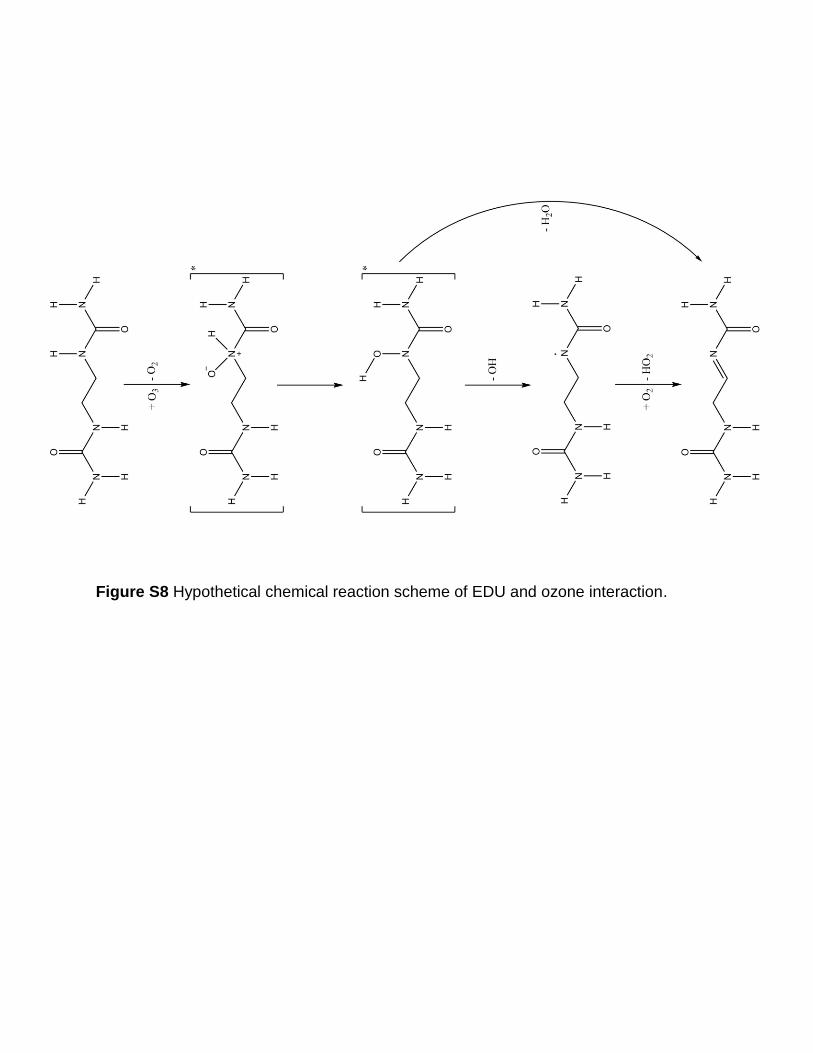
Figure S8 Hypothetical chemical reaction scheme of EDU and ozone interaction.
Publications
82
6.3 Publications unrelated to this thesis
Ueda, Y., Frindte, K., Knief, C., Ashrafuzzaman, M., & Frei, M. (2016). Effects of
elevated tropospheric ozone concentration on the bacterial community in the
phyllosphere and rhizoplane of rice. PLOS ONE, 11(9), e0163178.
Ali, B., Pantha, S., Acharya, R., Rashid, B., Ueda, Y., Wu, L.B., Ashrafuzzaman, M.,
Ishizaki, T., Wissuwa, M., Freitag, L., Peiter, E., Bulley, S., and Frei, M., (2018).
Abiotic stress tolerance of transgenic cereal crops with enhanced ascorbate
biosynthesis (Submitted)
6.4 Conference participation
Poster presentation Test of ethylenediurea (EDU) as a biomonitoring and screening tool to assess ozone
damage in rice (Oryza sativa L.)
3rd Asian Air Pollution Workshop (AAPW-3)
20-22 October, 2017. Tokyo, Japan Oral presentation Insights into the mode of action of ethylenediurea (EDU) as an antiozonant in rice
(Oryza sativa L.)
International Conference on Ozone and Plant Ecosystems
21-25 May, 2018. Florence, Italy Participated actively and contributed as volunteer in the organizing committee Tropentag international conference
20-22 September 2017, Bonn, Germany
6.5 Awards IPID4all (International promovieren in Deutschland–für alle), International conference
participation grant, Bonn Graduate Center, Bonn, Germany (2017)
International conference participation grant, Theodor-Brinkmann-Graduate School.
Bonn, Germany (2018)

Curriculum vitae
83
7 Curriculum vitae
Acknowledgment
84
8 Acknowledgment
First of all, I would like to express my deepest sense of gratitude and profound
appreciation to Prof. Dr. Michael Frei for accepting me as a PhD student, for his
constant supervision, scholastic guidance, valuable suggestions, constructive
criticisms and cordial help throughout this research work. I would also like to thank
Prof. Dr. Frank Hochholdinger for being my co-supervisor. My appreciation also goes
to Prof. Dr. Gabriel Schaaf for his contribution as the chairman and PD Dr. Ali Ahmad
Naz for accepting my request to be in the committee.
Furthermore, I would like to thank to all colleagues, technical and administrative stuffs
of the INRES family especially in plant nutrition department for their support and
valuable time during my PhD research period: I could not mention the entire name
here, due to the space limitation. Special thanks to Dr. Linbo Wu, Dr. João Abreu
Neto, Dr. Basharat Ali, Asis Shrestha, Felix Holtkamp, Zahidul Haque, Sumitra
Pantha, Sebastian Fellmann, Daniel Zinsmeister, Christian Heck, Varunseelan
Murugaiyan, Andri Wairich. My sincere thank also goes to Prof. Dr. Mathias Becker
for his support and motivation during my study. Moreover, I would like to express my
gratitude to one and all who, directly or indirectly, help me during this research work.
I am also grateful to Dr. Thorsten Kraska and the technical staffs at the Campus
Klein-Altendorf of University of Bonn. My sincere thank also goes to Prof. Dr. Florian
Grundler, Dr. Shahid Siddique and Dr. Zoran Radakovic (Molecular Phytomedicine,
INRES) for sharing their experimental facilities and knowledge, Dr. Boby Mathew
(Plant Breeding, INRES) for the R statistical program language support.
I would to thank all collaborators, especially, Dr. William J. Manning (University of
Massachusetts, USA) for providing ethylenediurea (EDU), Prof. Dr. Maximilian
Weigend, Hans Jürgen Ensikat and Jörg Nettekoven (Nees Institute for Biodiversity
of Plants, University of Bonn) for the scanning electron microscopy support, Dr. Peng
Yu and Dr. Jutta A. Baldauf (Crop Functional Genomics, INRES) for the RNA-
sequencing data analyses and bioinformatics support, and Dr. Max McGillen, Dr.
Anwar H. Khan (University of Bristol, UK) for the meaningful discussion and in-depth
EDU and ozone interaction analyses.

Acknowledgment 85
85
I would like to express my profound thanks and heartiest gratitude to Dr. Yoshiaki
Ueda (University of Tokyo, Japan) for his cordial support, sharing scientific
knowledge and valuable suggestions throughout my research period.
I am also so grateful to German Academic Exchange Service (DAAD) for providing
me PhD fellowship, without this financial support it would be very difficult for me to
study and pursue my PhD from the world reputed University of Bonn, Germany.
From the bottom of my heart, I would like to thanks my departed father, my cute,
innocent daughter (Adiya Ashrafi), and all other beloved family members. Finally, my
special thanks and endless love go to my lovely wife (Amatun Noor) for her endless
sacrifice, support and constant inspiration for building my academic career which can
never be repaid. আমি ত োিোর সঙ্গে ত েঁঙ্গেমি আিোর প্রোণ সুঙ্গরর ো েঁেঙ্গে--. ুমি জোে েো, আমি ত োিোঙ্গর
তেঙ্গ়েমি অজোেো সোেঙ্গে॥