Embed Size (px)
Citation preview
'. 'I ; . ~
' . ~ ' .
; .
·-
> •.
l;·~ '~ ·~~- ;-.
;\:•
Description and Evaluation of the Hanford Personnel Dosimeter Program From 1944 Through 1989
R. ti. Wilson · J. J. Fix
September 1990
W. V. Baumgartner L •. L. Nichols
Prepared for the U.S. Department of Energy under Contract DE-AC06-76RLO 1830
Pacific Northwest Laboratory Operated for the U.S. Department of Energy by Battelle Memorial Institute
0Battelle
PNL-7447
UC-606
DISCLAIMER
This report was prepared as an account of work sponsored by an agency of the United States Government. Neither the United States Government nor any agency thereof, nor Bauelle Memorial Institute, nor any of their employees, makes any warranty, expressed or implied, or assumes any legal liability or responsibility for the accuracy, completeness, or usefulness of any Information, apparatus, produd, or process disclosed, or represents that Its use would not Infringe privately own.eel rights. Reference herein to any specific commercial product, process, or service by trade name, trademark. manufadurer, or otherwise, does not necessarily constitute or imply its endorsement, recommendation, or favoring by the United States Government or any agency thereof, or Battelle Memorial Institute. The views and opinions of authors expressed herein do not necessarily state or reffed those of the United States Government or any agency thereof.
PACIFIC NORTHWEST LABORATORY operated by
BA TIELLE MEMORIAL INSTITUTE for the
UNITED STATES DEPARTMENT OF ENERGY under Contract DE-AC06-76RLO 1830
Printed in the United Stoltcs of America
Av;iilJhle to DOE olnd DOE controlctors from the OfficeofScienliflc olnd Tcchnic.1l Information, P.O. Box 62, Oak Ridge, TN 37831:
prices o1Vailo1ble from (61Sl S76-8401. FTS 626-8401.
Available to the public from the N<1tional Tc.'Clmic;il lnfonnation Service, U.S. Department of Commerce. S285 Port Royal Rd., Springfield, VA 22161.
NTIS Price Codes, Mi<"mfi<"hc ADI
Printed Copy
Price Code Page Range Price Code Page Range
A02 A03 A04 ADS A06 A07 A08 A09 A10 All A12 A13 A14
1- 10 11- so SI· 75 76-100
101-125 126·150 1S1-175 176-200 201-225 226-250 251-275 276-300 301-325
A15 A16 A17 A18 A19 A20 A21 A22 A23 A24 A25 A99
326-350 351-375 376-400 401-425 426-450 451-47S 476-500 501-525 526-550 551-575 576-600 601·Up
DESCRIPTION AND EVALUATION OF THE HANFORD PERSONNEL DOSIMETER PROGRAM FROM 1944 THROUGH 1989
R. H. Wilson J. J. Fix W. V. Baumgartner L. L. Nichols
September 1990
Prepared for the U.S. Department of Energy under Contract DE-AC06-76RLO 1830
Pacific Northwest Laboratory Richland, Washington 99352
PNL-7447 UC-606
0.
i
PREFACE
This report provides a historical review of the equipment, the dosimetry techniques, and the calibration protocols used at Hanford to measure and record personnel dose from the inception of Hanford operations in 1944 through 1989. An evaluation of the capability of each dosimeter to accurately estimate the dose to personnel is made, and includes comparison of the recorded dose to the 1-cm depth dose in tissue (i.e., deep dose) for six different facility types considered to represent Hanford operations. This evaluation is based on 1) review of extensive historical documentation, 2) results of a laboratory intercomparison of all Hanford film dosimeters during 1989, 3) results from performance testing of the Hanford thermoluminescent dosimeter during 1989, and 4) the professional judgment of the authors based on dosimetry experience during nearly 5 decades of Hanford Operations.
This report is addressed primarily to the dosimetrist of external sources of radiation. Evaluation of personnel dose from measured internal depositions of radioactivity is not included in this report. It is estimated that less than 1% of the Hanford worker population has received a dose from internal depositions that exceeds 10% of the recorded lifetime dose at Hanford. This report supplies the necessary background to allow for the development of recommendations, regarding adjustments that may be needed to convert recorded doses to the 1-cm depth dose and to doses to specific organs of the body. Organ doses are needed to allow for appropriate comparison of risk estimates based on worker data with risk estimates based on extrapolation from highdose data.
Dose records for Hanford personnel are being used in the Hanford Health and Mortality Study, which is being conducted jointly by Pacific Northwest Laboratory and the Hanford Environmental Health Foundation. The objectives of this ongoing study are to determine 1) if cause-specific mortality is associated with cumulative radiation dose, and 2) to what extent direct data on a population exposed at low levels can confirm or reject risk estimates based on extrapolation from high-dose data.
To make the best use of available epidemiologic data in assessing risks from exposure to low-level radiation, it is important that the methods used to
iii
assess and record personnel dose be understood. It is particularly important to evaluate comparability of recorded dose over time and among workers per- ~ forming different types of work. In addition, recent efforts to combine data from several nuclear worker studies, both within the United States and internationally, make it necessary to evaluate the comparability of dose estimates across studies.
iv
•
ABSTRACT
This report describes the evolution of personnel dosimeter technology at Hanford since the inception of Hanford operations in 1944. Each of the personnel dosimeter systems used by people working or visiting Hanford is described. In addition, the procedures used to calibrate and calculate dose for each of the dosimeter systems are described. The accuracy of the recorded dose, primarily whole body deep dose, for the different dosimeter systems is evaluated. The evaluation is based on an extensive review of historical literature, as well as a 1989 intercomparison study of all film dosimeters and performance testing of the thennoluminescent dosimeter, also conducted during 1989.
v

~ \ ].

EXECUTIVE SUMMARY
External dose has been measured and recorded for Hanford personnel since the beginning of operations in 1944, and the technology for doing so has evolved throughout the nearly 5 decades of Hanford operations. This report was prepared to meet two primary objectives: 1) provide a historical overview of Hanford personnel dosimeter practices and, 2) evaluate the accuracy of recorded whole body doses in support of the Hanford Health and Mortality Study. Specifically, this report aims to describe dosimetry systems used to determine personnel dose and to evaluate the accuracy of the recorded dose for the different dosimeters and periods of use relative to a currently accepted national basis (i.e., deep dose). The evaluation is difficult because of the significant variation in beta, photon, and neutron radiation fields in the various Hanford facilities, as well as numerous technological and environmental aspects of the dosimeters used and the changing concepts in dose over the years.
Hanford was formed as a part of the Manhattan Project created in 1942 to develop atomic weapons. Hanford's role in this national effort was to produce
~ plutonium. Early Hanford researchers recognized the significant uncertainties of measuring personnel dose from the complex beta, photon, and neutron radiation fields that would accompany the Hanford nuclear reactor, fuel reprocessing, plutonium separation, and waste handling tasks of the Manhattan Project. Large quantities of radioactive material would be produced, refined, and stored at Hanford. Accurate measurement of personnel dose for the large number of personnel involved in these tasks was of paramount importance. Initially, personnel dosimetry techniques were adopted from the medical community. This resulted in pioneering the science of measuring radiation for nuclear facilities and transferring this information into the technology to measure dose to personnel.
Technical interchange was conunon between different national laboratories. The original two-element film dosimeter implemented at both Hanford and Oak Ridge National Laboratory (ORNL, originally called Clinton Laboratory) was developed at the University of Chicago Metallurgical Laboratory. In 1945 the interpreted doses from film dosimeters used at Hanford, ORNL, and Los Alamos
vii

National Laboratory (LANL, originally called Los Alamos Scientific Laboratory) were compared. During the years that followed, numerous intercomparisions r-'i were conducted between Hanford, ORNL, LANL, Rocky Flats Plant (RFP), and Savannah River Plant (SRP) dosimeters. In the 1960s Hanford.was involved in a national intercomparison program to compare government and private film dosimeter processors. This program demonstrated that accurate measurement of dose from low-energy x-rays and neutrons was the most difficult, especially in mixed radiation fields. Additional dosimeter intercomparison studies were conducted during the 1970s and 1980s. The American National Standards Institute (ANSI) fonnally adopted a national standard for personnel dosimeter perfonnance in 1983. This standard, ANSI N13.ll, was used by the U.S. Nuclear Regulatory Commission (NRC) and the U.S. Department of Energy (DOE) as a basis for implementing national personnel dosimeter accreditation requirements for dosimetry programs in the late 1980s. It should be noted that significant improvement was observed for all laboratories in the measurement of personnel dose from 1) x-rays with the introduction of the multi-element film dosimeters and from 2) neutrons with the introduction of the thennoluminescent dosimeter (TLD).
This report describes the evolution in Hanford personnel dosimetry technology and associated practices. Numerous technical studies were conducted during the years and the most significant of these are described in this report. Topics include:
• a description of each dosimeter used since 1944
• technical details of dosimeter calibration and dose detennination
• description of dosimeter quality control studies
• description of intercomparison programs
• methods used to calculate the recorded skin and whole body doses
• results of a laboratory intercomparison study conducted during 1989 of all Hanford film dosimeters
• perfonnance of the Hanford TLDs during accreditation testing during 1989
viii
• comparison of whole body dose with expected deep dose and the expected performance of Hanford personnel dosimeters used in typical radiation fields.
A bibliography is included for pertinent information not explicitly used )n
the report. Hanford facilities are categorized in this report into six general types in the evaluation of the recorded whole body dose compared with the actual tissue dose at a depth of 1-cm (i.e., deep dose). These categories included: 1) fuel fabrication, 2) reactor, 3) fuel reprocessing, 4) plutonium finishing, 5) waste, and 6) laboratory. Knowledge of radiation fields typical of these facility categories in conjunction with the dose response characteristics of the different dosimeters is used to assess the a~curacy of calculated whole body dose at Hanford relative to the actual deep dose. The evaluation is based on information in this report as well as the professional experience of the authors extending throughout nearly all 5 decades of Hanford operations.
This evaluation concluded that the recorded whole body dose, on average, for the vast majority of Hanford personnel is estimated to be nearly equivalent to the actual deep dose. For higher energy (> 100-keV) photon fields, which comprise the majority of personnel exposure in Hanford facilities, it is estimated that the difference between the recorded whole body dose and the actual deep dose for occupationally exposed personnel is about •50%, •30%, and •20%, respectively, for the two-element film dosimeter (used from 1944 to 1956), multi-element film dosimeters (used from 1957 to 1971), and TLD (used from 1972 to 1989). A greater difference between the recorded whole body dose and the actual deep dose occurs for facilities in which complex mixtures of beta and photon radiation or neutron radiation are present. Comparison of the recorded neutron dose with the actual dose equivalent with the TLD is estimated to be •50%. Greater uncertainty was evident with the DuPont Nuclear Track Emulsion film used from 1950 through 1972. These estimates are appropriate for personnel whose occupational radiation exposure is significantly greater than the natural environmental background radiation. It is important to note that the majority of Hanford workers received very little occupational exposure.
There were problems in the recorded whole body dose for plutonium facility personnel. There is little doubt that the recorded dose is underestimated
ix
compared with the deep dose. This occurred because of the difficulties in measuring plutonium x-rays (16 keV to 17 keV) prior to the use of the multi- ~ element film dosimeter in 1957 and because of the difficulty of measuring neutron dose prior to the use of the TLD in 1972. Methods that could be used to improve the recorded whole body dose for plutonium facilities personnel are presented in this report. It should be noted that these personnel comprised a small percentage of the total personnel employed at Hanford since 1944 and would not be expected to significantly impact the evaluation of radiation risk for Hanford personnel using recorded doses. However, determination of the source of exposure for more highly exposed personnel should be considered to ensure that no significant error in the analyses occurs.
x

ACKNOWLEDGMENTS
Since the inception of Hanford, numerous individuals have contributed to the science of measuring personnel exposure to radiation. The evolving nature of Hanford radiation protection technology and its implementation as routine practice is illustrated throughout this report. The report is a tribute to the dedication and talent of these many individuals. Interested readers are encouraged to consult the many documents cited in this report. The authors particularly acknowledge Ethel Gilbert, whose interest in documenting Hanford dosimetry practices in support of the Hanford Health and Mortality Study has made this report possible. She reviewed the report on several occasions providing detailed comments on content and presentation. Thanks also to Susan Ennor who edited the report and Marianna Cross who typed the final manuscript. We also wish to thank Bill Endres, Ron Kathren, and Leo Kocher for their technical review of this document and their many helpful suggestions to improve its validity.
xi
ABS
AEC
ANL
ANSI
BNL
BNWL
CP
CSF
DOE
DOE LAP
ERDA
GE
GM
HAPO
HBPD
HEHF
HEW
HMPD
HP
IARC
ICRP
ICRU
LANL
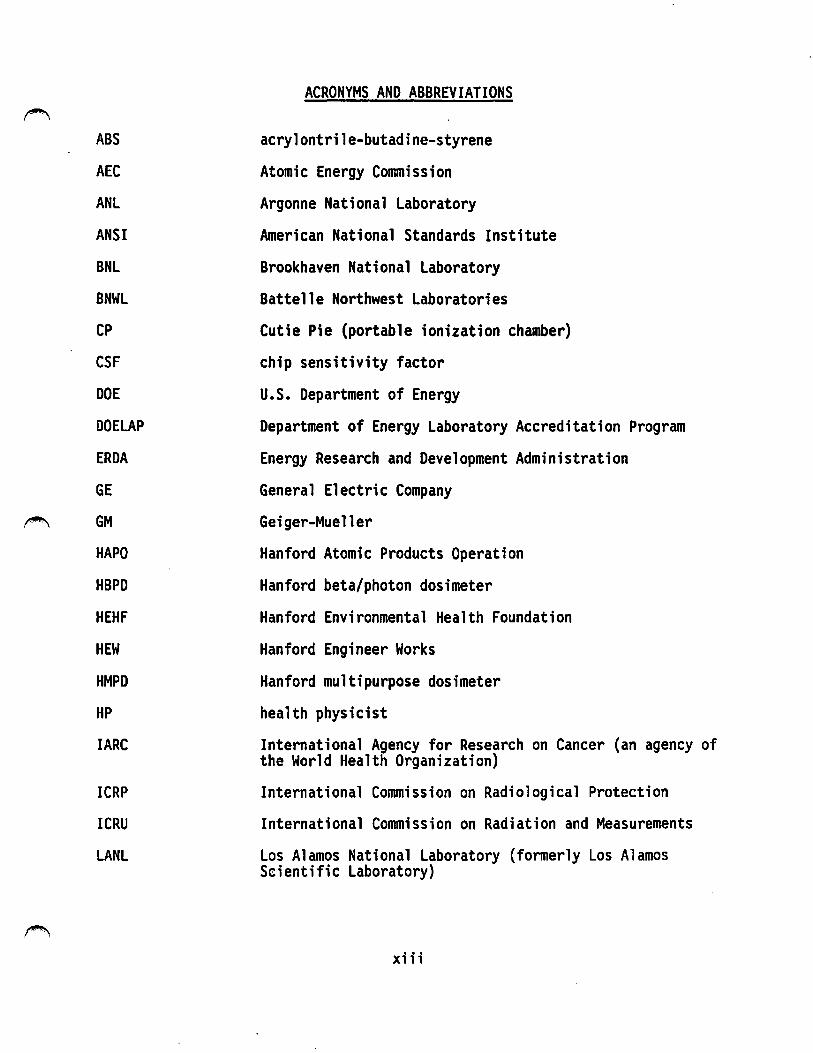
ACRONYMS AND ABBREVIATIONS
acrylontrile-butadine-styrene
Atomic Energy Commission
Argonne National Laboratory
American National Standards Institute
Brookhaven National Laboratory
Battelle Northwest Laboratories
Cutie Pie (portable ionization chamber)
chip sensitivity factor
U.S. Department of Energy
Department of Energy Laboratory Accreditation Program
Energy Research and Development Administration
General Electric Company
Geiger-Mueller
Hanford Atomic Products Operation
Hanford beta/photon dosimeter
Hanford Environmental Health Foundation
Hanford Engineer Works
Hanford multipurpose dosimeter
health physicist
International Agency for Research on Cancer (an agency of the World Health Organization)
International Commission on Radiological Protection
International Commission on Radiation and Measurements
Los Alamos National Laboratory (formerly Los Alamos Scientific Laboratory)
xiii
LASL
LET
LLNL
NAS
NBS
NCRP
NIST
NRC
NTA
NV LAP
OCR
ORNL
"P"
PNL
PSF
PUREX
RBE
RECUPLEX
RFP
RSF
11s11
SRP
TEPC
TLD
UST
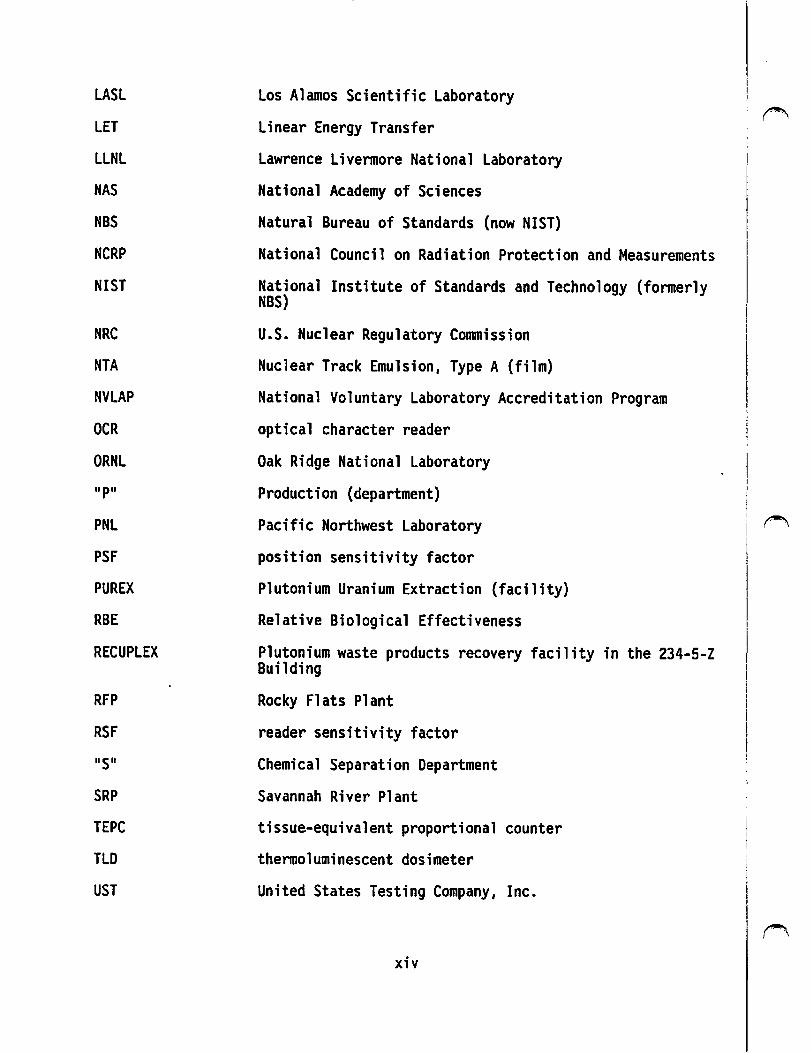
Los Alamos Scientific Laboratory
Linear Energy Transfer
Lawrence Livennore National Laboratory
National Academy of Sciences
Natural Bureau of Standards (now NIST)
National Council on Radiation Protection and Measurements
National Institute of Standards and Technology (fonnerly NBS)
U.S. Nuclear Regulatory Commission
Nuclear Track Emulsion, Type A (film)
National Voluntary Laboratory Accreditation Program
optical character reader
Oak Ridge National Laboratory
Production (department)
Pacific Northwest Laboratory
position sensitivity factor
Plutonium Uranium Extraction (facility)
Relative Biological Effectiveness
Plutonium waste products recovery facility in the 234-5-Z Building
Rocky Flats Plant
reader sensitivity factor
Chemical Separation Department
Savannah River Plant
tissue-equivalent proportional counter
thermoluminescent dosimeter
United States Testing Company, Inc.
xiv
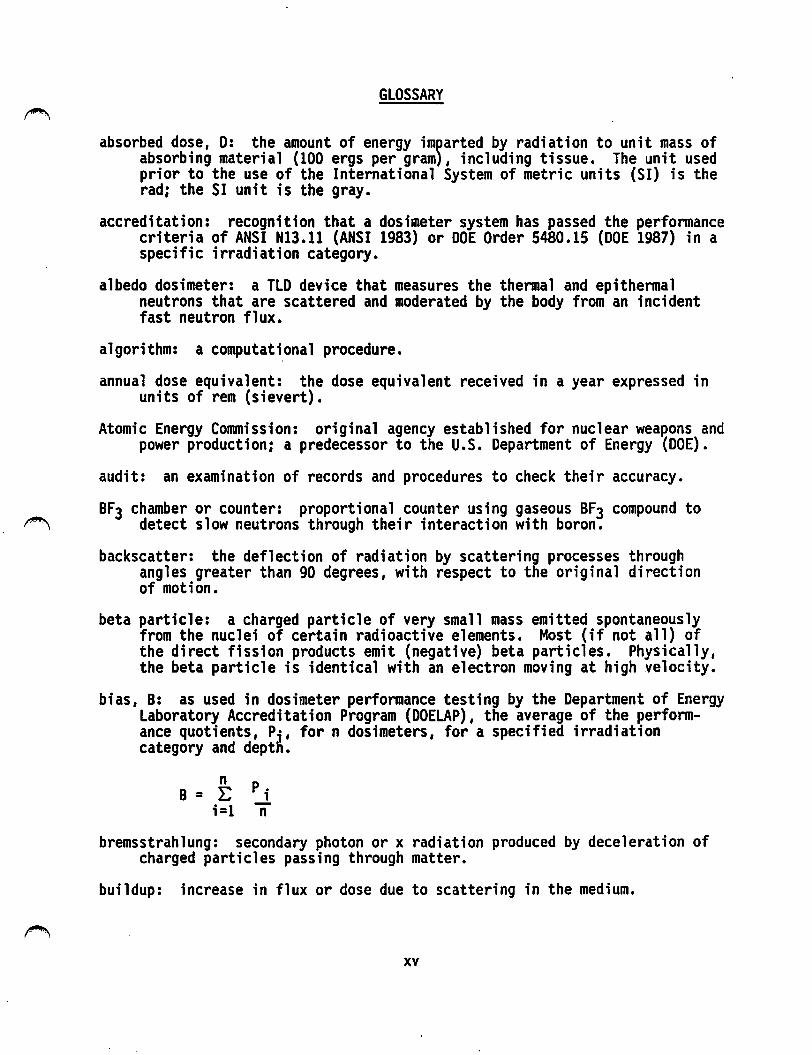
GLOSSARY
absorbed dose, 0: the amount of energy imparted by radiation to unit mass of absorbing material (100 ergs per gram), including tissue. The unit used prior to the use of the International System of metric units (SI) is the rad; the SI unit is the gray.
accreditation: recognition that a dosimeter system has passed the performance criteria of ANSI Nl3.ll (ANSI 1983) or DOE Order 5480.15 (DOE 1987) in a specific irradiation category.
albedo dosimeter: a TLD device that measures the thermal and epithermal neutrons that are scattered and moderated by the body from an incident fast neutron flux.
algorithm: a computational procedure.
annual dose equivalent: the dose equivalent received in a year expressed in units of rem (sievert).
Atomic Energy Conunission: original agency established for nuclear weapons and power production; a predecessor to the U.S. Department of Energy (DOE).
audit: an examination of records and procedures to check their accuracy.
BF3 chamber or counter: proportional counter using gaseous BF3 compound to detect slow neutrons through their interaction with boron.
backscatter: the deflection of radiation by scattering processes through angles greater than 90 degrees, with respect to the original direction of motion.
beta particle: a charged particle of very small mass emitted spontaneously from the nuclei of certain radioactive elements. Most (if not all) of the direct fission products emit (negative) beta particles. Physically, the beta particle is identical with an electron moving at Mgh .velocity.
bias, B: as used in dosimeter performance testing by the Department of Energy Laboratory Accreditation Program (DOELAP), the average of the performance quotients, Pj, for n dosimeters, for a specified irradiation category and deptn.
n B = E
i=l p •
1 n
bremsstrahlung: secondary photon or x radiation produced by deceleration of charged particles passing through matter.
buildup: increase in flux or dose due to scattering in the medium.
xv

calibration blank: a dosimeter that has not been exposed to a radiation source. The results from this dosimeter establish the dosimetry system ~ base line or zero dose value.
collective dose equivalent: the sum of the dose equivalents of all individuals in an exposed population. Collective dose is expressed in units of person-rem (person-sievert).
control dosimeter: a dosimeter used to establish the dosimetry system response to radiation dose. The dosimeter is exposed to a known amount of radiation dose.
curie: a special unit of activity. One curie exactly equals 3.7 x 10¹⁰ nuclear transitions per second.
Cutie Pie (CP): a portable ion chamber survey meter with a pistol grip and a large cylindrical ionization chamber.
deep absorbed dose (Dd): the absorbed dose at the depth of 1.0 cm in a material of spec1fied geometry and composition.
deep dose equivalent (Hd): the dose equivalent at the respective depth of 1.0 cm in tissue.
densitometer: instrument that has a photocell to determine the degree of darkening of developed photographic film.
density reading: see optical density.
detection level: the smallest amount of radiation or neutron flux that can be detected as being present.
dose equivalent (H): the product of the absorbed dose (D), the quality factor (Q), and any other modifying factors. The special unit is the rem. When Dis expressed in Gy, His in Sieverts (Sv). (1 Sv = 100 rem.)
dosimeter: a device used to measure the quantity of radiation received. A holder with radiation-absorbing elements (filters) and an insert with radiation-sensitive elements packaged to provide a record of absorbed dose or dose equivalent received by an individual. (See albedo dosimeter, film dosimeter, neutron film dosimeter, thermoluminescent dosimeter. )
dosimetry system: a system used to assess dose equivalent from external radiation to the whole body, skin, and/or extremities. This includes the fabrication, assignment, and processing of the dosimeters as well as interpretation and documentation of the results.
DuPont 552: a film packet containing two pieces of film: a 502 sensitive film and a 510 insensitive film.
xvi
DuPont 558: a film packet containing a 508 film with one side having a sensitive emulsion and the other side insensitive emulsion.
Eastman Kodak Nuclear Track Emulsion, Type A (NTA): a film that is sensitive to fast neutrons. The developed· image has tracks caused by neutrons that can be seen by using oil immersion and lOOOX power microscope.
error: a term used to express the difference between the estimated and "true" value. Error may also be used to refer to the estimated uncertainty.
exchange period (frequency): time period (weekly, biweekly, monthly, quarterly, etc.) for routine exchange of dosimeters.
exposure: as used in the technical sense, exposure refers to a measure expressed in roentgens of the ionization produced by ganuna (or x) rays in air.
exposure-to-dose-equivalent conversion factor for photons (Cx): the ratio of exposure in air to the dose equivalent at a specified depth in a material of specified geometry and composition. The C factors are a function of photon energy, material geometry (e.g., spAere, slab, or torso), and material composition (e.g., tissue-equivalent plastic, soft tissue ignoring trace elements, or soft tissue including trace elements).
extremity: that portion of the arm extending from and including the elbow through the fingertips, and that portion of the leg extending from and
~ including the knee and patella through the tips of the toes.
field calibration: dosimeter calibration based on radiation types, intensity and energies present in the work environment.
film: generally means a "film packet" that contains one or more pieces of film in a light-tight wrapping. The film when developed has an image caused by radiation that can be measured using an optical densitometer. (See Dupont 552, Dupont 558, Eastman Kodak, nuclear emulsions.)
film density: see optical density.
film dosimeter: a small packet of film within a holder that attaches to a wearer.
free-field dose equivalent: the dose equivalent assigned for neutron irradiation as if it were performed in free space with no background from air and room scattering and no source asymmetry (Schwartz and Eisenhauer 1982).
gamma rays: electromagnetic radiation (photons) originating in atomic nuclei and accompanying many nuclear reactions (e.g., fission, radioactive decay, and neutron capture). Physically, gamma rays are identical to x-rays of high energy, the only essential difference being that x-rays do not originate in the nucleus.
xvii

gamma ray interactions:
Photoelectric absorption - the process whereby a ganuna-ray (or x-ray) photon, with energy somewhat greater than that of the binding energy of an electron in an atom, transfers all its energy to the electron, which is consequently removed from the atom.
Compton scattering - an attenuation process observed for x-ray or gamma radiation in which an incident photon interacts with an orbital electron of an atom to produce a recoil electron and a scattered photon of energy less that the incident photon.
Pair production - an absorption process for x-ray and gamma radiation in which the incident photon is annihilated in the vicinity of the nucleus of the absorbing atom, with subsequent production of an electron and positron pair. This reaction only occurs for incident photon energies that exceed 1.02 MeV.
Geiger-Mueller (GM) counter: a radiation measuring device used to detect beta and ganuna radiation.
glove box: a device used in handling of quantities of radioactive isotopes to provide containment of the radioactivity and to avoid contamination of the hands.
gray (Gy): the SI unit of absorbed dose. (1 Gy = 100 rad)
half-life: the time required for the activity of a given radioactive species ~ to decrease to half of its initial value due to radioactive decay.
induced radioactivity: radioactivity produced in certain materials as a result of nuclear reactions particularly the capture of neutrons.
ionizing radiation: electromagnetic or particulate radiation capable of producing charged particles through interactions with matter.
irradiation category: the type and energy (or mixture) of radiation for which performance criteria are given in ANSI N13.ll· (ANSI 1983) or DOE Order 5480.15 (DOE 1987).
isotopes: forms of the same element having identical chemical properties but differing in their atomic masses. Isotopes of a given element all have the same number or protons in the nucleus but different numbers of neutrons. Some isotopes of an element may be radioactive.
kilo-electron volt (keV): an amount of energy equal to 1,000 electron volts.
luminescence: the emission of light from a material as a result of some excitation.
net optical density: value obtained by subtracting background from measured optical density.
xviii
neutron: a basic particle that is electrically neutral weighing nearly the same as the hydrogen atom.
neutron film dosimeter: a film dosimeter that contains an Eastman-Kodak Neutron Track Emulsion, type A, film packet.
nuclear emulsion: is generally NTA film.
optical density: the quantitative measurement of photographic blackening the density defined as D = LoglO (10/1).
11 P11 Department: Reactor Production Department.
Puf 4 source: a neutron source whose activating material is plutonium fluoride. The source was used to duplicate the neutron energies in Hanford's Z-Plant.
pencil dosimeters: a type of ionization chamber used by personnel to measure radiation dose. Other names: pencil, pocket dosimeter, pocket pencil, pocket ionization chamber.
performance quotient, Pi: the fractional difference between the reported and delivered absorbed dose or dose equivalent for the ith dosimeter,
p. = [Xi (reportedl - Xi (delivered)] 1 Xi delivered)
where the absorbed dose (D) or dose equivalent {H) can be inserted for X.
photon: a unit or 11 particle 11 of electromagnetic radiation consisting of xand/or ganuna rays.
photon - x-ray: electromagnetic radiation of energies between 10 keV and 100 keV whose source can be x-ray machine or radioisotope.
protection dosimetry: routine measurements and the estimation of the dose equivalent for the purpose of determining and controlling the dose equivalent received by radiation workers.
quality factor, Q: a modifying factor used to derive dose equivalent from absorbed dose.
rad: a unit of absorbed dose equal to the absorption of 100 ergs per gram of absorbing material, such as body tissue.
radiation: in this report, the term radiation is understood to include beta, neutron, and photon radiation from external sources.
radioactivity: the spontaneous emission of radiation, generally alpha or beta particles, gamma rays, and neutrons from unstable nuclei
xix
RBE: relative biological effectiveness.
Recuplex: plutonium waste products recovery facility in the 234-5-Z Building.
rem: the rem is a unit of dose equivalent, which is equal to the product of the number of rads absorbed and the "quality factor."
rep: Roentgen-equivalent-physical (mrep = millirep).
Roentgen: a unit of exposure to gamma {or x-ray) radiation. It is defined precisely as the quantity of gamma (or x) rays that will produce a total charge of 2.58 x l0-4 coulomb in 1 kg of dry air. An exposure of 1 R is approximately equivalent to an absorbed dose of 1 rad in soft tissue.
"S" Department: chemical separations operations (200 Areas).
scattering: the diversion of radiation from its original path as a result of interactions with atoms between the source of the radiations and a point at some distance away. Scattered radiations are typically changed in direction and of lower energy than the original radiation.
shallow absorbed dose {Ds): the absorbed dose at a depth of 0.007 cm in a material of specified geometry and composition.
shallow dose equivalent (Hs): dose equivalent at a depth of 0.007 cm in tissue.
shielding: any material or obstruction that absorbs {or attenuates) radia- ~ tion and thus tends to protect personnel or materials from radiation.
sievert {Sv): the SI unit for dose equivalent. (1 Sv = 100 rem.)
sigma pile: a device used to obtain thennal neutrons for calibration purposes.
silver shield{s): the 1-mm- and 0.13-µm-thick shields covering the film packet in the early personnel film dosimeters.
skin dose: absorbed dose at a tissue depth of 7 mg/cm2.
Snoopy: portable neutron monitoring instrument with a moderated BF3 detector.
standard deviation (S): as used in DOELAP dosimeter performance testing, the standard deviation of the performance quotients is calculated as follows:
xx
~.
where Pi is the perfonnance quotient for each dosimeter i and B is the bias for the n dosimeters.
TLD chip: a small block or crystal made of LiF used in the TLD.
TLD-600 - A TLD chip made from Li-6 (>95%) used to detect neutrons.
TLD-700 - A TLD chip made from Li-7 (>99.9%) used to detect photon and beta radiation.
thennoluminescent: property of a material that causes it to emit light as a result of being excited by heat.
thennoluminescent dosimeter (TLD): a holder containing solid chips of material that when heated will release the stored energy as light. The measurement of this light provides a measurement of absorbed dose. The solid chips are sometimes called crystals.
whole body dose: commonly defined as the absorbed dose at a tissue depth of 1.0 cm (1000 mg/cm2); however, this tennis also used to refer to the dose recorded.
x-ray: ionizing electromagnetic radiation of extranuclear origin.
Z-Plant: a Hanford facility, composed of several buildings, where plutonium is processed (also known as 234-5-Z Building).
xxi
CONTENTS
PREFACE
ABSTRACT
. . . . . . . . . . . . . . . . . . . . . . . .
. . . . . . . EXECUTIVE SUMMARY
ACKNOWLEDGMENTS • • . . . . . . . . . . . . . . . . . . . . ACRONYMS AND ABBREVIATIONS
GLOSSARY • • • • •
. . . . . . . . . . . . . . . . .
. . . . . . . . . . . . . . . . . . 1.0 INTRODUCTION ••• . . . . . . . . . . .
1.1 R~PORT PURPOSE AND CONTENTS •
1.2 HISTORICAL OVERVIEW ••••••
1.3 RADIATION PROTECTION PHISOSOPHY ••
2.0 HANFORD PERSONNEL BETA/PHOTON DOSIMETERS . . . . . . . 2.1 EARLY USE OF PERSONNEL DOSIMETERS AT HANFORD
2.1.1 Dosimeter Film, Design, and Assignment
2.1.2 Processing Film Dosimeters and Pencil
. . . Dosi meters • • • • • • • • . . . . . . .
2.1.3 Film Dosimeter Calibration . . . . . . . . . . . 2.2 BETA/PHOTON FILM DOSIMETER USED FROM 1944 TO 1957
2.3 BETA/PHOTON FILM DOSIMETER USED FROM 1957 TO 1962
2.4 BETA/PHOTON FILM DOSIMETER USED FROM 1962 TO 1972
2.5 THERMOLUMINESCENT DOSIMETER USED FROM 1972 TO THE PRESENT • • • • • • • • • • • • • • • •
2.6 PENCIL DOSIMETERS FOR BETA/PHOTON MEASUREMENTS
2.1 OTHER EXTREMITY DOSIMETERS ••
2.7.1 Finger Ring Dosimeters •
2.7.2 Wrist and Flexible Dosimeters
xxi;;
. . . . . . . . . . . . . . . .
. . .
iii
v
vii
xi
xiii
xv
1.1
1.1
1.3
1.5
2.1
2.2
2.4
2.7
2.11
2.11
2.14
2.19
2.24
2.24
2.29
2.29
2.30
3.0 HANFORD PERSONNEL NEUTRON DOSIMETERS . . . . 3.1 PENCIL DOSIMETERS USED FROM 1944 TO 1950
3.2 NEUTRON FILM DOSIMETER USED FROM 1950 TO 1957
3.3 NEUTRON FILM DOSIMETER USED FROM 1957 TO 1958 ••
3.4 NEUTRON FILM DOSIMETER USED FROM 1958 TO 1972 •• . . . . 3.4.1 Design Characteristics •••••••••
3.4.2 Calibration of Nuclear Track Emulsions •
3.4.3 Cadmium-Clad Tin Shields •••••
3.4.4 Quality Factors . . . . . . . . . . . 3.5 RHODIUM DOSIMETER ••••
3.6 THERMOLUMINESCENT NEUTRON DOSIMETER USED FROM 1972 TO THE PRESENT • • • • • • • • •
3.6.1 Design Characteristics •
3.6.2 Calibration •• . . . . . .
. . .
. . .
3.7 ACCIDENT DOSIMETRY . . . . . . . . . . . . . . . . . . . 4.0 DOSIMETER CALIBRATION AND DOSE DETERMINATION •
4.1 TWO-ELEMENT BETA/PHOTON DOSIMETER USED FROM 1944 TO 1957 • • • • • • • • • • • • • • •
4.2 PERSONNEL NEUTRON FILM DOSIMETER USED FROM 1950 TO 1958. • • • • • • • • • • • • • • •
. . . . . . . . . . .
4.3 MULTI-ELEMENT BETA/PHOTON FILM DOSIMETER USED FROM
3.1
3.1
3.1
3.2
3.2
3.2
3.4
3.6
3.7
3.7
3.7
3.8
3.9
3.9
4.1
4.1
4.7
1957 TO 1962. • • • • • • • • • • • • • • • • • 4.8
4.4 MULTI-ELEMENT NEUTRON FILM DOSIMETER USED FROM 1958 TO 1972 • • • • • • • • • • • • • • • • • 4.10
4.5 MULTI-ELEMENT BETA/PHOTON FILM DOSIMETER USED FROM 1962 TO 1972 • • • • • • • • • • • • • • • • • • • • 4.11
4.6 MULTI-ELEMENT THERMOLUMINESCENT DOSIMETER USED FROM 1972 TO THE PRESENT • • • • • • • • • • • • • • • • • 4 .13
4.7 BETA/GAMMA FILM DOSIMETER CALIBRATION • . . • • • 4.15
4.8 LOW-ENERGY GAMMA, PHOTON, AND X-RAY CALIBRATION . 4.20
xx iv
4.9 NTA FILM CALIBRATION PROCEDURE . . . . . . . . 5.0 DOSIMETER QUALITY CONTROL PROGRAMS ••
5.1 ROUTINE QUALITY CONTROL PROGRAMS . . . . . . . . 5.1.1 Early Reviews of Dosimeter Records
5.1.2 Film and Pencil Dosimeter Control
5.1.3 Audits of Nuclear Track Emulsion Film Dosimeter Densi~y Readings • • • • •
5.1.4 Early Evaluation of Dosimetry for Plutonium X-Rays ••••••••••••• . . .
5.1.5 17-keV Deep-Dose Curve . . . . . . . . . . . . . .. 5.1.6 Examination of Film for Reproducibility
from 1944 to 1957 • • • • • • • • • • •
5.1.7 University of Pittsburgh Film Study ••
5.1.8 Personnel Film Dosimeter Audits During 1958
5.1.9 1960 Audit of Dosimeter Results
5.1.10 Routine Audit Dosimeter Program
5.1.11 Gamma Angular Dependence of the Hanford Atomic Products Operation Film Dosimeter During 1960 • • • • • • • • • • • •
5.1.12 Personnel Exposure to Neutrons . . . . 5.1.13 Characterization of Calibration Sources ••
5.2 LABORATORY QUALITY ASSURANCE STUDIES • • • • •
5.2.1 Study of DuPont 552 Film ••••
5.2.2 Studies of Film Dosimeter Variables
5.2.3 Analysis of Detection Level During 1960
5.2.4 Security Cr'edential Evaluation •••
5.2.5 Fading Effects in Eastman-Kodak NTA Fi 1 m Emu 1 s i on • • • • . • • • • •
5.2.6 NTA Film Study . . . .
xxv
. . .
4.22
5.1
5.1
5.1
5.2
5.2
5.3
5.5
5.6
5.6
5.8
5.9
5.10
5.10
5.13
5.14
5.15
5.15
5.16
5.20
5.21
5.22
5.22
5.2.7 Study to Detennine Effect of Security Credential Design Change
5.3 INTERCOMPARlSON PROGRAMS •••••••••••
5.3.1 Intercomparison of Dosimeter Films Used at Hanford and at the Metallurgical and Clinton Laboratories •••••••••
5.3.2 Intercomparison of Hanford, Savannah River Plant, Rocky Flats Plant, and Los Alamos National Laboratory Film Dosimeters •
5.3.3 Hanford Dosimeters Exposed at Savannah River Plant in 1959 •••••••••
5.3.5 Hanford Dosimeters Exposed at Rocky Flats Plant in 1959 ••••••••••••••
5.3.6 Hanford Dosimeters Exposed at Los Alamos
. . . .
. . . .
5.23
5.23
5.25
5.27
5.28
5.31
National Laboratory in 1959 • • • • • • 5.31
5.3.7 National Film Dosimeter Intercomparison Study 5.32
5.3.8 Comparison of Film and Thennoluminescent Dosimeters • • • • • • • • • • • • • • 5.35
5.3.9 Hanford Personnel Dosimeter Supporting Studies
5.3.10 Personnel Dosimeter Accreditation •••••
6.0 OFFICIAL RECORDED RADIATION DOSE FOR HANFORD PERSONNEL •
6.1 METHODOLOGY FOR RECORDING RADIATION DOSE
. . . . . 6.2 RECORDS MAINTENANCE • • • • • •
7.0 PERFORMANCE OF HANFORD DOSIMETERS . . . . . . . . . . . . . . 7.1 EVALUATION OF DOSIMETER PERFORMANCE BASED ON
HISTORICAL DOCUMENTATION • • • • • • • • •
7.1.1 Radiation Response Characteristics
7.1.2 Thermoluminescent Dosimeter
7.1.3 Dosimeter Detection Levels
7.2 1989 INTERCOMPARISON STUDY
7.3 OOELAP ACCREDITATION ••••
. . . . . . . . . .
5.38
5.39
6.1
6.1
6.4
7.1
7.1
7.2
7.5
7.6
7.7
7.9
I~
8.0 DEEP DOSE EVALUATION . . . . . . . . . . . . . . . . . . . . 8.1 HANFORD PERSONNEL DOSIMETRY PRACTICES AND SYSTEMS
8.2 HANFORD FACILITIES • • • • • • • •
8.3 EVALUATION OF RECORDED DOSE . . 8.3.1 Dose from Beta and Photon Radiation
. . . 8.1
8.1
8.2
8.3
8.4
8.3.2 Dose from Neutron Radiation • • • • • • 8.7
8.3.3 Dosimetry for Personnel with Little ·or No Occupational Exposure • • • • • • • • • • 8.8
8.4 DOSIMETER RESPONSE IN HANFORD FACILITIES ••
8.4.1 Two-Element Film Dosimeter Used from 1944 to 1957 • • • • • • • • •
8.4.2 Multi-Element Film Dosimeter Used
. . . .
from 1957 to 1972 • • • • • • • • • • •
8.4.3 Multi-Element Thermoluminescent Dosimeter Used from 1972 to 1989 • • • • • • • • •
8.5 CONCLUSION • • . . . . . . . . . . . 8.6 FUTURE WORK . . . . . . . . . . . . . . .
. . . . . . . . . . . . . . . . . . .
8.9
8.10
8.14
8.15
8.16
8.17
Ref.! REFERENCES • •
BIBLIOGRAPHY . . . . . . . . . . . . . . . . . • • • Biblio.l
APPENDIX A - DOSE ALGORITHM FOR THE BETA/PHOTON FILM DOSIMETER USED FROM 1957 TO 1962 • • •
APPENDIX B - DOSE ALGORITHM FOR THE BETA/PHOTON FILM DOSIMETER USED FROM 1962 TO 1972 • •
APPENDIX C - THERMOLUMINESCENT DOSIMETER ALGORITHMS . . . . . . . APPENDIX D - DATA FOR BETA/PHOTON DOSIMETERS EVALUATED
DURING THE 1989 INTERCOMPARISON STUDY · .•••
APPENDIX E - ADDITIONAL LETTERS ON HISTORICAL RADIATION PROTECTION PRACTICES AT HANFORD • • • . • •
xxvii
A.1
B.1
C.1
D.l
E.1
FIGURES
2.1 Reading Film from Film Dosimeters •• . . . . . . . 2.2 Map of Hanford Site in Southeastern Washington State ••
2.3 Original Film Dosimeter Used at Hanford in 1944
2.4 Picking Up a Film Dosimeter at the Gatehouse When Entering the Process Area • • • • • •
. . .
. . .
2.5 The 300 Area Showing the 3701 Gatehouse, 3745 Calibrations Building, and the 3746 Health Instruments Headquarters Building (February 14, 1945) ••••••••••••• . .
2.6 Riveting and Unriveting Film Dosimeters to Recover the Film Packets for Processing •••••••••••••••
2.7 Original Modified Metal Hanford Beta/Photon Film Dosimeter Used from 1944 to 1959 • • • • • • • • • • • • • • • • • • •
2.8 Early Densitometer Used for Reading Personnel Film Dosimeters • • • • • • • • • • • • • • • • ••••• . . . . .
2.9 Plastic Film Dosimeter Holder Introduced in 1957 and Old Metal Dosimeter Holder Used from 1944 to 1957 • • • • • •
2.10 Design of the Plastic Film Dosimeter Holder Filter System . . . • . . . . . . . . . . . . . . . . .
2.11 Ratio of Filtered Areas to Indicate Energy of Photon Radiation ••••••••••• . . . . . . .
2.12 Energy Response of Each Filter Region of the Beta/Photon Film Dosimeter Used from 1957 to 1962 •••••••••
2.13 First Hanford Automatic Film Dosimeter Processor (1957)
2.14 Hanford Film Dosimeter Used from 1962 to 1972
2.15 Dosimeter Processing Machine Developed in 1962 •
2.16 Automatic Reading Densitometer for the Film Dosimeter Used from 1962 to 1972 • • . • • • • • • • • •
2.17 Hanford Basic and Multipurpose Thermoluminescent Dosimeters • • • • • • • • . . • • • • • • • •
2.18 First Automatic TLD Reader Used at Hanford
xxviii
. .
. .
. . .
. . .
2.3
2.6
2.7
2.8
2.9
2.10
2.12
2.13
2.15
2.16
2.18
2.18
2.19
2.20
2.21
2.22
2.25
2.26
~
~
2.19 Pencil Dosimeter Shown with Other Hanford Dosimeters Used from 1944 to 1957 • • • • • • • • • • • • • •
3.1 Double-Packet Plastic Neutron Film Dosimeter Introduced in 1958 • • • • • • • • • • • • • . . . . . .
3.2 Counting Tracks on NTA Film with a Microscope
3.3 Rhodium Film Dosimeter • • • • • • . . . . . . 3.4 Hanford Area Criticality Dosimeter . . . . . . . . . . . . . 4.1 Calibration Graph for the First Week of 1950 •
4.2 Film Calibration on the 11Quija Board"
• • • . . .
4.3 Improved Film Calibration Jig with Rotating Source • . . . 4.4 . . . . . . . . . . 4.5
Uranium Calibration Jig •••••••
Jig for X-Ray CK-Sources) Calibration . . . . . . . 4.6 Radiators for Various Low-Energy Calibrations . . . . 4.7 Sigma Pi le .................. .
5.1 Reproducibility of the 1945 Film Density Readings
5.2 Net Optical Density of DuPont 552 Film . . . . 5.3 Results of the 1945 lntercomparison of Hanford,
Metallurgical Laboratory, and Clinton Laboratory Film Exposed to Radium Ganuna Radiation ••••
5.4 Plywood Disc Used to Simultaneously Expose Hanford, SRP, RFP, and LANL Dosimeters to Plutonium for lntercomparison of Results ••••••••••
5.5 Comparison of Film Dosimeter and TLD Penetrating Dose Results • • • • • • • • • • • • • • • • • •
5.6 Comparison of Film Dosimeter and TLD Fast Neutron Dose Results • • • • • • • • • • • • • • • • • •
6.1 Early Records Maintenance At Hanford: Manual Handling and Storage of Employee Radiation Exposure Histories
7.1 Hanford Two-Element Dosimeter Response from 1944 to 1957 • • • • • • • • • • . . . . . . . . . . . .
xx ix
2.28
3.3
3.6
3.8
3.11
4~4
4.16
4.17
4.19
4.21
4.23
4.24
5.7
5.12
5.26
5.28
5.37
5.37
6.4
7.3
7.2 Hanford Multi-Element Film Dosimeter Response from 1962 to 1972 • • • • • • • • • • • • • • • •
7.3 Hanford Multi-Element Therrnoluminescent Dosimeter Response from 1972 to the Present • • • • • • • •
xxx
. . . 7.3
. . . 7.4
I
~
n i I
TABLES
2.1 Regular Pencil and Film Dosimeter Use at Hanford by Operating Area • • • • • • • • • • • • • • •
2.2 Filtration Specifications for the Hanford Beta/Photon Personnel Film Dosimeter Holder Used from 1944 to 1957
2.3 Filtration Specifications for the Hanford Personnel Beta/Photon Film Dosimeter Holder Used from 1957 to 1962 • • • • • • • • • • • • • • • • • • • • • • •
2.4 Filtration Specifications for the Hanford Beta/Photon Film Dosimeter Holder Used from 1962 to 1972 ••••
2.5 Personnel Dosimeter Foil System Specifications for the Beta/Photon Film Dosimeter Used from 1962 to 1972
2.6 Filtration Specifications for the Hanford Personnel Thermoluminescent Dosimeter Holder Used from 1972 to the Present • • • • • • • • • • • • • • • • • • •
3.1 Design Specifications for the Hanford Personnel Neutron Film Dosimeter Holder Used from 1958 to 1972
4.1 Historical Summary of Hanford Calibration and Dose Assessment Techniques •••••••••••
. . .
. . . .
. . . .
4.2 Calibration Data for the First Week of 1950
4.3 Standard Calibration Curve Developed in 1951
. . . . . . .
4.4 Standard Calibration Chart for DuPont 502 Film ••
4.5 Irradiations for Calibrated Film Sets from 1951 to 1957 • • • • • • • • • • • • • • • . . . . .
5.1 Results of the 1951 Nuclear Track Film Processing Audit
5.2 X-Ray Component of Total Dose •••••••
5.3 Results of Film Audit Dosimeters During 1958
5.4 Audit of Dosimeter Results During 1960 •••
. . . .
5.5 Radium Gamma Dosimeter Audit Results During 1966
5.6 Neutron Dosimeter Audit Results from 1965 to 1967
5.7 Optical Density Results for DuPont 508 Film ••••
xxxi
2.4
2.12
2.17
2.23
2.23
2.27
3.4
4.2
4.3
4.5
4.6
4.9
5.3
5.5
5.8
5.9
5.11
5.11
5.18
5.8 Absolute Error in Optical Density Units for DuPont 508 Film • • • • • • • • • • . . . .
5.9 Effect of Security Credential on Dose Assessment
5.10 Intercomparison of the Hanford, Metallurgical Laboratory, and Clinton Laboratory Film Dosimeters in 1945 . . . . . . . . . . . . . . . . . . . . .
5.11 Comparison of Total Dose for Hanford, Metallurgical Laboratory, and Clinton Laboratory Film Dosimeters in 1945 . . . . . . . . . . . . . . . . . . . . . .
5.12 Hanford Film Dosimeter Results
5.13 Total Dose Comparison for all Laboratories
5.14 Comparison of Hanford and SRP Dosimeters
. . .
5.15 Hanford Dosimeters Exposed at Savannah River Plant
5.16 Hanford Dosimeters Exposed at Rocky Flats Plant ••
5.17 Hanford Dosimeters Exposed At Los Alamos National Laboratory . . . . . . . . . . . . . . . . . . . . . . .
5.18 Hanford Intercomparison Study Results in 1967 ••••
5.19 Fast Neutron Dose Measurements
6.1 Terminology Used to Record Hanford Dosimeter Results
6.2 Methods of Determining Recorded Doses from Dosimeter Results ••••••••••••••••••••••
7.1 Hanford Dosimeter Holders Used in the 1989 Intercomparison Study •••••••••••
. . .
7.2 1989 lntercomparison Study Radiation Sources and Exposure Leve 1 s • • • • • • • • • • • • . . . . . . . . .
7.3 Intercomparison of Deep Dose Determination for Hanford Film and Thermoluminescent Dosimeters
7.4 Intercomparison of Shallow Dose Determination for Hanford Film Dosimeters •••.••.•••
7.5 Shallow and Deep Dose Performance Test Data ••
8.1 Dose Response of the Hanford Two-Element Film Dosimeter Used from 1944 to 1957 • . • ••• . . . . . . . .
xxxii
5.18
5.24
5.25
5.26
5.29
5.29
5.30
5.31
5.32
5.33
5.34
5.36
6.2
6.3
7.8
7.8
7.9
7 .10
7.12
8.11
f'I
~
8.2 Dose Response of the Hanford Multi-Element Film Dosimeter Used from 1957 to 1972 •••••••
8.3 Dose Response of the Hanford Multi~Element Thennoluminescent Dosimeter Used from 1972
. . . . . . .
to 1989 • • • • • • • • • • • • • • • • • . . . . . . . . . .
xxxiii
8.12
8.13
~ !! ) '
CHAPTER 1.0
INTRODUCTION

·,
! I ! t
~
I
I ; !
1.0 INTRODUCTION
External dose has been measured and recorded for Hanford personnel since the beginning of operations in 1944. The technology used to measure radiation dose has evolved throughout the nearly_S decades of Hanford operations. This report aims to describe dosimetry systems used to determine personnel dose and to evaluate the accuracy of the recorded dose for the different dosimeters and periods of use relative to a currently accepted national basis (i.e., deep dose). The evaluation is difficult because of the significant variation in beta, photon, and neutron radiation fields in the various Hanford facilities, as well as numerous technological and environmental aspects of the dosimeters used and the changing concepts in dose over the years.
1.1 REPORT PURPOSE AND CONTENTS
This report was prepared by Pacific Northwest Laboratory (PNL)(a) for the U.S. Department of Energy (DOE) to meet two primary objectives: 1) provide a historical overview of Hanford personnel dosimeter practices and, 2) evaluate the accuracy of recorded whole body doses in support of the Hanford Health and Mortality Study (Gilbert 1989).Cb) A current international effort to pool data from existing epidemiological studies is being undertaken to improve the assessment of risk from radiation exposure (IARC 1989). Documentation of past dosimetry practices as well as some assessment of accuracy are necessary to determine the consistency of dose estimates for these different studies. In this report, the recorded whole body dose is compared with the deep dose. The deep dose is used in current dosimeter performance studies (ANSI 1983: DOE 1987) and is defined as the dose at a depth of 1-cm (or 1000 mg/cm2) in tissue.
(a) Pacific Northwest Laboratory is operated by Battelle Memorial Institute for the U.S. Department of Energy under Contract DE-AC06-76RLO 1830.
(b) The Hanford Health and Mortality Study is an ongoing study of Hanford workers by PNL and the Hanford Environmental Health Foundation to determine if cause-specific mortality is associated with cumulative radiation dose, and to what extent direct data on a population exposed at low levels can confirm or reject risk estimates based on extrapolation from
~ high dose data.
1.1
Efforts have been underway for many years to better document Hanford dosimetry practices. An early sununary was prepared by Heid and Allen in 1974 in support of the Hanford Health and Mortality Study.Ca) Wilson provided an overview in 1987 of radiation monitoring, portable instrument, radiological calibration, and internal and external dosimetry practices at Hanford (Wilson 1987). An overview of portable radiological instrumentation at Hanford was provided in 1989 (Howell et al. 1989).
This report goes beyond these earlier reports in providing considerably more detailed infonnation on technical aspects of historical external dosimetry practices at Hanford. The remainder of this chapter provides a brief historical overview and a discussion of radiation protection philosophy. The evaluation of personnel dosimetry technology and associated practices and studies are described in the ensuing chapters of this report, which contain the following:
• the development of dosimetry technology at Hanford, including the specific dosimeters used since 1944 (~hapters 2.0 and 3.0)
• technical details of dosimeter calibration and dose detennination (Chapter 4.0)
• dosimeter quality control and intercomparison programs and quality assurance studies that have been conducted at Hanford (Chapter 5.0)
• the methods used to calculate the recorded skin and whole body doses (Chapter 6.0)
• the results of a laboratory intercomparison study conducted during 1989 of all Hanford film dosimeters as well as the perfonnance of the Hanford thennoluminescent dosimeters (TLDs) (Chapter 7.0)
• comparison of whole body dose with expected deep dose and the expected perfonnance of Hanford personnel dosimeters used in typical radiation fields (Chapter 8.0).
In addition, five appendixes provide supplemental infonnation. Appendixes A through C, respectively, contain the dose algorithm used for the beta/photon film dosimeters used from 1957 to 1962 and from 1962 to 1972 and for the TLD. Appendix D contains a description of the chronological history of major TLD
(a) Heid, K.R., and H.W. Allen. "Input Data to the AEC Health and Mortality Study, Radiation Exposure Experience of Employees 1944 Through 1974. 11
Internal report, dated December 31, 1974, Pacific Northwest Laboratory, Richland, Washington. ~
1.2
system changes at Hanford. Appendix E contains a list of letters on histori-1*"'\, cal radiation protection practices at Hanford. Chapter 8.0 integrates much of
the more detailed information provided in earlier chapters, and provides an overall assessment of Hanford dosimetry practices. This assessment addresses the specific performance of dosimeters by time period and by facility. Readers may wish to obtain an overview by reading Chapter 8.0 prior to reading the detailed information presented in Chapters 2.0 through 7.0.
Please note that although radiation protection instruments, facilities, etc., have gone by different names historically, the most current terms are used in this report, i.e., film dosimeter, not film badge: pencil dosimeter, not pocket ionization chamber, Hanford or Hanford Plant, not Hanford Engineer Works, etc. Also, note that throughout this report, the 11 File 11 in footnote references, such as "Memorandum to the File, 11 is a working file maintained by PNL's External Dosimetry group for their internal day-to-day use. Copies of such letters and memorandums to "the File, 11 as well as other letters and documents footnoted herein, are also on file for wider access in the Hanford Radiation Protection Historical Files, maintained by PNL's Dosimetry Records group.
1.2 HISTORICAL OVERVIEW
Early in 1942, a metallurgical laboratory was established at the University of Chicago to develop methods of plutonium production and separation. In that same period of time, a highly secret atomic bomb project was assigned to the U.S. Army, and the associated Corp. of Engineers District was named the Manhattan District. Thus the "Manhattan Project" was created, and General Leslie R. Groves, then a Colonel in the Corp. of Engineers, was assigned overall responsibility for the project.
On December 2, 1942, the first successful nuclear chain reaction was achieved by Enrico Fermi at the University of Chicago's Metallurgical Laboratory, thereby providing the impetus for an all-out effort for production of plutonium. Immediately following the successful sustained nuclear reaction, U.S. Army Colonel Franklin T. Matthias was assigned to lead a search for a plutonium production site, and in late December the U.S. Government signed a contract with the E. I. DuPont de Nemours Company (DuPont Company) for
1.3
engineering, design, construction, and operation of the production plant. By December 31, 1942, the Hanford, Washington area was selected for development ~ as a plutonium production site, which became known as the Hanford Engineer Works (HEW). Reactors for producing plutonium, chemical separations plants, fuels preparation plants, and a town for many thousands of people were built in a very short period of time. By September 1944, the first Hanford reactor began operation, and by February 1945 the first plutonium was delivered to Los Alamos, New Mexico, for use in the war effort.
In mid-1942, during the initial days of the Manhattan Project, Dr. Simeon T. Cantril, MD, a radiation therapist, was recruited from Swedish Hospital in Seattle, Washington, because of his work with radiation at the hospital's tumor institute. Later that year, Herbert M. Parker, a radiation physicist, was also recruited from Swedish Hospital because of his accomplishments in radiation physics. These recruitments marked the beginning of the development of large-scale radiation protection programs that evolved from the group of scientists assembled at the University of Chicago to work on developing the first sustained nuclear chain reaction and plutonium production. When the Medical Division was formed in August 1942 at the Metallurgical Laboratory in Chicago, radi~tion protection on the scale that would be developed had never ~ before been envisioned. Parker headed the radiation control work at the Meta-1 lurgical Laboratory and Oak Ridge National Laboratory (ORNL; previously called Clinton Laboratory) in 1943 and 1944. From the developments at these locations, he envisioned that a much larger and more multi-talented staff than originally anticipated would be needed to support the work to be done at Hanford.
Parker transferred to Hanford in July 1944 when reconanended by Dr. Robert S. Stone, Medical Director of the Manhattan Project, and Dr. Arthur H. Compton, Metallurgical Project Director, after they reviewed his outstanding work with the Manhattan Project. The position of Chief Supervisor was created for him in the Hanford Medical Department and he inunediately initiated the necessary recruitment to form a radiation protection organization. This group, initially named the Health Instruments (HI) Section, developed throughout the years as an integral part of the organization necessary to safely operate such a large and complex nuclear facility.
1.4
Since Hanford startup, the responsibility for various Hanford operations ~ has changed hands on several occasions and the radiation protection organ
ization has evolved accordingly. In September 1946, DuPont Company relinquished operation of Hanford to General Electric Company (GE). During GE's management of the site, the Radiological Sciences Department, including its Radiation Protection subgroup, was created and later became integrated with the Hanford Laboratory Operation when the latter was created in 1956. In 1963, a multi-contractor approach to operating Hanford was initiated. By the end of 1964, United States Testing Company, Inc., (UST) was contracted to conduct the routine processing of Hanford personnel dosimeters, biological samples, and environmental samples. The Radiation Protection Department became part of Battelle Memorial Institute's Pacific Northwest Laboratory (PNL) organization on January 4, 1965, upon Battelle's assumption of the overall responsibility for the operation of the Hanford laboratory functions. Reactor operation, chemical separations functions, and other smaller functions necessary for the operation of the Hanford Plant were subsequently assumed by other contractors within the next year. In 1987 reactor and chemical separations functions were reconsolidated under the direction of the Westinghouse
~ Hanford Company. In October 1988 PNL assumed responsibility for processing all personnel dosimeters.
1.3 RADIATION PROTECTION PHILOSOPHY
Radiation protection philosophy and capabilities have evolved at Hanford throughout the Manhattan Project In the beginning, radiological instrumentation and dosimetry were based on techniques developed for use in the medical application of radiation measurement that involved only a few highly specialized persons. These techniques were the basis for the development of new techniques required to support the operation of the various Hanford facilities that housed reactor, fuel fabrication, fuel separation, and waste disposal functions. This pioneering effort at Hanford involved many uncertainties, because the safe handling of large quantities of radioactive material and the involvement of large numbers of people being exposed to many types of radiation had not been encountered before.
Technology developments at Hanford paralleled the radiation protection developments started at the University of Chicago Metallurgical Laboratory and
1.5
ORNL which had been primarily under the direction of Dr. Simeon T. Cantril and Herbert M. Parker since mid-1942. These laboratories were involved in the ~ earliest development of nuclear weapons design and technology, while Hanford was primarily involved in the production of weapons-grade plutonium for use in weapons after the first successful nuclear chain reaction was achieved by Enrico Fermi at the Metallurgical Laboratory on December 2, 1942. The tech-nology used to develop personnel dosimeters evolved with the increasing know-ledge of radiation, radiological instrumentation, and radiation dosimetry, particularly with respect to radiation fields in Hanford facilities. Dosim-eters and processing equipment to measure personnel exposure to radiation, as well as calibration techniques and radiation dose assessment methods, had to be developed. In compliance with applicable scientific and/or regulatory guidance, measurement results from these dosimeters were recorded to provide the official radiation dose record for Hanford employees.
From the very beginning the underlying philosophy instilled by early leaders, such as Parker and Cantril, was conservatism in the measurement and reporting of radiation exposure for workers. A policy of maintaining the workers' radiation exposure as low as practicable was quickly adopted for Hanford operations by Parker.(a) There was also a strong desire from the onset to establish a pennanent and official record of each employee's radiation exposure history, which included those occasions where exposure may not have been properly recorded by the person's radiation dosimeter. A policy for radiation safety was established and stated in a Hanford memorandum issued in 1945.(b) Safety policies have been revised and upgraded continuously to reflect the g~owth in knowledge from experience and technical development and to be responsive to changes in regulations and directives from government agencies.
In 1954 the first 10 years of Hanford operations were assessed in an article that contained a discussion of several of the concerns about adapting techniques used in the medical community to anticipated problems at Hanford
(a) Parker, H. M. 1945. "Health Instruments Section-Exposure Standards, Reports, and Records. 11 Memorandum to the File, dated September 7, 1945, DuPont Company, Richland, Washington.
(b) Cantril, S. T. 1945. "Plant Medical Section Activities to August 1, 1945." Memorandum to the File, dated August 25, 1945, DuPont Company, Richland, Washington. f~
1.6
(Parker 1954). More recently, a comprehens;ve h;story of rad;at;on protect;on ~ pract;ces used at Hanford was comp;led (Wilson 1987). As of the last few
years, data accumulated from personnel dosimeters are being used in epidemiological assessments to evaluate potential health effects from occupational radiation exposure at Hanford. With the additional radiation exposure data and evaluation of doses provided by this report, a more refined assessment of health effects can be made for Hanford radiation workers.
1.7

CHAPTER 2.0
HANFORD PERSONNEL BETA/PHOTON DOSIMETERS
~ ( .. , .. ' ,
.. ·, ..... ' .. ~ . .,. . ·~· ~:.· ·:: ...
I ; 1· ; i f' !
i
fl 1
2.0 HANFORD PERSONNEL BETA/PHOTON DOSIMETERS
Three primary personnel dosimeter techniques have been used at Hanford to measure beta, photon, and neutron radiation; these include the use of photographic emulsions on film, thermoluminescent materials in various configurations and types of dosimeters, and pencil dosimeters. The use of photographic emulsions to record radiation exposure began with the earliest history of radiation in the late 1800s. The sensitive material, or the emulsion, consists of small silver halide crystals in gelatin. The emulsion is used in the form of thin layers spread on film (cellulose acetate) or glass. The thickness of the emulsion varies from a few to several hundred microns, with the most common emulsions being between about 10 pm and 25 pm thick. The primary purpose of ~he gelatin is to permanently fix the silver halide crystals on the film (or glass), while also permitting the developing chemicals to come in contact with the crystals in order to develop an image. In the presence of radiation, electrons traversing the emulsion become trapped in the crystal lattice, thereby reducing the silver ions to atomic silver. These silver atoms, in turn, result in deeper traps that capture electrons, result-
~ ing in more silver atoms, and eventually forming microscopic aggregates of silver atoms, which constitute the latent image. When the film is developed, the latent images are reduced to metallic silver, which appears to the eye as the darkening of film or microscopic tracks in nuclear emulsions.
Thermoluminescent materials have been used widely in radiation detection since the 1960s. These materials characteristically store energy in the form of trapped electrons and luminesce when heated. The intensity of the luminescence is proportional to the energy absorbed from radiation. Many thermoluminescent materials are used. Since 1972, crystals of lithium fluoride (Lif) have been used in Hanford personnel dosimeters worn to record the radiation exposure of'Hanford workers from beta, photon (i.e., gama and x-ray radiation), and neutron radiations. These crystals have several desirable characteristics. The atomic number of Lif (8.14) is close to that of human tissue (7.4), so that the absorbed energy for photon radiation for LiF and human tissue is also similar. The crystals are available in a form that contains 99.999% pure 7Li. In this form a crystal is responsive to beta and photon radiation, but has essentially no neutron response. However, another
2.1
crystal fonn contains 95% pure 6Li, which is not only responsive to beta and photon radiation but also has a very high response to slow neutrons. Thus, by combining both forms of crystals in the design of a personnel dosimeter, the neutron radiation component can also be detennined. Typically, the response is based on the reflected (i.e., 11 albedo 11
) neutrons from the body. Dosimeters of this type are referred to as "albedo neutron dosimeters. 11 (Hanford personnel neutron dosimeters are discussed in Chapter 3.0.)
A third type of dosimeter, adapted from medical and specialized research use prior to the Manhattan Project, is the condenser ionization chamber, conunonly called the pencil dosimeter. These devices, which can easily be carried in the pocket or clipped to clothing, are designed to measure x~ray and ganuna radiation. When using pencil dosimeters, auxiliary equipment is
required to supply an initial voltage (or charge) and an electrometer is necessary to measure the residual voltage after the dosimeter has been exposed to radiation. The reduction in voltage is proportional to the radiation exposure. These devices have been improved and modified to provide the ability to directly read the radiation exposure from a scale located in one end of the dosimeter and to better withstand jolting, which tends to discharge the chamber and give a false exposure reading. Pencil dosimeters, however, have been used throughout Hanford operations to provide personnel with an immediate method of monitoring radiation exposure in their work environment. Because of limitations with pencil dosimeters, the official radiation dose of record for personnel has always been detennined with film dosimeters and TLDs.
From 1944 to 1972, film in three distinct types of dosimeters was used to record the beta and photon radiation exposure of Hanford radiation workers. Each of these dosimeters, their periods of use, type of film, filtration specifications, evaluation methods, etc., are described in the following subsections.
2.1 EARLY USE OF PERSONNEL DOSIMETERS AT HANFORD
During the initial period of construction of the Hanford reactors and chemical separations plants, attempts were made to establish a system for monitoring personnel exposure to radiation. To this end, the first pencil dosimeter program was started in January 1944 in the 100 Areas (reactor operations) by the 11 P11 Department, and subsequently in the 300 Area ( fue 1 s r--,
2.2
preparation and laboratory functions). In July 1944, after the Health Instruments Section was formed as part of DuPont's Medical Department, responsibility for the 300 Area pencil dosimeter program was transferred to the Health Instruments Section. Soon the Health Instruments Section was also made responsible for plant-wide fi lm dosimeter and pencil dosimeter programs that were to be activated as soon as equipment and personnel became available to admini ster these operat ions .
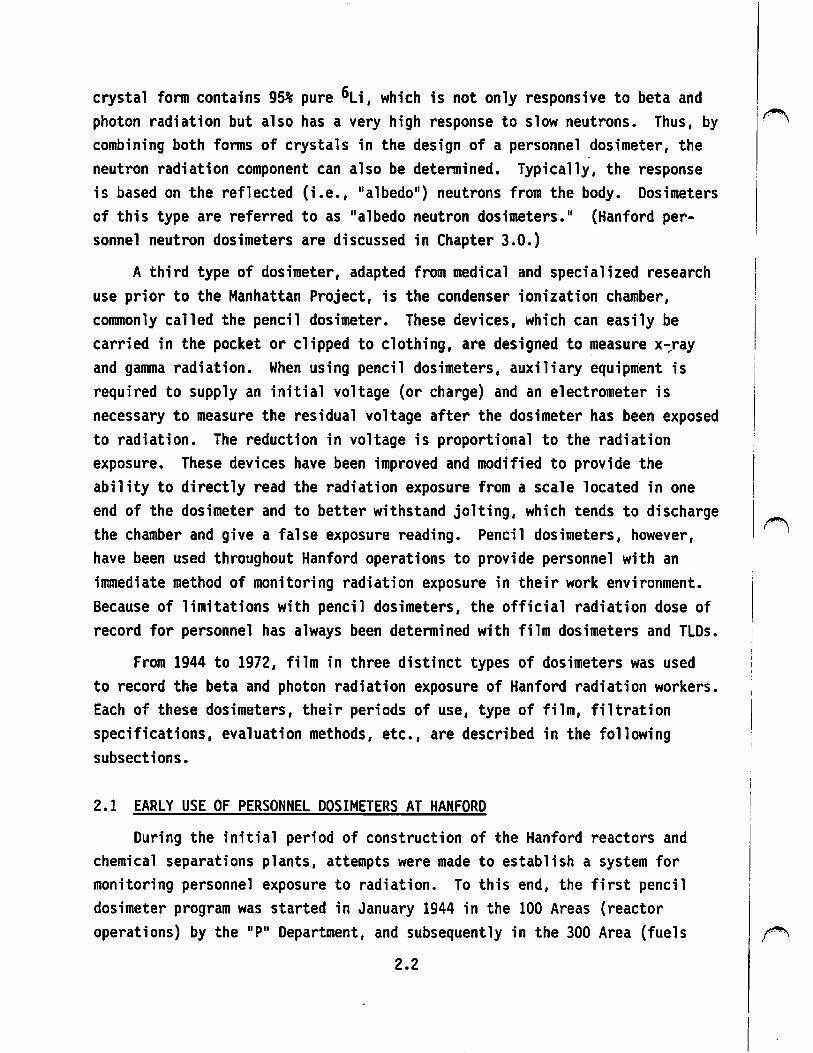
There are some indications that f ilm was used in the latter part of July 1944, but it probably was used only on a trial basis with dosimeters from the Metallurgical Laboratory or Clinton Laboratory. The first film dosimeters used at Hanford to record radiation exposure were processed in October 1944. During this early period, film reportedly was spread out on a white tab le top and only the film with visible darkening was read on a densitometer (see Figure 2.1).
FIGURE 2.1. Reading Film from Film Dosimeters
2.3
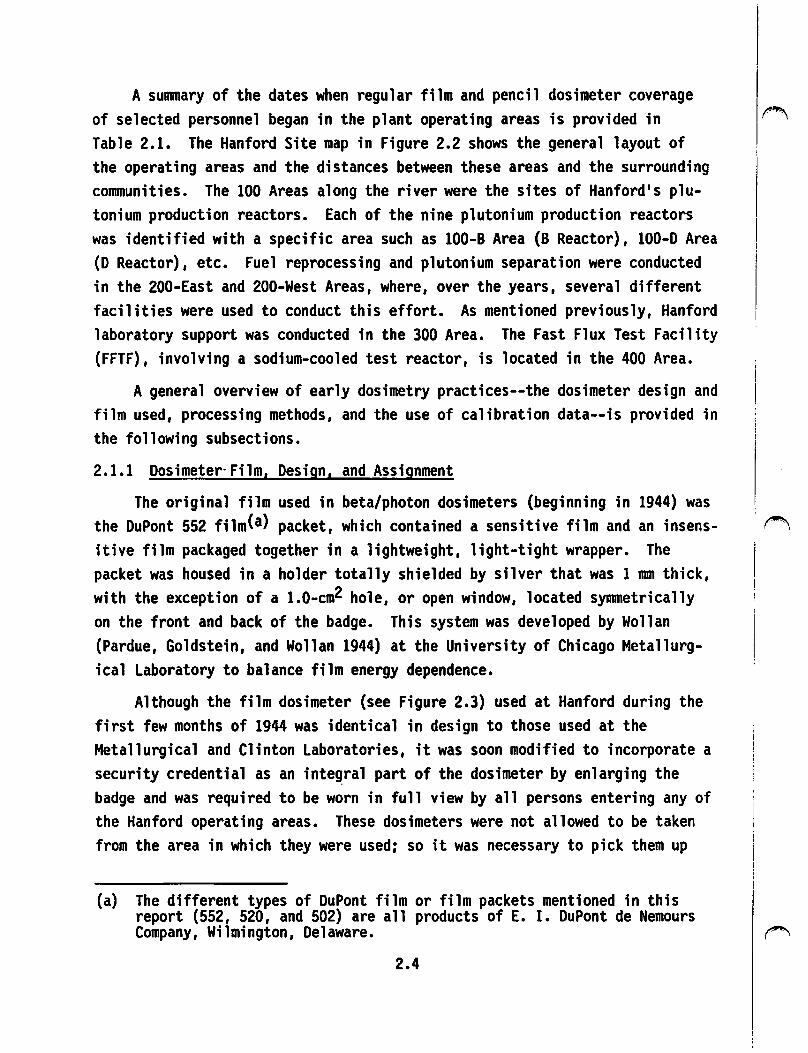
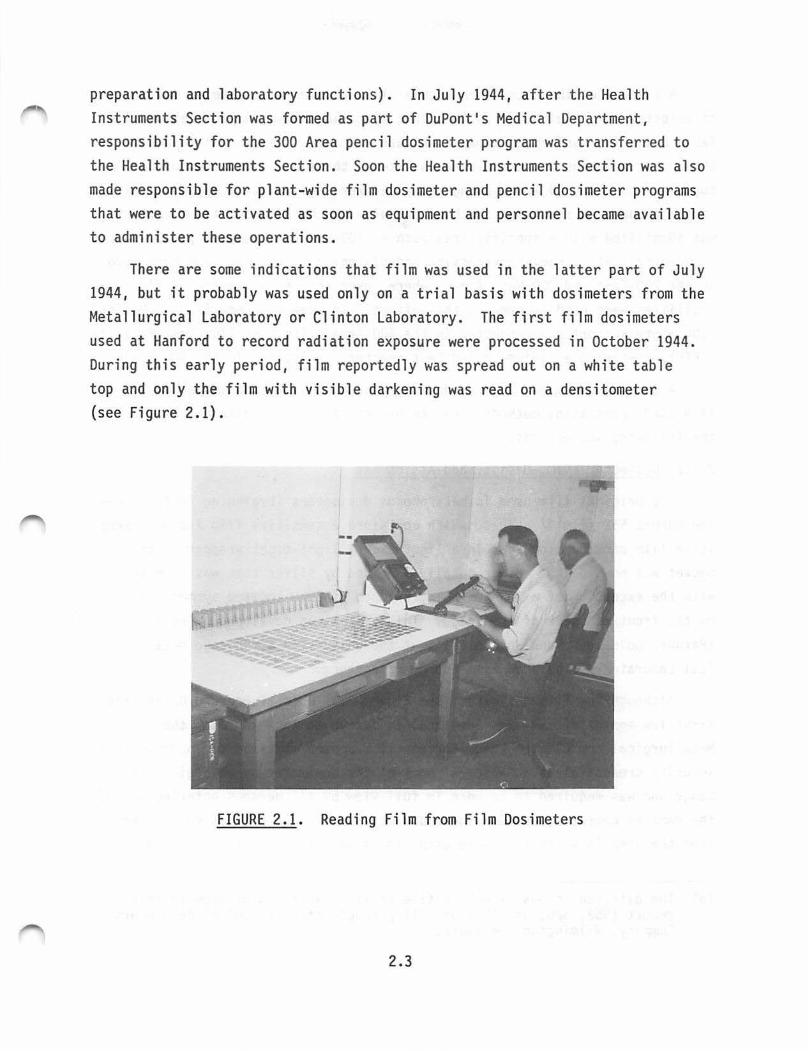
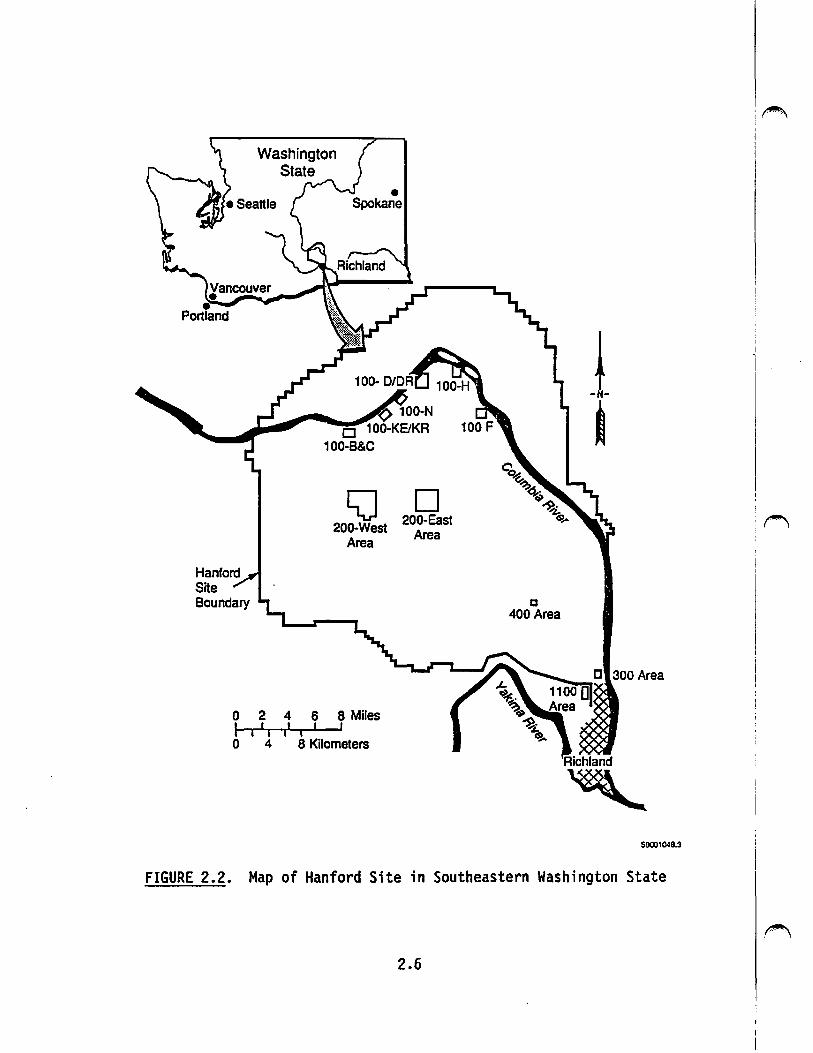
A sumnary of the dates when regular film and pencil dosimeter coverage of selected personnel began in the plant operating areas is provided in Table 2.1. The Hanford Site map in Figure 2.2 shows the general layout of the operating areas and the distances between these areas and the surrounding communities. The 100 Areas along the river were the sites of Hanford's plutonium production reactors. Each of the nine plutonium production reactors was identified with a specific area such as 100-B Area (B Reactor), 100-D Area (D Reactor), etc. Fuel reprocessing and plutonium separation were conducted in the 200-East and 200-West Areas, where, over the years, several different facilities were used to conduct this effort. As mentioned previously, Hanford laboratory support was conducted in the 300 Area. The Fast Flux Test Facility (FFTF), involving a sodium-cooled test reactor, is located in the 400 Area.
A general overview of early dosimetry practices--the dosimeter design and film used, processing methods, and the use of calibration data--is provided in the following subsections.
2.1.1 Dosimeter-Film, Design, and Assignment
The original film used in beta/photon dosimeters (beginning in 1944) was the DuPont 552 film(a) packet, which contained a sensitive film and an insens- , ~ itive film packaged together in a lightweight, light-tight wrapper. The packet was housed in a holder totally shielded by silver that was 1 nun thick, with the exception of a 1.0-cm2 hole, or open window, located symmetrically on the front and back of the badge. This system was developed by Wollan (Pardue, Goldstein, and Wollan 1944) at the University of Chicago Metallurg-ical Laboratory to balance film energy dependence.
Although the film dosimeter (see Figure 2.3) used at Hanford during the first few months of 1944 was identical in design to those used at the Metallurgical and Clinton Laboratories, it was soon modified to incorporate a security credential as an inte~ral part of the dosimeter by enlarging the badge and was required to be worn in full view by all persons entering any of the Hanford operating areas. These dosimeters were not allowed to be taken from the area in which they were used; so it was necessary to pick them up
(a) The different types of DuPont film or film packets mentioned in this report (552, 520, and 502) are all products of E. I. DuPont de Nemours Company, Wilmington, Delaware. ~
2.4

TABLE 2.1. Regular Pencil and Film Dosimeter Use at Hanford r-., by Operating Area
Area Dosimeter Type Date Comments
100-B Pencil September 11, 1944 B Reactor went critical Film September 13, 1944 on September 15, 1944
200-West Pencil November 7, 1944 T-Section of 200-West Film November 7, 1944 Area was accepted for
use on October 9, 1944; the first tracer run of Clinton 11 slugs 11 started on December 6, 1944; 200-West Area was accepted for use on December 18, 1944
300 Area Penci 1 November 25, 1944 The 305 Test Pile Film November 25, 1944 went critical on
February 23, 1944; production line canning of "slugs" started on May 11, 1944
100-D Pencil December 5, 1944 D Reactor went critical Film December 5, 1944 on December 6, 1944
("., 100-F Pencil February 13, 1945 F Reactor went critical
Film February 13, 1945 on February 15, 1945
200-East Pencil March 15, 1945 200-East Area was Film March 15, 1945 accepted for use·on
February 2, 1945
2.5
Hanford Site Boundary
0 2 I I I I 0 4
100-N 0 100-KE/KR
100-B&C
~ 200-West
Area
D 200-East
Area
4 6 8 Miles 1' I I I
8 Kilometers
D 400 Area
Richland
" 59001048.3
FIGURE 2.2. Map of Hanford Site in Southeastern Washington State
2.6
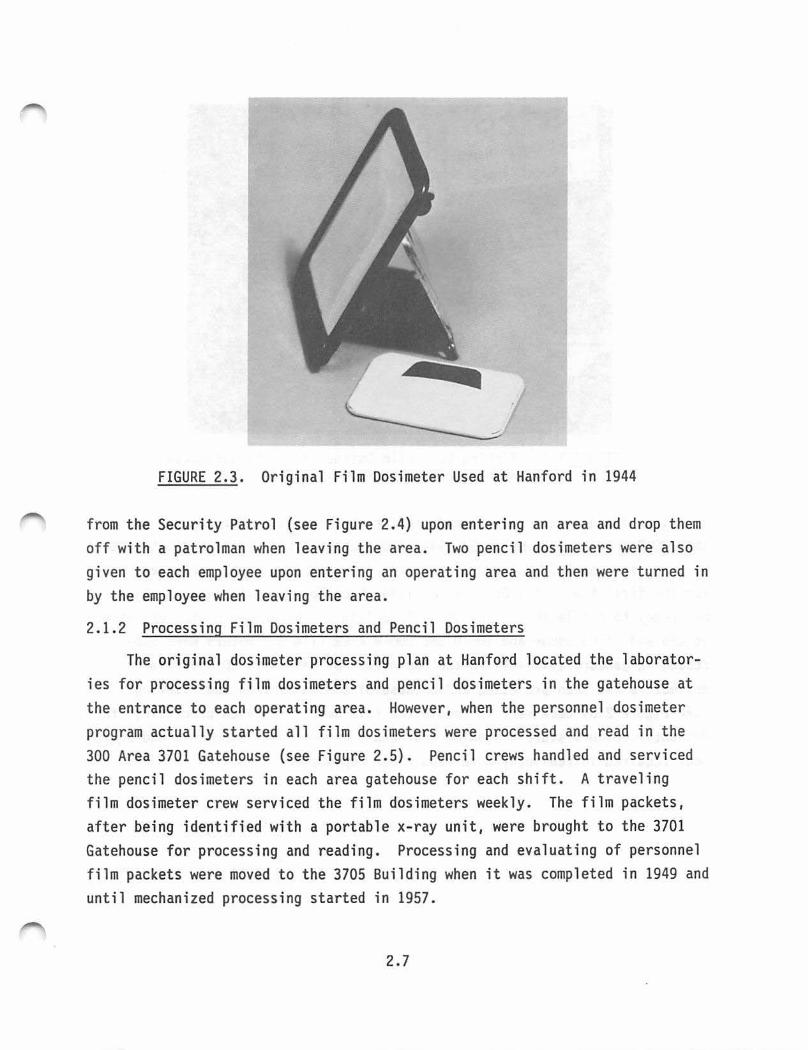
FIGURE 2.3 . Original Film Dosimeter Used at Hanford in 1944
from the Security Patrol (see Figure 2.4) upon entering an area and drop them off with a patrolman when leaving the area. Two pencil dosimeters were also given to each employee upon entering an operating area and then were turned in by the employee when leaving the area .
2.1.2 Processing Film Dosimeters and Pencil Dosimeters
The original dosimeter processing plan at Hanford located t he laboratories for processing film dosimeters and pencil dosimeters in the gatehouse at the entrance to each operating area. However , when the personnel dosimeter program actually started al l film dosimeters were processed and read in the 300 Area 3701 Gatehouse (see Figure 2.5). Pencil crews handled and serviced the penci l dosimeters in each area gatehouse for each shift. A traveling film dosimeter crew serviced the film dosimeters weekly. The film packets, after being identified wi th a portable x-ray unit, were brought to the 3701 Gatehouse for processing and reading. Processing and evaluat i ng of personnel film packets were moved to the 3705 Building when it was completed in 1949 and until mechanized processing started in 1957 .
2.7
Sf op Area Badaes ~ p . ., enc1ls
Issued Here
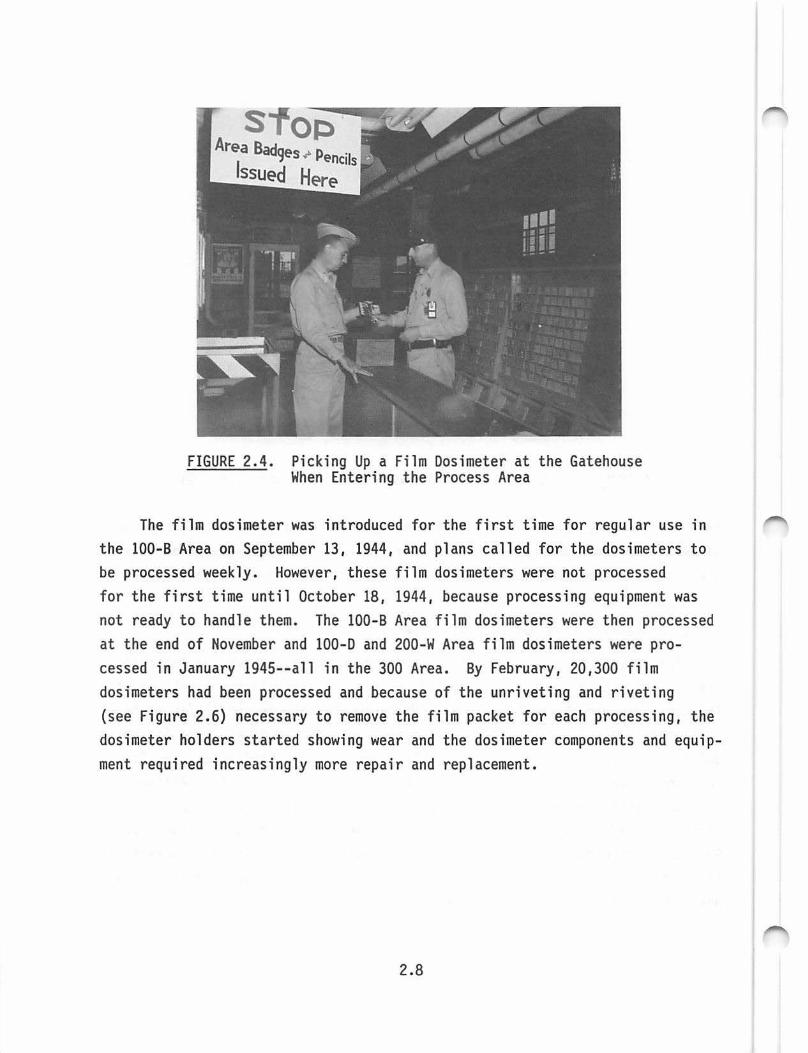
FIGURE 2.4. Picking Up a Film Dosimeter at the Gatehouse When Entering the Process Area
The film dosimeter was introduced for the first time for regular use in the 100-B Area on September 13 , 1944, and plans called for the dosimeters to be processed weekly. However, these film dosimeters were not processed for the first t ime until October 18, 1944, because process ing equipment was not ready to handle them. The 100-B Area film dosimeters were then processed at the end of November and 100-D and 200-W Area film dos imeters were processed in January 1945--all in the 300 Area. By February, 20,300 film dosimeters had been processed and because of the unriveting and riveting (see Figure 2.6) necessary to remove the film packet for each processing, the dosimeter holders started showing wear and the dosimeter components and equipment requi red increasingly more repair and replacement.
2.8

~ .
FIGURE 2.5. The 300 Area Showing the 3701 Gatehouse, 3745 Calibrations Building, and the 3746 Health Instruments Headquarters Bui lding (February 14, 1945)

FIGURE 2.6. Riveting and Unriveting Film Dosimeters to Recover the Film Packets for Processing
2.10
2.1.3 Film Dosimeter Calibration
No evidence of calibration prior to 1945 has been found and it appears that values of exposure were assigned according to film density, i.e., .03, .05, and .06 represented 30 mR, 50 mR, and 60 mR. The first recorded calibration data used for reading personnel film apparently came in March 1945 {Wilson 1957). At that time, radium ganvna data for a 10-day period were averaged and a curve for the shielded and open window portions was estab-1 i shed. A radiation dose was assigned for both open window and shielded areas by reading directly from the calibration curve. This system was used through 1945 until a beta curve was established for the open window portion by exposing it to a slab of uranium. All open window density was considered beta exposure during the first 2 years of operation.
2.2 BETA/PHOTON FILM DOSIMETER USED FROM 1944 TO 1957
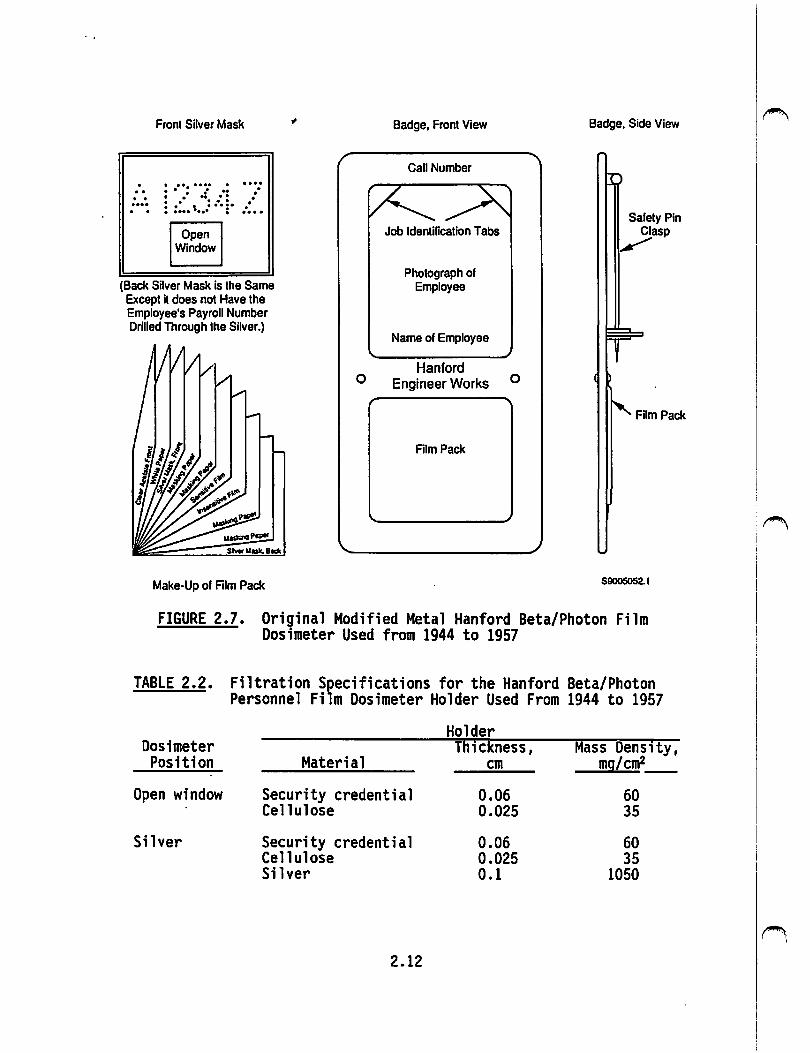
The film dosimeter used at Hanford from July 1944 through March 1957 consisted of a case fabricated from a machine-stamped metal plate and fitted with two silver filters, each 1 nvn thick. A film packet was placed between the two filters. DuPont 552 film packets were used in the dosimeter throughout this time period. This packet was composed of a sensitive 502 film and an insensitive 510 film. The open window consisted of a 1-cm2 hole synvnetrically located in the two silver filters. The Hanford security credential was located on the front of the dosimeter along with a sheet of celluloid, which together measured about 95 mg/cm2 and were an integral part of the dosim~ter during this period of use. There was no additional material over the rear filter. The filtration specifications for this dosimeter holder are summarized in Table 2.2 and the dosimeter is illustrated in Figure 2.7.
All of the density of the film in the open window position was conservatively considered beta exposure during the first 2 years of operation. In the succeeding years the open window density was corrected for the contribution of penetrating exposure density from behind the shielded portion of the film dosimeter. A photograph of a densitometer used to read the film density during the early years of operation is shown in Figure 2.8.
2.11
Fronl Silver Mask
. . .. .. .. . ... . . . : .. : .;· .·: .. . . . . . . . . . : : ... \ ...... :· .....
Open Window
(Back Silver Mask is lhe Same Excepl h does nol Have lhe Employee's Payroll Number Drilled Through lhe Silver.)
Make-Up of Film Pack
0
Badge, Front View
Call Number
Job Identification Tabs
Photograph of Employee
Name of Employee
Hanford Engineer Works
Film Pack
0
Badge, Side View
Safety Pin Clasp ~
$9005052.1
FIGURE 2.7. Original Modified Metal Hanford Beta/Photon Film Dosimeter Used from 1944 to 1957
TABLE 2.2. Filtration Specifications for the Hanford Beta/Photon Personnel Film Dosimeter Holder Used From 1944 to 1957
Holder Dosimeter Thickness, Mass Density, Position Material cm mg/cm2 __
Open window Security credential 0.06 60 Cellulose 0.025 35
Silver Security credential 0.06 60 Cellulose 0.025 35 Silver 0 .1 1050
2.12
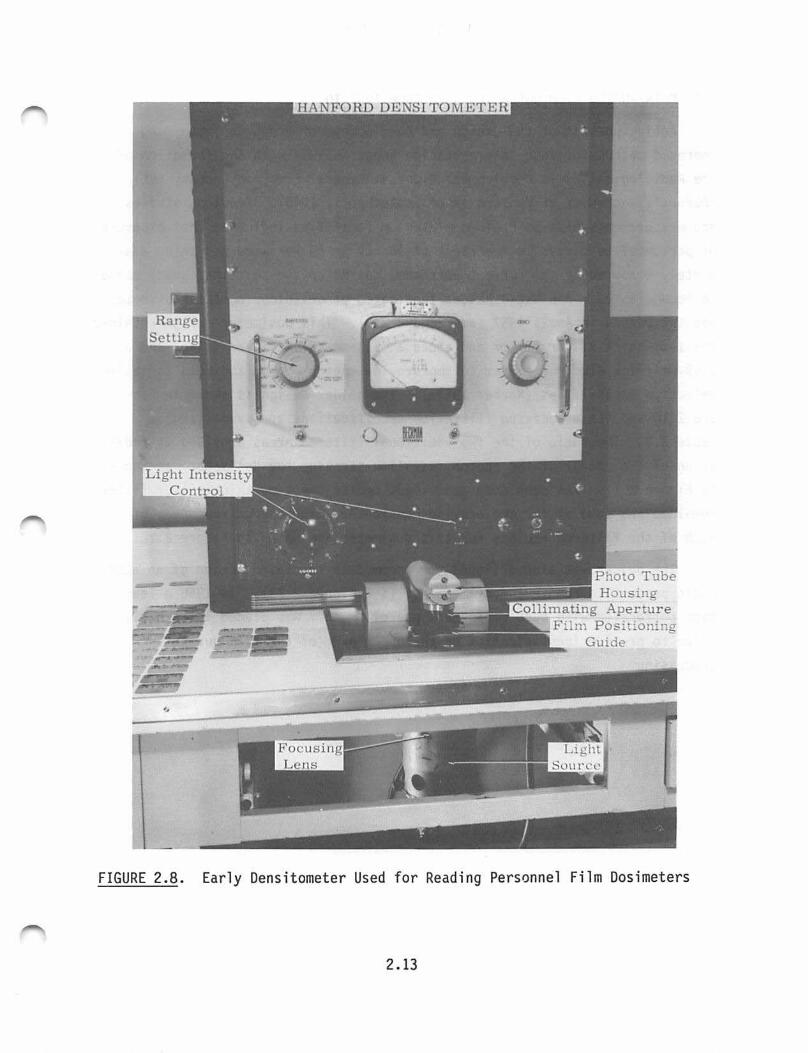
FIGURE 2.8. Early Densitometer Used for Reading Personnel Film Dosimeters
2.13
2.3 BETA/PHOTON FILM DOSIMETER USED FROM 1957 TO 1962
Active pursuit of the design and development of a new dosimeter and improved methods of dose interpretation began in 1954 with the formation of the Radiological Field Development Group at General Electric Company (GE) (DuPont's successor at Hanford as of September 1, 1946). Previous studies and measurements made in Hanford plutonium facilities indicated that exposure of personnel to x-rays in the range of 16 keV to 59 keV were not being adequately measured by the current personnel dosimeter and this inadequacy needed to be addressed. A plastic holder fabricated of cellulose acetate butyrate, was introduced in April 1957 (see Figure 2.9). This dosimeter design retained the 1-mm-thick silver filter and added a 0.13-mm-thick silver filter and a 0.49-mm-thick aluminum filter to improve low-energy photon and beta radiation detection capabilities (Kocher 1957a). The holder design is shown in Fig-ure 2.10 and its associated filtration specifications are summarized in Table 2.3. The ratio of the two additional filtered areas provided an indication of the energy of the photon radiation striking the dosimeter, as shown in Figure 2.11. The deep dose assessment behind the 1-mm-thick silver filter remained the same as for the previous dosimeter. The energy responses of each of the filtered regions for this dosimeter are shown in Figure 2.12.
The holder was also designed to accommodate the introduction of an automatic process to remove the film packet (see Figure 2.13). In 1956 a lead tape perforated with each employee's payroll number was placed in each film badge to provide identification on the upper part of the film during processing.
2.14
:~ ! r ;'
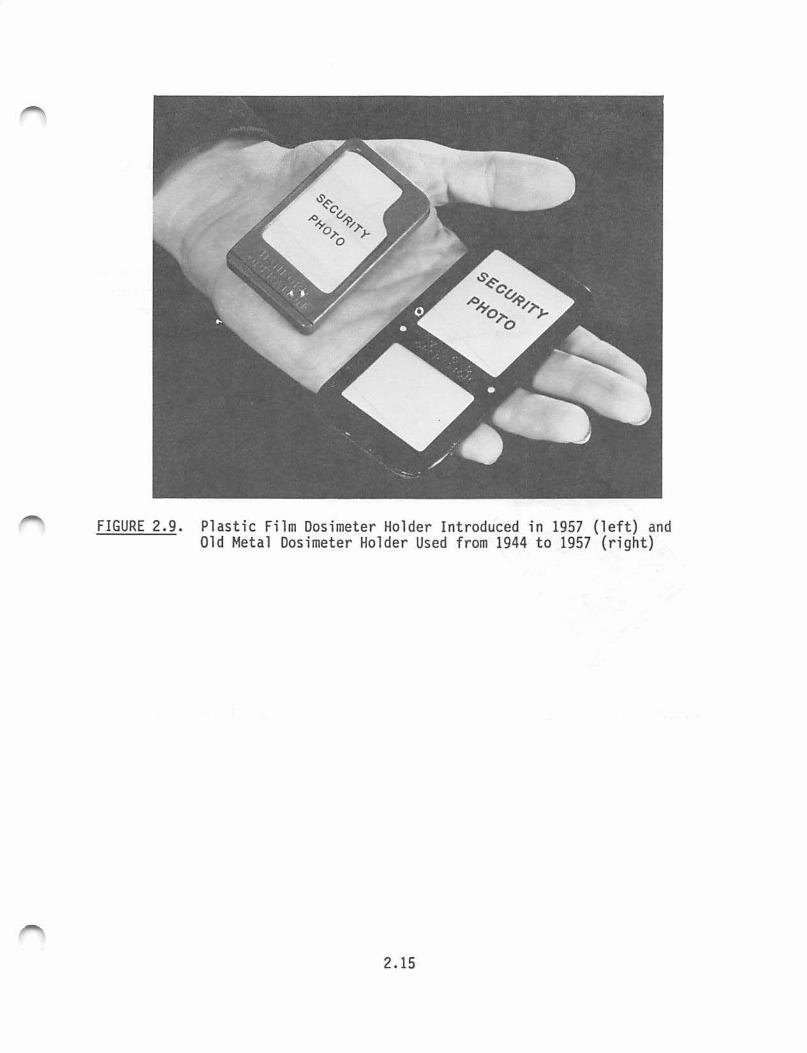
FIGURE 2.9. Plastic Film Dosimeter Holder Introduced in 1957 (left) and Old Metal Dosimeter Holder Used from 1944 to 1957 (right)
2.15
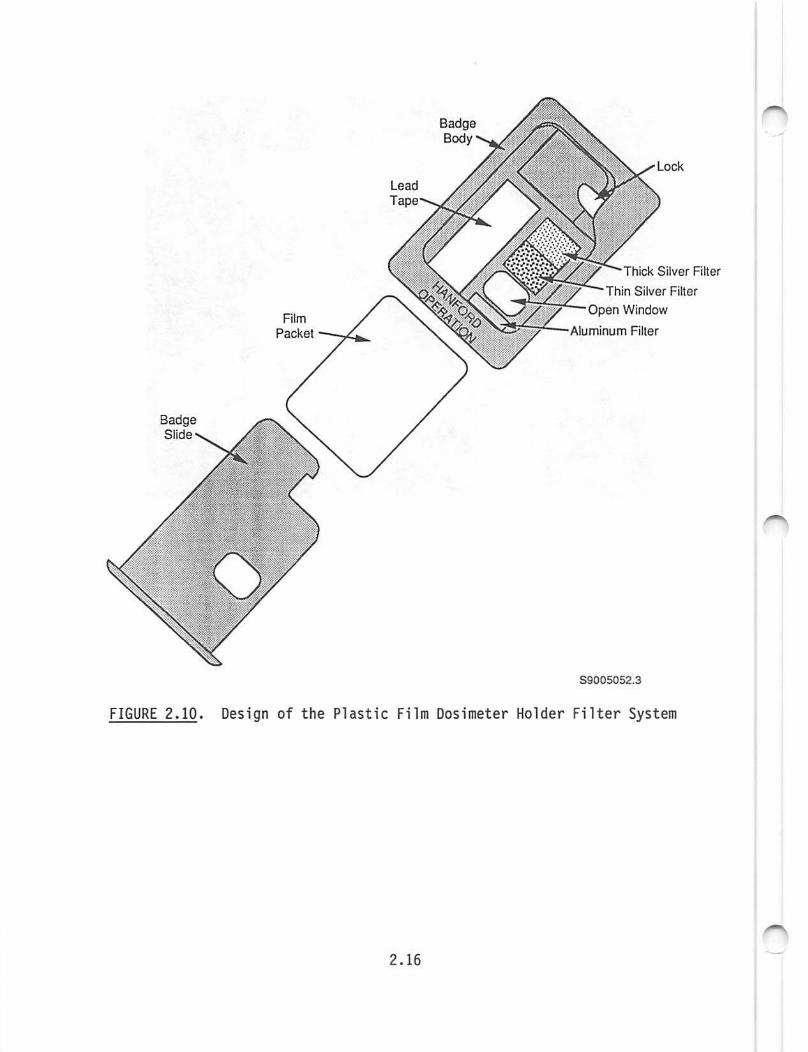
Thick Silver Filter
S9005052.3
FIGURE 2.10. Design of the Plastic Film Dosimeter Holder Filter System
2.16
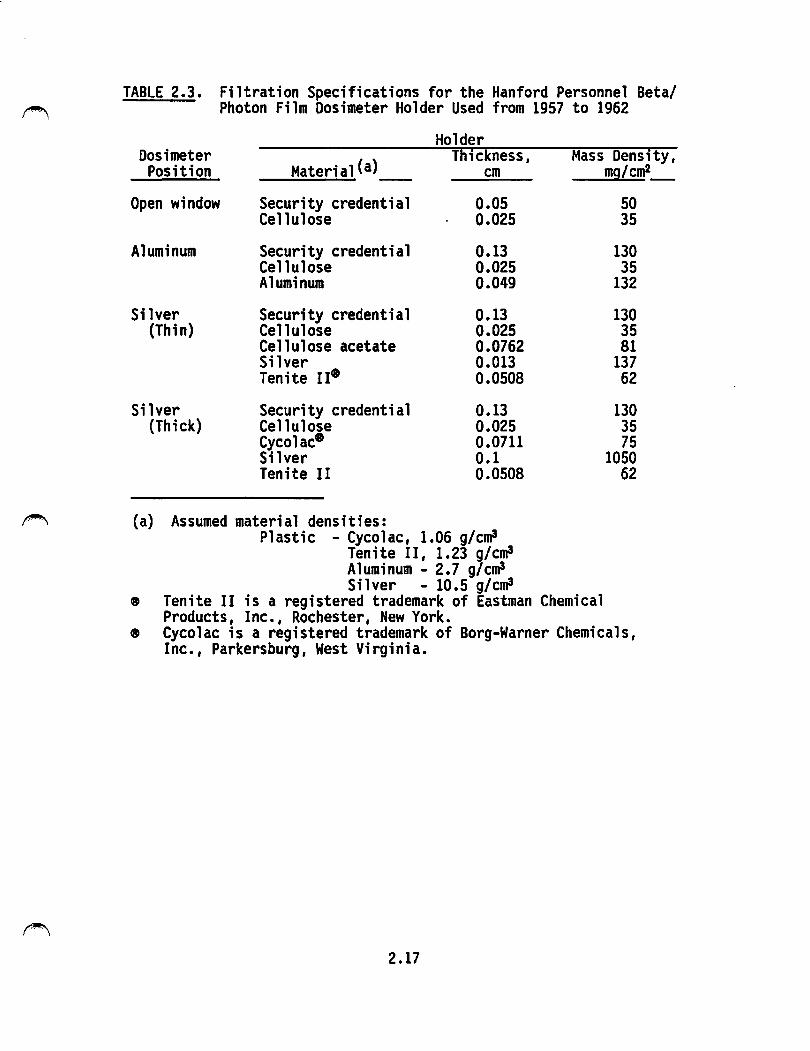
TABLE 2.3. Filtration Specifications for the Hanford Personnel Beta/ Photon Film Dosimeter Holder Used from 1957 to 1962
Holder Dosimeter
Materia1(a) Thickness, Mass Denshy,
Position cm -Open window Security credential 0.05
Cellulose 0.025
Aluminum Security credential 0.13 Cellulose 0.025 Aluminum 0.049
Silver Security credential 0.13 (Thin) Cellulose 0.025
Cellulose acetate 0.0762 Silver 0.013 Tenite II9 0.0508
Silver Security credential 0.13 (Thick) Cellulose 0.025
Cycolac• 0.0711 Silver 0.1 Tenite II 0.0508
~ (a) Assumed material densities: Plastic - Cycolac, 1.06 g/crri6
Tenite II, 1.23 g/crri6 Aluminum - 2.7 g/crri6 Silver - 10.5 g/crri6
e Tenite II is a registered trademark of Eastman Chemical Products, Inc., Rochester, New York.
mg/cm2_
50 35
130 35
132
130 35 81
137 62
130 35 75
1050 62
e Cycolac is a registered trademark of Borg-Warner Chemicals, Inc., Parkersburg, West Virginia.
2.17
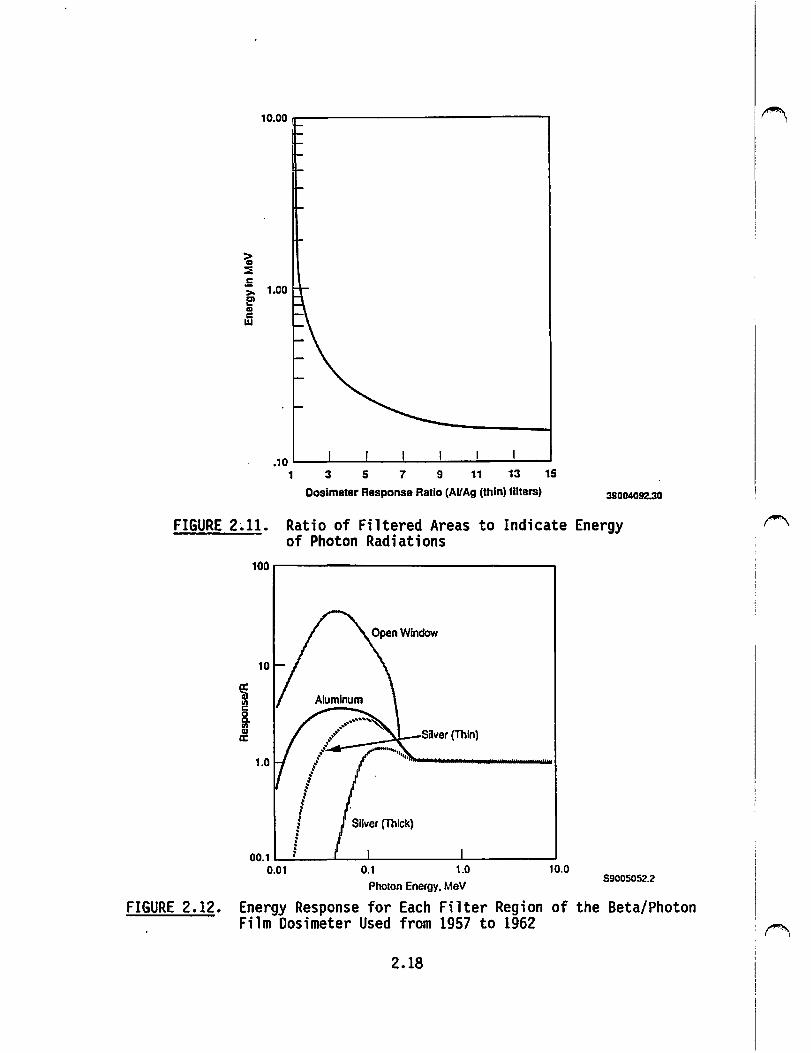
~ ::E .5 > 1.00 ~
~
.10 i.___i.___.i....__.,.:___...,:.__...:...._ ........ _ ....
1 3 5 7 9 11 13 15
Dosimeter Response Ratio (AUAg (thin) filters) 35004092.30
FIGURE 2~11. Ratio of Filtered Areas to Indicate Energy of Photon Radiations
10
~ :!! 8. Ill Q) Silver (Thin) a:
1.0
Silver (Thick)
00.1 .__,;___........__........_ ____ __._ ____ _..
0.01 0.1 1.0 10.0
Pholon Energy, MeV 59005052.2
FIGURE 2.12. Energy Response for Each Filter Region of the Beta/Photon Film Dosimeter Used from 1957 to 1962
2.18
i~ i
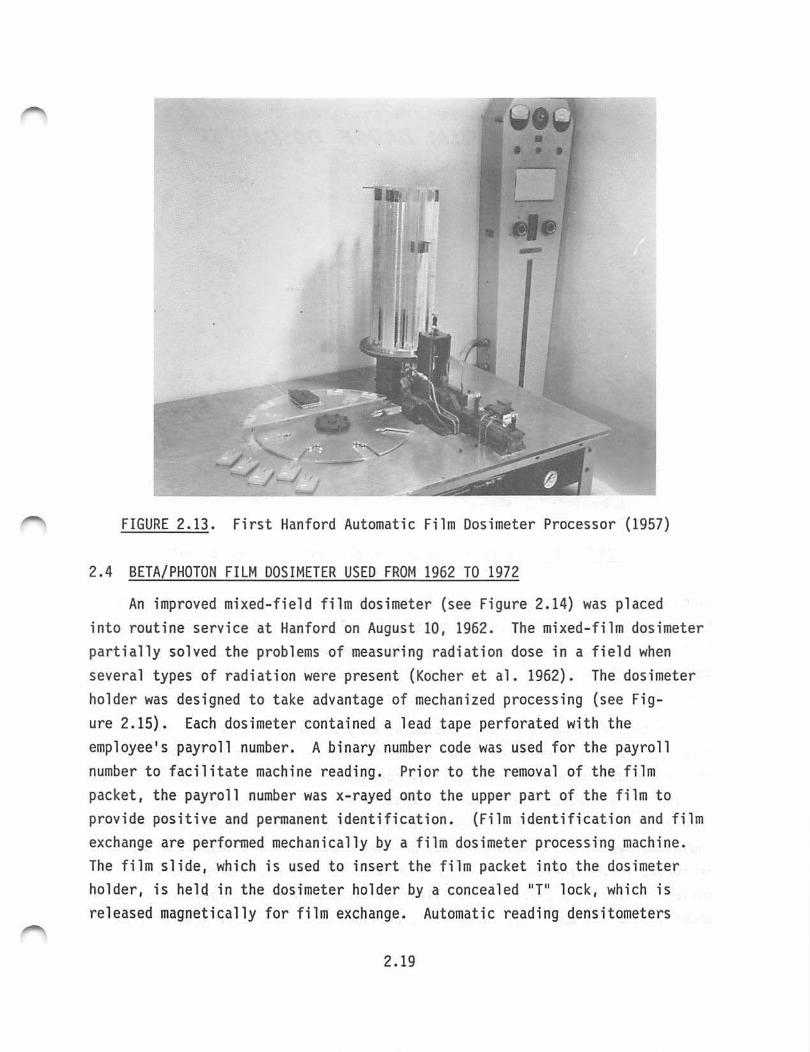
FIGURE 2.13. First Hanford Automatic Film Dosimeter Processor (1957)
2.4 BETA/PHOTON FILM DOSIMETER USED FROM 1962 TO 1972
An improved mixed-field film dosimeter (see Figure 2.14) was placed into rout ine service at Hanford on August 10, 1962 . The mixed-film dosimeter partially solved the prob lems of measuring radiation dose in a field when several types of radiation were present (Kocher et al. 1962). The dosimeter holder was designed to take advantage of mechanized processing (see Fig-ure 2.15). Each dosimeter contained a lead tape perforated with the employee's payroll number. A binary number code was used for the payroll number to facilitate machine reading. Prior to the removal of the film packet, the payroll number was x-rayed onto the upper part of the film to provide positive and permanent identification. (Film identification and film exchange are performed mechanically by a film dosimeter processing machine. The film slide, which is used to insert the film packet into the dosimeter holder , is held in the dosimeter holder by a concealed 11 T11 lock, which is released magnetically for film exchange. Automatic reading densitometers
2.19
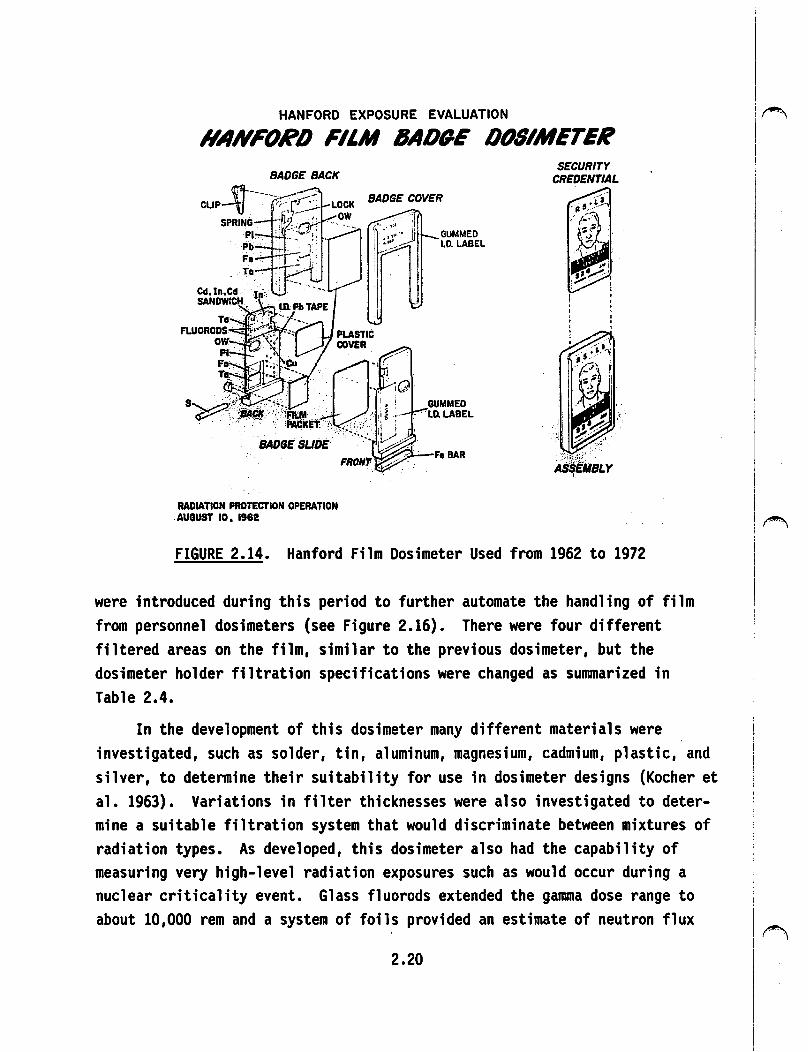
HANFORD EXPOSURE EVALUATION
HANFORD Fll.M 6ADfJ.E DfJSIMETE~
BADGE BACK
Ta. i --.
Cd, Jn,Cd > In:, ,, 1 •
SANDWICH. · , . ID.Pb TAPE
RADIATION PROTECTION OPERATION .AUGUST 10, 1962
BADGE COVER
SECURITY CREDENTIAL
FIGURE 2.14. Hanford Film Dosimeter Used from 1962 to 1972
were introduced during this period to further automate the handling of film from personnel dosimeters (see Figure 2.16). There were four different filtered areas on the film, similar to the previous dosimeter, but the dosimeter holder filtration specifications were changed as sunanarized in Table 2.4.
In the development of this dosimeter many different materials were investigated, such as solder, tin, aluminum, magnesium, cadmium, plastic, and silver, to determine their suitability for use in dosimeter designs (Kocher et al. 1963). Variations in filter thicknesses were also investigated to determine a suitable filtration system that would discriminate between mixtures of radiation types. As developed, this dosimeter also had the capability of measuring very high-level radiation exposures such as would occur during a nuclear criticality event. Glass fluorods extended the ganana dose range to about 10,000 rem and a system of foils provided an estimate of neutron flux
2.20
I (""!'\ I
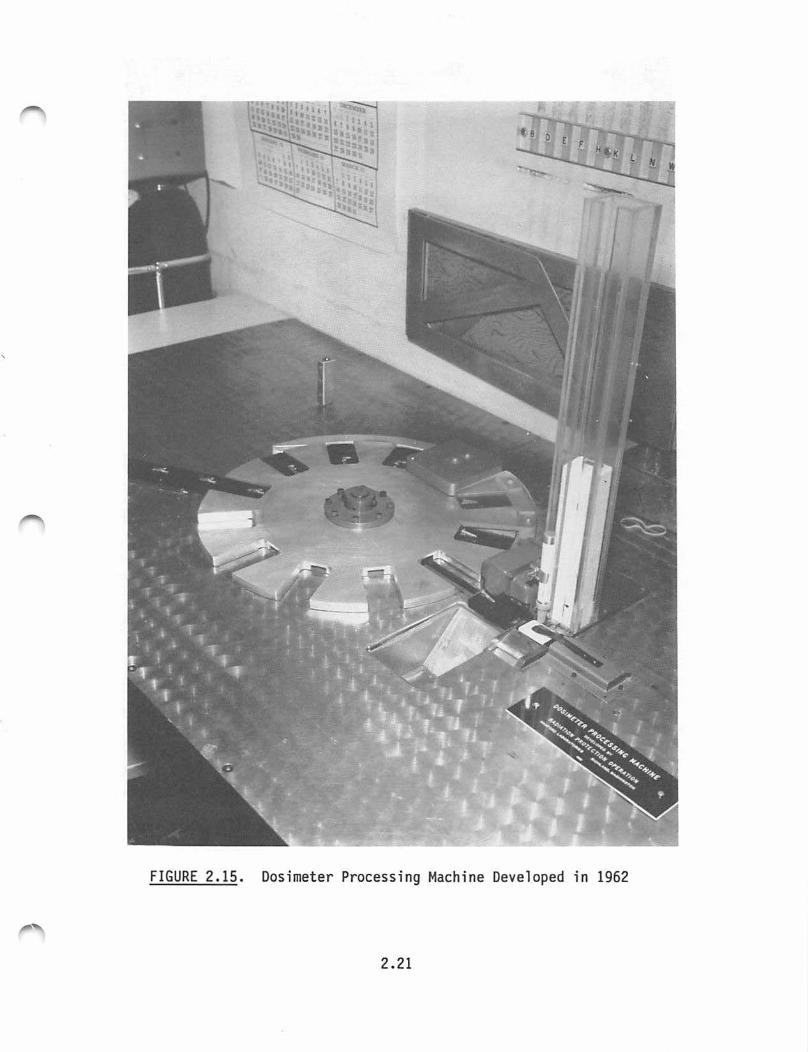
'
FIGURE 2.15 . Dosimeter Process i ng Machine Deve loped in 1962
2.21
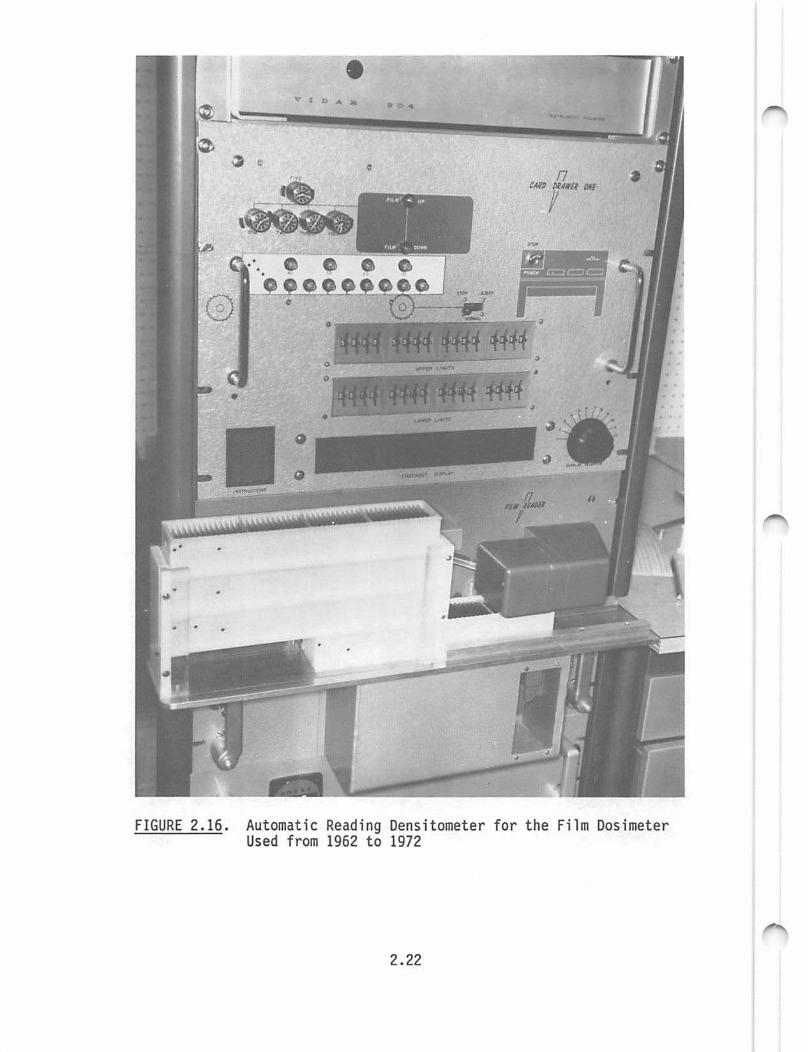
• ·~
. . . . . ... . ···-· ... J~ ta> i.: " -- . r.---.:- - - ....... ..-"'!-......
~ c :! n CAIP PIA/Ill Otf!
f •
, .. u· . ... ""
I ,,L/11 , .... 00• 11'
FIGURE 2.16. Automatic Reading Densitometer for the Film Dosimeter Used from 1962 to 1972
2.22
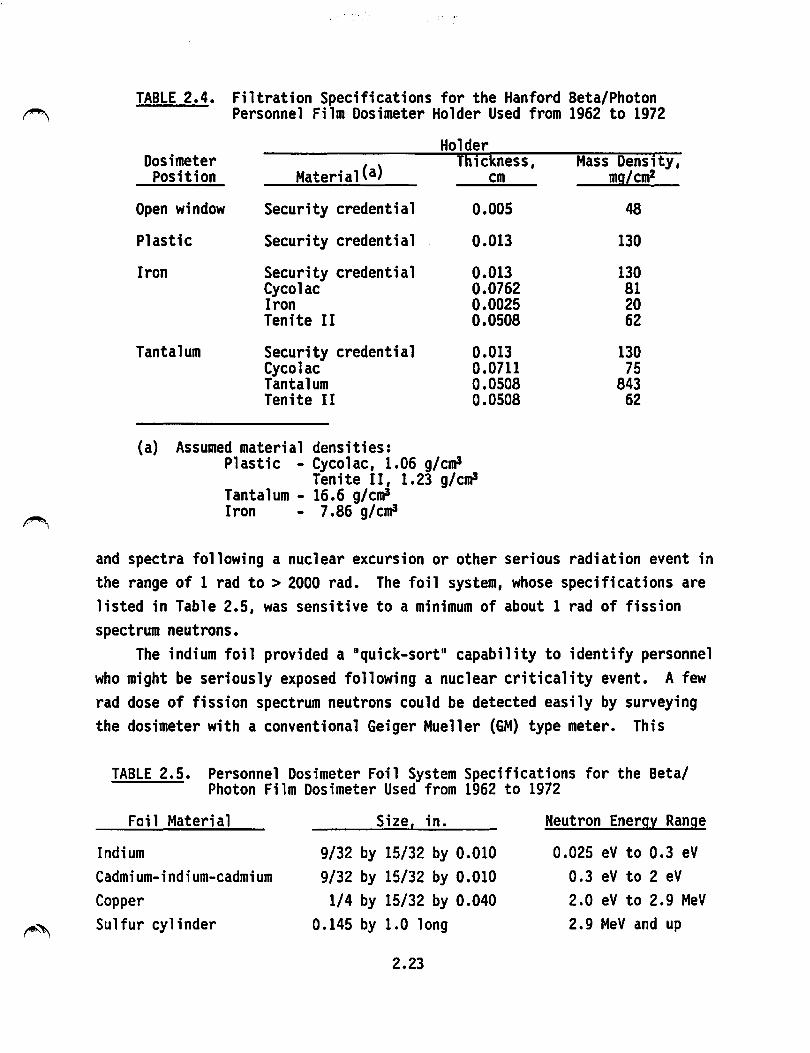
~
~"'
TABLE 2.4. Filtration Specifications for the Hanford Beta/Photon Personnel Film Dosimeter Holder Used from 1962 to 1972
Holder Dosimeter
Material Ca) Thickness,
Position cm
Open window Security credential 0.005
Plastic Security credential 0.013
Iron Security credential 0.013 Cycolac 0.0762 Iron 0.0025 Tenite II 0.0508
Tantalum Security credential 0.013 Cycolac 0.0711 Tantalum 0.0508 Tenite II 0.0508
(a) Assumed material densities: Plastic - Cycolac, 1.06 g/clfiJ
Tenite II, 1.23 g/clfiJ Tantalum - 16.6 g/clfiJ Iron 7.86 g/clfiJ
Mass Density, mg/cm2
48
130
130 81 20 62
130 75
843 62
and spectra following a nuclear excursion or other serious radiation event in the range of 1 rad to > 2000 rad. The foil system, whose specifications are listed in Table 2.5, was sensitive to a minimum of about 1 rad of fission spectrum neutrons.
The indium foil provided a "quick-sort" capability to identify personnel who might be seriously exposed following a nuclear criticality event. A few rad dose of fission spectrum neutrons could be detected easily by surveying the dosimeter with a conventional Geiger Mueller (GM) type meter. This
TABLE 2.5. Personnel Dosimeter Foil System Specifications for the Beta/ Photon Film Dosimeter Used from 1962 to 1972
Foil Material Sizei in. Neutron Energ~ Range
Indium 9/32 by 15/32 by 0.010 0.025 eV to 0.3 eV Cadmium-indium-cadmium 9/32 by 15/32 by 0.010 0.3 eV to 2 eV Copper 1/4 by 15/32 by 0.040 2.0 eV to 2.9 MeV Sulfur cylinder 0.145 by 1.0 long 2.9 MeV and up
2.23
supplemented the procedures for measuring activated 24Na in the body, which were developed in 1959 and in Hanford-wide use by 1959. Radiation monitoring '~ personnel were trained for this type of action in the event of an nuclear criticality accident.
2.5 THERMOLUMINESCENT DOSIMETER USED FROM 1972 TO THE PRESENT
In January 1971 a basic (one-chip) TLD was introduced for use by all nonradiation workers. The basic TLD was followed, in January 1972, by the implementation of a multipurpose TLD for all radiation workers. The multipurpose TLD had the capability of measuring beta/photon and neutron exposure and contained many of the features of the film dosimeter. These dosimeter types are shown in Figure 2.17 and the first TLD automatic reader is shown in Figure 2.18. The filtration specifications for the dosimeter holder are listed in Table 2.6.
2.6 PENCIL DOSIMETERS FOR BETA/PHOTON MEASUREMENTS
In the beginning at the Metallurgical and Clinton Laboratories, pencil dosimeters (see Figure 2.19) were considered the primary personnel monitoring 1~ device, with a film dosimeter being only a valuable adjunct. With expanding experience at these laboratories and with the large-scale operations starting at Hanford in 1944, this practice was reversed: the film dosimeter provided the official dose of record, while the pencil became the day-to-day means for personnel to monitor their radiation exposure in the workplace. This also supported the establishment of an official radiation exposure record on a long-term and verifiable basis for each employee working at Hanford.
During the first few years of operation two pencil dosimeters were issued to personnel whenever they entered any of the controlled areas and were returned by the personnel whenever they left the areas. There were a few locations outside of the controlled areas where only designated personnel were issued pencil dosimeters. Each pencil was read daily. The results were recorded for the individual and then each pencil was returned to service after being recharged. The lowest reading was taken as the official result for the day (Parker 1946).
2.24
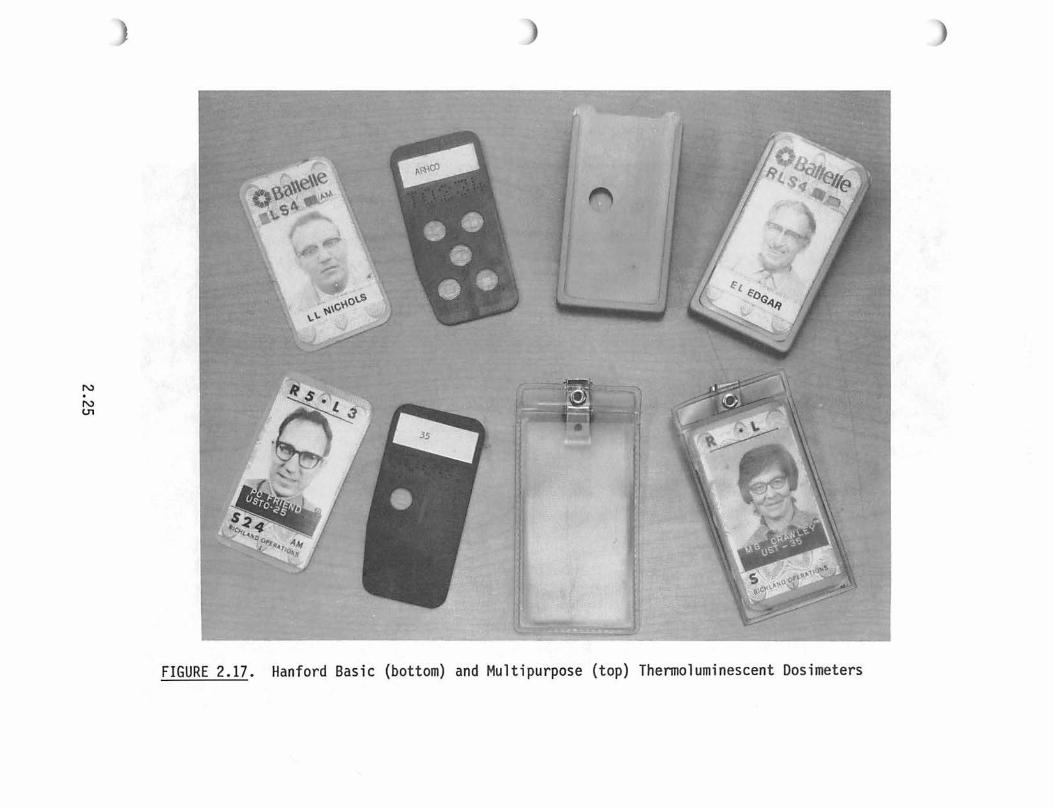
N . N 01
!':',
FIGURE 2.17. Hanford Bas ic (bottom) and Mul tipurpose (top) Thennoluminescent Dosimeters
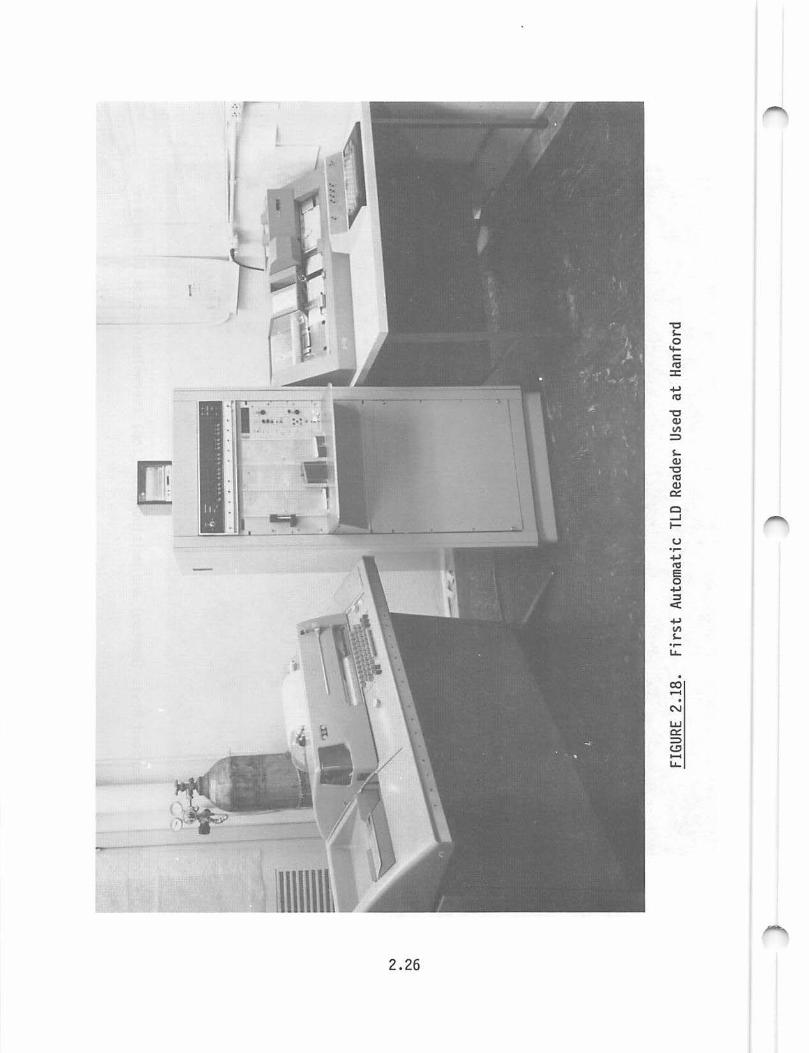
2.26
u
. co .-c . N
w 0::: :::::> (.!:I -LI..
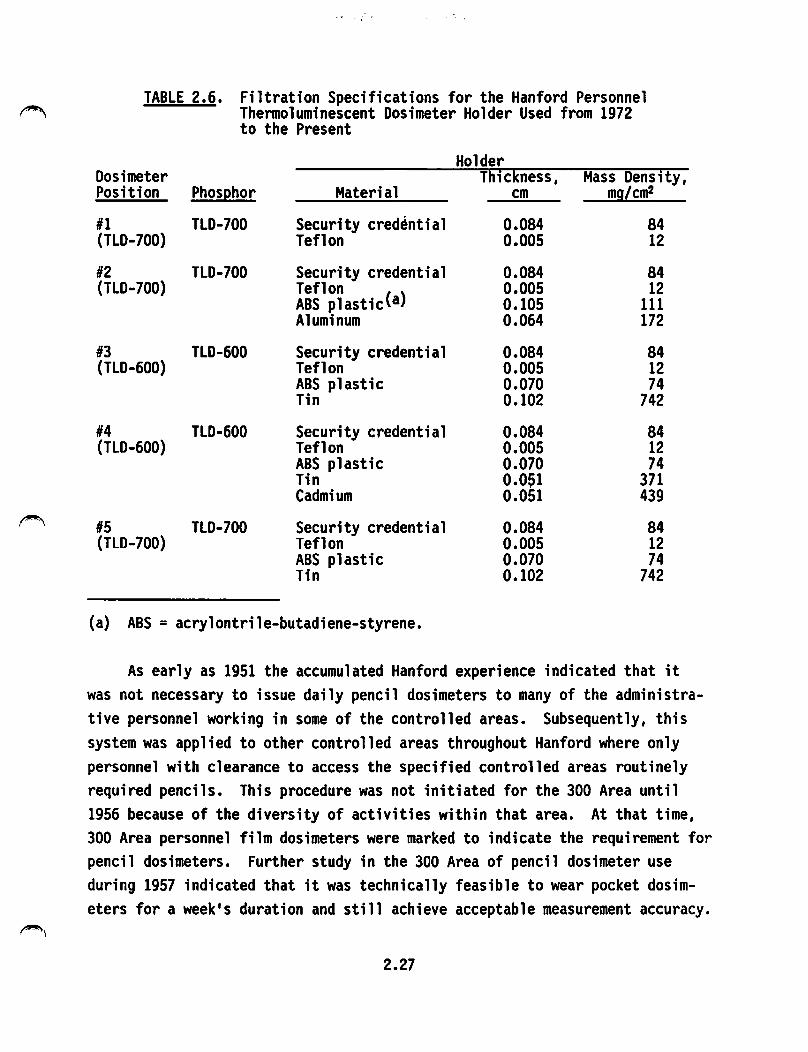
r-\
~
~\
TABLE 2.6. Filtration Specifications for the Hanford Personnel Thennoluminescent Dosimeter Holder Used from 1972 to the Present
Holder Dosimeter Thickness, Mass Density, Position Phosl!hor Material cm mg/cm2
11 TLD-700 Security cred~ntial 0.084 84 (TLD-700) Teflon 0.005 12
12 TLD-700 Security credential 0.084 84 (TLD-700) Teflon 0.005 12
ABS plastic(a) 0.105 111 Aluminum 0.064 172
13 TLD-600 Security credential 0.084 84 (TLD-600) Teflon 0.005 12
ABS plastic 0.070 74 Tfo 0.102 742
14 TLD-600 Security credential 0.084 84 (TLD-600) Teflon 0.005 12
ABS plastic 0.070 74 Tin 0.051 371 Cadmium 0.051 439
15 TLD-700 Security credential 0.084 84 (TLD-700) Teflon 0.005 12
ABS plastic 0.070 74 Tin 0.102 742
(a) ABS = acrylontrile-butadiene-styrene.
As early as 1951 the accumulated Hanford experience indicated that it was not necessary to issue daily pencil dosimeters to many of the administrative personnel working in some of the controlled areas. Subsequently, this system was applied to other controlled areas throughout Hanford where only personnel with clearance to access the specified controlled areas routinely required pencils. This procedure was not initiated for the 300 Area until 1956 because of the diversity of activities within that area. At that time, 300 Area personnel film dosimeters were marked to indicate the requirement for pencil dosimeters. Further study in the 300 Area of pencil dosimeter use during 1957 indicated that it was technically feasible to wear pocket dosimeters for a week's duration and still achieve acceptable measurement accuracy.
2.27
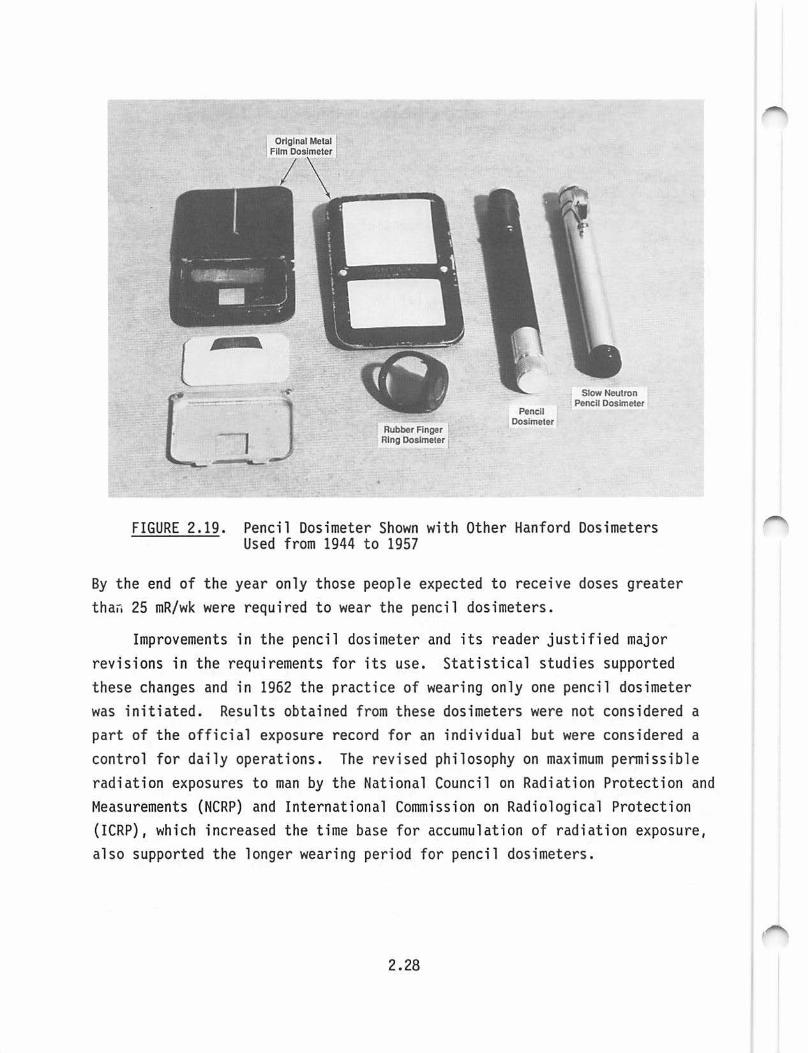
[
L* ==;--
Original Metal Fiim Dosimeter
\
Rubber Anger Ring Dosimeter
Panell Dosimeter
Slow Neutron Pencll Dosimeter
FIGURE 2.19. Pencil Dosimeter Shown with Other Hanford Dosimeters Used from 1944 to 1957
By the end of the year only those people expected to receive doses greater than 25 mR/wk were required to wear the pencil dosimeters.
Improvements in the pencil dosimeter and its reader justified major revisions in the requirements for its use. Statistical studies supported these changes and in 1962 the practice of wearing only one pencil dosimeter was initiated. Results obtained from these dosimeters were not considered a part of the official exposure record for an individual but were considered a control for daily operations. The revised philosophy on maximum permissible radiation exposures to man by the National Council on Radiation Protection and Measurements (NCRP) and International Commission on Radiological Protection (ICRP), which increased the time base for accumulation of radiation exposure, also supported the longer wearing period for pencil dosimeters.
2.28

r-\.
2.7 OTHER EXTREMITY DOSIMETERS
Several adaptations were made to measure the exposure of various parts of the body during special work conditions and in special work locations. These dosimeters usually contained the conventional material and had shielding configurations similar to those for regular personnel dosimeters. The finger ring, wrist, and flexible dosimeters are three of the extremity dosimeters that have been used at Hanford. Extremity dosimeters are still being used routinely for special monitoring.
2.7.1 Finger Ring Dosimeters
From the beginning at the Metallurgical and Clinton Laboratories, researchers realized that exposure to the hands may be significantly higher than what is received by the body and measured by dosimeters worn on the body. Early attempts were made to develop a dosimeter that would monitor more closely the exposure received by the extremities (Healy 1944).
Aluminum rings with a thin silver shield covering part of the film were fashioned. The film discs were about 1/2 in. in diameter, cut from the DuPont 552 film packet using the DuPont 510 film. Later, the ring film was cut from large sheets of the 510 film. The film discs were packaged in various materials to provide a light-weight, light-tight cover and still be considered thin enough for most beta radiations. Some trial packages were even dipped in paraffin and taped directly to the worker's fingers. These early attempts were clumsy and tore the gloves occasionally, but did provide some measurement of hand exposure. The metal ring was soon followed by a rubber ring in which the film disc and black plastic cover were held in place with a flange.
By mid-1967 a flexible rubber thermoluminescent finger ring (Kathren, Kocher, .and Endres 1970; Kathren, Kocher, and Endres 1971) using a rectangular wafer of LiF in a Teflon9 matrix was available for routine hand dosimetry. The ring had a surface area of about 1.5 cm2 that provided enough area for easy identification. The Teflon wafer and cover were easily inserted in the ring top to form a compact package that could be worn comfortably by workers.
Teflon is a registered trademark of E. I. DuPont de Nemours, Wilmington, Delaware.
2.29
The wide range of response provided by the ring, < 30 mR to > 1 x 10⁵ R, gave more than adequate coverage for all work situations. At the low exposures, ~ the standard deviation·was about •50% and at higher exposures it was reduced to •10%. Another advantage was minimal energy dependence, allowing for its use for essentially any photon energy greater than 10 keV. At the 17-keV energy level most commonly associated with plutonium, the response per unit of exposure was virtually the same as for 60co. Beta response was only about half in terms of light output per rad but the ring was not usually used in mixed photon and beta fields. The ring has been used since January 1968 and has been well received by the workers. Blind audits indicate routine accuracy of •25% at the 95% confidence level covering a range of 0.1 to 10 R, regard-less of exposure conditions.
2.7.2 Wrist and Flexible Dosimeters
A wrist dosimeter, similar to a wrist watch, has also been used extensively in locations where exposure to the hands and forearms may be the limiting factor. Flexible dosimeters with appropriate shielding materials were used extensively by underwater divers when repairing the storage basins. These dosimeters could be affixed to almost any part of the body to determine f"""",
the limiting exposure location where the source material could not be shielded or known with any certainty in remote locations of the basin. These dosim-eters have also been used in work locations where the head and/or eyes may be the limiting exposure organ of the body.
2.30
/
CHAPTER 3.0
HANFORD PERSONNEL NEUTRON DOSIMETERS
l -i
I ' ; i
I i i 'I
I .1
j
i '
~
' -i
' . ~
I 1 ti

3.0 HANFORD PERSONNEL NEUTRON DOSIMETERS
Five primary dosimeters have been used at Hanford to measure personnel exposure to neutrons. From 1944 to 1950, personnel exposure to neutrons was detennined using a pencil dosimeter that had an enriched 109 liner. In those early years, some attempts were made to measure fast neutrons using a finegrain film to record tracks from recoil protons, but these attempts were unsuccessful. In 1950 the newly developed Eastman-Kodak9 Nuclear Track Emulsion, Type A (NTA) film was placed in service using the regular beta/ photon film holder and this holder was used until 1957. A special cellulose acetate butyrate holder (identical to the regular beta/gamma film holder) was introduced in 1957 and only used for about 1 year, because it was replaced with a dosimeter holder thick enough to enclose both the NTA and regular beta/photon film packets. The thick dosimeter holders were used from 1958 until 1972, at which time the multipurpose albedo TLD was implemented for measurement of neutron and beta/photon radiations. The neutron dosimetry systems used at Hanford since 1944 are discussed in the following subsections.
3.1 PENCIL DOSIMETERS USED FROM 1944 TO 1950
Hanford initially relied on pencil dosimeters with enriched 109 liners to measure exposure to slow neutrons (see Figure 2.19). The pencil dosimeters were used almost exclusively for neutron measurements until the improved Eastman-Kodak NTA film was introduced in 1950. A fine-grain film was tried during the 1940s for measurement of fast neutrons, but the response of the film and the ability to adequatel_y detect the tracks etched in the emulsion had not been developed to the level required for large-scale use.
3.2 NEUTRON FILM DOSIMETER USED FROM 1950 TO 1957
From 1950 to 1957, Eastman-Kodak NTA film was used in the regular metal beta/photon dosimeter holder (see Figure 2.7). The film had limited capability, measuring only fast neutrons with energies ~.0.8 MeV. The recoil proton
e Kodak is a registered trademark of Eastman-Kodak Company, Rochester, New York.
3.1
tracks on the NTA film were viewed microscopically at 970X magnification for 40 fields of view and compared with 40 fields on calibration and control film for an estimate of the neutron exposure. The neutron dosimeter was issued to selected employees working in reactor facilities where neutron exposure was possible and to employees working in the plutonium processing facilities.
3.3 NEUTRON FILM DOSIMETER USED FROM 1957 TO 1958
From April 1957 to July 1958, Eastman-Kodak NTA film was used in a separate cellulose acetate butyrate holder identical, except for color, to the one used for the beta/photon dosimeter. The method for interpretation of neutron dose was same as that used from 1950 to 1957.
3.4 NEUTRON FILM DOSIMETER USED FROM 1958 TO 1972
A separate neutron dosimeter (see Figure 3.1) was introduced in 1958. It differed from the Hanford beta/photon dosimeter only by an increase of 0.10 in. in thickness. This change was necessary to accommodate two film packets (one of NTA film and one of beta/photon film) and to reinforce the body of the dosimeter holder. The design characteristics, calibration tech- ~
nique and shield material of this neutron film dosimeter are discussed in the following subsections along with quality factors used to determine personnel dose.
3.4.1 Design Characteristics
The design of the neutron film dosimeter used from 1958 to 1972 was based on knowledge of materials available to separate slow and fast neutron radiation. Table 3.1 provides a summary of the holder design specifications.
The primary functional change in the Hanford beta/photon dosimeter that permitted its use as a neutron dosimeter wa~ the incorporation of suitable shield materials. The selection of cadmium and tin in lieu of other metals was based upon their thermal neutron cross sections and x-ray and gamma ray mass absorption coefficients. Cadmium has a high thermal neutron cross section, and tin is relatively transparent with respect to neutrons. The prompt gamma coincident with a neutron capture in the cadmium is recorded as darkening of the film behind the cadmium shield. Because gamma rays
3.2
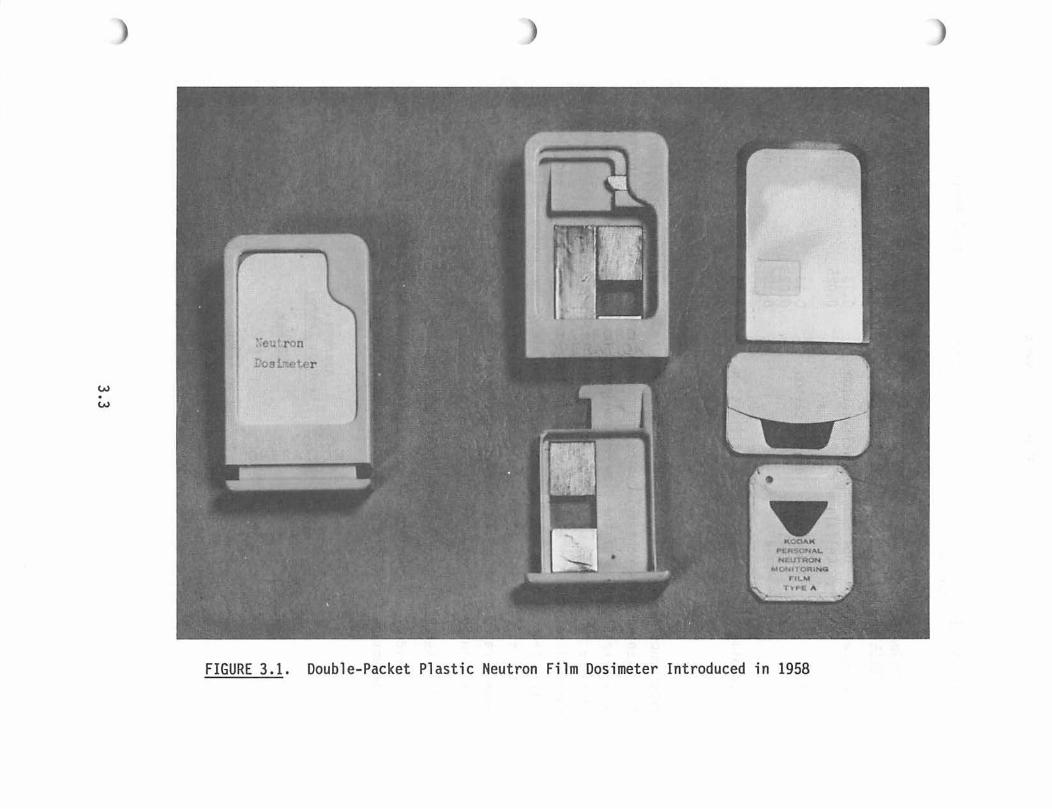
··eut r on
osir.eter
w . w
• FIGURE 3.1. Double-Packet Plastic Neutron Film Dosimeter Introduced in 1958
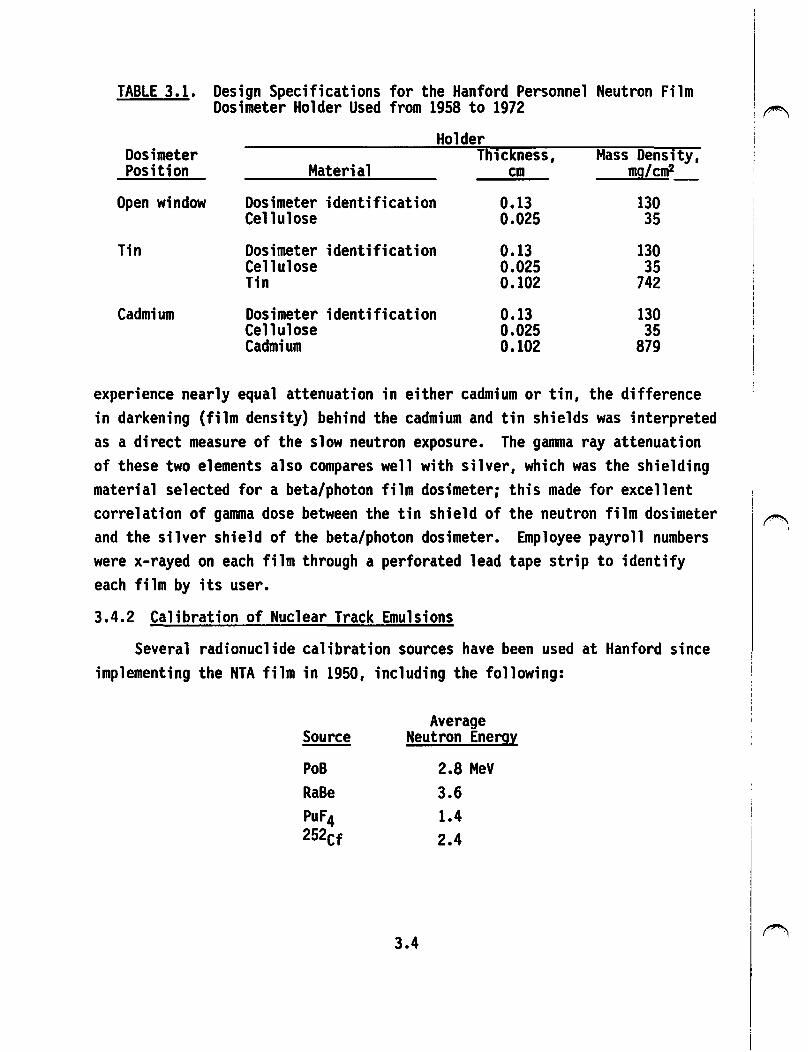
TABLE 3.1. Design Specifications for the Hanford Personnel Neutron Film Dosimeter Holder Used from 1958 to 1972 ~
Holder Dosimeter Thickness, Mass Density, Position Material cm mg/cm2_
Open window Dosimeter identification 0.13 130 Cellulose 0.025 35
Tin Dosimeter identification 0.13 130 Cellulose 0.025 35 nn 0.102 742
Cadmium Dosimeter identification 0.13 130 Cellulose 0.025 35 Cadmium 0.102 879
experience nearly equal attenuation in either cadmium or tin, the difference in darkening (film density) behind the cadmium and tin shields was interpreted as a direct measure of the slow neutron exposure. The gamma ray attenuation of these two elements also compares well with silver, which was the shielding material selected for a beta/photon film dosimeter; this made for excellent correlation of ga11111a dose between the tin shield of the neutron film dosimeter and the silver shield of the beta/photon dosimeter. Employee payroll numbers were x-rayed on each film through a perforated lead tape strip to identify each film by its user.
3.4.2 Calibration of Nuclear Track Emulsions
Several radionuclide calibration sources have been used at Hanford since implementing the NTA film in 1950, including the following:
Average Source Neutron Energ~
PoB 2.8 MeV Ra Be 3.6 Puf4 1.4 252cf 2.4
3.4
The PoB source apparently provided the majority of the neutron calibrations from 1950 through 1956. During a period in 1957, the Van de Graaff positive ion accelerator was used to calibrate film using the reaction of deuteron on a 9ee target. The energy of the neutrons produced varied from 1.0 MeV to 6.3 MeV with an average energy of 2.2 Mev.(a)
Roesch and DePangher provided an overview for converting neutron flux to dose for the early neutron sources used at Hanford.(b) The conversion factors used at Hanford for many years were 8 n/cm2-sec for fast neutrons, 48 n/cm2-sec for intermediate neutrons, and 120 n/cm2-sec for slow neutrons. The exact history of these numbers was not certain but was expected to have been calculated by Gamertsfelder et al. (1962). Slightly different numbers were used for the PoB calibrations, the Van de Graaff calibrations, and the plutonium fluoride calibrations to allow for the energy dependence.
Beginning in 1958, calibration was accomplished with the PuF4 neutron source. The calibration films were exposed to a dose of 1.075 rem computed from first-collision theory. (The average film response yields 71.24 ± 13.51 tracks per 40 fields of view; this is equivalent to a 1075-mrem exposure with
~ a 95% confidence interval.) The single-collision calibration factor could be multiplied by a constant of 1.372 to obtain a multiple-collision neutron dose theory calibration factor. This calibration regimen coincided with the introduction in 1958 of the new "double packet" dosimeter holder that accommodated two film packets.
Interpretation of NTA film after processing was accomplished by counting microscopically the tracks produced in the emulsion by recoil protons (see Figure 3.2). A 1/129-cm2 field of view was viewed under 970X magnification with oil immersion. Each of three observers counted the tracks occurring in 40 fields of view (a total of 120 fields). Films that indicated a significant increase in the number of tracks relative to background were viewed for a total of 400 fields. The number of tracks per 40 fields was determined at
(a) De Phanger, J. 1958. "Suggested Change in Procedure for Calibration of Neutron Fi le." Letter to R. w. Mehfoger, dated January 28, 1958.
(b) Roesch W. C. and J. De Pangher. "Neutron Flux-Dose Relations." Letter to A. R. Keene, dated September 9, 1958.
3.5
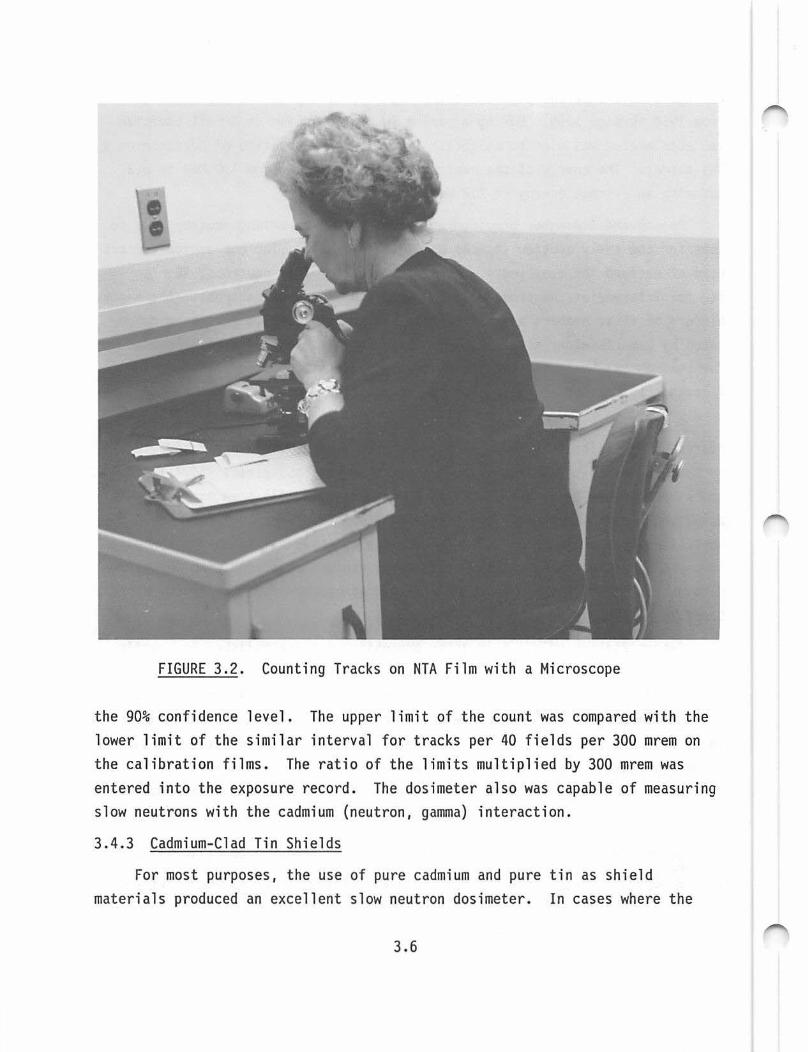
FIGURE 3.2. Counti ng Tracks on NTA Fi lm wi t h a Microscope
the 90% conf idence leve l . The upper l imit of the count was compared with the lower l imit of the simil ar interval for tracks per 40 fie l ds per 300 mrem on the cal ibration fi lms . The ratio of the limits mu l t ipl ied by 300 mrem was entered into the exposure record. The dosimeter also was capab le of measuri ng slow neutrons wit h the cadmium (neutron, gamma) interaction.
3.4.3 Cadmium-Clad Tin Shields
For most purposes, the use of pure cadmi um and pure tin as shield material s produced an excellent slow neutron dosimeter. In cases where the
3.6
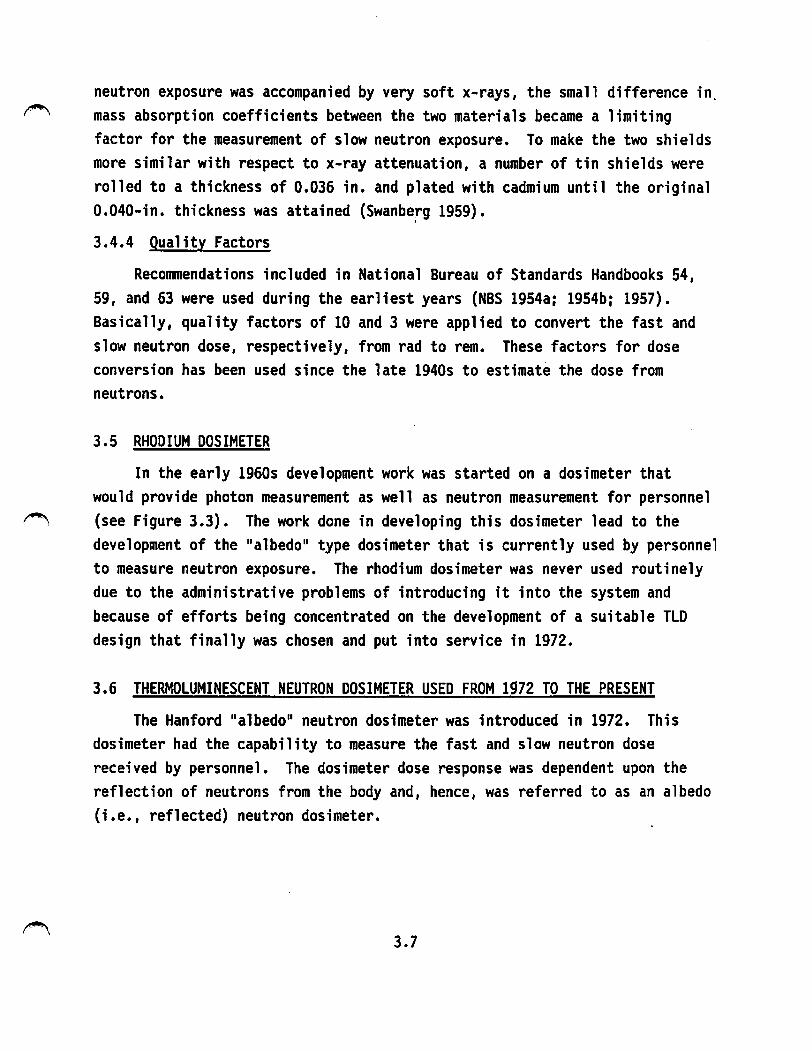
neutron exposure was accompanied by very soft x-rays, the small difference in. (""\., mass absorption coefficients between the two materials became a limiting
factor for the measurement of slow neutron exposure. To make the two shields more similar with respect to x-ray attenuation, a number of tin shields were rolled to a thickness of 0.036 in. and plated with cadmium until the original 0.040-in. thickness was attained (Swanberg 1959).
3.4.4 Quality Factors
Recommendations included in National Bureau of Standards Handbooks 54, 59, and 63 were used during the earliest years (NBS 1954a: 1954b: 1957). Basically, quality factors of 10 and 3 were applied to convert the fast and slow neutron dose, respectively, from rad to rem. These factors for dose conversion has been used since the late 1940s to estimate the dose from neutrons.
3.5 RHODIUM DOSIMETER
In the early 1960s development work was started on a dosimeter that would provide photon measurement as well as neutron measurement for personnel (see Figure 3.3). The work done in developing this dosimeter lead to the development of the 11 albedo 11 type dosimeter that is currently used by personnel to measure neutron exposure. The rhodium dosimeter was never used routinely due to the administrative problems of introducing it into the system and because of efforts being concentrated on the development of a suitable TLD design that finally was chosen and put into service in 1972.
3.6 THERMOLUMINESCENT NEUTRON DOSIMETER USED FROM 1972 TO THE PRESENT
The Hanford 11 albedo 11 neutron dosimeter was introduced in 1972. This dosimeter had the capability to measure the fast and slow neutron dose received by personnel. The dosimeter dose response was dependent upon the reflection of neutrons from the body and, hence, was referred to as an albedo (i.e., reflected) neutron dosimeter.
3.7
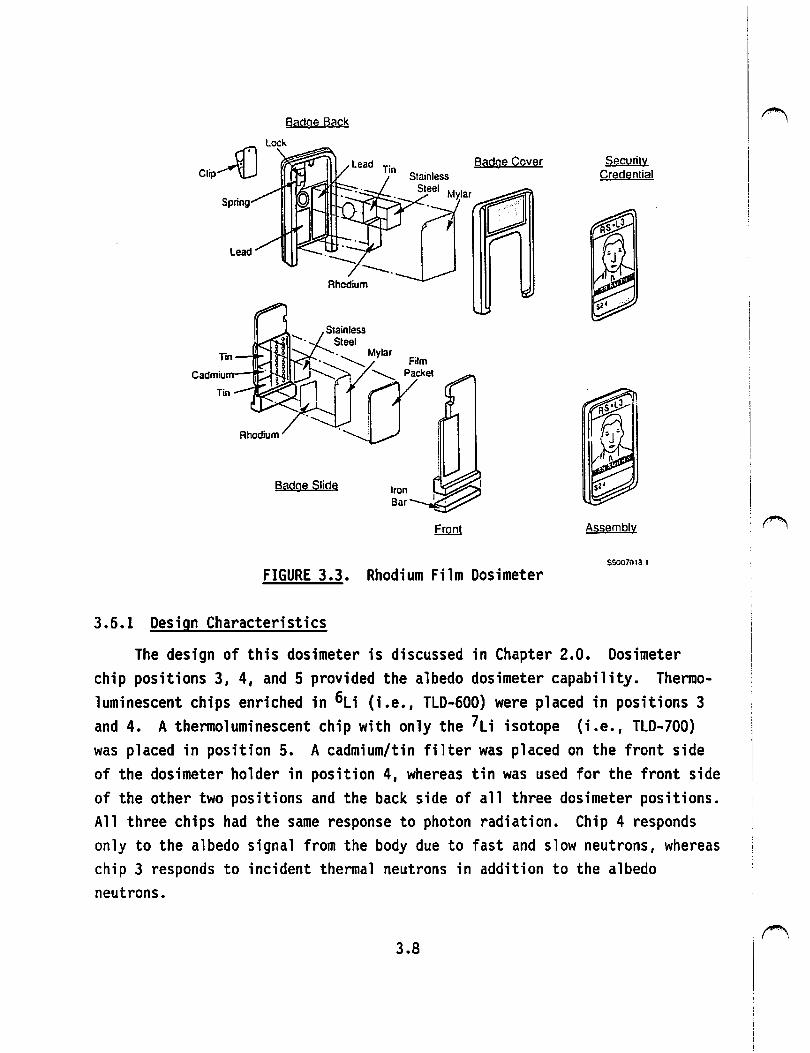
Spring
Lead
Tin
Cadmium
Badge Back
Badge Cover
Badge Slide
FIGURE 3.3. Rhodium Film Dosimeter
3.6.1 Design Characteristics
Security Credential
Assembly
$0007019.1
The design of this dosimeter is discussed in Chapter 2.0. Dosimeter chip positions 3, 4, and 5 provided the albedo dosimeter capability. Thermoluminescent chips enriched in 6Li (i.e., TLD-600) were placed in positions 3 and 4. A thermoluminescent chip with only the 7Li isotope (i.e., TLD-700) was placed in position 5. A cadmium/tin filter was placed on the front side of the dosimeter holder in position 4, whereas tin was used for the front side of the other two positions and the back side of all three dosimeter positions. All three chips had the same response to photon radiation. Chip 4 responds only to the albedo signal from the body due to fast and slow neutrons, whereas chip 3 responds to incident thermal neutrons in addition to the albedo neutrons.
3.8 :~
3.6.2 Calibration
A field-specific neutron calibration was used with the albedo neutron dosimeter. This was detennined by developing a calibration procedure with the Puf 4 source, which provided the same dosimeter response per dose as measured in the field with a tissue-equivalent proportional counter (TEPC). A sigma pile was used to detennine the response of the dosimeter to slow neutrons. In 1981 the Puf 4 source was replaced with a 252cf source. To obtain the same dosimeter response per dose, the time of the exposure was increased by a factor of 1.73 (e.g., length of exposure time from a bare 252cf source increased by a factor of 1.73 to obtain the same dosimeter response as received from the Puf4 source). This field-specific calibration has been confinned several times during the years (Fix et al. 1981; 1982). The bare 252cf calibration is used in the DOE Laboratory Accreditation Program dosimeter perfonnance testing.
3.7 ACCIDENT DOSIMETRY
During the early years of Hanford operation, no specific dosimetry was available to measure personnel exposure to the very high levels of radiation that may result from a criticality accident. To the extent possible, ganuna radiation was measured with the low-sensitivity film in the personnel dosimeter. No measurement of high-level neutron exposure could be made with the available personnel dosimeters.
In the early 1950s, the possibility of nuclear accidents led to the development of a method of measuring the radiation levels that could occur in areas where personnel might be working if an accident occurred (Wilson and Larson 1961; Wilson 1962). An area type dosimeter (Hurst 1956) was used during the late 1950s in several plant locations, but it was replaced by the Hanford criticality dosimeter in 1962 (Bramson 1962). The use of alphaemitting fission foils in the Hurst dosimeter was considered hazardous in case of fire at the location where it was placed. The Hanford criticality dosimeter not only eliminated this hazard, but could also give an inunediate indication of the absorbed neutron dose (in rad) by measuring induced radioactivity in the moderated gold foil located in the center of the dosimeter package (see
3.9
Figure 3.4). Criticality dosimeters were placed throughout Hanford facilities where there was even the remotest possibility of a nuclear excursion. The ~ Hanford design also gave short-tenn protection to some of the foils from fire or explosion. These dosimeters are currently used throughout the Hanford facilities where fissionable materials are handled. The only alteration to these dosimeters since their inception has been a minor change in the holder for the foils and the replacement of their glass rods with TLD chips.
A "quick sort" procedure was also developed in 1959 and imediately placed in service to provide an indication of high-level exposure to neutron radiation by direct survey of the individual {Wilson 1962). This capability was included in the design of the personnel film dosimeter {shown in Figure 2.14}, which contained foils, sulfur, and glass fluorods for measurement of very high gamma exposures. With the implementation of the TLD, it became possible to measure employees' exposure to both ganuna and neutron radiation.
The "quick sort" procedure was used following the 1962 Recuplex Plant (waste recovery section of 234-5-Z Building) criticality incident and immediately identified those personnel receiving high-level neutron exposure. Subsequent detailed dosimetry evaluation for these employees indicated that the "quick sort" estimates were very accurate estimates of the neutron dose received by these employees.
3.10
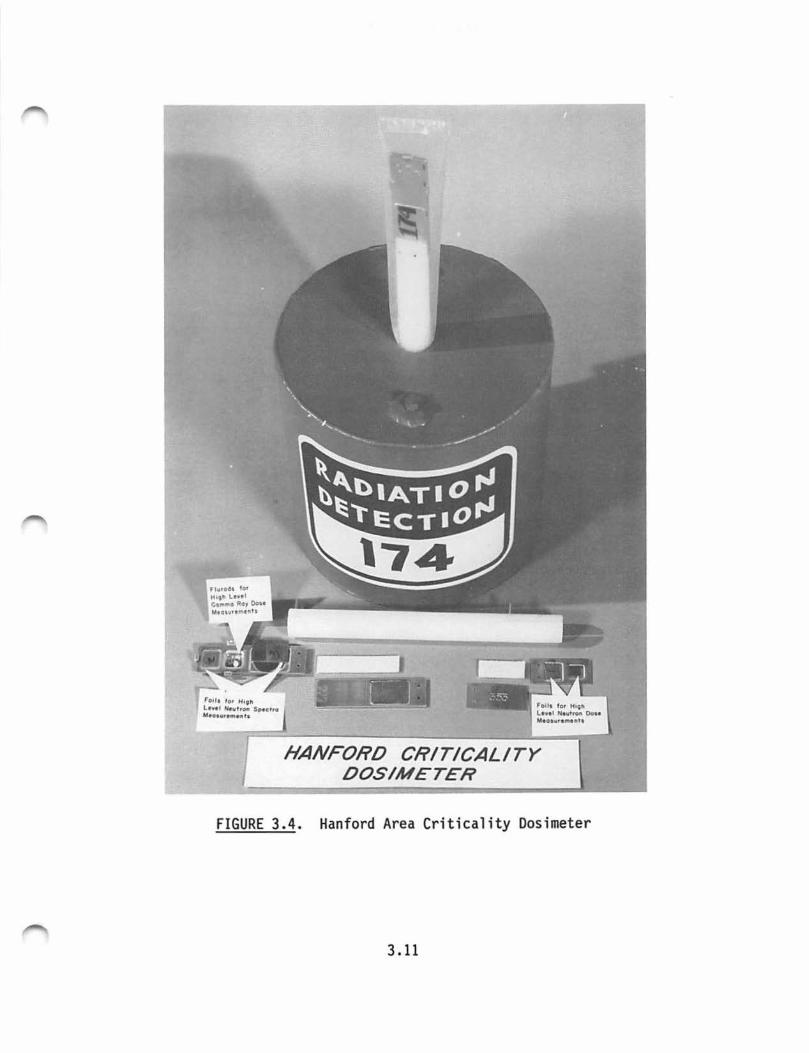
ro,la for H1g11 L• w• I 'hwtroa s.-.clfo M•••vr••••h
HANFORD CRITICALITY DOSIMETER
FIGURE 3.4. Hanford Area Criticality Dosimeter
3 .11
CHAPTER 4.0
DOSIMETER CALIBRATION ~ND DOSE DETERMINATION.
... . -. :. :·
·,. : ~ :-·-· t : :
I l j
~ .... .
i ' l ' i i
I I I .\
~
4.0 DOSIMETER CALIBRATION AND DOSE DETERMINATION
Consideration of the methods of calibrating, processing, and determining dose for the different dosimeter systems at Hanford is important to the evaluation of the recorded whole body dose relative to a consistent technical basis (i.e., deep dose) throughout the years. Hanford practices used to minimize known sources of error in dosimetry systems are important to estimating the potential uncertainties in the recorded dose. Since 1944 dosimetry technology has continued to evolve at Hanford with many changes in the methods of dosimeter calibration, processing, and dose determination. When Herbert M. Parker formed the Health Instruments (HI) Section at Hanford in July 1944, immediate attention was given to the calibration and performance capability of the available radiation monitoring devices to accurately measure radiation exposure. A summary of the major calibration and dose assessment techniques used at Hanford is provided in Table 4.1. The detailed formulas used to determine dose are provided in Appendixes A, B, and C for the multi-element film dosimeter used from 1957 to 1962, the multi-element film dosimeter used from 1962 to 1972, and the TLD introduced in 1972, respectively. A brief discussion of each significant change in the calibration and dose assessment practices for each dosimeter system is provided in the following subsections.
4.1. TWO-ELEMENT BETA/PHOTON DOSIMETER USED FROM 1944 TO 1957
Initial attempts to calibrate personnel beta/photon dosimeters were made shortly after some of the Hanford facilities were constructed in 1944 (Wilson 1987). From records of film densities and assigned radiation dose, it appears that a procedure of assigning values of 30, 50, and 60 mR to film densities of 0.03, 0.05, and 0.06 was initially used. No records of calibration film for 1944 have been located. This system was apparently used for only a few weeks because assigned doses for recorded film densities are different for the remaining part of 1944; however, no calibration data were located. The first evidence of calibration data used to determine dose for personnel film dates back to March 1945. At that time radium gamma calibration data for a 10-day period were averaged and a characteristic curve for the open window and shielded portion of the film was established. A radium source certified by the NBS was initially used as a reference source for these calibrations.
4.1
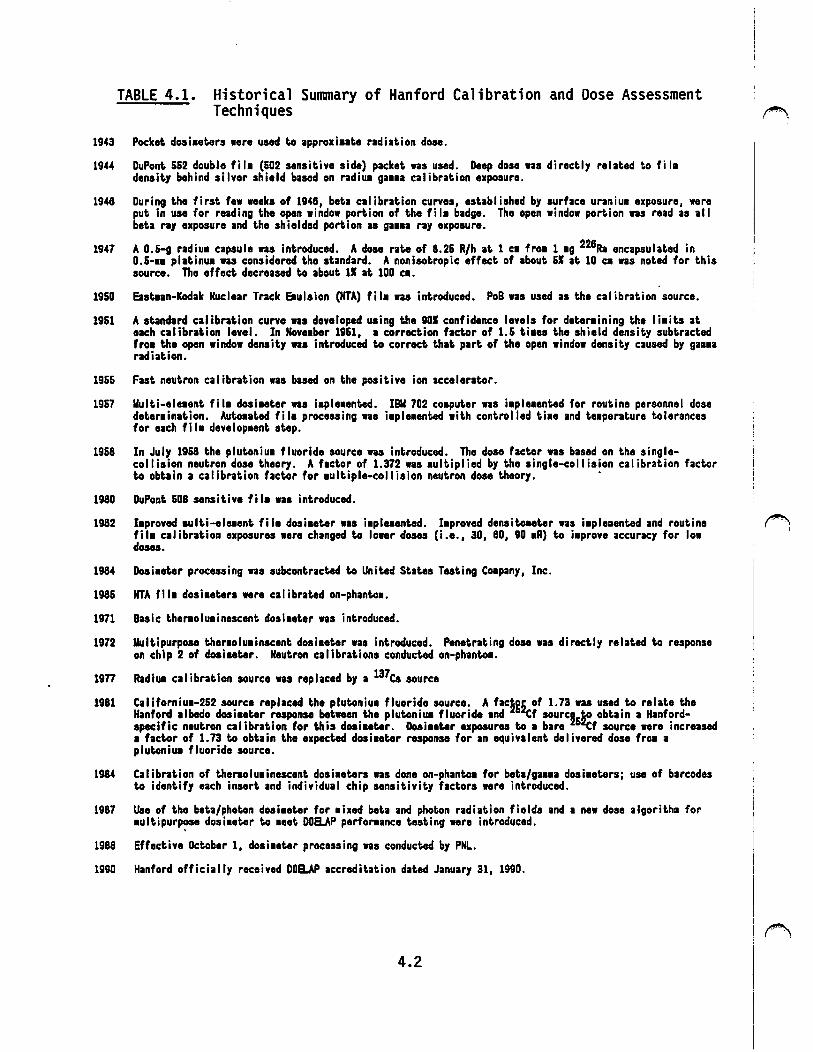
TABLE 4.1. Historical Summary of Hanford Calibration and Dose Assessment Techniques
1943 Pocket. doaimeters were used to approxiaat.e radiat.ion dose.
1944 DuPont. 552 double fil• (&02 sensitive side) packet was used. Deep dose was directly related to fila densit.y behind silver shield based on radiu1 ga11a calibrat.ion exposure.
1946 During the first few weeks of 1946, beta calibrat.ion curves, established by surface uraniu• exposure, were put in use for reading the open window portion of the fil• badge. Tho open window portion was read as all beta ray exposure and the shielded portion as 911•a ray exposure.
1947 A O.&-g radiu1 capsule was introduced. A dose rat.e of 8.2& R/h at 1 c1 fr01 1 1g 228Ra encapsulated in 0.5-11 plat.inu• was considered tho standard. A nonisotropic effect of about &I at. 10 c• was noted for this source. The effect decreased to about 11 at 100 c1.
1950 East.Ian-Kodak Nuclear Track Eaulsion (NTA) fil1 was introduced. PoB was used as t.he calibration source.
1951 A standard calibration curve was developed uaing the 901 confidence levels for det.e,..ining the li1it.s at. each calibration level. In Nove1ber 19&1, 1 correction factor of 1.& ti1es t.ho shield density subtracted fro1 t.he open window density WIS introduced to correct that part of the open window density caused by gaa1a radiat.ion.
1955 Fast neutron calibration was based on the positive ion accelerator.
1957 llulti-ele1ent fil1 dosi1eter was i1ple1ented. IBU 702 co•puter was i1ple•ented for routine personnel dose deter1ination. Auto1ated fil1 processing was i•ple1ented with controlled ti1e and te•perature tolerances for each fil1 develop1ent step.
19&8 In July 19&8 the plutoniu1 fluoride source was introduced. Tho dose factor was based on the single-col I ision neutron dose theory. A factor of 1.372 Wis 1ultiplied by tho single-collision calibration factor to obt.ain a calibration fact.or for 1ult.iple-collision neutron dose theory. •
1980 DuPont. 508 sensitive fil• Wis introduced.
1982 hprovod .ulti-olaent. fi I• dosi•et.er was i1pluent.ed. I•proved dens it.a.et.er was i1pleaent.ed and routine fi 11 calibration exposures were changed to lower doses (i.e., 30, BO, 90 •R) to i•provo accuracy for low doaea.
1984
1965
1971
1972
1977
1981
1984
1987
1988
1990
Dosi111t.er processing was subcontracted to United Stat.es Testing C01pany, Inc.
NTA fil1 dosi1eters were calibrated on-phanto1.
Basic the,..olu1inescent dosi1eter was introduced.
Multipurpose ther1olu1inscent dosi1eter was introduced. Penetrating dose was directly relat.ed to response on chip 2 of dosi1et.er. Neutron calibrations conducted on-phanto1.
RadiUI calibration source was replaced by a 137es source
Californiui-252 source replaced the plutoniu1 fluoride source. A f1ctg~ of 1.73 was used to relate the Hanford albedo dosi1et.er response between the plutoniua fluoride and '(f sourca5~ obtain 1 Hanfordspecific neutron calibration for this dosi1eter. Dosi1eter exposures to 1 bare 2 ~f source were increased 1 factor of 1.73 to obtain the expected dosisoter response for an equivalent delivered dose fro• a plutoniu1 fluoride source.
Calibration of the,..olu1inescent dosi1eters WIS done on-phant.o1 for beta/ga•1a dosi1eters; use of barcodes to identify each insert and individual chip sensitivity factors nre introduced.
Uao of tho beta/photon dosi1etor for •ixed beta and photon radiation f iolds and a new dose algoritha for 1ultipurp~o dosi1etor to 1eet DOB.AP performance testing were introduced.
Effective October 1, dosi1eter processing was conducted by PNL.
Hanford officially received DOB.AP accreditation dated January 31, 1990.
4.2
(""'. '
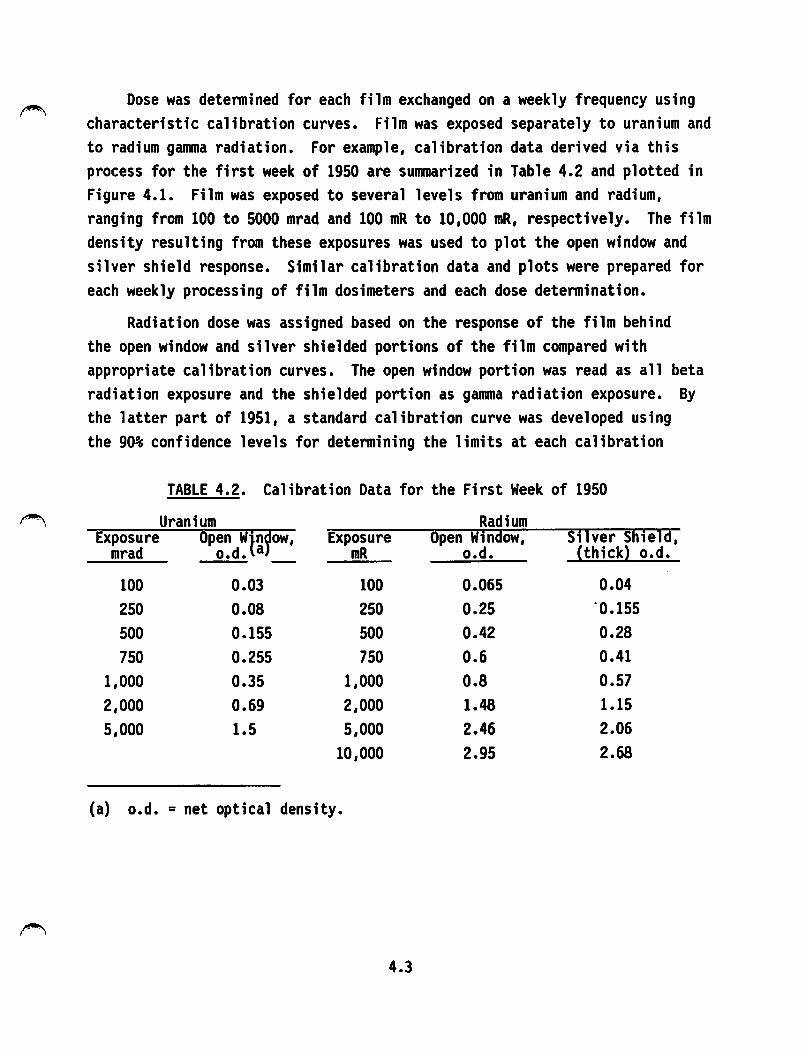
~
Dose was detennined for each film exchanged on a weekly frequency using characteristic calibration curves. Film was exposed separately to uranium and to radium gamma radiation. For example, calibration data derived via this process for the first week of 1950 are summarized in Table 4.2 and plotted in Figure 4.1. Film was exposed to several levels from uranium and radium, ranging from 100 to 5000 mrad and 100 mR to 10,000 mR, respectively. The film density resulting from these exposures was used to plot the open window and silver shield response. Similar calibration data and plots were prepared for each weekly processing of film dosimeters and each dose detennination.
Radiation dose was assigned based on the response of the film behind the open window and silver shielded portions of the film compared with appropriate calibration curves. The open window portion was read as all beta radiation exposure and the shielded portion as gamma radiation exposure. By the latter part of 1951, a standard calibration curve was developed using the 90% confidence levels for detennining the limits at each calibration
TABLE 4.2. Calibration Data for the First Week of 1950
Uranium Radium Exposure Open WtRjow, Exposure Open Window, Silver shield,
mrad o.d. mR o.d. {thick} o.d.
100 0.03 100 0.065 0.04 250 0.08 250 0.25 ·0.155 500 0.155 500 0.42 0.28 750 0.255 750 0.6 0.41
1,000 0.35 1,000 0.8 0.57 2,000 0.69 2,000 1.48 1.15 5,000 1.5 5,000 2.46 2.06
10,000 2.95 2.68
(a) o.d. = net optical density.
4.3

~
~
HW-3 . "B
l.1
100 2 3 4 ~ 6 7 9 IK 2 3 4 5 6 7 8 9 2K 2 3
FIGURE 4.1. Calibration Graph for the First Week of 1950. (The vertical ax is is net optical density; horizontal axis is gamma radiation in mi lliroentgen.)
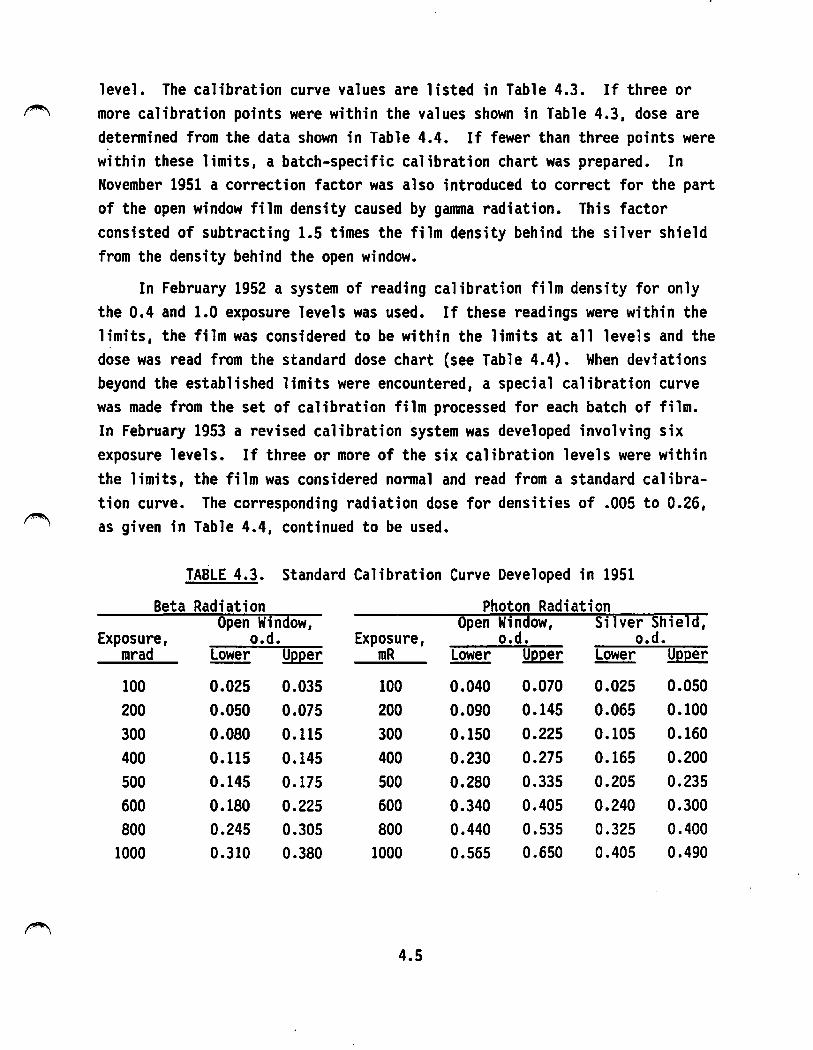
level. The calibration curve values are listed in Table 4.3. If three or more calibration points were within the values shown in Table 4.3, dose are determined from the data shown in Table 4.4. If fewer than three points were within these limits, a batch-specific calibration chart was prepared. In November 1951 a correction factor was also introduced to correct for the part of the open window film density caused by gamma radiation. This factor consisted of subtracting 1.5 times the film density behind the silver shield from the density behind the open window.
In February 1952 a system of reading calibration film density for only the 0.4 and 1.0 exposure levels was used. If these readings were within the limits, the film was considered to be within the limits at all levels and the dose was read from the standard dose chart (see Table 4.4). When deviations beyond the established limits were encountered, a special calibration curve was made from the set of calibration film processed for each batch of film. In February 1953 a revised calibration system was developed involving six exposure levels. If three or more of the six calibration levels were within the limits, the film was considered normal and read from a standard calibration curve. The corresponding radiation dose for densities of .005 to 0.26, as given in Table 4.4, continued to be used.
TABLE 4.3. Standard Calibration Curve Developed in 1951
Beta Radiation Photon Radiation Open Wfodow, Open Window, Silver Shield,
Exposure, o.d. Exposure, o.d. o.d. mrad Lower Upper mR Lower Upper Lower Upper
100 0.025 0.035 100 0.040 0.070 0.025 0.050 200 0.050 0.075 200 0.090 0.145 0.065 0.100 300 0.080 0.115 300 0.150 0.225 0.105 0.160 400 0.115 0.145 400 0.230 0.275 0.165 0.200 500 0.145 0.175 500 0.280 0.335 0.205 0.235 600 0.180 0.225 600 0.340 0.405 0.240 0.300 800 0.245 0.305 800 0.440 0.535 0.325 0.400
1000 0.310 0.380 1000 0.565 0.650 0.405 0.490
4.5
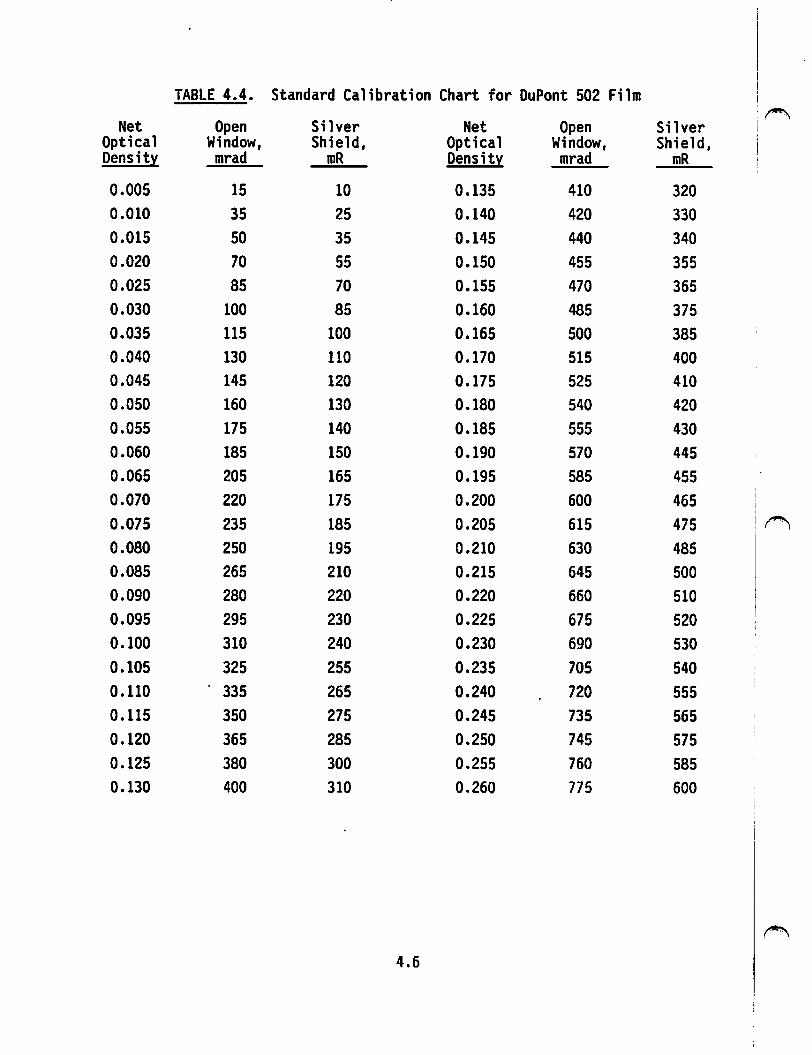
TABLE 4.4. Standard Calibration Chart for DuPont 502 Film I I
Silver ·~ Net Open Net Open Silver Optical Window, Shield, Optical Window, Shield, Density mrad mR Density mrad mR
0.005 15 10 0.135 410 320 0.010 35 25 0.140 420 330 0.015 50 35 0.145 440 340 0.020 70 55 0.150 455 355 0.025 85 70 0.155 470 365 0.030 100 85 0.160 485 375 0.035 115 100 0.165 500 385 0.040 130 110 0.170 515 400 0.045 145 120 0.175 525 410 0.050 160 130 0.180 540 420 0.055 175 140 0.185 555 430 0.060 185 150 0.190 570 445 0.065 205 165 0.195 585 455 0.070 220 175 0.200 600 465 0.075 235 185 0.205 615 475 I~
0.080 250 195 0.210 630 485 0.085 265 210 0.215 645 500 0.090 280 220 0.220 660 510 0.095 295 230 0.225 675 520 0.100 310 240 0.230 690 530 0.105 325 255 0.235 705 540 0.110 335 265 0.240 720 555 0.115 350 275 0.245 735 565 0.120 365 285 0.250 745 575 0.125 380 300 0.255 760 585 0.130 400 310 0.260 775 600
4.6
Calibration curves were also available to determine dose from various ~ qualities of x- and gamma rays and, to a certain extent, mixtures of .these
radiations. However, with the two-element dosimeter there was no method for distinguishing between mixtures of beta radiation and x-ray or gamma radiation for photon energies below 200 keV.
4.2 PERSONNEL NEUTRON FILM DOSIMETER USED FROM 1950 TO 1958
In the personnel neutron film dosimeter used from 1950 to 1958, EastmanKodak NTA film was enclosed in the two-element dosimeter holder along with the beta/photon film. The emulsion was approximately 25 pm thick. Dose evaluation was based upon a direct comparison of the number of tracks observed on the personnel film with a calibration curve showing track density as a function of neutron dose. Over the years, several different neutron-emitting sources were used to calibrate the film including RaBe (1944), PoB (1944), PoBe (1950), positive ion accelerator (1955), and PuF4 (1958), where the year of first use is shown in parentheses. Watson (1951) provides an overview of several characteristics of NTA film, including energy dependence, number of tracks, track length, emulsion thickness, fading, and fields of view, which are important to the use of the NTA personnel neutron dosimeter at Hanford.
During the early years at Hanford, the personnel neutron film was routinely calibrated alternately with a RaBe or a PoB source. For example, the film was calibrated to a PoB source emitting on the order of 108 neutrons per second. The film was placed in the Hanford two-element dosimeter during exposure. The sensitivity of the NTA emulsion was approximately 6.86 • 0.53 x 10⁻⁴ tracks/neutron-cm2. Measurement of the slow neutron sensitivity was made by exposing cadmium-wrapped and bare films to graphite-moderated neutrons from a PoB source. The sensitivity of the same emulsion was 2.29 • 0.19 x 10⁻⁵ tracks/slow neutron-cm2.
Watson (1951) reported a precision of 30% for measuring 1.4 x 10⁵ fast neutrons/cm2 using routine procedures, and also discussed certain aspects of the routine assessment of personnel neutron dose in a letter in 1956,(a) stating that Hanford routinely uses 120 fields to evaluate neutron dose.
(a) Watson, E. C. 1956. "Fast Neutron Monitoring. 11 Letter to A. R. Keene, ~ dated October 16, 1956.
4.7
Typically, if a larger-than-expected number of tracks was observed, 400 fields are viewed in order to more accurately detennine the dose. The PoB source was ~ used for routine calibration until the use of the positive ion accelerator was implemented. Neutron energies for both the PoB and positive ion accelerator are less than for PoBe. Apparently, it was also the practice to require a minimum number of observed tracks before dose was detennined.
Watson also discussed aspects of neutron dose assessment in a letter in 1950.(a) The standard practice apparently involved three independent observations of the total number of tracks for 40 fields. If the total observed tracks was less than 60, then no further assessment was conducted. Assuming 60 tracks or more were observed per 40 fields, then the results could be interpreted in tenns of mrep (milliroentgen-equivalent-physical) of PoB equivalent.
4.3 MULTI-ELEMENT BETA/PHOTON FILM DOSIMETER USED FROM 1957 TO 1962
The first Hanford multi-element dosimeter incorporated a four-filter system to more accurately interpret exposure from various energy ranges of gamma radiation. The design of this dosimeter is described in Section 2.3. ~
This dosimeter incorporated two additional filters, composed of silver and aluminum, in addition to the open window and 1-mm-thick silver filter used in the two-element dosimeter. The 0.13-mm thin silver and 0.49-mm aluminum shields were equal in mass per unit area for beta equivalency but were decidedly different in absorption qualities for x-ray or low-energy gamma radiation (Kocher 1957b). The evaluation (Wilson et al. 1960) of gamma dose could be made to a limited extent even in the presence of beta radiation. This capability to provide dose interpretation in mixed radiation fields was a major improvement in personnel dosimetry.
From 1951 to 1957 calibrated film sets were routinely prepared using the irradiations identified in Table 4.5. The film densities for these multielement dosimeters were used to prepare calibration data for use in dose detennination. A quick detennination of the beta and gamma dose from the
(a) Watson, E. C. 1950. "Suggested Revisions of Neutron Metering Program." Letter to H. A. Meloney, dated September 1, 1950. ~
4.8
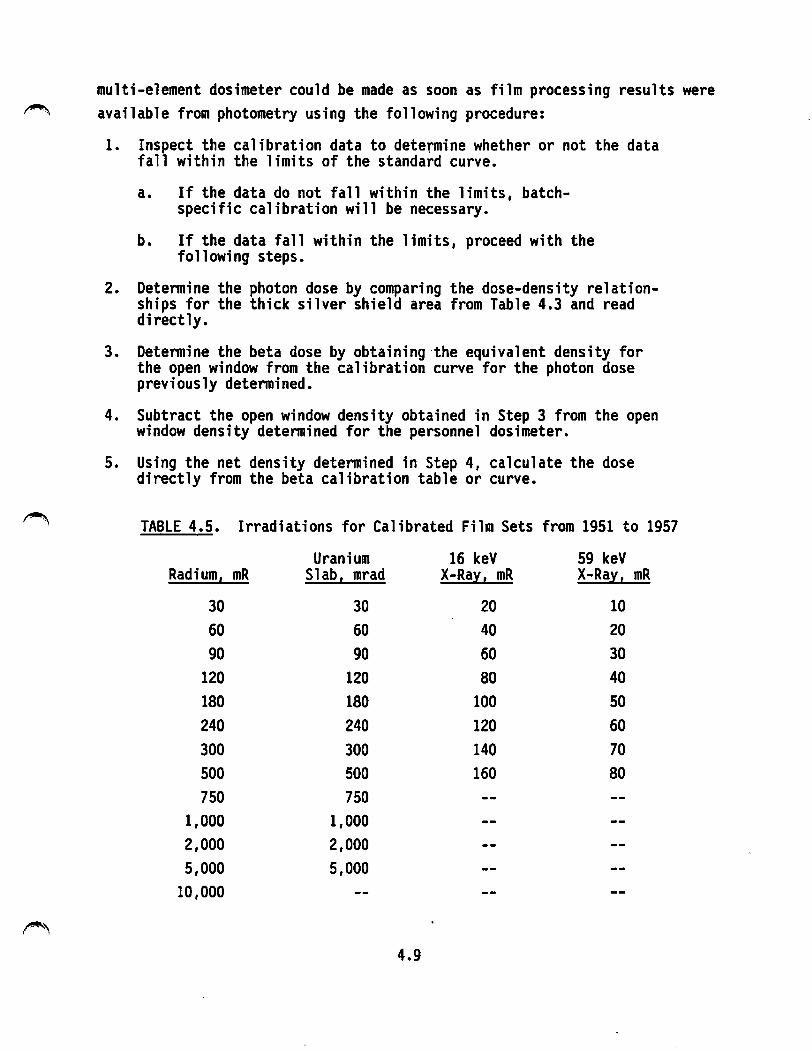
~
~
multi-element dosimeter could be made as soon as film processing results were available from photometry using the following procedure:
1. Inspect the calibration data to determine whether or not the data fall within the limits of the standard curve.
a. If the data do not fall within the limits, batchspecific calibration will be necessary.
b. If the data fall within the limits, proceed with the following steps.
2. Detennine the photon dose by comparing the dose-density relationships for the thick silver shield area from Table 4.3 and read directly.
3. Detennine the beta dose by obtaining the equivalent density for the open window from the calibration curve for the photon dose previously detennined.
4. Subtract the open window density obtained in Step 3 from the open window density detennined for the personnel dosimeter.
5. Using the net density detennined in Step 4, calculate the dose directly from the beta calibration table or curve.
TABLE 4.5. Irradiations for Calibrated Film Sets from 1951 to 1957
Uranium 16 keV 59 keV Radium, mR Slab 1 mrad X-Ray 1 mR X-Ra~I mR
30 30 20 10 60 60 40 20 90 90 60 30
120 120 80 40
180 180 100 50 240 240 120 60 300 300 140 70 500 500 160 80 750 750
1,000 1,000 2,000 2,000 5,000 5,000
10,000
4.9
The initial Hanford method for calibrating the multi-element film dosimeter involved each calibration set being fitted to a linear curve by the least-squares method using the IBM 702 computer that was introduced into routine use in 1957. This method was entirely adequate because the DuPont 502 emulsion response was essentially linear for the density values used in routine dose calculations. When the more sensitive DuPont 508 emulsion was introduced in 1960, the calibration data were fit to a cubic equation. Fitting the data to a cubic equation provided an "S" curve, which more closely simulated the actual DuPont 508 film response at low exposures to gamma radiation. The formula used in this calibration method, which is based on a system of simultaneous equations, is described in Appendix A.
4.4 MULTI-ELEMENT NEUTRON FILM DOSIMETER USED FROM 1958 TO 1972
A separate multi-element neutron dosimeter was introduced in 1958 (Swanberg 1959). The appearance of this dosimeter differed only slightly from the beta/photon film dosimeter. The thickness of the holder was increased 0.1 in. to permit replacement of old materials with new, more suitable filter materials and room for two film packets. Cadmium and tin were chosen for shield materials because of their similar x-ray and ganuna ray mass absorption coefficients and their different thermal neutron absorption cross sections (high for cadmium, low for tin), thus permitting a measurement of the thermal neutron dose to be made by comparing densities under the two filters. The prompt gamma coincident with a neutron capture in the cadmium is recorded as darkening of the film behind the cadmium shield. Gamma rays experience nearly equal attenuation in either cadmium or tin. The diffe~ence in darkening behind the cadmium and tin shields was found to be a direct measure of the slow neutron exposure. In addition, the gamma ray attenuation of these two elements compares well with silver, which was the shield material selected for the beta/photon film dosimeter. The comparable attenuation provided excellent correlation of gamma dose between the tin shields of the neutron dosimeter and the silver shield of the beta/photon dosimeter.
The film for fast neutrons was calibrated using the PuF4 source as follows:
1. Film was exposed to a dose of 1.075 rem computed as the firstcollision dose. The average film response yielded 71.24 * 13.51
4.10
·~ r \
2.
tracks per 40 fields of view--equivalent to a 1075-mrem exposure with a 95% confidence interval (Swanberg 1959).
Interpretation of personnel NTA film after processing was accomplished by counting microscopically the tracks produced in· the emulsion by recoil protons. A field of view of 1/129 cm2 was viewed under 970X magnification with oil i11111ersion.
3. Each of three observers counted the tracks occurring in 40 fields of view (i.e., a total of 120 fields).
4. Films that indicated a significant increase in the number of tracks relative to background were viewed for a total of 400 fields. A 90% confidence interval of the tracks per 40 fields was constructed.
5. The upper limit of the count for personnel films was compared with the lower limit of the calibration films for similar intervals of tracks per 40 fields per 300 mrem. The ratio of the limits multiplied by 300 mrem was entered into the personnel exposure record.
In January 1965 NTA film was calibrated on-phantom.
Routine calibration of the neutron dosimeter response to slow neutron exposure required approximately 6 days (i.e., 40 hours) using the sigma pile with a PuBe source traceable to NBS. To alleviate this time-consuming process, measurements were conducted to relate film darkening from radium to an equivalent darkening from the sigma pile exposures. Interpretation of slowneutron dose involved three steps, as follows:
1. Obtain the net difference in optical density behind the cadmium (thermal and fast-neutron response) and tin filters (fast-neutron response).
2. Obtain a radium equivalent dose from the calibration curve (e.g., radium ga11111a exposure in millirem behind the silver shield for the beta/photon dosimeter).
3. Divide the radium dose by a factor of 1.940 * 0.056 to convert to the slow neutron exposure in millirem.
The slow-neutron dose was entered into the personnel exposure record.
4.5 MULTI-ELEMENT BETA/PHOTON FILM DOSIMETER USED FROM 1962 TO 1972
In 1962 an upgraded Hanford multi-element beta/photon film dosimeter was implemented. This dosimeter was designed to take full advantage of mechanized processing. Each dosimeter contained a lead tape perforated with the
4.11
employee's payroll number; prior to removal of the film packet, the payroll number was x-rayed onto part of the film to provide positive identification. ~ Film identification and film packet exchange were performed mechanically by the dosimeter processing machine. The dosimeter was designed for use with the Hanford security credential in a neatly integrated badge assembly. The security credential could be removed from the holder by the wearer for easy exchange of only the dosimeter.
Both the iron and the tantalum filters were covered with 20-mil-thick Tenite II plastic to improve the energy response characteristics of the system. The filter system provided a linear density response within 10% for a given ga11111a radiation dose at any energy between 50 keV and 2 MeV (Kocher et al. 1971). For dose interpretation of a film dosimeter exposed to beta, gamma, and x-ray radiation, the density behind each of the four filters was measured. Dose components were determined for electromagnetic radiation between 50 keV and 2 MeV, electromagnetic radiation between 15 keV and 50 keV, and beta radiation (assuming a beta energy spectrum similar to that emitted by natural uranium). Dose interpretation methods for this dosimeter are described in Appendix B and are summarized as follows:
• Electromavnetic radiation from 50 keV to 2 MeV--The density behind the tanta um filter was caused by electromagnetic radiations with energies greater than 50 keV. This density could be directly related to the dose by use of an appropriate calibration curve.
• Electromagnetic radiation from about 15 keV to 50 keV--The densities behind the plastic filter and the iron filter resulted from electromagnetic radiation and beta radiation. The response characteristics of the filter system were chosen so that electromagnetic radiation energies greater than 50 keV and beta radiation produced equal densities behind each of these filters. For electromagnetic radiations with energies less than 50 keV, the iron filter had a significantly higher absorption coefficient than the plastic filter; consequently, the difference in density between the plastic and iron filters could be directly related to dose by using a calibration curve constructed for energies similar to those encountered by the dosimeter.
• Beta radiation--The densities behind the open-window and the plastic-filter areas resulted from electromagnetic radiation and beta radiation. Electromagnetic radiations with energies greater than 50 keV produced equal densities behind each of these filters. The difference in density between these two filters was a function of the low-energy (less than 50 keV) electromagnetic radiation dose
4.12
and the beta radiation dose. Because the low-energy electromagnetic radiation dose had been determined independently from the plastic and the iron-filter density difference, it was possible to correct the density difference observed between the open-window and the plastic-filter areas for the low-energy dose contributions by an appropriate calibration correction curve. After this correction was made, the remaining density difference between the open window and the plastic filter could be related to a beta calibration curve and the beta dose could be determined.
In addition to the normal range of dose evaluation, the new dosimeter had the capability of evaluating doses to an accuracy of within 10% from exposures to radium ganana radiations as well as plutonium and uranium metal radiations. These evaluation capability results were obtained by field testing (Kocher 1962). The dosimeter also contained foils and other dosimeter materials to measure the very high-level exposure from neutron and gamma radiations that may be encountered during a nuclear excursion. This dosimeter had the capability to measure gamma doses in the range of 15 mrem to 2000 rem with the sensitive and insensitive films (Baumgartner 1959a). Glass fluorods extended the gamma dose range to about 10,000 rem. An activation foil system using indium, cadmium-covered indium, copper, and sulfur provided an estimate
/"""'\ of neutron flux and spectra in the event of a serious radiation event radiation dose in the range of 1 rad to > 2000 rad.
4.6 MULTI-ELEMENT THERMOLUMINESCENT DOSIMETER USED FROM 1972 TO THE PRESENT
Calibration and dose algorithms for the multi-element TLD are described by Kocher et al. (1971) and Fix.Ca) The use of this system for beta, gamma, and neutron dosimetry is described by Haverfield, Nichols, and Endres (1972). The sources used since the inception of the albedo TLD until 1984 for each dose component are as follows:
• Noneenetrating--Several aged uranium disk sources are used, each equ1pped with a specially designed exposure jig. The response of the dosimeter to the uranium source is assumed to be equal to onehalf the response to an aged ''Sr source encapsulated in 10-mil aluminum (Fix et al. 1981). To calibrate the dosimeter readout, 10 dosimeters are exposed to 4 rad each on the uranium sources (equal to 2 rad of 9dSr).
(a) Fix, J. J. Draft. Hanford External Dosimetr Northwest Laboratory, Rlc and, Was 1ngton •
4.13
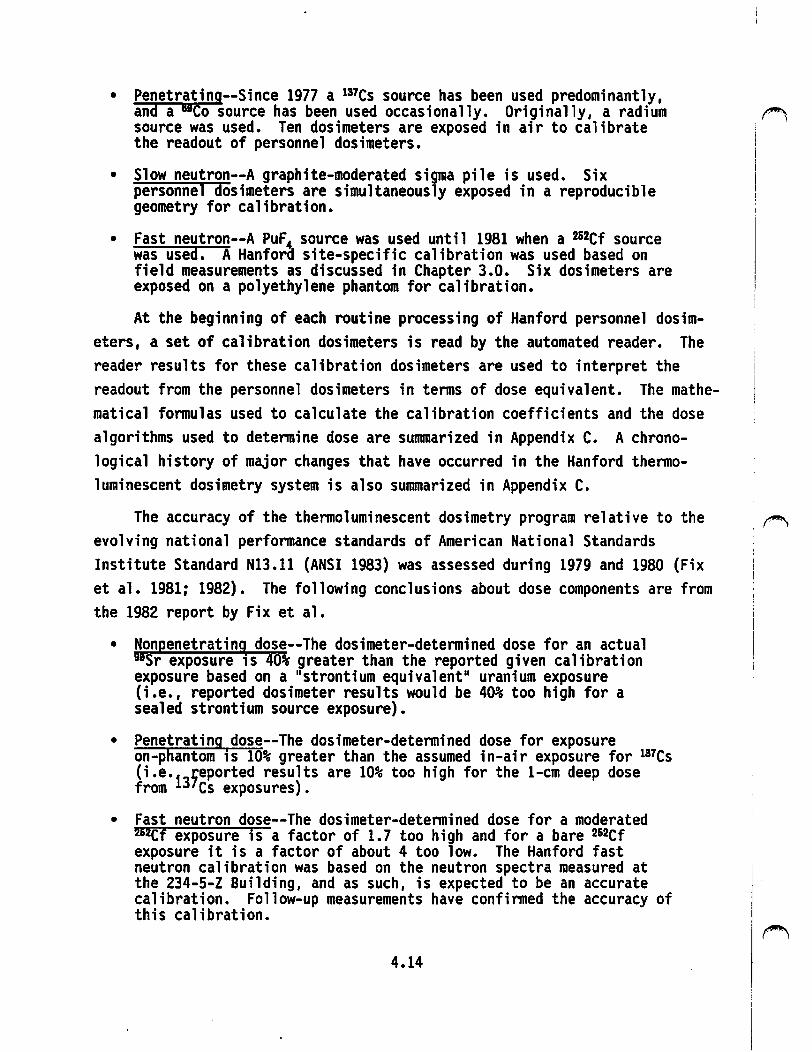
• Penetrating--Since 1977 a 1a1cs source has been used predominantly, and a nco source has been used occasionally. Originally, a radium source was used. Ten dosimeters are exposed in air to calibrate the readout of personnel dosimeters.
• Slow neutron--A graphite-moderated sigma pile is used. Six personnel dosimeters are simultaneously exposed in a reproducible geometry for calibration.
• Fast neutron--A PuF4 source was used until 1981 when a 2&2Cf source was used. A Hanford site-specific calibration was used based on field measurements as discussed in Chapter 3.0. Six dosimeters are exposed on a polyethylene phantom for calibration.
At the beginning of each routine processing of Hanford personnel dosimeters, a set of calibration dosimeters is read by the automated reader. The reader results for these calibration dosimeters are used to interpret the readout from the personnel dosimeters in terms of dose equivalent. The mathematical formulas used to calculate the calibration coefficients and the dose algorithms used to determine dose are sunanarized in Appendix C. A chronological history of major changes that have occurred in the Hanford thermo-1 uminescent dosimetry system is also summarized in Appendix C.
The accuracy of the thermoluminescent dosimetry program relative to the ~
evolving national performance standards of American National Standards Institute Standard Nl3.ll (ANSI 1983) was assessed during 1979 and 1980 (Fix et al. 1981; 1982). The following conclusions about dose components are from the 1982 report by Fix et al.
• Nonpenetratin~ dose--The dosimeter-determined dose for an actual Y•sr exposure 1s 40% greater than the reported given calibration exposure based on a "strontium equivalent" uranium exposure (i.e., reported dosimeter results would be 40% too high for a sealed strontium source exposure).
• Penetrating dose--The dosimeter-determined dose for exposure on-phantom is 10% greater than the assumed in-air exposure for 137Cs (i.e.
137eported results are 10% too high for the 1-cm deep dose
from Cs exposures).
• Fast neutron dose--The dosimeter-determined dose for a moderated 262Cf exposure is a factor of 1. 7 too high and for a bare 2&2cf exposure it is a factor of about 4 too low. The Hanford fast neutron calibration was based on the neutron spectra measured at the 234-5-Z Building, and as such, is expected to be an accurate calibration. Follow-up measurements have confirmed the accuracy of this calibration.
4.14

• Thennal neutron dose--No NBS~traceable source was available to compare the accuracy of this dose component. Also, ANSI N13.11 (ANSI 1983) does not include a thermal neutron exposure category. As such, the accuracy of this dose component was not evaluated.
Beginning in January 1984, several changes to the thennoluminescent dosimetry system were initiated. A chronological history of several of the changes is presented in Appendix C. Quality control was significantly enhanced by uniquely labeling each insert. Two inserts, one for even- and one for odd-exchange periods, were assigned to each pennanent employee. The history of dose determinations for each dosimeter was tracked by computer. Individually determined sensitivity factors were introduced based on the response of the chip in each dosimeter position to an exposure from 1-R 137cs gamma radiation. The precision of dose detennination was improved through the use of the chip sensitivity factors. Calibration exposures were made onphantom instead of in-air.
Effective September 1984, calibration coefficients were calculated based on the mean response of processed control dosimeters exposed to 1 R of 137cs gamma radiation as well as the mean response of unexposed background control
~ dosimeters. Effective January 1, 1987, the dose algorithm was changed to calculate shallow and deep dose components consistent with the recommendations of ANSI N13.ll (ANSI 1983). Calibration of the shallow dose component for the multipurpose dosimeter was changed to 16-keV fluorescent radiation. The shallow- and deep-dose components replaced the nonpenetrating and penetrating dose components used previously. With these changes the method of detennining the recorded personnel doses was changed (as shown in Table 4.1). A more detailed description of changes to the thennoluminescent dosimetry system is included in Chapter 7.0, as well as in Appendix C.
4.7 BETA/GAMMA FILM DOSIMETER CALIBRATION
Since the beginning of Hanford operations, radium has been used to calibrate the film dosimeter and pencil dosimeters used to measure gamma exposure. Film dosimeter calibration was conducted on a "Ouija board" similar to pencil dosimeters and other wooden jigs that positioned the film dosimeter at various distances from a source (see Figure 4.2). The distances were carefully measured to provide the various levels of exposure to produce a calibration set.
4.15
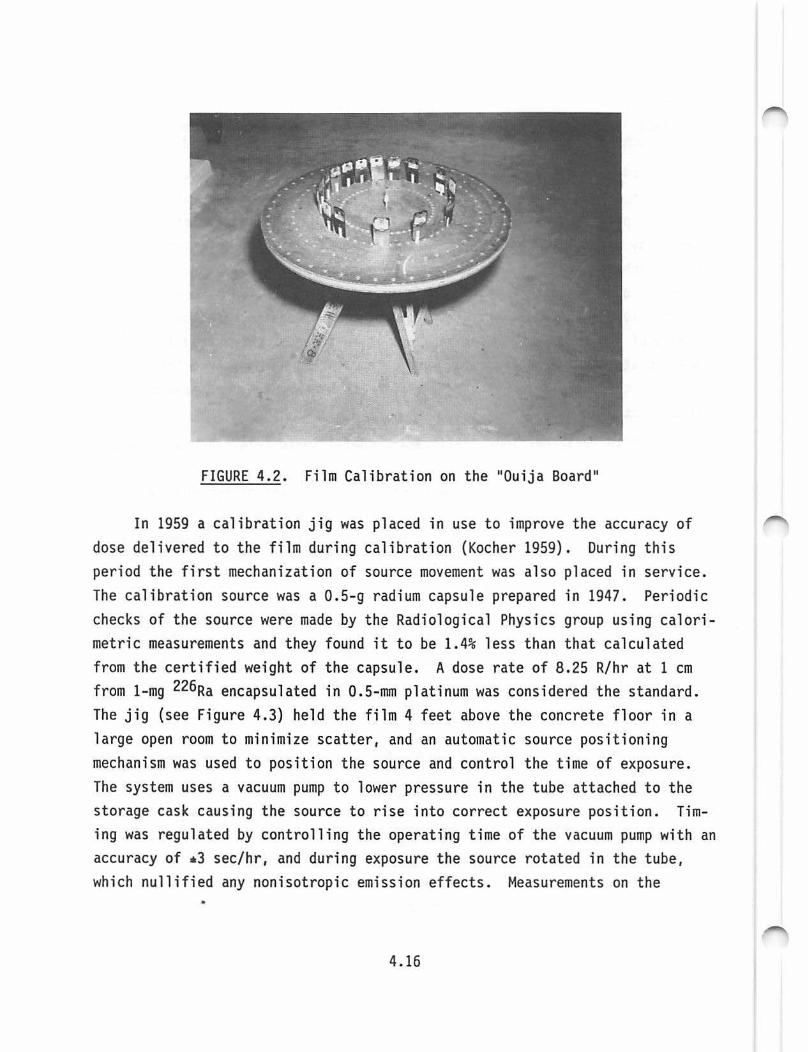
FIGURE 4.2. Film Calibration on the "Ouija Board11
In 1959 a calibration jig was placed in use to improve the accuracy of dose delivered to the film during calibration (Kocher 1959). During this period the first mechanization of source movement was also placed in service. The calibration source was a 0.5-g radium capsule prepared in 1947. Periodic checks of the source were made by the Radiological Physics group using calorimetric measurements and they found it to be 1.4% less than that calculated from the certified weight of the capsule. A dose rate of 8.25 R/hr at 1 cm from 1-mg 226Ra encapsulated in 0.5-mm platinum was considered the standard. The jig (see Figure 4.3) held the film 4 feet above the concrete floor in a large open room to minimize scatter, and an automatic source positioning mechanism was used to position the source and control the time of exposure. The system uses a vacuum pump to lower pressure in the tube attached to the storage cask causing the source to rise into correct exposure position. Timing was regulated by controlling the operating time of the vacuum pump with an accuracy of •3 sec/hr, and during exposure the source rotated in the tube, which nullified any nonisotropic emission effects. Measurements on the
4.16
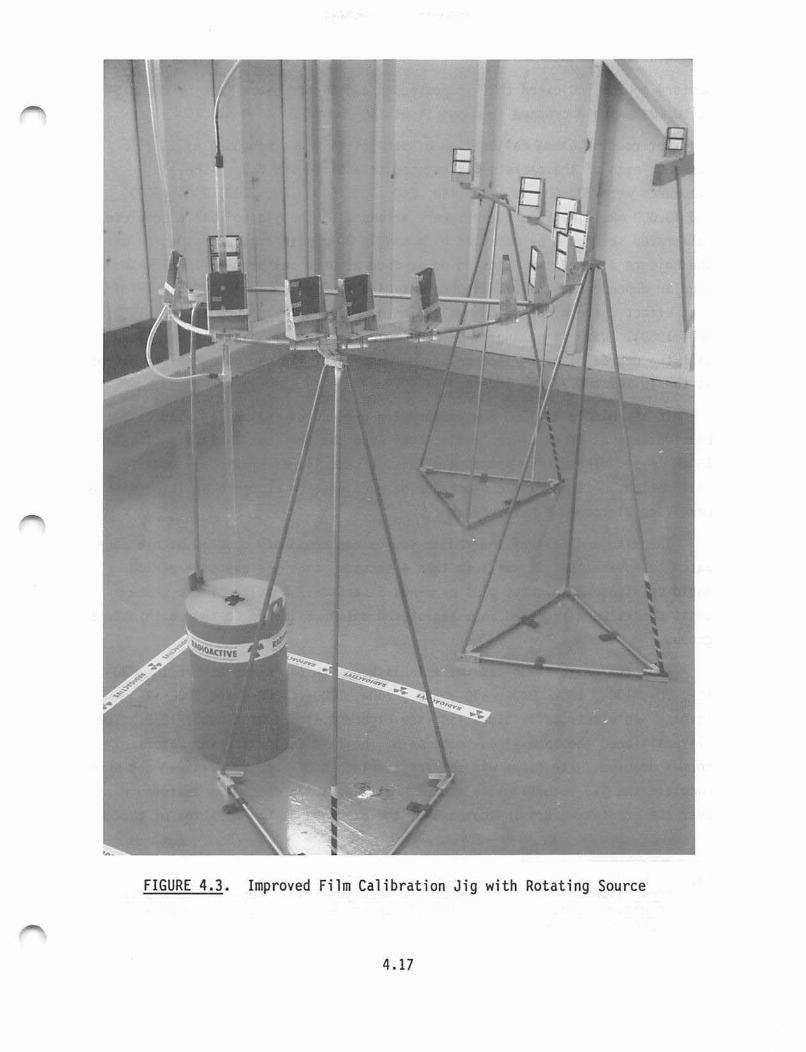
FIGURE 4.3. Improved Film Calibration Jig with Rotating Source
4.17
Hanford source indicated that it possessed a nonisotropic effect of about 5% at 10 cm, which decreased to about 1% at 100 cm.(a) !~
For routine ganvna calibration a "set" of film was composed of 13 film packets; each of the packets was exposed to a different dose. The 13 exposures were 30, 60, 90, 120, 180, 240, 300, 500, 750, 1000, 2000, 5000, and 10,000 mR. The film packets were arranged on the jig so that a complete calibrated set could be obtained by a single 20-minute exposure. Design of the holders allowed two films to be exposed at each calibration level. The angular dependence of film response was also studied extensively to detennine what effect there might be on evaluation of personnel exposure (Little 1960; Nees 1969). With large angles perpendicular to the film plane it was found that the degree of over-response was a function of the photon energies, except at the 16-keV and 23-keV levels.
In the middle of 1965 new calibration procedures called for film calibration sets at 14 exposure levels; they were the previous 13 levels plus the 15-mR level. These were prepared using the same jig as previously used for calibrations, with periodic checks being made at each exposure position with a certified Victoreen R-Meter chamber.
The rise and fall of the radium source was routinely checked with a stop watch to assure that it was less than 4 seconds, thus the exposure period would be within 20 minutes plus or minus 5 seconds. Results of the these audit checks were recorded in a regist"ered notebook issued to the Calibrations group.
The beta calibration set was established with exposures at the 15-, 30-, 60-, 90-, 120-, 180-, 240-, 300-, 500-, 750-, 1000-, 1800-, and 5000-mR levels. An electrically timed jig (see Figure 4.4) was used until 1972. The jig positioned the open window portion of the film dosimeter over wafers of nonnal uranium. The timer was set for the length of exposure desired and when complete the jig automatically opened. Extrapolation chamber measurements over the uranium wafers indicated that the exposure at the position of the
(a) C. G. Hough, G. A. Little, and W. L. Nicholson. 1959. Radiation Protection Operation Precision and Accuracy Studf; Non-Isotrop1c Effect in Radium Gamma Source. Internal report, Genera Electric Company, Richland, Washington. , ~
I
4.18
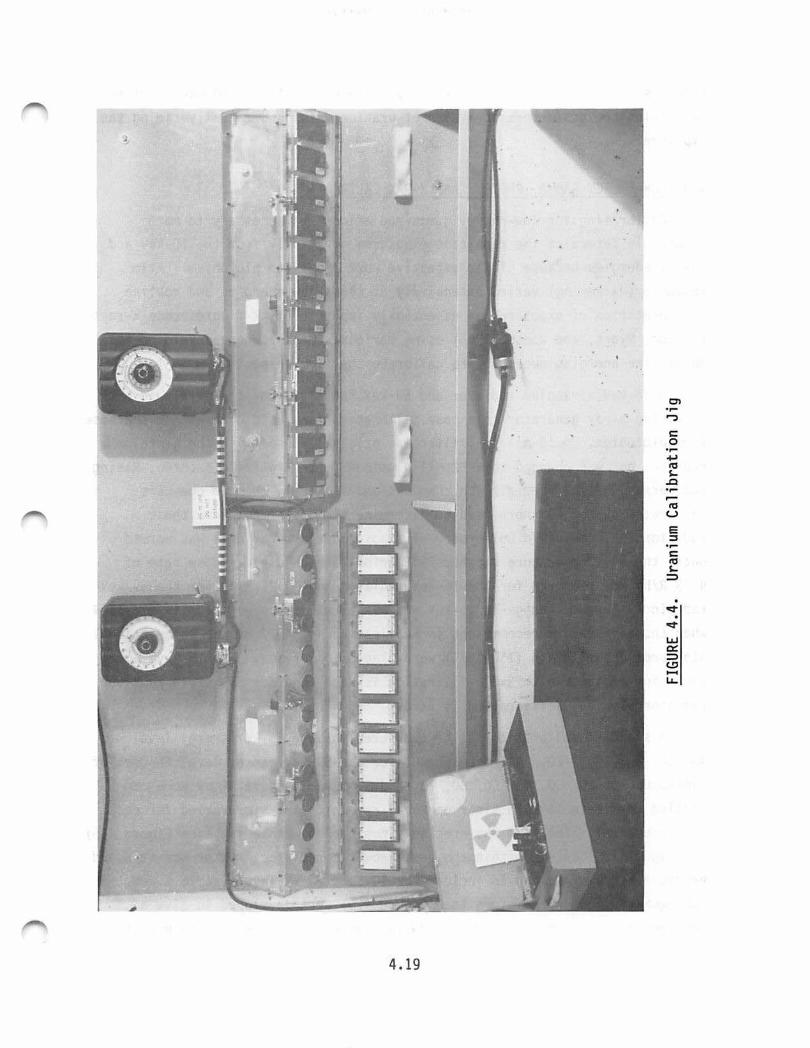
4.19
.,... ....., c: 0 .,...
.,...

film was about 225 mrad/hr. Previously, beta calibrations had been perfonned by placing the dosimeters on a slab of uranium metal and manually timing the exposure.
4.8 LOW-ENERGY GAMMA, PHOTON, AND X-RAY CALIBRATION
Calibrating for low-energy gaD111a radiations was necessary to more accurately detennine the resultant exposures, primarily from the 16-keV and 59-keV energies because of the extensive work done with plutonium. Film response (darkening) varied extensively at these low energies and routine interpretation of exposure was essentially impossible. K-fluorescence x-rays (Larson, Myers, and Roesch 1955) using various radiators were developed to obtain the energies necessary to calibrate the film response.
A 16-keV zirconium radiator and 59-keV tantalum radiator were used with a 220-Kvp x-ray generator to expose calibration film used to evaluate the dose from plutonium. A 16-mil tin filter was originally used with the tantalum radiator but was changed to a 32-mil aluminum filter in 1970 (Kathren, Rising, and Larson 1971). Free air ion chambers and Victoreen thimble chambers calibrated by the NBS were used to determine the dose rates from these radiators. To maintain uniformity of exposure, the x-ray unit was wanned until the oil temperature reached 75°F prior to each use. A dose rate of 4.79 R/hr was measured for the 16-keV radiator and 70.2 mR/hr for the 59-keV radiator. Another change in 16-keV and 59-keV radiators was made in mid-1984 when those radiators reconvnended in Publication No. 4037 of the International Standards Organization (ISO 1979) were placed in service. For 16 kev, a zirconium radiator with SrC03 filtration is used, and for 59 keV, a tungsten radiator with Yb203 filtration is used.
A standard calibration set of exposures for the 16-keV energy level was 40, 60, 80, 100, 120, 140, and 160 mR; for the 59-keV energy level the set of exposures was 20, 30, 40, 50, 60, 70, and 80 mR. Exposure times were control led to within 1% by a timer on the x-ray unit; the time varied for each exposure level. The film was precisely positioned with a jig (see Figure 4.5) at a specific location within the beam from the radiator. Later the standard exposure set was changed to include the 10- and 20-mR levels at 16.1 keV. Subsequently, other radiators (see Figure 4.6) were developed to give a broader range of energies for calibrating dosimeters. The routine use of f""1'..
4.20
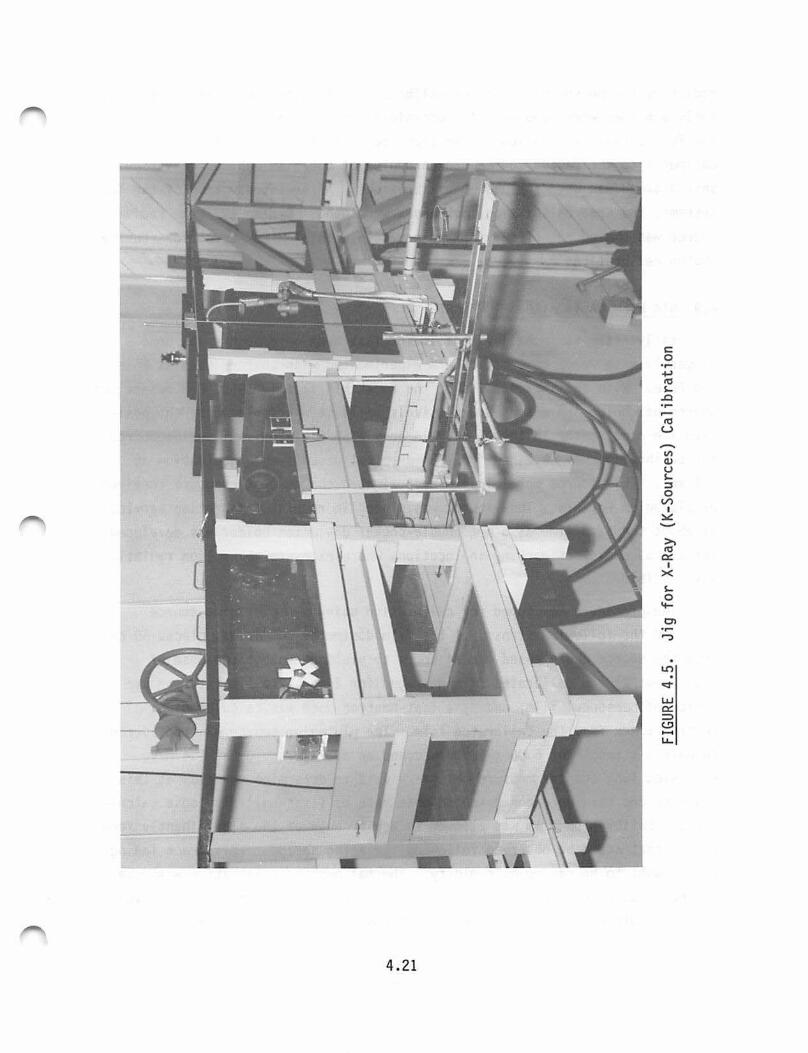
4.21
c: 0
.,...
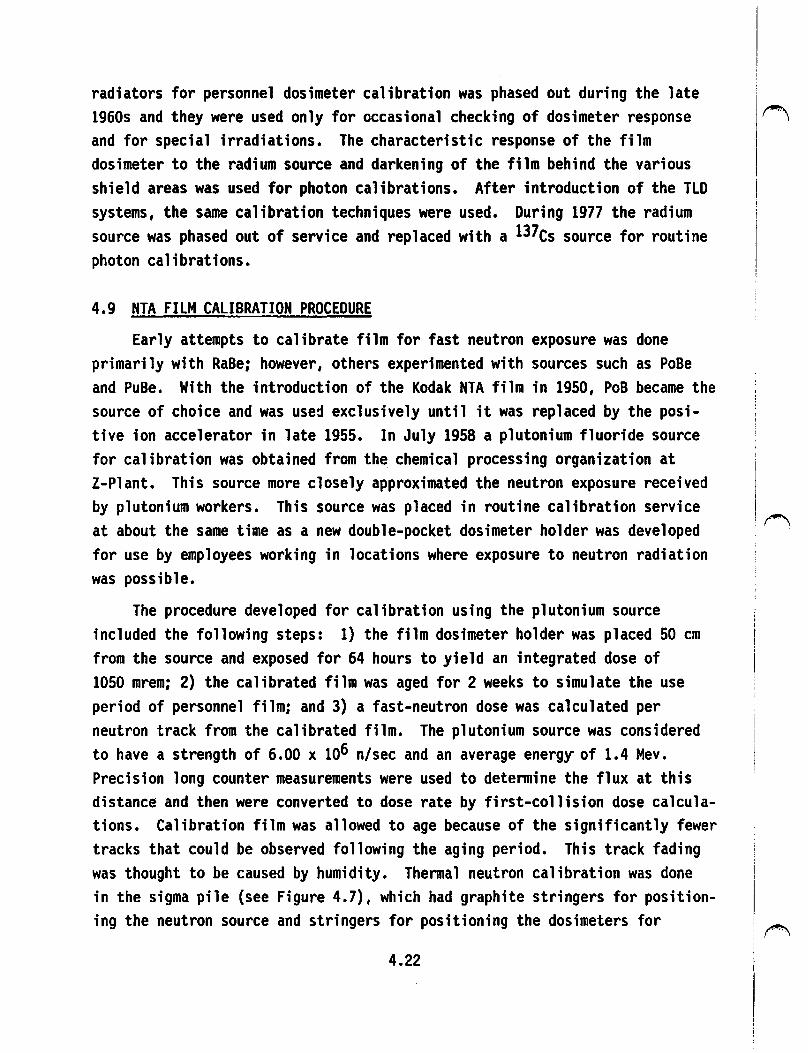
radiators for personnel dosimeter calibration was phased out during the late 1960s and they were used only for occasional checking of dosimeter response and for special irradiations. The characteristic response of the film dosimeter to the radium source and darkening of the film behind the various shield areas was used for photon calibrations. After introduction of the TLD systems, the same calibration techniques were used. During 1977 the radium source was phased out of service and replaced with a 137cs source for routine photon calibrations.
4.9 NTA FILM CALIBRATION PROCEDURE
Early attempts to calibrate film for fast neutron exposure was done primarily with RaBe; however, others experimented with sources such as PoBe and PuBe. With the introduction of the Kodak NTA film in 1950, PoB became the source of choice and was used exclusively until it was replaced by the positive ion accelerator in late 1955. In July 1958 a plutonium fluoride source for calibration was obtained from the chemical processing organization at Z-Plant. This source more closely approximated the neutron exposure received by plutonium workers. This source was placed in routine calibration service at about the same time as a new double-pocket dosimeter holder was developed for use by employees working in locations where exposure to neutron radiation was possible.
The procedure developed for calibration using the plutonium source included the following steps: 1) the film dosimeter holder was placed 50 cm from the source and exposed for 64 hours to yield an integrated dose of 1050 mrem; 2) the calibrated film was aged for 2 weeks to simulate the use period of personnel film; and 3) a fast-neutron dose was calculated per neutron track from the calibrated film. The plutonium source was considered to have a strength of 6.00 x 10⁶ n/sec and an average energy· of 1.4 Mev. Precision long counter measurements were used to detennine the flux at this distance and then were converted to dose rate by first-collision dose calculations. Calibration film was allowed to age because of the significantly fewer tracks that could be observed following the aging period. This track fading was thought to be caused by humidity. Thennal neutron calibration was done in the sigma pile (see Figure 4.7), which had graphite stringers for positioning the neutron source and stringers for positioning the dosimeters for
4.22
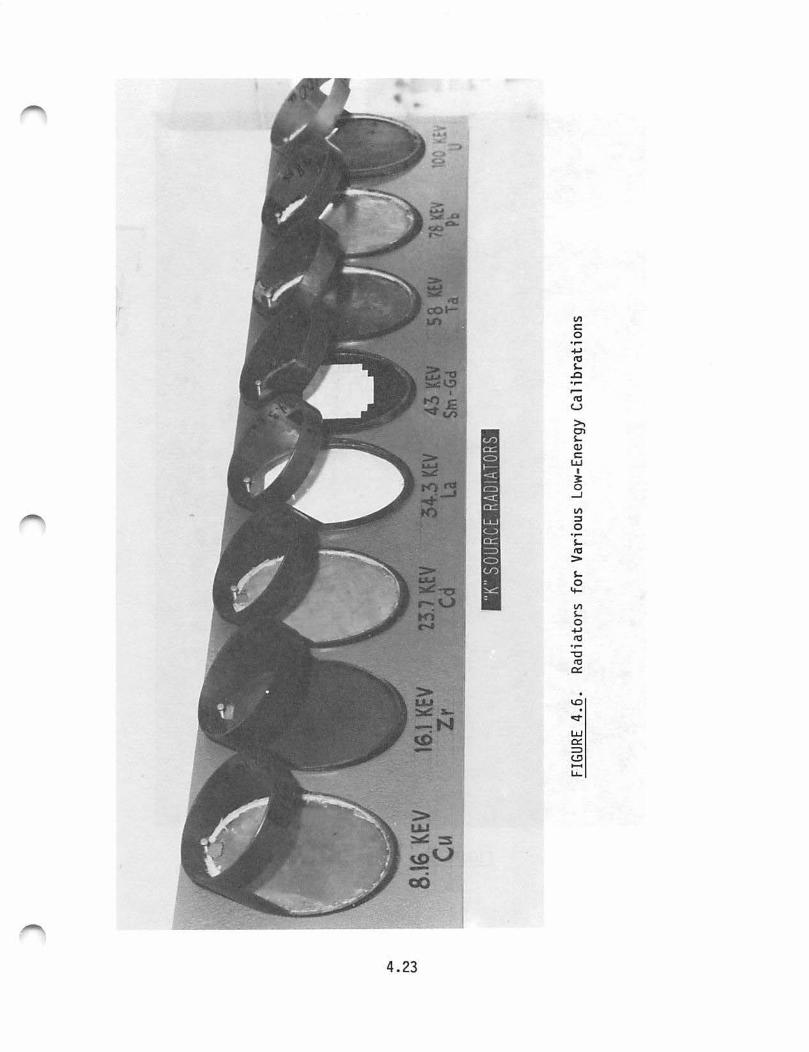
4.23
Vl c: 0 .,...
.,... ,..... tt3 u >. en s... Q) c:
LU I 3: 0
.....J
Vl ::s 0 .,... s... tt3 > s... 0
'+-
l.O .

FIGURE 4.7. Sigma Pil e
4.24
calibration. Gold foils were used to calibrate the positions for dosimeter placement.
Starting in January 1965 calibration of NTA film was done with the film dosimeter being placed on a phantom simulating the human body. This arrangement more closely measured the backscatter that affected the film and radiation dose received. When the TLD was introduced in 1972, it was calibrated in the same manner. In 1981 a 252cf source replaced plutonium fluoride for routine neutron calibration. This change eliminated the potential problems of handling and storing a large plutonium source.
4.25
CHAPTER 5.0
DOSIMETER QUALITY CONTROL PROGRAMS

...
! I .,
! ' ' f.
i
! i ; ·' I
I n
l I !
l '
5.0 DOSIMETER QUALITY CONTROL PROGRAMS
The accuracy and reliability of radiation exposure measurements and records have been important from the very beginning of the radiation protection program at Hanford. At the inception of the Manhattan Project, the limitations in knowledge and available capabilities in personnel dosimetry were well recognized. Dosimetry techniques were actively shared between U.S. laboratories. Many controls and checks were introduced immediately into the routine programs to provide assurance of the dosimeter capability to measure and record radiation exposure to personnel. A program was started almost immediately at Hanford for research and development within the Health Instruments (HI) Section that was formed in 1944 to improve radiation protection programs. Throughout the ensuing years, numerous quality control assessments, special evaluations, and laboratory intercomparisons were conducted to better determine and, if possible, upgrade the quality of personnel dose estimates. Program practices and improvements, although well-known to people intimately familiar with the program, were not always formally documented. The authors have summarized information in this chapter from many, but certainly not all,
.~ studies of program practices. Conclusions presented are those of the original authors. No attempt has been made in this chapter to evalaute these conclusions.
5.1 ROUTINE QUALITY CONTROL PROGRAMS
Quality control programs have been in place since the inception of Hanford operations. Over time, procedures have been adopted to better ensure the quality of dosimeter processing, dose assessment, and recording. Administrative reviews were conducted of elements of the dosimetry program. Dosimeter calibration was based on the exposure of dosimeters to known levels of radiation. Audit dosimeters, consisting of known levels of dose, were routinely processed along with personnel dosimeters.
5.1.1 Early Reviews of Dosimeter Records
Early audits (Parker 1945) of the film dosimeter records identified less than 1 error per 1000 entries, even with all of the manual handling and recording of these results. Most of these errors occurred in what was called the 11 Rover 11 series; these were dosimeters assigned to certain workers who
5.1

worked in as many as seven different work locations at one time. Such assign-ments resulted in seven dosimeters being processed each week for one person ~ whether they were used or not.
5.1.2 Film and Pencil Dosimeter Control
Film packets used in the personnel film dosimeters were ordered in small lots of about 300 boxes. Specifications required that all of the film packets in each shipment be from the same emulsion lot. Each order usually covered about a 3-month operation (approximately 45,000 film packets). The film packets were kept in refrigerated storage until they were used. Each of the 300 boxes was sampled; one packet from the top, middle, and bottom was removed for immediate processing to determine background density. These control procedures were carefully followed during the period when film was used as the primary personnel dosimeter at Hanford.
Whenever film dosimeters were exchanged for processing by the dosimeter crews, they were routinely monitored for signs of external contamination or physical damage. Pencil dosimeters were routinely exposed to a given amount of radiation to verify that they were responding properly and they were also examined for physical damage. Any film or pencil dosimeter suspected of being r---..., damaged or not responding properly was removed from service for repair or replacement according to established personnel dosimeter procedures (Hart 1946~ 1967).
In 1962 a system was initiated that would detect whether or not calibration film was exposed to any extraneous radiation during its storage and exposure in the 3745 Calibrations Building. Film packets called "calibration blanks 11 were used to measure the radiation background and extraneous exposure to calibration sources. The blanks were kept with the film sets at all times, except during exposure to a calibration source, and were processed at the same time as the calibration set to determine whether or not the film had received any measurable stray radiation. This control was temporarily dropped during the transition to thermoluminescent dosimetry, but was reinstated shortly thereafter to check for stray radiation effects.
5.1.3 Audits of Nuclear Track Emulsion Film Dosimeter Density Readings
In a 1951 report, Watson discussed the practice of training technicians and evaluating their performance in the determination of tracks for Eastman- ~
5.2
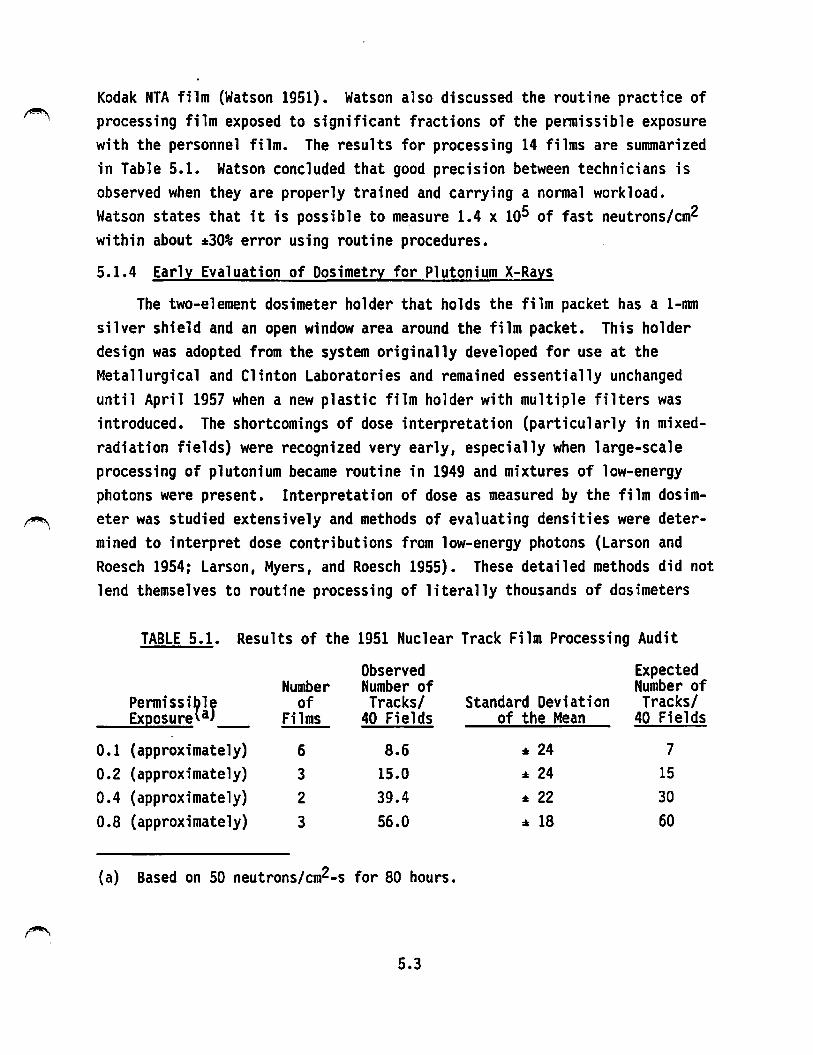
Kodak NTA film (Watson 1951). Watson also discussed the routine practice of processing film exposed to significant fractions of the permissible exposure with the personnel film. The results for processing 14 films are summarized in Table 5.1. Watson concluded that good precision between technicians is observed when they are properly trained and carrying a normal workload. Watson states that it is possible to measure 1.4 x 10⁵ of fast neutrons/cm2 within about •30% error using routine procedures.
5.1.4 Early Evaluation of Dosimetry for Plutonium X-Rays
The two-element dosimeter holder that holds the film packet has a 1-mrn silver shield and an open window area around the film packet. This holder design was adopted from the system originally developed for use at the Metallurgical and Clinton Laboratories and remained essentially unchanged until April 1957 when a new plastic film holder with multiple filters was introduced. The shortcomings of dose interpretation (particularly in mixedradiation fields) were recognized very early, especially when large-scale processing of plutonium became routine in 1949 and mixtures of low-energy photons were present. Interpretation of dose as measured by the film dosim-
~ eter was studied extensively and methods of evaluating densities were determined to interpret dose contributions from low-energy photons (Larson and Roesch 1954; Larson, Myers, and Roesch 1955). These detailed methods did not lend themselves to routine processing of literally thousands of dosimeters
TABLE 5.1. Results of the 1951 Nuclear Track Film Processing Audit
Observed Expected Number Number of Number of
Permissi~lf of Tracks/ Standard Deviation Tracks/ Exposure a _ Films 40 Fields of the Mean 40 Fields
0.1 (approximately) 6 8.6 • 24 7 0.2 (approximately) 3 15.0 "' 24 15 0.4 (approximately) 2 39.4 "' 22 30 0.8 (approximately) 3 56.0 ,. 18 60
(a) Based on 50 neutrons/cm2-s for 80 hours.
5.3
each week. If densities measured on the film indicated an unusual and/or high exposure, a detailed analysis would be made to provide the best estimate of . ~ exposure.
In 1957 Keene discussed the history of low-energy x-ray dosimetry problems at the plutonium finishing facility.(a) Investigations had been initiated in 1949 to determine which radiations existed in this·facility and to determine the accuracy of the film dose measurements. Early investigations focused on the effect of the low-energy x-rays on the open window and silver-shielded portions of film for the two-element dosimeter. Errors, particularly for the open window area, were estimated to be as much as a factor of 2 in extreme cases. Keene concluded that the present interpretation of the film dosimeter results was correct, assuming that no beta radiation was present.
Later, Watson provided an analysis of the low-energy x-ray dose history for approximately 20 selected employees who worked at the 234-5 Building from 1953 through 1956.(b) This analysis indicated that the soft x-ray component of the annual dose for these individuals increased continuously during this time period. Watson's analysis of the low-energy x-ray component of the total ~
dose is summarized in Table 5.2. While Watson did not provide any reasons for the increase, his analytical effort did underscore the continuing review of the two-element dosimeter to properly record x-ray exposures.
During. 1957 the first multi-element beta/photon film dosimeter was introduced at Hanford. At the same time, the concept of treating the lowenergy x-ray as a nonpenetrating radiation was introduced.(c) The combination of these changes was estimated by Watson to .result in a significant reduction in recorded nonpenetrating exposure. The effect of these changes was examined for selected personnel working in the 234-5-Z Building. Watson also discussed the improvements in 1958 with the introduction of the first multi-element neutron film dosimeter, which permitted measurement of slow and
(a) Keene, A. R. 1957. "Exposure Problem 234-5 Building. 11 Letter to G. E. Backman, dated February 12, 1957.
(b) Watson, E. C. 1957a. 11 234-5 Exposure Histories." Letter to A. R. Keene, dated February 22, 1957.
(c) Watson, E. C. 1958. "CPD Measurements Data--1958. 11 Letter to A. R. Keene, dated December 30, 1958. 1~
5.4
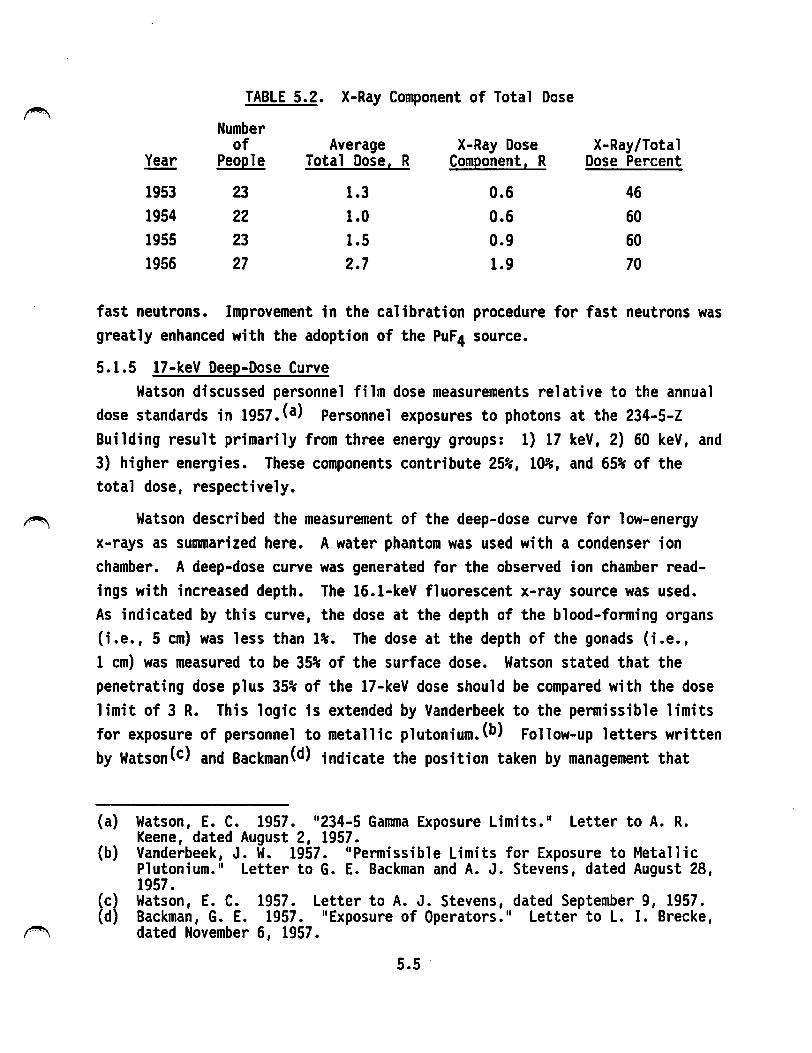
~ TABLE 5.2. X-Ray Component of Total Dose
Number of Average X-Ray Dose X-Ray/Total
Year People Total Dose, R Component, R Dose Percent
1953 23 1.3 0.6 46 1954 22 1.0 0.6 60 1955 23 1.5 0.9 60 1956 27 2.7 1.9 70
fast neutrons. Improvement in the calibration procedure for fast neutrons was greatly enhanced with the adoption of the PuF4 source.
5.1.5 17-keV Deep-Dose Curve Watson discussed personnel film dose measurements relative to the annual
dose standards in 1957.(a) Personnel exposures to photons at the 234-5-Z Building result primarily from three energy groups: 1) 17 keV, 2) 60 keV, and 3) higher energies. These components contribute 25%, 10%, and 65% of the total dose, respectively.
Watson described the measurement of the deep-dose curve for low-energy x-rays as sunvnarized here. A water phantom was used with a condenser ion chamber. A deep-dose curve was generated for the observed ion chamber readings with increased depth. The 16.1-keV fluorescent x-ray source was used. As indicated by this curve, the dose at the depth of the blood-forming organs (i.e., 5 cm) was less than 1%. The dose at the depth of the gonads (i.e., 1 cm) was measured to be 35% of the surf ace dose. Watson stated that the penetrating dose plus 35% of the 17-keV dose should be compared with the dose limit of 3 R. This logic is extended by Vanderbeek to the permissible limits for exposure of personnel to metallic plutonium.Cb) Follow-up letters written by WatsonCc) and BackmanCd} indicate the position taken by management that
(a) Watson, E. C. 1957. 11 234-5 Gamma Exposure Limits. 11 Letter to A. R. Keene, dated August 2, 1957.
(b) Vanderbeek, J. W. 1957. "Permissible Limits for Exposure to Metallic Plutonium." Letter to G. E. Backman and A. J. Stevens, dated August 28, 1957.
(c) Watson, E. C. 1957. Letter to A. J. Stevens, dated September 9, 1957. ( d) Backman, G. E. 1957. 11 Exposure of Operators. 11 Letter to L. I. Brecke,
~ dated November 6, 1957.
5.5
the total dose should be kept less than the 3-R/yr limit. This study appar-ently confirmed the Hanford practice of adding 35% of the x-ray dose to the ~ penetrating dose to determine the whole body· dose recorded for each employee.
5.1.6 Examination of Film for Reproducibility from 1944 to 1957
In 1957 Wilson analyzed the reproducibility of the density readings of personnel film dosimeters used from 1944 to 1957 and checked the condition of the film (Wilson 1957). For his study, personnel and calibration film from the years 1944, 1945, 1946, 1948, 1952, 1954, and 1956 were sampled and re-examined. The objectives of the study included the following:
1. Evaluate the evidence of density fading.
2. Observe the conditions of stored film.
3. Determine the reproducibility of film density readings.
4. Estimate the life expectancy of the stored film.
5. Determine the accessibility of film for specific individuals for specific time periods and availability of proper film calibration sets.
i . I
Wilson concluded that there was no problem with fading during the period ~
observed and that the stored film was generally in good condition, having a life expectancy of up to 50 years. Existing methods provided complete information for evaluation of personnel film results. The reproducibility of the film density readings was considered to be generally within 10%, and occasionally within 30% to 40%; all obvious errors detected were prior to 1950. The accessibility of film for specific individuals was reasonably good except for the period from 1944 to 1945.
The measured density in 1957 and the recorded density in 1944 are plotted in Figure 5.1 to show the reproducibility of film density readings.
5.1.7 University of Pittsburgh Film Study
In 1965 an effort was undertaken by the Graduate School of Public Health at the University of Pittsburgh to re-evaluate the measurement results of Hanford film dosimeters (Mancuso et al. 1966).(a) All film records for
(a) Brodsky, A. 1966. "Re-Evaluation of Hanford Film." Letter to J. M. Selby, dated December 14, 1966. r""'i
5.6
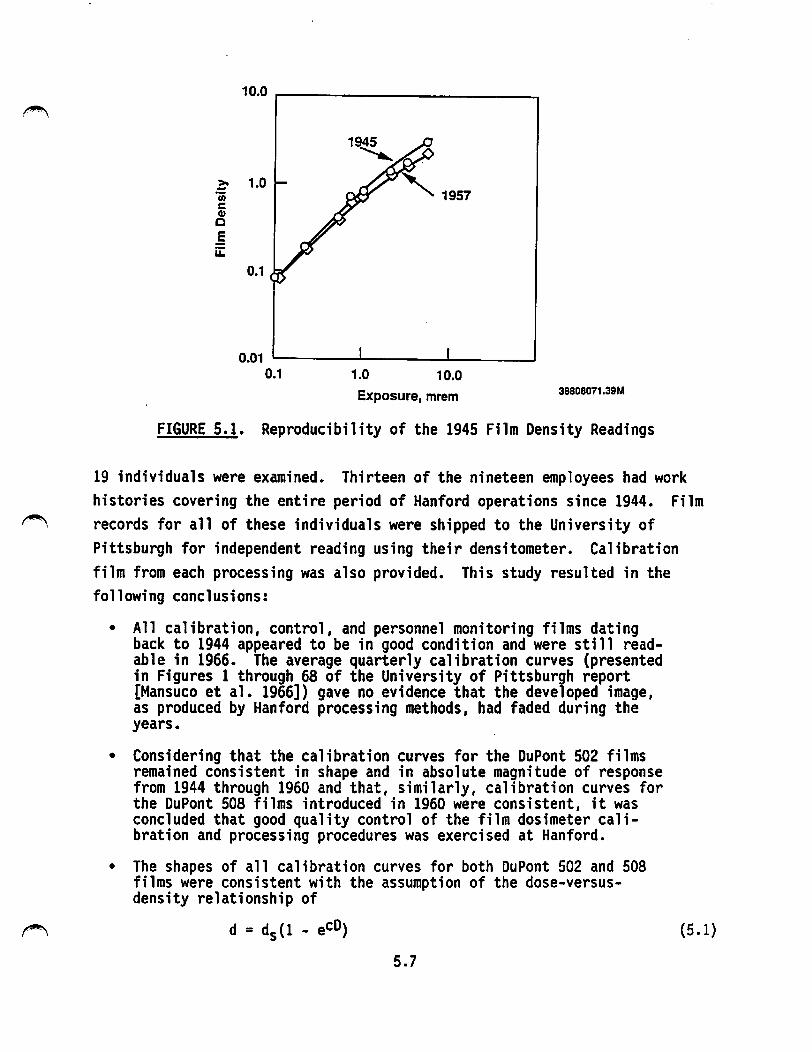
10.0 ,---------------....
>- 1.0 -Ui 1957 c Cl)
c .5 u:
0.1
0.01 ----""""------'------1 0.1 1.0 10.0
Exposure, mrem 38808071.39M
FIGURE 5.1. Reproducibility of the 1945 Film Density Readings
19 individuals were examined. Thirteen of the nineteen employees had work histories covering the entire period of Hanford operations since 1944. Film records for all of these individuals were shipped to the University of Pittsburgh for independent reading using their densitometer. Calibration film from each processing was also provided. This study resulted in the following conclusions:
• All calibration, control, and personnel monitoring films dating back to 1944 appeared to be in good condition and were still readable in 1966. The average quarterly calibration curves (presented in Figures 1 through 68 of the University of Pittsburgh report [Mansuco et al. 1966]) gave no evidence that the developed image, as produced by Hanford processing methods, had faded during the years.
• Considering that the calibration curves for the DuPont 502 films remained consistent in shape and in absolute magnitude of response from 1944 through 1960 and that, similarly, calibration curves for the DuPont 508 films introduced in 1960 were consistent, it was concluded that good quality control of the film dosimeter calibration and processing procedures was exercised at Hanford.
• The shapes of all calibration curves for both DuPont 502 and 508 films were consistent with the assumption of the dose-versusdensity relationship of
d = ds (1 - eCD)
5.7
(5 .1)
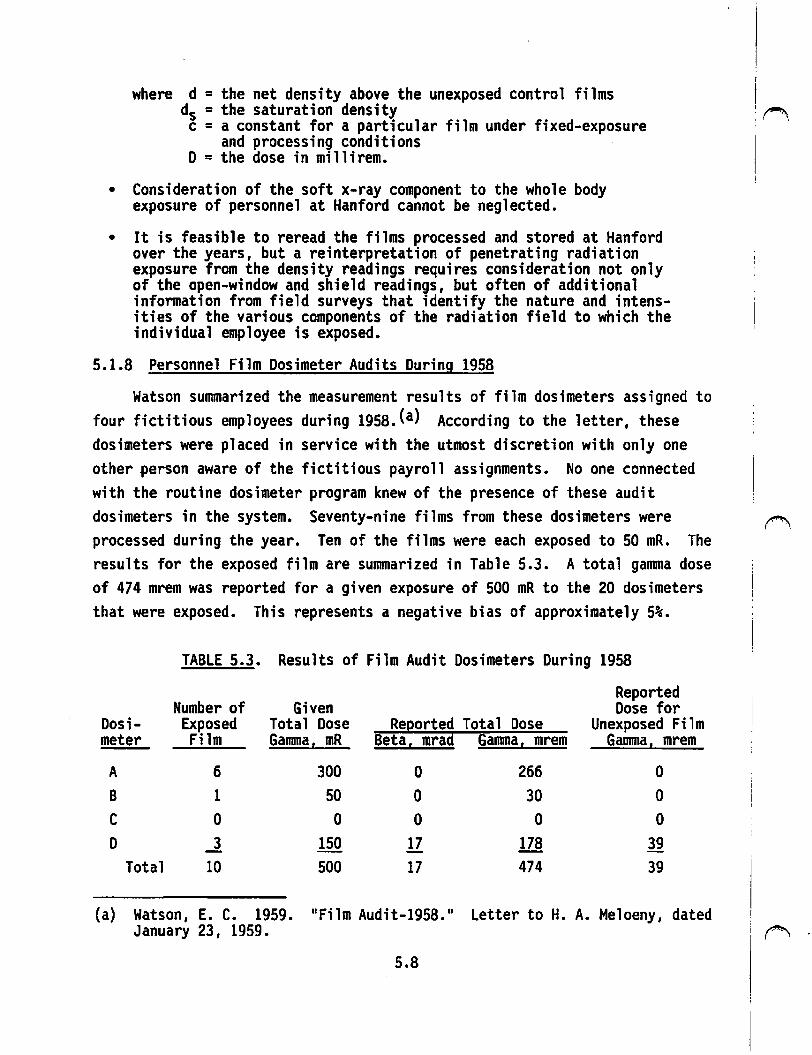
where d = the net density above the unexposed control films ds = the saturation density c = a constant for a particular film under fixed-exposure
and processing conditions D = the dose in millirem.
• Consideration of the soft x-ray component to the whole body exposure of personnel at Hanford cannot be neglected.
• It is feasible to reread the films processed and stored at Hanford over the years, but a reinterpretation of penetrating radiation exposure from the density readings requires consideration not only of the open-window and shield readings, but often of additional infonnation from field surveys that identify the nature and intensities of the various components of the radiation field to which the individual employee is exposed.
5.1.8 Personnel Film Dosimeter Audits During 1958
Watson summarized the measurement results of film dosimeters assigned to four fictitious employees during 1958.(a) According to the letter, these dosimeters were placed in service with the utmost discretion with only one other person aware of the fictitious payroll assignments. No one connected with the routine dosimeter program knew of the presence of these audit dosimeters in the system. Seventy-nine films from these dosimeters were processed during the year. Ten of the films were each exposed to 50 mR. The results for the exposed film are summarized in Table 5.3. A total gamma dose of 474 mrem was reported for a given exposure of 500 mR to the 20 dosimeters that were exposed. This represents a negative bias of approximately 5%.
TABLE 5.3. Results of Film Audit Dosimeters During 1958
Number of Given Reported Dose for
Dosi- Exposed Total Dose ReQorted Total Dose Unexposed Film meter Film Gamma, mR Beta, mrad Gamma, mrem Gamma, mrem
A 6 300 0 266 0 B 1 50 0 30 0 c 0 0 0 0 0 D ..1 150 17 178 39
Total 10 500 17 474 39
(a) Watson, E. C. 1959. "Film Audit-1958." Letter to H. A. Meloeny, dated January 23, 1959.
5.8
I (""'\
(°"'.,

5.1.9 1960 Audit of Dosimeter Results
WilsonCa) reported on the processing results for audit dosimeters during 1960. Fifty-two films were processed for four fictitious payroll numbers. Forty of these films were placed in the system throughout the year with no radiation exposure. Only one of these 40 films had a positive result, which was reported as 34 mrem during the early part of the year when the DuPont 502 film emulsion was still in use (Hanford changed to the 508 emulsion during 1960).
For the 12 dosimeters that received radiation exposure, gamma doses of 90, 180, and 300 mrem were used. A small amount of beta dose was placed on four films: two cases at the 90-mrem level and two at the 180-mrem level. The results are shown in Table 5.4. Considering the gamma dose only, approximately 95% of the given dose was reported in the routine dosimeter processing. For individual doses at the 90-, 180-, and 300-mrem levels, reported dose totals were 92%, 96%, and 95%, respectively, of the given dose. The data indicated that whenever a positive beta dose was reported, the gamma dose was correspondingly low. However, the total dose (gamma plus beta) was very close
~ to the actual gamma dose delivered.
TABLE 5.4. Audit of Dosimeter Results During 1960
Given Gamma Dose 90 mR 180 mR 300 mR
Dosimeter Gama Beta Gamma Beta Gamma Beta
Badge A 98 0 177 0 270 2 Badge B 88 0 163 15 280 0 Badge C 68 12 181 0 280 0 Badge D 78 7 169 19 305 _Q
Total reported 332 19 690 34 1135 2 Total given 360 720 1200
Percent 92% 96% 95%
(a) Wilson, R. H. 1961. 11 Audit of Film Badge System-1960. 11 Letter to H. ~ A. Meloeny, dated January 24, 1961.
5.9
5.1.10 Routine Audit Dosimeter Program
When dosimeter processing was perfonned by United States Testing Company, Inc. (UST), audit dosimeters were exposed to known levels of radiation by PNL and were routinely processed to detennine the adequacy of the calculated doses. In three letters to the Hanford Radiation Protection Historical Files, Heid summarized audit dosimeter results for the years 1965 through 1967.(a,b,c) The third letter provides an overview of the dosimeter results from 1965 through 1967. Perfonnance charts are presented in the letters for the following:
• dosimeters exposed to radium gamma radiation between 100 mR and 299 mR, 300 mR and 499 mR, and 500 mR and 1000 mR
• dosimeters exposed to uranium beta radiation between 100 mrad and 299 mrad, 300 mrad and 499 mrad, and 500 mrad and 1000 mrad
• dosimeters exposed to 17-keV x-ray radiation between 10 mR and 99 mR and 100 mR and 160 mR
• dosimeters exposed to neutron radiation
• ring dosimeters exposed to radium gamma radiation.
Examples of the infonnation provided are shown in Tables 5.5 and 5.6 for radium and neutron audit dosimeter results, respectively.
5.1.11 Gamma Angular Dependence of the Hanford Atomic Products Operation Film Dosimeter During 1960
Little (1960) described the results of a study of measured optical density units with angle of incidence for open window and 1-mm silver-shielded DuPont 552 film packets (containing 502 sensitive emulsion). The film was exposed in Hanford personnel dosimeters to approximately 800 mR of radium gamma radiation. The results of this study are shown in Figure 5.2, in which
(a) Heid, K. R. 1967. "Audit of USTC Perfonnance-1966. 11 Letter to the Radiation Exposure Record Historical File, dated January 26, 1967.
(b) Heid, K. R. 1968. "Audit of USTC Perfonnance-1967 •11 Letter to the Radiation Exposure Record Historical File, dated January 29, 1968.
(c) Heid, K. R. 1968. "Review of Quality Control Program-USTC Data 1965-67.11 Letter to the Radiation Exposure Record Historical File, dated February 6, 1968.
5.10
~
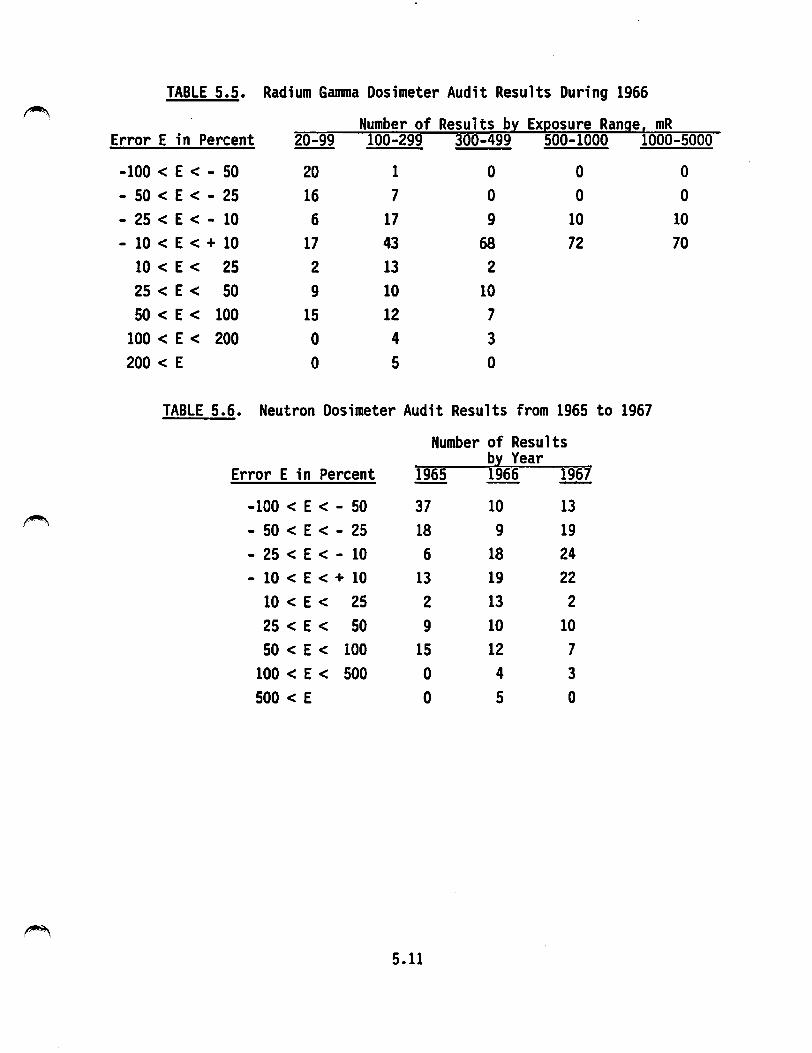
TABLE S.S. Radium GaJD11a Dosimeter Audit Results During 1966 ~ Number of Results b~ Ex~osure Range, mR
Error E in Percent 20-99 100-299 300-499 500-1000 1000-5000
-100 < E < - 50 20 1 0 0 a - 50 < E < - 2S 16 7 0 0 0 - 2S < E < - 10 6 17 9 10 10 - 10 < E < + 10 17 43 68 72 70
10 < E < 2S 2 13 2 2S < E < 50 9 10 10 50 < E < 100 15 12 7
100 < E < 200 0 4 3 200 < E 0 5 0
TABLE 5.6. Neutron Dosimeter Audit Results from 1965 to 1967
Number of Results b~ Year
1967 Error E in Percent 1965 1966
-100 < E < - 50 37 10 13 ~ - 50 < E < - 25 18 9 19
- 25 < E < - 10 6 18 24 - 10 < E < + 10 13 19 22
10 < E < 25 2 13 2 25 < E < 50 9 10 10 50 < E < 100 lS 12 7
100 < E < 500 0 4 3 500 < E 0 5 0
5.11
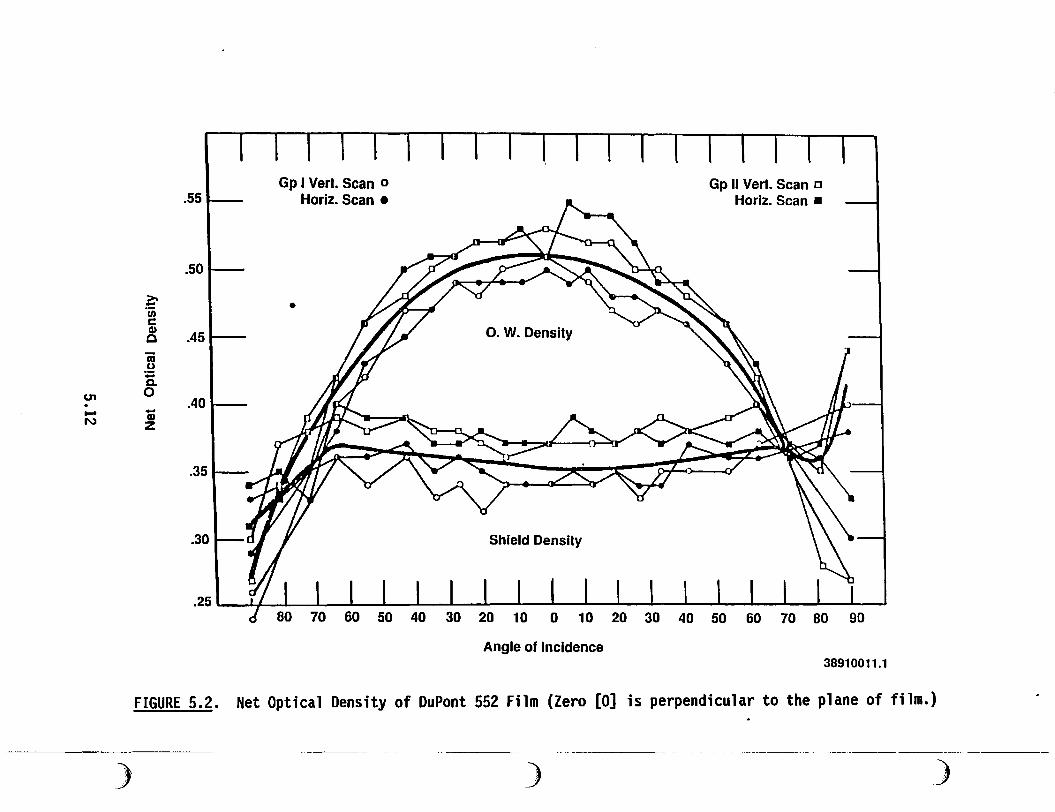
U1 . -N
)
>--·u; c CD 0
ii u :;:: c.. 0 ...
CD z
.55
.50
.45
.40
.35
.30
Gp I Vert. Scan o Horiz. Scan •
• O. W. Density
Shield Density
Gp II Vert. Scan a Horiz. Scan •
80 70 60 50 40 30 20 10 0 10 20 30 40 50 60 70 80
Angle of Incidence 38910011.1
FIGURE 5.2. Net Optical Density of DuPont 552 Film (Zero [O] is perpendicular to the plane of film.)
) )
the net optical density is plotted versus the angle of incidence. It is · ("",, apparent from the figure that the response under the silver shield density is
relatively flat for an angle of incidence between •75°.
5.1.12 Personnel Exposure to Neutrons
Studies of personnel exposure to neutrons were conducted at different times at Hanford (Watson 1951; DePhanger 1957, 1958; Endres 1964; Unruh et al. 1964; Unruh et al. 1966). In 1962 a series of measurements was conducted in operating areas of the plutonium finishing facilitiesCa,b) to determine the need for additional radiation shielding along the plutonium finishing line, particularly around the fluorinator, as a means of further protecting personnel. Field measurements of neutron dose rates were conducted with a double moderated BF3 neutron counter. The inability of the personnel film dosimeter to fully estimate the neutron dose was recognized by the investigators. The use of neutron-to-gamma ratios to administratively limit total dose to personnel was considered; however, the wide range of observed ratios deterred investigators from using this option.Cc,d)
In 1963 Budd discussed a study conducted to resolve questions concern-~ ing the validity of using a single-collision dose calibration of the NTA film
in the Hanford personnel neutron dosimeter.Ce) The main objective of the study was to determine the proper calibration technique, considering the fact that the great majority of Hanford personnel are exposed to fast neutrons with effective energies at or below 1.2 MeV and realizing the poor response of NTA film to energies below 0.7 MeV. Standard Hanford personnel neutron dosimeters were exposed in-air and with the dosimeters backed with a BF3 double moderator to determine the increase in tracks, if any, produced by reflected
(a) Knight, L. M. 1962a. "Predicted 1962 Neutron Exposure." Letter to W. J. Gartin, dated February 16, 1962.
(b) Knight, L. M. 1962b. "Predicted Exposure to Neutrons-Button Line. 11
Letter to J. J. Courtney, dated April 6, 1962. (c) Bramson, P. E. 1962. "Neutron-Gamma Ratios in 234-5 Bui lding. 11 Letter
to C. M. Unruh, dated October 19, 1962. (d) Faust, L. G. 1964. "Neutron to Gamma Dose Rate Ratios of PuF 4· 11
Letter to J. M. Selby, dated July 17, 1964. (e) Budd, R. O. 1963. "Single Collision Versus Multiple Collision Fast
Neutron Dose Calibration of the Hanford Neutron Film Badge Dosimeter." Letter to the File, dated July 2, 1963.
5.13
neutrons. Two fast neutron sources were used: 239puBe and 239puf 4, with mean energies of about 4.5 MeV and 1.3 MeV, respectively.
With the PuBe source, an increase of about 15% in track density was observed for the dosimeters backed with the moderator. No difference was observed for the PuF4-irradiated dosimeters. Statistical analysis of the data showed that with 95% confidence the maximum difference in track density between backed and unbacked dosimeters would not exceed 6%.
Previously, Unruh described a study involving the comparison of 24 neutron dosimeters exposed in a fast neutron field of about 8.2 mrem/hr for 27 hours. These results were compared with measurements made using the new BF3 counters.(a,b) The total fast neutron dose was 222 mrem. Exposures were perfonned near the center of the front face at the 105-B Building. Upon routine processing at the 3705 Building, only three neutron dosimeters yielded positive readings of 100, 150, and 200 mrem. Furthe.r investigation showed that 10 of the neutron dosimeters indicated positive dose readings between 11 mrem and 22 mrem. A total slow neutron dose of 4.1 mrem was accumulated during the 27-hour exposure. Cutie Pie (CP) ganuna measurements estimated the total integrated ganuna dose to be between 350 mR and 370 mR. The ganuna dose (""'... interpreted from the neutron dosimeters ranged from 320 mR to 385 mR.
5.1.13 Characterization of Calibration Sources
In 1966 Beetle reported the results of several studies to measure the precision of several Hanford calibration sources used to expose Hanford dosimeters.Cc) These studies were conducted in preparation for a national intercomparison study of dosimeter perfonnance to be conducted at Hanford. To meet the objectives of the intercomparison study it was important that sources of variability within the calibration sources and geometries be
(a) Unruh, C. M. 1962a. 11 Neutron-Ganuna Ratios in 105 Buildings. 11 Letter to L. A. Carter, H. V. Larson, F. L. Rising, and E. C. Watson, dated October 18, 1962.
(b) Unruh, C. M. 1962b. 11 Prel iminary BF3-Neutron Badge Comparison Date. 11
Letter to A. R. Keene, dated October 18, 1962. (c) Beetle, T. M. 1966. "Calibrations Equipment Experiments." Letter to
C. M. Unruh, dated September 7, 1966.
5.14

understood. These studies involved repeated exposures of approximately 60 ~ dosimeters to different sources and different geometries. Exposures generally
were in the 200-to-300-mR range.
5.2 LABORATORY QUALITY ASSURANCE STUDIES
From 1954 to 1955 a Radiological Field Development Group was estab-1 ished at GE, primarily to improve the personnel dosimetry equipment used to measure and evaluate radiation doses received by plant workers. As a direct result of this group's efforts very significant improvements in personnel dosimetry were made. Some examples include the implementation of plastic dosimeter holders with multi-element dosimetry capabilities, improved neutron calibration ·sources, mechanized processors, automated readers, and computerized record-keeping with reports for field use in controlling exposure to workers.
Numerous variables of the personnel dosimetry system have been studied and evaluated since the inception of Hanford operations. These studies have addressed many issues, including the following:
• accuracy of calibration sources
• radiation sensitivity and precision of different types of film
• environmental dependency of film prior to, during, and after processing
• optimization of photometry variables
• design of different beta/photon and neutron dosimeters
• detection level of various film and personnel dosimeters
• mixed-field evaluation of dosimeter response
• angular response of dosimeters.
Several of these studies are discussed in the following subsections.
5.2.1 Study of DuPont 552 Film
Personnel film dosimeters at Hanford used DuPont film since the dosimetry program's inception in 1944. In 1945 DuPont 552 film with the 502 and 510 emulsions was introduced and used exclusively with some changes over the
~ years. In 1958, studies of the DuPont film were conducted to update
5.15
information on the DuPont film and to determine how the film performance could be further improved (Baumgartner 1958). The objectives of the studies were to ~
• update information on the DuPont 552 film and standard darkroom procedures
• determine characteristics of film exposed to different types and amounts of radiation under various photographic processing procedures
• obtain the best estimate of the lowest detection levels.
Baumgartner concluded that the smallest dose of radiation that could be detected by the DuPont 552 film using standard photographic developing practices is 2 mR of 58-keV x-ray radiation or 25 mR of radium gamma radiation. Optimization of the developing procedures could reduce the detectable dose to about one-half of these values. The largest dose that could be interpreted using a Hanford type densitometer was about 50 R of radium ganuna radiation using the DuPont 510 emulsion. Above 100 to 500 R, film reversal is observed on the DuPont 502 emulsion at the rate of about 0.04 optical density units per 100 R using standard photographic developing procedures.
In 1959 Baumgartner concluded that x-ray and ganuna radiation with energies less than radium gamma radiation darken the film more per unit dose, with a maximum darkening being observed around 58 keV (Baumgartner 1959a). A unit dose of uranium beta radiation darkened the film about one-half as much as a unit dose of radium gamma radiation. The film exposed to radiation 3 months before being developed had about a 7% decrease in density over the film exposed to radiation on the day prior to being developed. There was no detectable decrease in density during the first month after exposure.
5.2.2 Studies of Film Dosimeter Variables
Results of studies of DuPont 508 and Eastman-Kodak type II films were reported by Baumgartner (1958; 1960). Although numerous studies were conducted of both DuPont and Eastman-Kodak films, only the DuPont films were used for beta/photon radiation at Hanfor~. The results for only the DuPont film are presented in this report. The studies were motivated by the desire to evaluate the potential error in the determination of the annual dose. The uncertainty of the annual dose was thought to be a function of the precision, detection limit, and the number of individual films. The most direct method
5.16
i
1~
of reducing the error in the annual dose was simply to reduce the number of ~ films assigned to each employee during the year. The study findings and .
results for DuPont 508 film were as follows:
• The latent image of DuPont film was found to fade about 1% per month for radium gamma doses between 1 to 5 R: no fading was detected for doses below about 1 R.
• Based on the small amount of fading of the latent image of DuPont film, the routine exchange frequency of film was changed from biweekly to monthly.
• The developer temperature, development time, and radiation dose were identified as significant variables. The non-significant variable was the depth of the film in the developer solution.
• The DuPont film density is ·a linear function of the radiation dose for radium gamma doses between 100 mR and 1000 mR.
• The temperature gradient is 0.10 • 0.04 optical density units/°F (95% confidence limit). The gradient is linear over the temperature range of 66°F to 74.2°F.
• The time gradient is 0.12 • 0.06 optical density units/minute (95% confidence limit) and is linear during the time interval of 2 to 6 minutes.
• Time, dose, and temperature interact positively, such that the development of high-dose calibrated film is accelerated more than the low-dose calibrated film.
• Based on the foregoing results and other considerations, an automatic film processor was obtained to control the development time to within 1 second and the developer temperature to within 0.05°F. This processor was implemented in October 1959.
Greater detail on the precision, detection level, and conclusions are summarized by Baumgartner (1958; 1960). Fifty film packets of DuPont 508 film were exposed to radium gamma doses of 0, 35, 70, 100, and 200 mR. The optical density results of this study are shown in Table 5.7. The minimum interval for which the densitometer can be read is 0.005 optical density units. The information in Table 5.7 was used to prepare frequency tables of the error observed for each dose level, as summarized in Table 5.8 for DuPont film.
The standard deviation for each dose level in Table 5.8 was estimated by the proportion of the 50 films, which deviated by not more than 0.005 optical
5.17
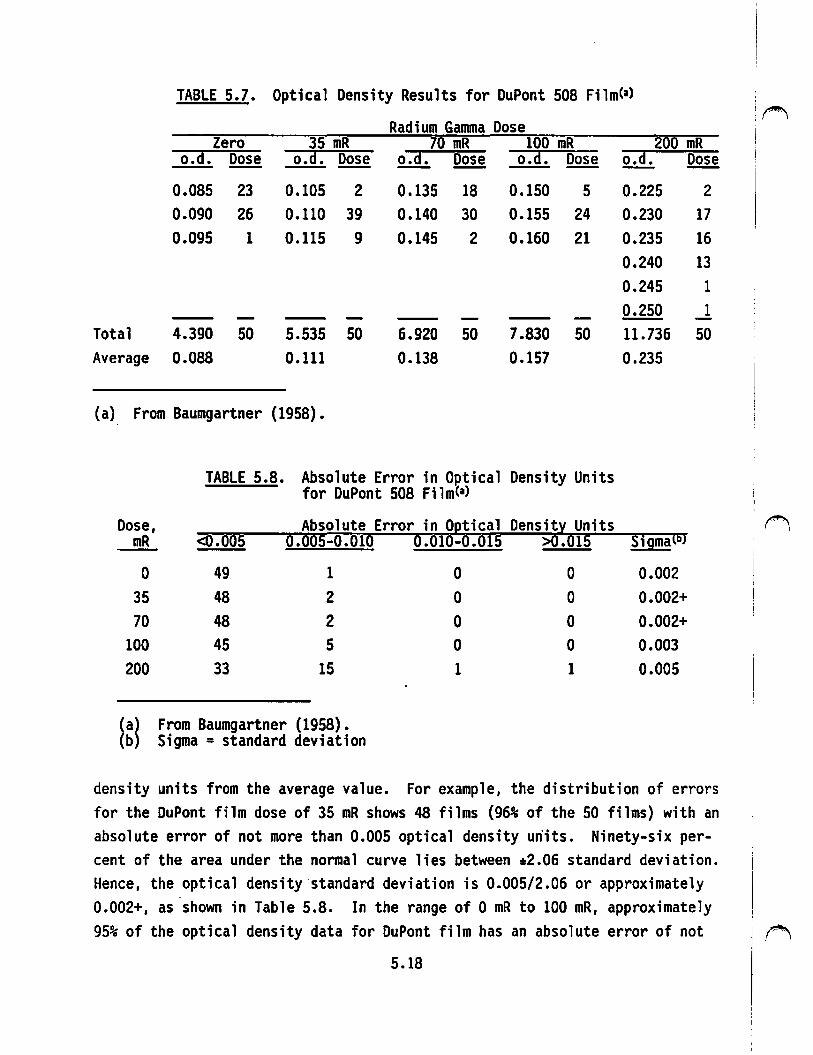
TABLE 5.7. Optical Density Results for DuPont 508 Film<•>
Radium Gamma Dose Zero 35 mR 70 mR 100 mR
o.d. Dose o.d. Dose o.d. Dose o.d. Dose
0.085 23 0.105 2 0.135 18 0.150 5 0.090 26 0.110 39 0.140 30 0.155 24 0.095 1 0.115 9 0.145 2 0.160 21
Total 4.390 50 5.535 50 6.920 50 7.830 50 Average 0.088 0.111 0.138 0.157
(a) From Baumgartner (1958).
TABLE 5.8. Absolute Error in Optical Density Units for DuPont 508 FilmC•>
Dose, Absolute Error in O~tical Density Units 0.005-0.010 o.010-o.01s mR <0.005
0 49 1 35 48 2 70 48 2
100 45 5 200 33 15
(a) From Baumgartner (1958). (b) Sigma = standard deviation
>0.015
0 0
0 0
0 0 0 0 1 1
200 mR o.d. Dose
0.225 2 0.230 17 0.235 16 0.240 13 0.245 1 0.250 1 11.736 50 0.235
SigmaC6J
0.002 0.002+ 0.002+ 0.003 0.005
density units from the average value. For example, the distribution of errors for the DuPont film dose of 35 mR shows 48 films (96% of the 50 films) with an absolute error of not more than 0.005 optical density units. Ninety-six percent of the area under the normal curve lies between •2.06 standard deviation. Hence, the optical density standard deviation is 0.005/2.06 or approximately 0.002+, as shown in Table 5.8. In the range of 0 mR to 100 mR, approximately
r--.,
95% of the optical density data for DuPont film has an absolute error of not .~
5.18
more than 0.005 optical density units and 100% with an error of not more than ~ 0.01 optical density units. Least-squares techniques were used to estimate a
linear function between optical density data in the range of 0 and 10 mR, as measured by the average optical density for each frequency table and dose, with the following result:
Optical Density Units = 0.088 + 0.000697 * Dose (DuPont) (5.2)
where Dose is measured in milliroentgen. Using these relationships, the optical density unit error can be translated to precision statements for estimating dose from optical density. For example, the statement that 95% of the optical density measurement errors for DuPont film are not more than 0.005 optical density units transfonns to a precision statement, at the 95% confidence level, that the error in estimating the dose in the range of Oto 100 mR is not more than 0.005/0.000697, or about 8 mR. Similar calculations can be translated to precision statements for estimating dose and are as follows:
Precision Du Pont 508 Film
95% * 8 mR
100% * 15
With DuPont film in the range of 0 mR to 100 mR, the absolute upper bound on the error is about 15 mR.
The detection limit has been defined in this historical review document as a property for deciding when a particular film indicates· a positive dose. The customary procedure is to define a critical point, a percentile point on the blank film (developed, unirradiated) distribution, and decide that the film was exposed to a positive dose if the optical density reading falls above the critical point. If the reading is less than the critical point, a decision of no dose (or undetectable dose) is made. The following analysis was presented for the detection limits for the DuPont film assuming a 95% critical point (i.e., the operational procedure such that on average 1 in 20 films that have received no dose will be flagged as a positively dosed film). Using the estimates of 0.088 for the mean of the blank film optical density
5.19

distribution of DuPont film (shown in Table 5.7) and assuming a normal dis-tribution, the 95% critical point is 0.0925. Rounding this value to densi- ~ tometer readings (i.e., multiples of 0.005) results in 0.095. The current operational procedures are actually better than 95% (i.e., the lowest reading is currently 0.005). The detection limit is defined as the minimum positive dose that is almost certain to be detected as positive using these opera-tional procedures. It is important to note that the dose will be detected, not that it will be estimated correctly. Adding the error estimate of 0.01 to the DuPont critical point gives the detection limit in optical density units of 0.105. Transfonning this value to dose units results in 17 mR for the DuPont film.
Baumgartner (1960) provides a comparison of the experimental results (described above) with routine production practices. At the time of the study, the routine program used a functional relationship estimate calculated from a least-squares fit to calibration net data (absolute optical density minus blank optical density) with one film exposed at 100, 200, 300, 400, 500, 600, 800, and 1000 mR. Thus, the precision with which the functional relationship is estimated in the range of 0 mR to 100 mR is determined by the precision with which the blank value is estimated and the precision with which the 100 mR value is estimated. An estimate of the increased uncertainty for non-laboratory conditions indicates that the sensitivity for the DuPont film during routine production must be relaxed from the experimental estimate obtained by a factor of about 2. Hence, the precision of estimating an unknown dose at the 95% and 100% confidence levels is not 8 mR and 15 mR, respectively, but probably closer to 16 mR and 30 mR, respe~tively. The optical density detection limit, instead of being 0.105, is probably closer to 0.021, or instead of being 25 mR, it is probably closer to 40 mR.
As a direct result of this experiment, the normal calibration doses were changed from 100, 200, 300, 400, 500, 600, 800, 1000, 5000, and 10,000 mR to 30, 60, 90, 120, 180, 240, 300, 500, 750, 1000, 2000, 5000, and 10,000 mR. Also, an improved densitometer was designed and built to be used for routine. dosimetry evaluations, as well as for determining if there is a non-linear relationship between dose and optical density in the range from O mR to 100 mR. The new densitometer was subsequently implemented during 1962.
5.20
5.2.3 Analysis of Detection Level During 1960
During 1960 three changes were reported that contributed to significant reduction in the detection limit of the film dosimeter and the potential annual penetrating dose that could go undetected for an individual employee (Wilson 1960). These changes were
1. increased accuracy in the dose received by calibration film by eliminating the non-isotropic effect of the calibration source
2. reduction of routine processing variables by installing automatic equipment for precise temperature and time control
3. change to a more sensitive film (i.e., DuPont 508).
Wilson concluded that the largest contribution to improved performance was the capability of the DuPont 508 film to record measurable densities at lower dose levels. In the analysis, data for 30-mR calibration film were analyzed from 49 routine batches. The calculated mean value for this film was 0.028 optical density units with a standard deviation of 0.007. The detection level for the densitometer was considered to be 0.01 optical density units. Analysis of the zero-dosed control films indicated that about 8% fell above
~ the 0.01 detection level and, as such,_ these control films were assigned a positive dose. Wilson concluded that the detection level of the system was approxi~ately 15 mR at the 90% confidence level, assuming normal distribution of density/dose values for the 30-mR calibration level. Assuming 13 processings per year, Wilson concluded further that the annual detection level would be equivalent to 195 mR (i.e., 15 x 13). For comparison, the report states that the previous detection level for DuPont 502 film was 40 mR.
5.2.4 Security Credential Evaluation
A study(a) was conducted to determine the quantitative effects of the security credential on dose evaluations as a result of changing to a thinner credential material. After evaluating the results of the study, the following reconunendations were made:
{a) Baumgartner, W. V., G. W. R. Endres, and K. R. Heid. 1966. 11 A Study of Security Credential Effects on the Film Badge Dosimeter." Letter report dated November 28, 1966.
5.21

• The film dosimeter program should use calibrated film dosimeters with security credentials similar to those worn by employees. Dosimeters with old security credentials should be evaluated by calibration film exposed with old security credentials and vice versa.
• A thorough study to determine the actual energy of the 17-keV xray source should be made if this source is to be used in the film dosimetry program. From the absorption differences for the different types of security credentials, the average energy appears to be about 10 to 12 keV.
• The computer program for the routine personnel dosimetry program should be investigated to determine when the "rounding" of the values occurs. It appears that the rounding of the soft gamma values definitely influences the beta calculations.
5.2.5 Fading Effects in Eastman-Kodak NTA Film Emulsion
The fading effect of Eastman-Kodak NTA film emulsions used for monitoring personnel exposure to fast neutrons was studied by Watson in 1957, and it was concluded that the emulsions could be used for a period of 2 weeks without fading of proton tracks {Watson 1957). Recommendations resulting from this study are as follows:
• Neutron personnel monitoring films may be left in operation for a 2-week period.
• The time between calibration exposure and the last day of possible personnel exposure for the corresponding period should not exceed 21 days. It was found that for the energy spectrum used in calibration, a delay of 21 days in developing the film resulted in a loss of 25% of the tracks.
These recommendations were adopted into the routine program.
5.2.6 NTA Film Study
In 1959 the NTA {fast-neutron) program was studied to review the experience gained up to that point and to recommend further improvements in the program {Watson 1959). The recommendations resulting from this study were as follows:
• NTA films should be evaluated only for fast neutron exposure when there is a significant gamma exposure as measured by the neutron film dosimeter.
• Records of the gamma dose as measured with the· neutron dosimeter should be maintained for future analysis.
5.22
I ~
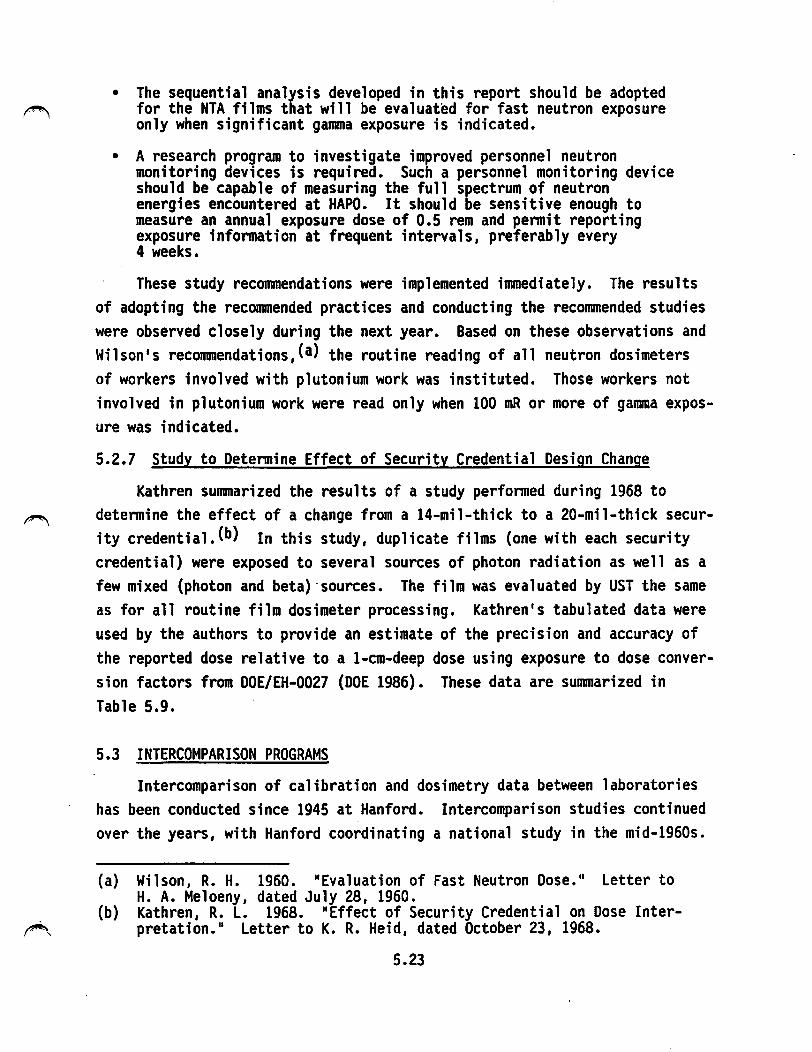
• The sequential analysis developed in this report should be adopted for the NTA films that will be evaluated for fast neutron exposure only when significant gamma exposure is indicated.
• A research program to investigate improved personnel neutron monitoring devices is required. Such a personnel monitoring device should be capable of measuring the full spectrum of neutron energies encountered at HAPO. It should be sensitive enough to measure an annual exposure dose of 0.5 rem and pennit reporting exposure infonnation at frequent intervals, preferably every 4 weeks.
These study recommendations were implemented immediately. The results of adopting the recommended practices and conducting the recommended studies were observed closely during the next year. Based on these observations and Wilson's recommendations,(a) the routine reading of all neutron dosimeters of workers involved with plutonium work was instituted. Those workers not involved in plutonium work were read only when 100 mR or more of gamma exposure was indicated.
5.2.7 Study to Detennine Effect of Security Credential Design Change
Kathren summarized the results of a study performed during 1968 to determine the effect of a change from a 14-mil-thick to a 20-mil-thick security credentia1.(b) In this study, duplicate films (one with each security credential) were exposed to several sources of photon radiation as well as a few mixed (photon and beta) ·sources. The film was evaluated by UST the same as for all routine film dosimeter processing. Kathren's tabulated data were used by the authors to provide an estimate of the precision and accuracy of the reported dose relative to a 1-cm-deep dose using exposure to dose conversion factors from DOE/EH-0027 (DOE 1986). These data are summarized in Table 5.9.
5.3 INTERCOMPARISON PROGRAMS
lntercomparison of calibration and dosimetry data between laboratories has been conducted since 1945 at Hanford. lntercomparison studies continued over the years, with Hanford coordinating a national study in the mid-1960s.
(a) Wilson, R. H. 1960. "Evaluation of Fast Neutron Dose." Letter to H. A. Meloeny, dated July 28, 1960.
(b) Kathren, R. L. 1968. "Effect of Security Credential on Dose lnterpretation.11 Letter to K. R. Heid, dated October 23, 1968.
5.23
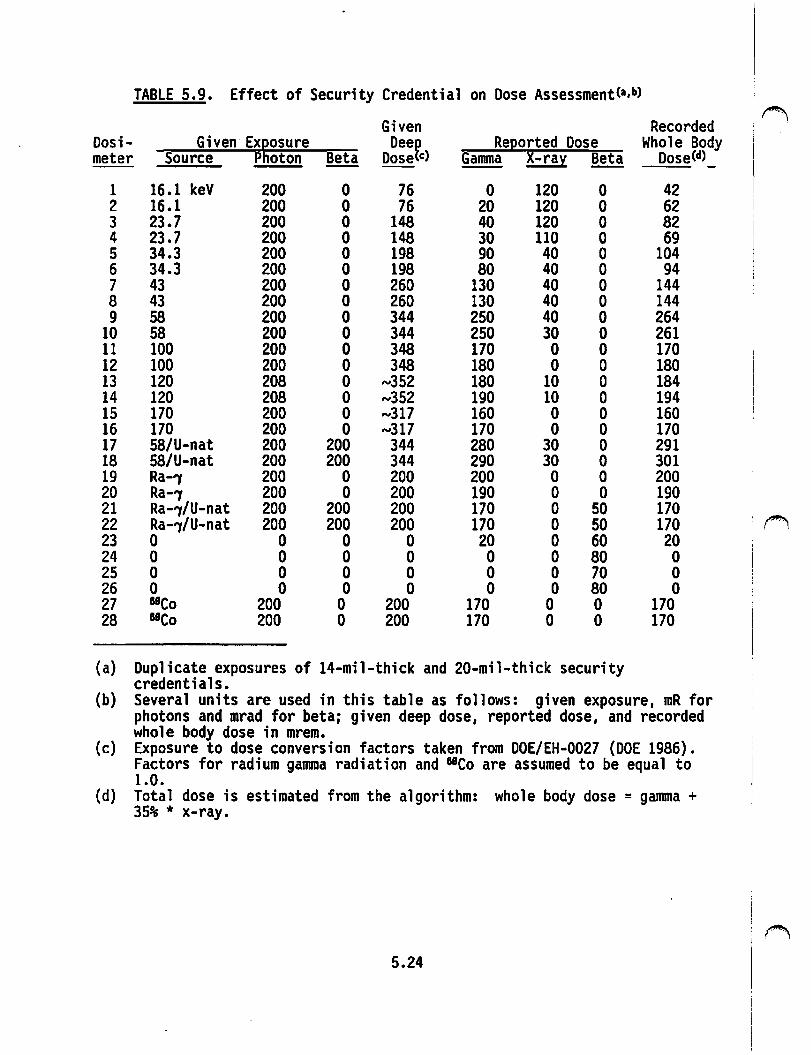
TABLE 5.9. Effect of Security Credential on Dose AssessmentCa,b)
Given Recorded ~
Dosi- Given Ex~osure Deep Re~orted Dose Whole Body meter Source P oton Beta Dose Cc) Gamma X-ra:t Beta Dose Cd)
1 16.1 keV 200 0 76 0 120 0 42 2 16.1 200 0 76 20 120 0 62 3 23.7 200 0 148 40 120 0 82 4 23.7 200 0 148 30 110 0 69 5 34.3 200 0 198 90 40 0 104 6 34.3 200 0 198 80 40 0 94 7 43 200 0 260 130 40 0 144 8 43 200 0 260 130 40 0 144 9 58 200 0 344 250 40 0 264
10 58 200 0 344 250 30 0 261 11 100 200 0 348 170 0 0 170 12 100 200 0 348 180 0 0 180 13 120 208 0 .... 352 180 10 0 184 14 120 208 0 .... 352 190 10 0 194 15 170 200 0 .... 317 160 0 0 160 16 170 200 0 .... 317 170 0 0 170 17 58/U-nat 200 200 344 280 30 0 291 18 58/U-nat 200 200 344 290 30 0 301 19 Ra-"J 200 0 200 200 0 0 200 20 Ra-"J 200 0 200 190 0 0 190 21 Ra-"J/U-nat 200 200 200 170 0 50 170 22 Ra-"J/U-nat 200 200 200 170 0 50 170 ~ 23 0 0 0 0 20 0 60 20 24 0 0 0 0 0 0 80 0 25 0 0 0 0 0 0 70 0 26 0 0 0 0 0 0 80 0 27 eeco 200 0 200 170 0 0 170 28 eeco 200 0 200 170 0 0 170
(a) Duplicate exposures of 14-mil-thick and 20-mil-thick security credentials.
(b) Several units are used in this table as follows: given exposure, mR for
(c)
photons and mrad for beta: given deep dose, reported dose, and recorded whole body dose in mrem. Exposure to dose conversion factors taken from DOE/EH-0027 (DOE 1986). Factors for radium gamma radiation and e•co are assumed to be equal to 1.0.
(d) Total dose is estimated from the algorithm: 35% * x-ray.
whole body dose = gamma +
5.24
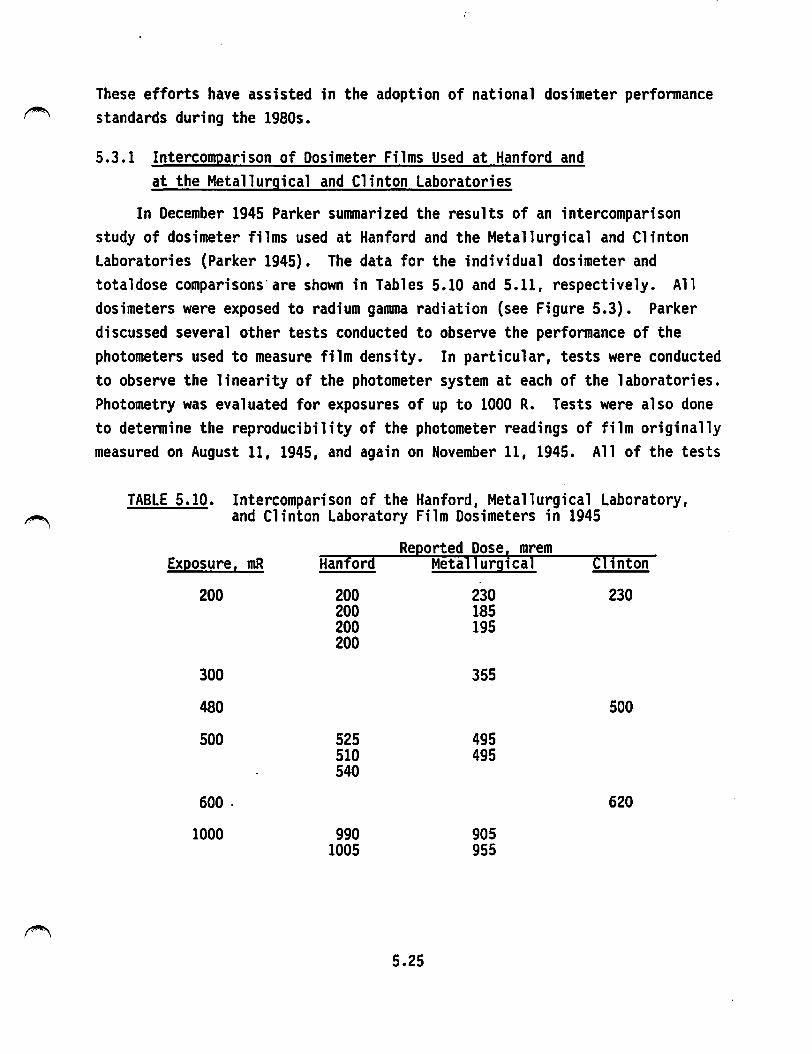
These efforts have assisted in the adoption of national dosimeter performance ~ standards during the 1980s.
~
5.3.1 Intercomparison of Dosimeter Films Used at Hanford and at the Metallurgical and Clinton Laboratories
In December 1945 Parker summarized the results of an intercomparison study of dosimeter films used at Hanford and the Metallurgical and Clinton Laboratories {Parker 1945). The data for the individual dosimeter and totaldose comparisons·are shown in Tables 5.10 and 5.11, respectively. All dosimeters were exposed to radium gamma radiation {see Figure 5.3). Parker discussed several other tests conducted to observe the performance of the photometers used to measure film density. In particular, tests were conducted to observe the linearity of the photometer system at each of the laboratories. Photometry was evaluated for exposures of up to 1000 R. Tests were also done to determine the reproducibility of the photometer readings of film originally measured on August 11, 1945, and again on November 11, 1945. All of the tests
TABLE 5.10. Intercomparison of the Hanford, Metallurgical Laboratory, and Clinton Laboratory Film Dosimeters in 1945
Exposure, mR Hanl'ord Reported Dose~ mrem
Metallurg1cal Clinton
200 200 230 230 200 185 200 195 200
300 355
480 500
500 525 495 510 495 540
600. 620
1000 990 905 1005 955
5.25
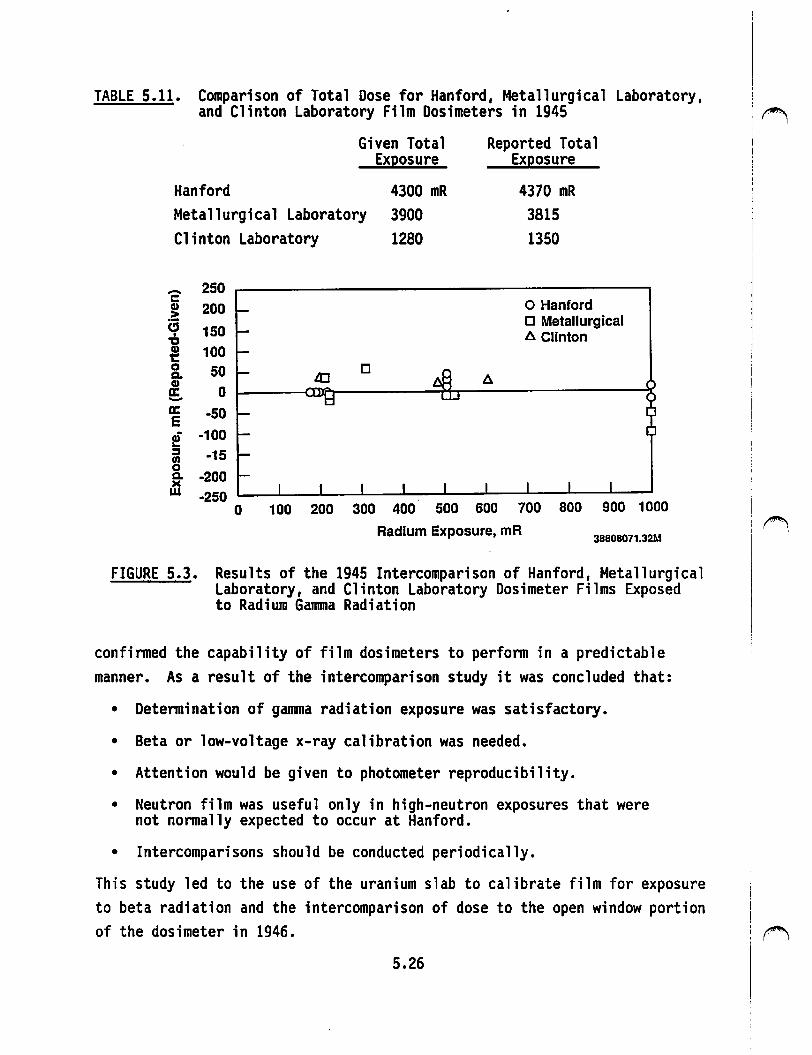
TABLE 5.11. Comparison of Total Dose for Hanford, Metallurgical Laboratory, t
and Clinton Laboratory Film Dosimeters in 1945 : ~
Hanford
Given Total Exposure
Reported Total Exposure
Metallurgical Laboratory Clinton Laboratory
4300 mR 3900 1280
4370 mR 3815 1350
-c Q)
> ('; • ,, ~ 0 a. Cl)
a: -a: E pf ::::t U> 0 a. an
250
200
150 100
50 0
-so -100
-15
-200 -250
0
D l!:..
o Hanford D Metallurgical l!:.. Clinton
100 200 300 400 500 600 700 800 900 1000
Radium Exposure, mR 38808071.32M
FIGURE 5.3. Results of the 1945 Intercomparison of Hanford, Metallurgical Laboratory, and Clinton Laboratory Dosimeter Films Exposed to Radium Gamma Radiation
confirmed the capability of film dosimeters to perform in a predictable manner. As a result of the intercomparison study it was concluded that:
• Detennination of gamma radiation exposure was satisfactory.
• Beta or low-voltage x-ray calibration was needed.
• Attention would be given to photometer reproducibility.
• Neutron film was useful only in high-neutron exposures that were not nonnally expected to occur at Hanford.
• Intercomparisons should be conducted periodically.
This study led to the use of the uranium slab to calibrate film for exposure to beta radiation and the intercomparison of dose to the open window portion of the dosimeter in 1946. ~
5.26
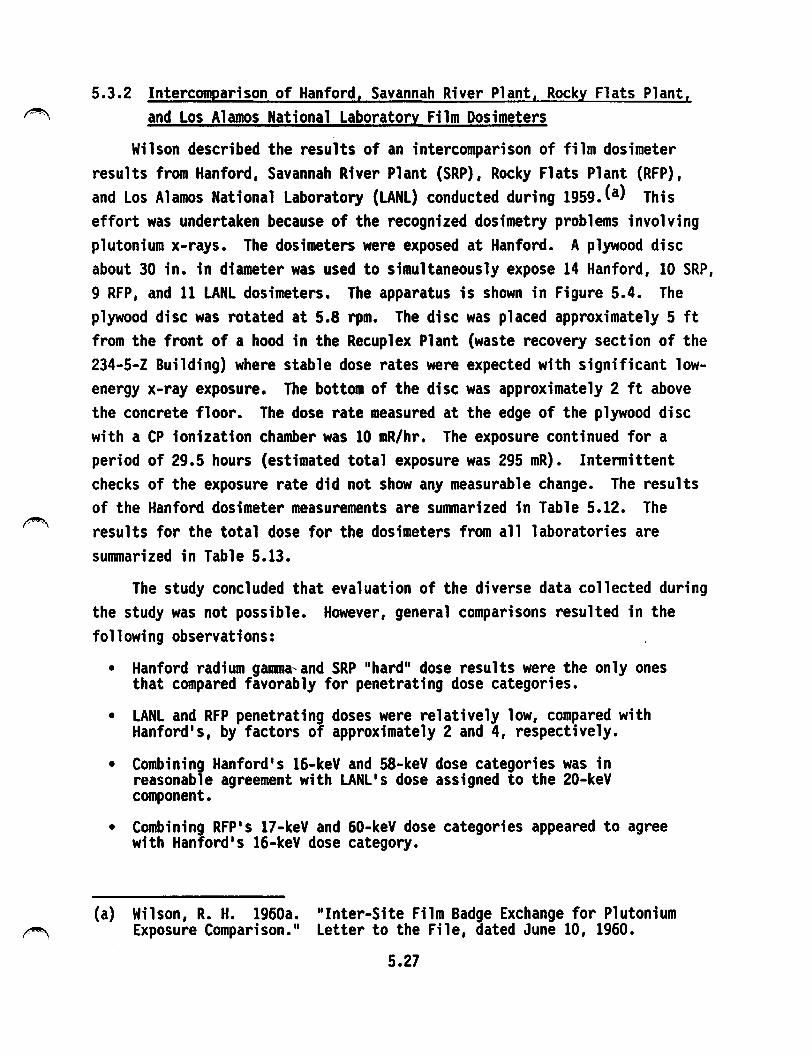
5.3.2 lntercomparison of Hanford, Savannah River Plant, Rocky Flats Plant, ~ and Los Alamos National Laboratory Film Dosimeters
Wilson described the results of an intercomparison of film dosimeter results from Hanford, Savannah River Plant (SRP), Rocky Flats Plant (RFP), and Los Alamos National Laboratory (LANL) conducted during 1959.(a) This effort was undertaken because of the recognized dosimetry problems involving plutonium x-rays. The dosimeters were exposed at Hanford. A plywood disc about 30 in. in diameter was used to simultaneously expose 14 Hanford, 10 SRP, 9 RFP, and 11 LANL dosimeters. The apparatus is shown in Figure 5.4. The plywood disc was rotated at 5.8 rpm. The disc was placed approximately 5 ft from the front of a hood in the Recuplex Plant (waste recovery section of the 234-5-Z Building) where stable dose rates were expected with significant lowenergy x-ray exposure. The bottom of the disc was approximately 2 ft above the concrete floor. The dose rate measured at the edge of the plywood disc with a CP ionization chamber was 10 mR/hr. The exposure continued for a period of 29.5 hours (estimated total exposure was 295 mR). Intermittent checks of the exposure rate did not show any measurable change. The results of the Hanford dosimeter measurements are su11111arized in Table 5.12. The results for the total dose for the dosimeters from all laboratories are sunvnarized in Table 5.13.
The study concluded that evaluation of the diverse data collected during the study was not possible. However, general comparisons resulted in the following observations:
• Hanford radium ganma,and SRP "hard" dose results were the only ones that compared favorably for penetrating dose categories.
• LANL and RFP penetrating doses were relatively low, compared with Hanford's, by factors of approximately 2 and 4, respectively.
• Combining Hanford's 16-keV and 58-keV dose categories was in reasonable agreement with LANL's dose assigned to the 20-keV component.
• Combining RFP's 17-keV and 60-keV dose categories appeared to agree with Hanford's 16-keV dose category.
(a) Wilson, R. H. 1960a. "Inter-Site Film Badge Exchange for Plutonium ~ Exposure Comparison." Letter to the File, dated June 10, 1960.
5.27

FIGURE 5.4. Plywood Disc Used to Simultaneously Expose Hanford, SRP, RFP, and LANL Dosimeters to Plutonium for Intercomparison of Results
A general conclusion of the study was that the total dose reported by the other laboratories was lower than the dose reported by Hanford.
5.3.3 Hanford Dosimeters Exposed at Savannah River Plant in 1959
A further comparison of Hanford and SRP dosimeter results was obtained through the simultaneous exposure of five Hanford dosimeters with SRP dosimeters at SRP.(a) The exposure time for the dosimeters was 47.5 hours at various locations on the outside face of 11 cab inets 11 along the JB Line in the
(a) Wilson, R. H. 1960b. 11 Addendum, Inter-Site Film Badge Exchange for Plutonium Exposure Comparison. 11 Letter to the File, dated June 10, 1960.
5.28
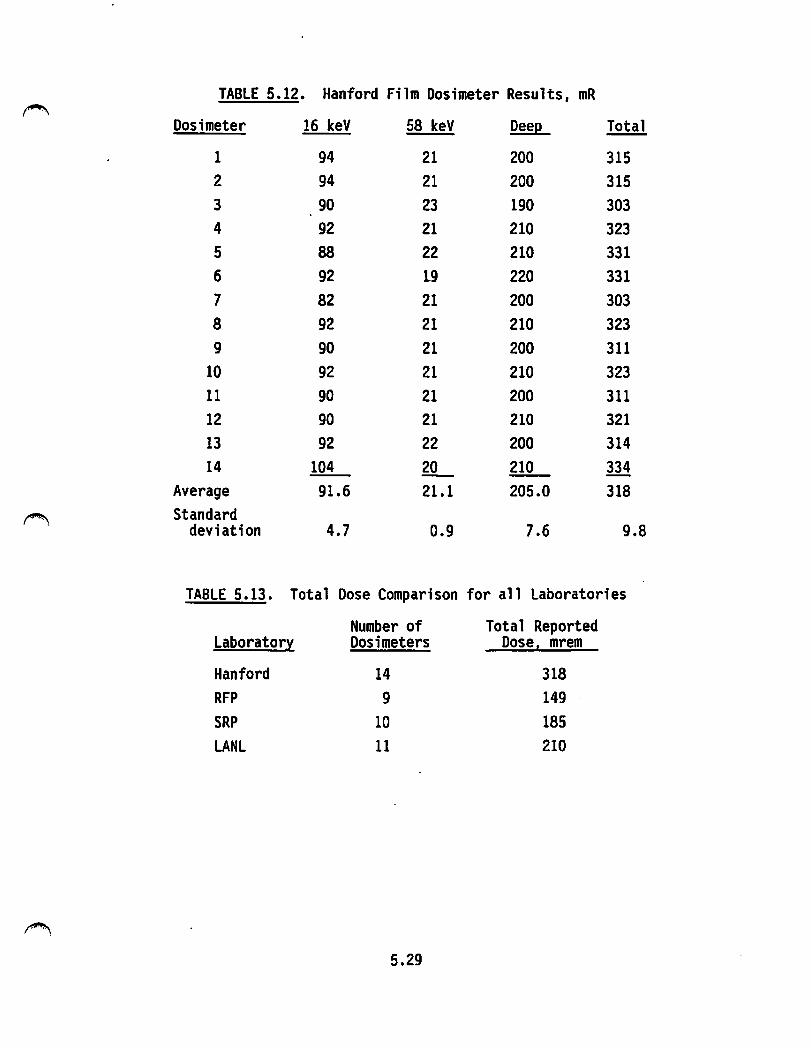
TABLE 5.12. Hanford Film Dosimeter Results, mR ~
Dosimeter 16 keV 58 keV Deep Total --1 94 21 200 315 2 94 21 200 315 3 90 23 190 303 4 92 21 210 323 5 88 22 210 331 6 92 19 220 331 7 82 21 200 303 8 92 21 210 323 9 90 21 200 311
10 92 21 210 323 11 90 21 200 311 12 90 21 210 321 13 92 22 200 314 14 104 ~ 210 334
Average 91.6 21.1 205.0 318
~ Standard deviation 4.7 0.9 7.6 9.8
TABLE 5.13. Total Dose Comparison for all Laboratories
Number of Total Reported Labor a tor~ Dosimeters Dose, mrem
Hanford 14 318 RFP 9 149 SRP 10 185 LANL 11 210
5.29
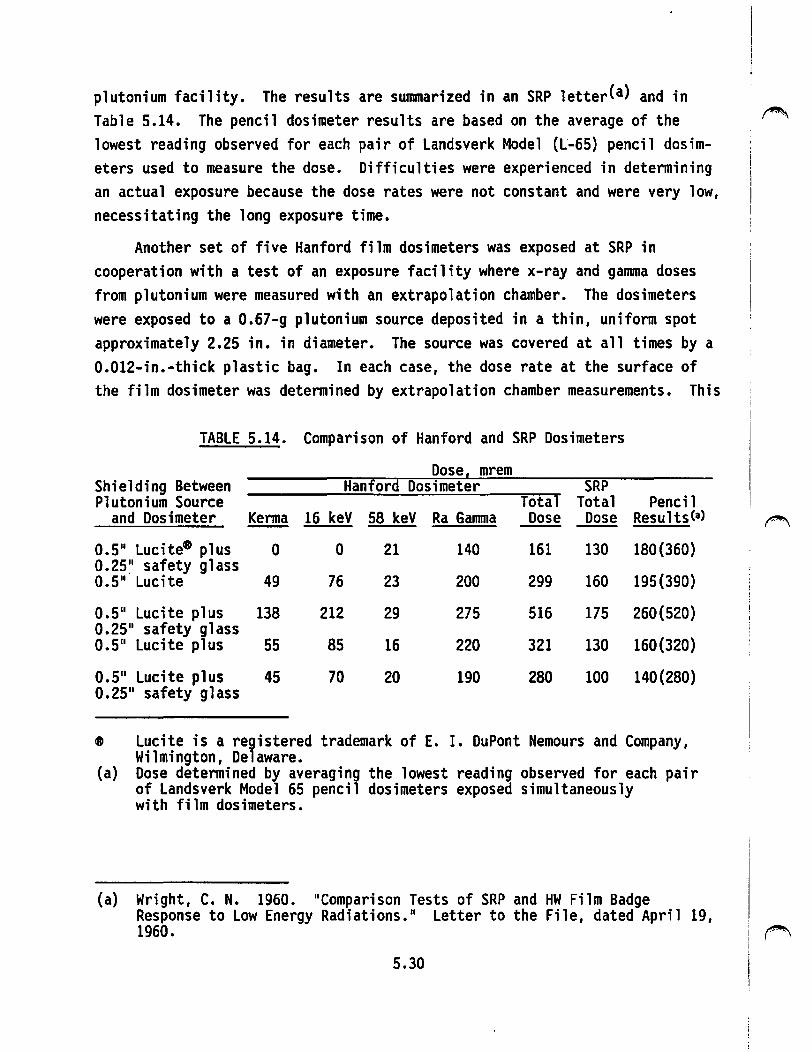
plutonium facility. The results are summarized in an SRP letterCa) and in Table 5.14. The pencil dosimeter results are based on the average of the fftl lowest reading observed for each pair of Landsverk Model (L-65) pencil dosim-eters used to measure the dose. Difficulties were experienced in determining an actual exposure because the dose rates were not constant and were very low, necessitating the long exposure time.
Another set of five Hanford film dosimeters was exposed at SRP in cooperation with a test of an exposure facility where x-ray and gamma doses from plutonium were measured with an extrapolation chamber. The dosimeters were exposed to a 0.67-g plutonium source deposited in a thin, uniform spot approximately 2.25 in. in diameter. The source was covered at all times by a 0.012-in.-thick plastic bag. In each case, the dose rate at the surface of the film dosimeter was determined by extrapolation chamber measurements. This
TABLE 5.14. Comparison of Hanford and SRP Dosimeters
Dose, mrem Hanford Dosimeter SRP
Total Total Pencil Shielding Between Plutonium Source
and Dosimeter Kerma 16 keV 58 keV Ra Gamma Dose Dose ResultsCa)
0.5" Lucite9 plus 0 0.25~' safety glass 0.5" Lucite 49
0.5" Lucite plus 138 0.25 11 safety glass 0.5" Lucite plus 55
0.5" Lucite plus 45 0.25 11 safety glass
0
76
212
85
70
21
23
29
16
20
140
200
275
220
190
161
299
516
321
280
130 180(360)
160 195(390)
175 260(520)
130 160(320)
100 140(280)
e Lucite is a registered trademark of E. I. DuPont Nemours and Company, Wilmington, Delaware.
(a) Dose determined by averaging the lowest reading observed for each pair of Landsverk Model 65 pencil dosimeters exposed simultaneously with film dosimeters.
(a) Wright, C. N. 1960. "Comparison Tests of SRP and HW Film Badge Response to Low Energy Radiations." Letter to the File, dated April 19, 1960. (1""'\.,
5.30
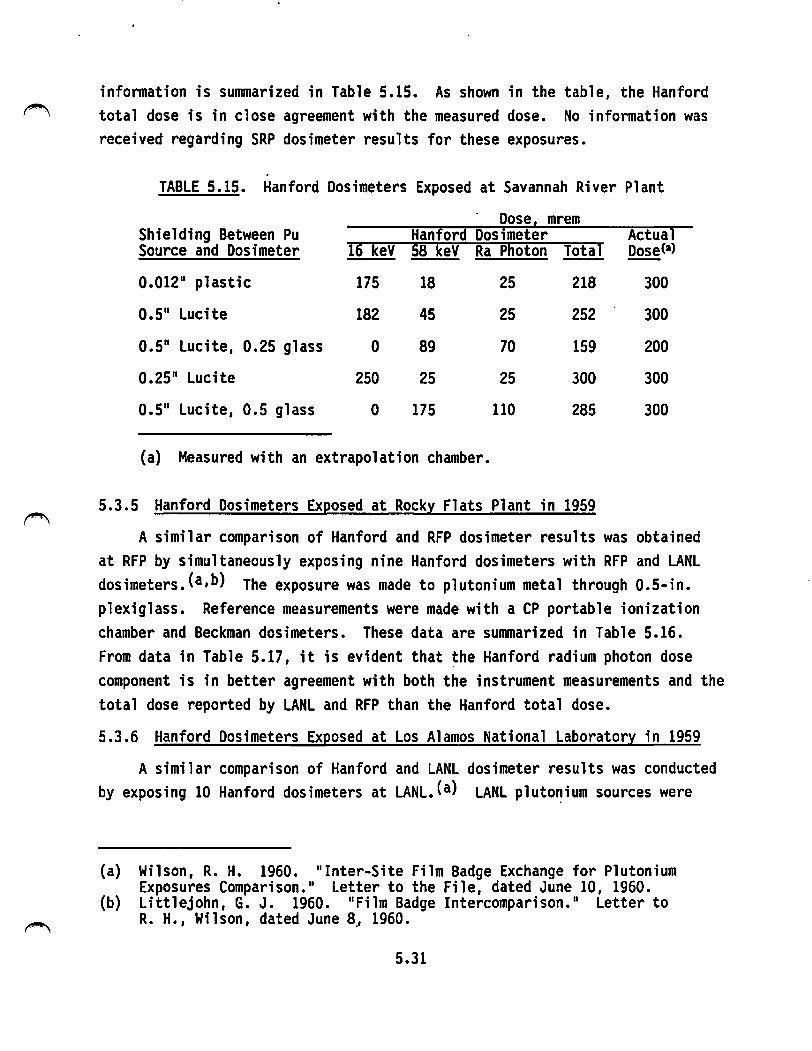
information is sununarized in Table 5.15. As shown in the table, the Hanford ~ total dose is in close agreement with the measured dose. No information was
received regarding SRP dosimeter results for these exposures.
TABLE 5.15. Hanford Dosimeters Exposed at Savannah River Plant
Dose 1 mrem Shielding Between Pu Hanfora Dosimeter Actual Source and Dosimeter I6 keV SB keV Ra Photon Total Dose<•>
0.012 11 plastic 175 18 25 218 300
0.5 11 Lucite 182 45 25 252 300
0.5 11 Lucite, 0.25 glass 0 89 70 159 200
0.25 11 Lucite 250 25 25 300 300
0.5 11 Lucite, 0.5 glass 0 175 110 285 300
(a) Measured with an extrapolation chamber.
5.3.5 Hanford Dosimeters Exposed at Rocky Flats Plant in 1959
A similar comparison of Hanford and RFP dosimeter results was obtained at RFP by simultaneously exposing nine Hanford dosimeters with RFP and LANL dosimeters.Ca,b) The exposure was made to plutonium metal through 0.5-in. plexiglass. Reference measurements were made with a CP portable ionization chamber and Beckman dosimeters. These data are summarized in Table 5.16. From data in Table 5.17, it is evident that the Hanford radium photon dose component is in better agreement with both the instrument measurements and the total dose reported by LANL and RFP than the Hanford total dose.
5.3.6 Hanford Dosimeters Exposed at Los Alamos National Laboratory in 1959
A similar comparison of Hanford and LANL dosimeter results was conducted by exposing 10 Hanford dosimeters at LANL.(a) LANL pluto~ium sources were
(a) Wilson, R. H. 1960. "Inter-Site Film Badge Exchange for Plutonium Exposures Comparison." Letter to the File, dated June 10, 1960.
(b) Littlejohn, G. J. 1960. "Film Badge Intercomparison." Letter to R. H., Wilson, dated June 8~ 1960.
5.31

TABLE 5.16. Hanford Dosimeters Exposed at Rocky Flats Plant
Hanford Dosimeter Site Doses Measurement Device 16 keV 58 keV Ra Photon Total LANL RFP Cutie Pie Beckman --108 52 275 435 295 257 230 172 50 60 255 365 320 281 246 190
102 42 255 399 240 240 244 200 151 58 255 464 335 326 264 175 92 47 255 394 270 273 203 188
116 50 315 481 285 295 241 195 77 62 255 394 260 231 244 200 75 60 230 365 255 221 235 200 58 50 210 318 230 160 235 175
used to expose dosimeters to known levels of radiation.(a) Reference measure-ments were made with an extrapolation chamber. The data for the Hanford dosimeters are summarized in Table 5.17. Hanford total doses compare closely with the extrapolation chamber measurements for the dosimeters exposed to the nickel-coated plutonium source. For the dosimeters exposed to the uncoated plutonium source, the Hanford results are low.
5.3.7 National Film Dosimeter Intercomparison Study
During the early 1960s efforts were under way to develop a national performance standard for personnel dosimeters. Hanford personnel were intimately involved with these efforts and, in 1967, published the results of a national intercomparison study of commercial and government dosimeter processing (Unruh et al. 1967; Larson et al. 1967; Unruh, Larson, and Beetle 1968). The Hanford results included in these reports are listed in Table 5.18.
The concern for the need for a minimum performance standard developed fairly early in the nuclear field, as the number of commercial processors of personnel dosimeters multiplied, and as the number of Atomic Energy Commission (AEC), AEC prime contractors, and military installations operating their own film dosimeter facilities increased. In 1963 the AEC published in the
(a) Chapman, T. S. 1966. "Film Badge Exchange Results. 11 Letter to A. R. Keene and D. Meyer, dated May 17, 1960.
5.32
(""".,
(""",,
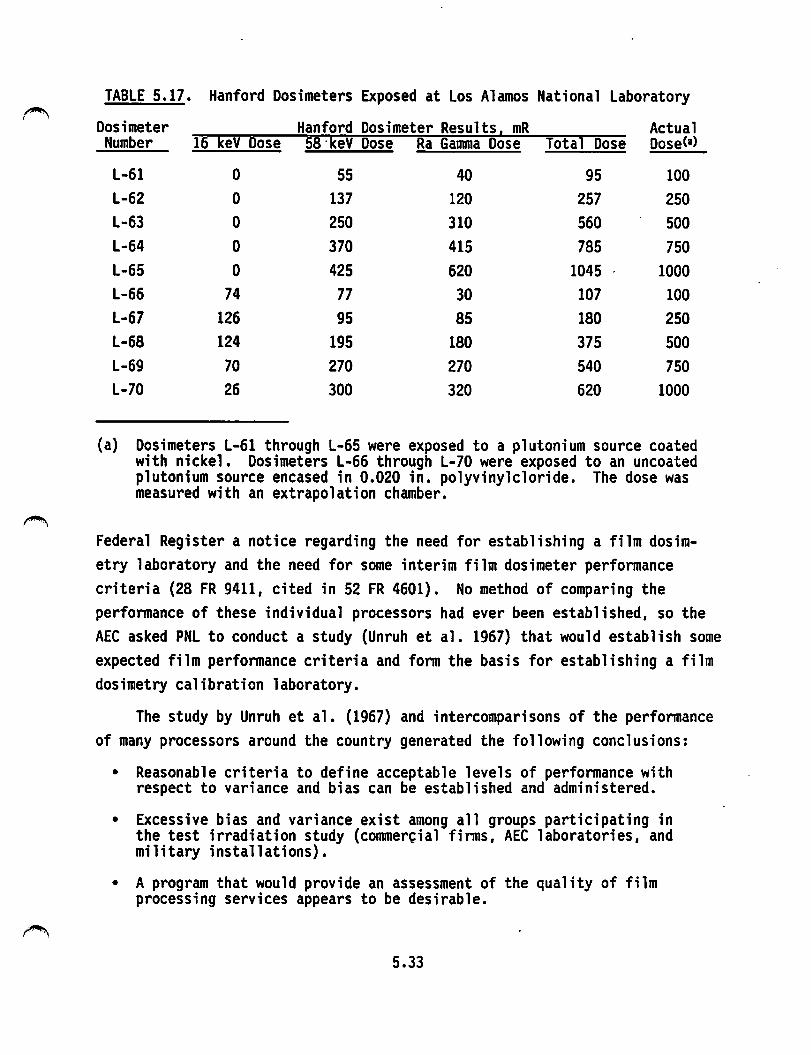
'~ TABLE 5.17. Hanford Dosimeters Exposed at Los Alamos National Laboratory
Dosimeter Hanford Dosimeter Results 1 mR Actual Number 16 keV Dose 58·1Cev Dose Ra Ganuna Dose Total Dose Dose Ca)
L-61 0 55 40 95 100 L-62 0 137 120 257 250 L-63 0 250 310 560 500 L-64 0 370 415 785 750 L-65 0 425 620 1045 1000 L-66 74 77 30 107 100 L-67 126 95 85 180 250 L-68 124 195 180 375 500 L-69 70 270 270 540 750 L-70 26 300 320 620 1000
(a) Dosimeters L-61 through L-65 were exposed to a plutonium source coated with nickel. Dosimeters L-66 through L-70 were exposed to an uncoated plutonium source encased in 0.020 in. polyvinylcloride. The dose was measured with an extrapolation chamber.
Federal Register a notice regarding the need for establishing a film dosimetry laboratory and the need for some interim film dosimeter performance criteria (28 FR 9411, cited in 52 FR 4601). No method of comparing the performance of these individual processors had ever been established, so the AEC asked PNL to conduct a study (Unruh et al. 1967) that would establish some expected film performance criteria and fonn the basis for establishing a film dosimetry calibration laboratory.
The study by Unruh et al. (1967) and intercomparisons of the performance of many processors around the country generated the following conclusions:
• Reasonable criteria to define acceptable levels of performance with respect to variance and bias can be established and administered.
• Excessive bias and variance exist among all groups participating in the test irradiation study (commercial firms, AEC laboratories, and military installations).
• A program that would provide an assessment of the quality of film processing services appears to be desirable.
5.33
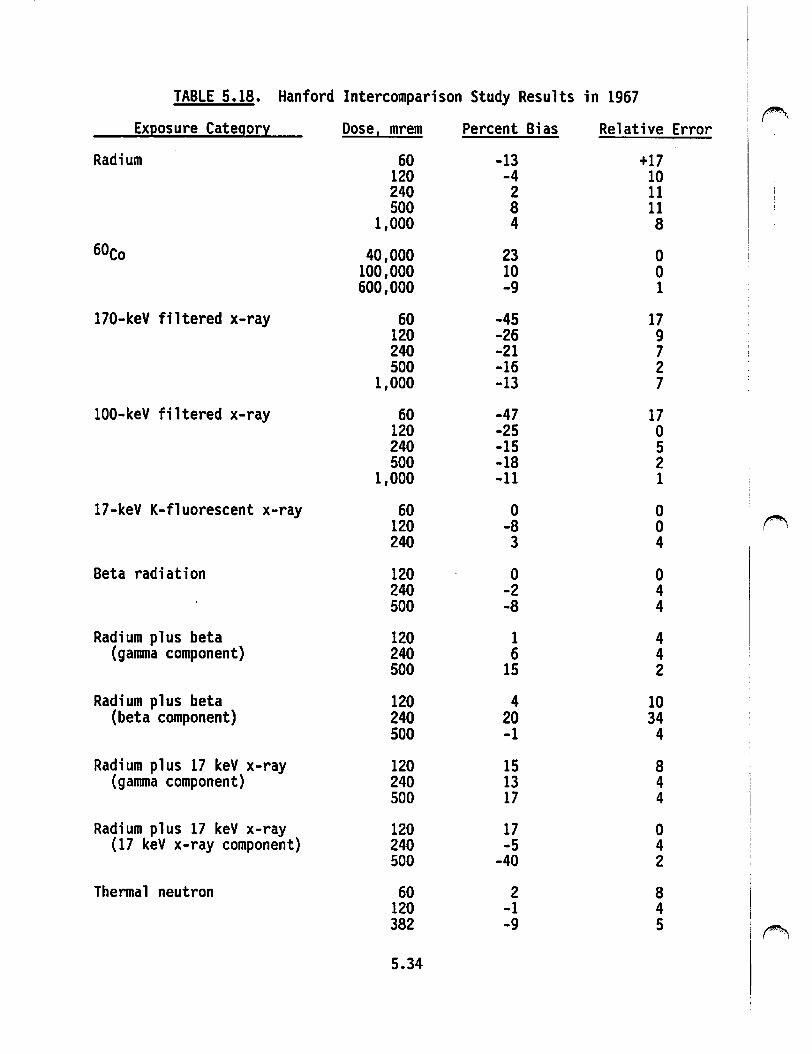
TABLE 5.18. Hanford Intercomparison Study Results in 1967 :~ I I
Exposure Category Dose, mrem Percent Bias Relative Error
Radium 60 -13 +17 120 -4 10 240 2 11 500 8 11
1,000 4 8
60co 40,000 23 0 100,000 10 0 600,000 -9 1
170-keV filtered x-ray 60 -45 17 120 -26 9 240 -21 7 500 -16 2
1,000 -13 7
100-keV filtered x-ray 60 -47 17 120 -25 0 240 -15 5 500 -18 2
1,000 -11 1
17-keV K-fluorescent x-ray 60 0 0 ("\, 120 -8 0
240 3 4
Beta radiation 120 0 0 240 -2 4 500 -8 4
Radium plus beta 120 1 4 (gamma component) 240 6 4
500 15 2
Radium plus beta 120 4 10 (beta component) 240 20 34
500 -1 4
Radium plus 17 keV x-ray 120 15 8 (gamma component) 240 13 4
500 17 4
Radium plus 17 keV x-ray 120 17 0 (17 keV x-ray component) 240 -5 4
500 -40 2
Thennal neutron 60 2 8 120 -1 4 382 -9 5 ~
5.34
I~
This study fanned the basis of efforts to develop a national dosimetry performance testing standard.
5.3.8 Comparison of Film and Thennoluminescent Dosimeters
Hanford implemented the TLD in the early 1970s. The 11 basic 11 dosimeter, consisting of a single chip of LiF, was implemented on January 1, 1971, and the multi-element dosimeter, consisting of five chips, was implemented on January 1, 1972. The basic dosimeter was intended for use by personnel with the potential for little or no routine radiation exposure. The multi-element dosimeter was intended for use by personnel with the potential for exposure to radiation. The multi-element TLD was called the multipurpose dosimeter and replaced the multi-element beta/photon and neutron film dosimeters.
Several field studies were conducted to support the implementation of the new dosimeters. Kathren (1970) presented an evaluation of the basic dosimeter. Several characteristics of the multipurpose dosimeter are described in a report by Kocher et al. (1971).
Two major types of field studies were conducted to compare the response of the multipurpose TLD and multi-element film dosimeter (Nichols et al. 1972). The first type of study involved the simultaneous placement of two multipurpose TLDs along with two beta/photon and two neutron film dosimeters on 2-gal. polyethylene jugs filled with water. The jugs were placed at 49 work locations in the Plutonium-Uranium Extraction Facility (PUREX), B-Plant, Z-Plant, 105-KE Building (reactor operating), 100-N (reactor not operating), and the 325-B, 325, and 327 Buildings. Instrument readings with a CP and a Snoopy were taken at the beginning of each measurement. A similar experiment was done in which a TEPC was used to measure the dose from fast neutrons. These data are sunmarized in Table 5.19. The data show wide variability between the results for the different measurement techniques. However, the data illustrate the general low bias of the film dosimeter results compared with the TEPC results. (Field studies were also conducted to detennine the suitability of TLDs for monitoring extremities.
The second type of field measurement involved personnel wearing TLDs and film dosimeters simultaneously. Figure 5.5 illustrates the comparison of the penetrating dose component from both dosimeter types. Similarly, Figure 5.6 illustrates the comparison of the fast neutron dose component from both
5.35
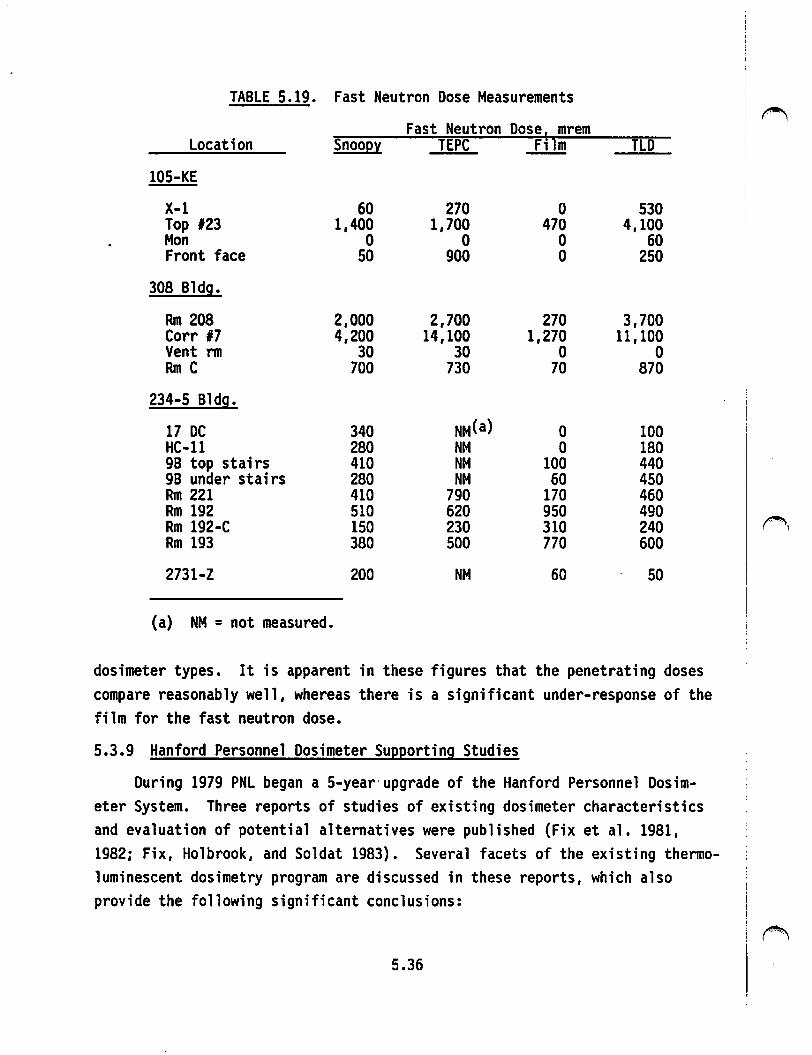
TABLE 5.19. Fast Neutron Dose Measurements
Fast Neutron Dose, mrem Location Snoopy TEPC F1lm TLD --
105-KE
X-1 60 270 0 530 Top #23 1,400 1,700 470 4,100 Mon 0 0 0 60 Front face 50 900 0 250
308 Bldg.
Rm 208 2,000 2,700 270 3,700 Corr 17 4,200 14,100 1,270 11, 100 Vent rm 30 30 0 0 Rm C 700 730 70 870
234-5 Bldg.
17 DC 340 NM(a) 0 100 HC-11 280 NM 0 180 9B top stairs 410 NM 100 440 9B under stairs 280 NM 60 450 Rm 221 410 790 170 460 Rm 192 510 620 950 490 Rm 192-C 150 230 310 240 Rm 193 380 500 770 600
2731-Z 200 NM 60 50
(a) NM = not measured.
dosimeter types. It is apparent in these figures that the penetrating doses compare reasonably well, whereas there is a significant under-response of the film for the fast neutron dose.
5.3.9 Hanford Personnel Dosimeter Supporting Studies
During 1979 PNL began a 5-year·upgrade of the Hanford Personnel Dosimeter System. Three reports of studies of existing dosimeter characteristics and evaluation of potential alternatives were published (Fix et al. 1981, 1982; Fix, Holbrook, and Soldat 1983). Several facets of the existing thermoluminescent dosimetry program are discussed in these reports, which also provide the following significant conclusions:
5.36
~
f""t1
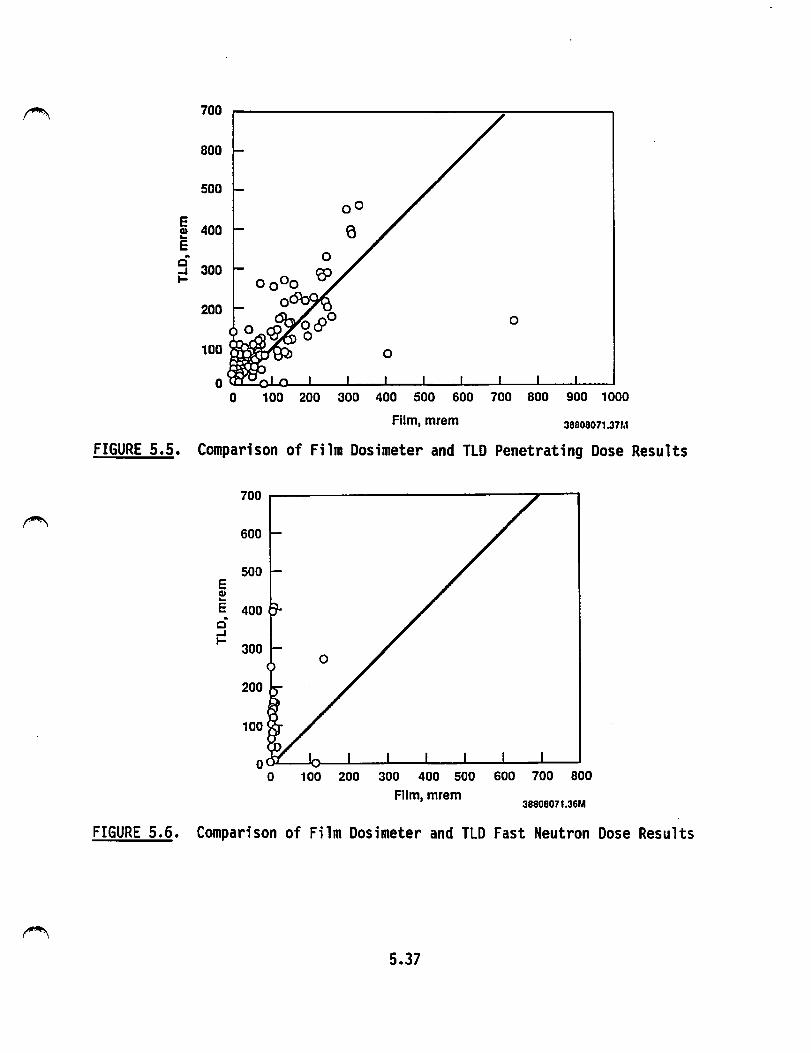
~ 700
800
500
E 400 CD .. E c 300 -J ....
200 0
100
0 0 100 200 300 400 500 600 700 800 900 1000
Film, mrem 3eooeo11.31r.1
FIGURE 5.5. Comparison of Film Dosimeter and TLD Penetrating Dose Results
700
600
500 E CD ._ E 400 c ..J ....
300
200
100
100 200 300 400 500 600 700 800
Fiim, mrem 3880B071.36M
FIGURE 5.6. Comparison of Film Dosimeter and TLD Fast Neutron Dose Results
5.37
1. The blind audit acceptance procedure used to detennine the validity of processing runs for each dose category (i.e., nonpenetrating, penetrating, fast neutron, and slow neutron) confinns the observed accuracy of the Hanford dosimeter to estimate dose, on the average, received from the laboratory calibration sources used to irradiate the dosimeters.
2. Based on the measured energy response of 10 Hanford dosimeters to selected radiation types, energies, and doses, the Hanford dosimeter response compared with the actual dose received from typical field exposures can be summarized as follows:
• The dosimeter overestimates the actual dose at all energies to filtered x-ray techniques using existing calibration procedures. Observed bias for deep and shallow doses ranged from 17% to 75% with the maximum response at an effective energy of 32 keV.
• The dosimeter response to a National Institute of Standards and Technology (NIST) D20-moderated 2s2cf source was a factor of 7 higher than the response to the routine calibration exposure.
• The present dosimeter algorithm may calculate significant falsepositive fast-neutron doses when exposed to thennal neutrons or penetrating photon radiation. Dose equivalents equal to about 30% of the delivered photon dose and as high as a factor of 6 times the delivered thennal neutron dose equivalent were observed.
• Existing dosimeter estimates of tissue dose at 1 cm from very high- ~ energy photons (-7 MeV) are about 30% to 40% low. The shallow dose is overestimated by a factor of 2 or more. Differences in buildup between the two neutron-sensitive chips (positions 3 and 4) cause the algorithm to calculate false-positive fast-neutron doses. The use of chip 5 instead of chip 2 to calculate the 1-cm-depth dose results in good agreement. Measured dosimeter dose estimates from a 16N source were in good agreement because of the presence of significant lower-energy bremsstrahlung radiation from the accom-panying high-energy beta decay.
• Field measurements using several techniques, such as a TEPC, dosimeters, multispheres, Snoopy, etc., at several Hanford locations agreed fairly well. Differences were observed at some locations where the Hanford dosimeter over-responded relative to the results obtained with the tissue-equivalent instruments. The Snoopy was observed to also over-respond but at a level less than the Hanford dosimeter.
Many potential improvements to the overall dosimetry system are discussed in these reports, as well as the necessary steps to be taken to enable Hanford to participate in national dosimeter perfonnance studies. In these studies perfonnance criteria are based on overall perfonnance. This implies that any deviation from the given dose is unacceptable. Because of these
5.38
I~
I
studies, efforts were begun to reduce any significant under- or over-response ~ of the Hanford dosimetry system to the performance categories included in ANSI
N13.11 (ANSI 1983) and later the DOE perfonnance standard (DOE 1986) •.
5.3.10 Personnel Dosimeter Accreditation
During the 1980s performance testing standards for personnel dosimeters were formally adopted (48 FR [146] 34316-34318). Participants that successfully met the various standards were accredited in one or more radiation exposure categories. The tests involved both personnel and accident level doses. Accreditation involves a two-step process: the laboratory must first pass a performance test, and then a technical program appraisal. Upon successful completion of both steps, the laboratory is accredited.
Hanford voluntarily participated in several of these tests during the early 1980s and received accreditation effective January 1, 1990, in all categories requested for testing.
5.39
CHAPTER 6.0
OFFICIAL RECORDED RADIATION DOSE
FOR HANFORD PERSONNEL
\
.:_ ·.-.
,
1 I I
. ' i
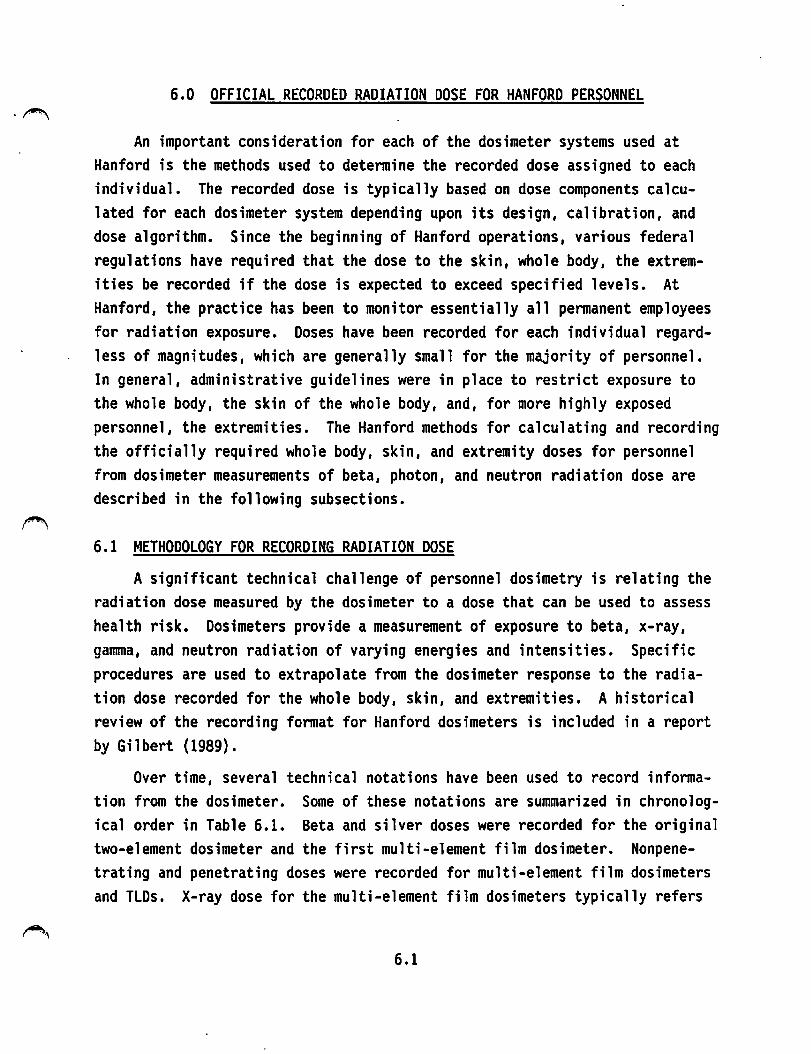
6.0 OFFICIAL RECORDED RADIATION DOSE FOR HANFORD PERSONNEL
An important consideration for each of the dosimeter systems used at Hanford is the methods used to determine the recorded dose assigned to each individual. The recorded dose is typically based on dose components calculated for each dosimeter system depending upon its design, calibration, and dose algorithm. Since the beginning of Hanford operations, various federal regulations have required that the dose to the skin, whole body, the extremities be recorded if the dose is expected to exceed specified levels. At Hanford, the practice has been to monitor essentially all permanent employees for radiation exposure. Doses have been recorded for each individual regardless of magnitudes, which are generally small for the majority of personnel. In general, administrative guidelines were in place to restrict exposure to the whole body, the skin of the whole body, and, for more highly exposed personnel, the extremities. The Hanford methods for calculating and recording the officially required whole body, skin, and extremity doses for personnel from dosimeter measurements of beta, photon, and neutron radiation dose are described in the following subsections.
6.1 METHODOLOGY FOR RECORDING RADIATION DOSE
A significant technical challenge of personnel dosimetry is relating the radiation dose measured by the dosimeter to a dose that can be used to assess health risk. Dosimeters provide a measurement of exposure to beta, x-ray, ganuna, and neutron radiation of varying energies and intensities. Specific procedures are used to extrapolate from the dosimeter response to the radiation dose recorded for the whole body, skin, and extremities. A historical review of the recording format for Hanford dosimeters is included in a report by Gilbert (1989).
Over time, several technical notations have been used to record information from the dosimeter. Some of these notations are summarized in chronological order in Table 6.1. Beta and silver doses were recorded for the original two-element dosimeter and the first multi-element film dosimeter. Nonpenetrating and penetrating doses were recorded for multi-element film dosimeters and TLDs. X-ray dose for the multi-element film dosimeters typically refers
6.1
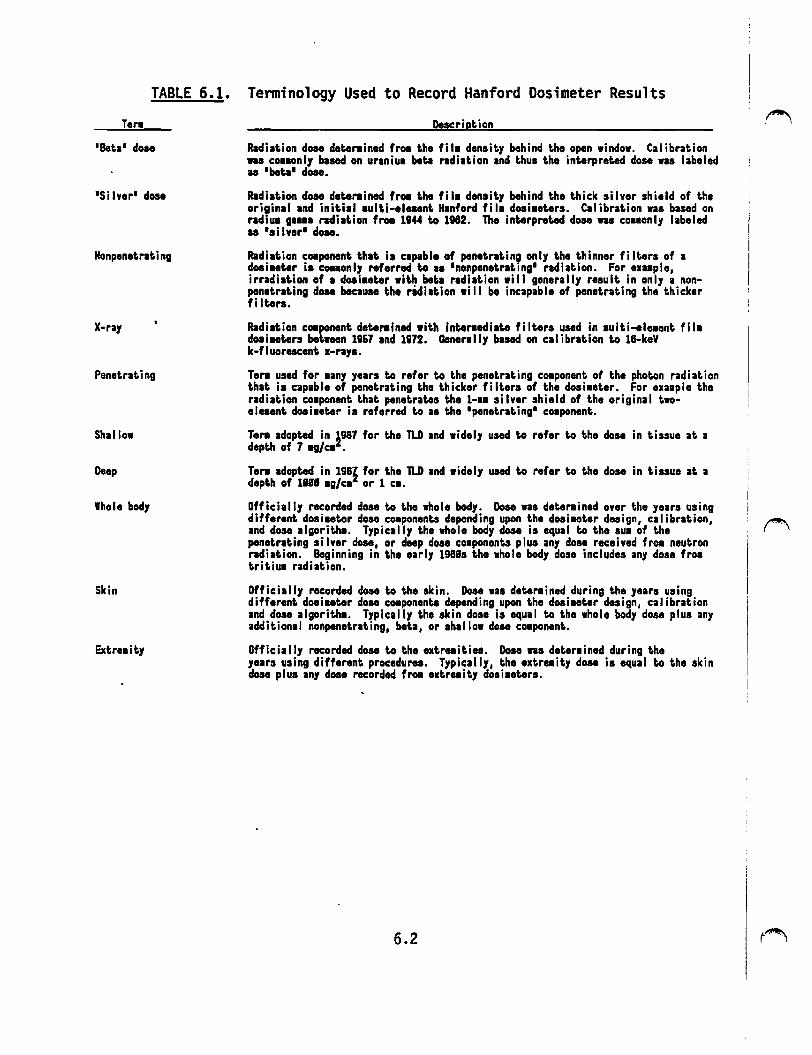
TABLE 6.1.
Ten
'Bet.a• dose
'Si Iver' dose
Nonpenet.rating
X-ray
Penet.rat.ing
Shallow
Deep
lhole body
Skin
Extreaity
Tenninology Used to Record Hanford Dosimeter Results
Description
Radiation dose dotenined froa t.he fila density behind the open window. Calibration waa coaaonly baaed on uraniu1 bet.a radi1t.ion ind thua the interpreted dose waa labeled .. 'bet1' dose.
Radiation doae deter1ined froa tho fila density behind the thick silver shield of the original ind initial 1ulti-elesent Hanford fil1 doai1oters. Calibration was based on radiua gaua radiation froa 114-4 to 1182. Tho interpreted doao waa coa1only labeled as 'silver' dose.
Radiation COlponent that is capable of penetrating only the thinner filters of a dosi1eter ia coaaonly referred to aa 1nonpenetrating1 radiation. For e11aplo1
irradiation of a doaiaeter with beta radiation will generally result in only a nonpenetrating dose because the ridiation will be incapable of penetrating the thicker fi It.era.
Radiation COlponent deter1inod with inter1ediate filters used in aulti-oloaont fi 11 doaiHters between 1967 and 1972. Qonoral ly baaed on calibration to 18-kaV k-fluoreacent 1-raya.
Ton used for 1any years to refer to the penetrating co1ponent of the photon radiation that is capable of penetrating the t.hicker filters of tho dosi1oter. For exaaplo tho radiation coaponent t.hat penetrates tho 1-•• silver shield of tho original twoolesont doaiaoter is referred to as tho 'penetrating' coaponent.
Ten adopted in 1987 for tho TLD ind widel1 used to refer to tho dose in tissue at a depth of 7 ag/ca •
Ten adopted in 1981 for the TLD and widely used to refer to the dose in tissue at a depth of 1111 ag/ca or 1 ca.
Officially recorded dose to tho whole body. Dose ns determined over tho years using different doaiaeter dose coaponents depending upon tho dosiaoter design, calibration, and dose algoritha. T1pically tho whole body dose is equal to tho sua of the penetrating silver dose, or deep dose coaponents plus any dose received froa neutron radiation. Beginning in the early 1981s the whole body dose includes any dose froa tritiua radiation.
Officially recorded dose to tho skin. Dose was det.onined during tho )'Oars using different doaiaeter dose coaponents depending upon tho doaiaoter design, calibration ind dose algoritha. T1pically the skin dose is equal to the whole body dose plus any additional nonpenetrating, beta, or shallow dose coaponent.
Officially recorded dose to the extreaitiea. Dose na deteninod during the years using different procedures. T1pically1 the e1treait1 dose is equal to the skin dose plus any dose recorded froa extreaity dosiaeters.
6.2
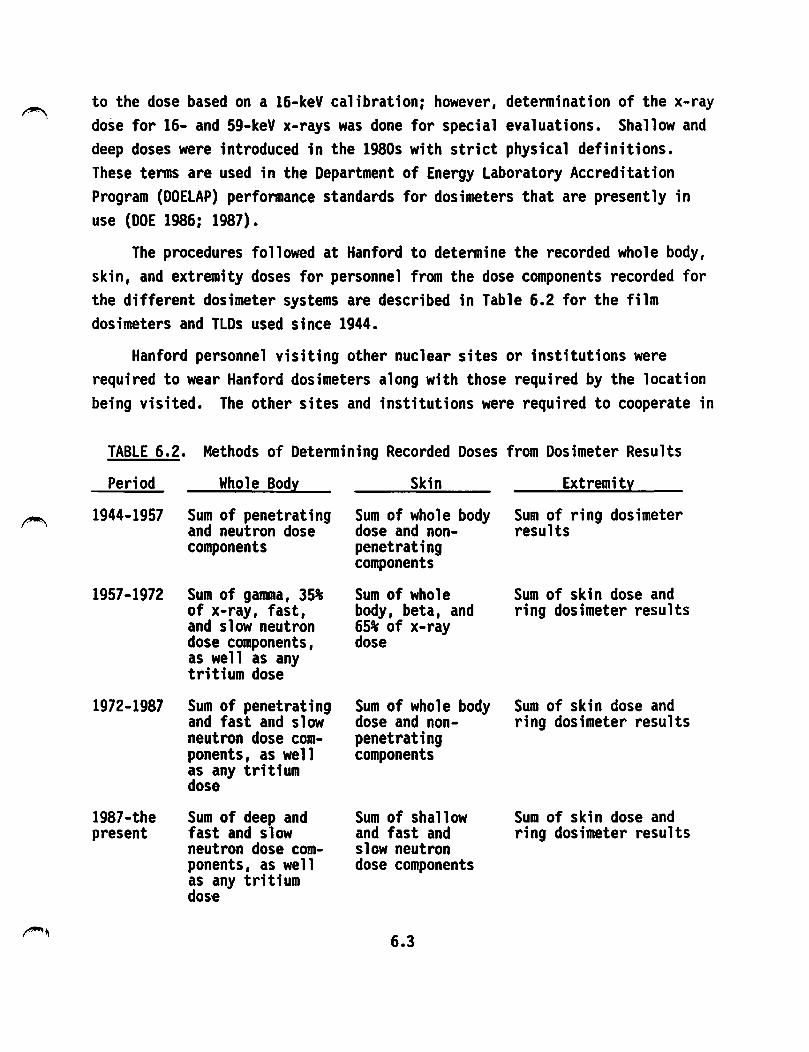
f"""~
to the dose based on a 16-keV calibration: however, determination of the x-ray dose for 16- and 59-keV x-rays was done for special evaluations. Shallow and deep doses were introduced in the 1980s with strict physical definitions. These terms are used in the Department of Energy Laboratory Accreditation Program (DOELAP) performance standards for dosimeters that are presently in use (DOE 1986; 1987).
The procedures followed at Hanford to determine the recorded whole body, skin, and extremity doses for personnel from the dose components recorded for the different dosimeter systems are described in Table 6.2 for the film dosimeters and TLDs used since 1944.
Hanford personnel visiting other nuclear sites or institutions were required to wear Hanford dosimeters along with those required by the location being visited. The other sites and institutions were required to cooperate in
TABLE 6.2. Methods of Determining Recorded Doses from Dosimeter Results
Period Whole Body Skin Extremity
1944-1957 Sum of penetrating Sum of whole body Sum of ring dosimeter and neutron dose dose and non- results components penetrating
components
1957-1972 Sum of gamna, 35% Sum of whole Sum of skin dose and of x-ray, fast, body, beta, and ring dosimeter results and slow neutron 65% of x-ray dose components, dose as well as any tritium dose
1972-1987 Sum of penetrating Sum of whole body Sum of skin dose and and fast and slow dose and non- ring dosimeter results neutron dose com- penetrating ponents, as well components as any tritium dose
1987-the Sum of deep and Sum of shallow Sum of skin dose and present fast and slow and fast and ring dosimeter results
neutron dose com- slow neutron ponents, as well dose components as any tritium dos-e
6.3

obtaining a record of their Hanford visitors ' exposures and observing the pennissible limits used at Hanford. If appropriate, bioassay sampling was included in the evaluation of offsite exposure to Hanford employees. These requirements were first published in the radiation protection standards that were issued August 1, 1952 (GE 1952). The reasons for the procedures adopted in Table 6.2 are evident from the discussion of the response characteristics of the respective dosimeters in Chapter 4.0.
6.2 RECORDS MAINTENANCE
Maintaining the radiation exposure records for all personnel has always been an important function of the radiation protection programs at Hanford. Figure 6.1 is a photo of the records maintenance office where the data for each individual worker were manually recorded and filed during the early days at Hanford. The maintenance of the exposure history for each Hanford worker has been diligently maintained and is now computerized for easy access . Today a centralized database management system is used, enabling infonnat ion to be entered daily into an individual ' s record and to be accessed immediately by authorized users via on-line data communication links.
FIGURE 6.1. Early Records Maintenance at Hanford: Manual Handl i ng and Storage of Employee Radiation Exposure Histories
6.4
CHAPTER 7.0
.PERFORMANCE OF HANFORD DOSIMETERS
\~
7.0 PERFORMANCE OF HANFORD DOSIMETERS
Dosimeter design, radiation types, energies, intensities, etc., as well as the spatial relationship between the source of radiation and the dosimeter, affect the response of the dosimeter. In some cases the dosimeter response is dependent upon the intensity of scattered radiation, either from intervening material or through backscattered radiation. Processing, calibration, and dose calculation techniques have been developed to interpret personnel dose from the .. dosimeter response. Historically, these dosimetry techniques were chosen to provide the best measurement of personnel dose consistent with the scientific knowledge available at the time.
One objective of this report is to compare the recorded whole body dose with the dose at 1000 mg/cm2 (connnonly referred to as the deep dose) in tissue for the different Hanford dosimeters. The deep dose is an internationally recognized concept used in personnel dose evaluation.
Assessment of past Hanford dosimeter performance is difficult because of the many variables and changes in methodologies over the years. The analysis presented in the following subsections is based on 1) historical documentation of dosimeter studies and development throughout Hanford operations, 2) an intercomparison of the radiation response of all Hanford dosimeter designs during 1989, and 3) the results of performance testing of the TLD during 1989.
In comparing all historical Hanford film dosimeters, the calibration and dose interpretation practices used for the different dosimeters and periods of use were followed. Data obtained from the accreditation of the Hanford TLD during 1989 are included to demonstrate the dose response for this dosimeter. This information provides the laboratory dose response of the different dosimeters to selected sources of radiation.
7.1 EVALUATION OF DOSIMETER PERFORMANCE BASED ON HISTORICAL DOCUMENTATION
As discussed in Chapter 5.0, Hanford researchers have routinely evaluated many aspects of Hanford dosimeter performance since 1944. Evaluations have included a wide spectrum of issues, including the radiation response characteristics of dosimeters or instruments, processing variables, comparison of
7.1
Hanford's interpreted dose with that of other laboratories, and internal audits.
7.1.1 Radiation Response Characteristics
The design characteristics of the different Hanford dosimeters are presented in Chapters 2.0 and 3.0. The response of these dosimeters to beta, photon, and neutron radiation has been analyzed by various Hanford researchers. In particular, published studies by Roesch, Watson, Wilson, Larson, and Kocher (described in Chapter 5.0) focused on examining the response of Hanford film dosimeters to different types and energies of radiation. The average response of the original Hanford two-element dosimeter to photon radiation was documented in 1954 (Larson and Roesch 1954) and is illustrated in Figure 7.1. The deep dose as a function of photon energy is superimposed on the original information in Figure 7.1 for comparison.
Considering that the penetrating dose for the two-element dosimeter is based directly on the film response behind the silver shield, it is apparent that the penetrating dose estimate will be underestimated with this dosimeter for photons of energy less than approximately 100 keV. This was well recognized by researchers and was a principal reason for the development of ~
the multi-element dosimeter that was implemented at Hanford in 1957. The response of all multi-element film dosimeters discussed in Chapter 2.0 is similar. The response of the 1962 dosimeter, as reported by Kocher, Bramson, and Unruh (1963), is illustrated in Figure 7.2, in which the deep dose as a function of photon energy is superimposed on the original information for comparison. Through the use of the different filtered regions of the film, the multi-element dosimeters were capable of assessing the dose to low-energy photon radiation.
In 1972 the Hanford multipurpose TLD was implemented. The crystals used in this dosimeter are significantly more 11 tissue-like 11 than film in their response to photon radiation, as illustrated in Figure 7.3. It is apparent that the response of the aluminum-filtered position of the dosimeter is very similar to the deep dose in tissue. A specific design objective in the development of this dosimeter was matching the plutonium x-ray response (i.e., 16 keV) to the deep dose in tissue.
7.2

100
10
1
I I I
'
- Open Window "'"" 1 cm Tissue ··- 0.1 cm Sliver Shield
0.01 '----l.--"--'-.J....:...._...._,____._....__,_ ............ ........,,,,..__ ....... _._._"-'-''-'-"-'
0.01 0.1 1 Photon Energy, MeV
10
38907143.8
FIGURE 7.1. Hanford Two-Element Dosimeter Response from 1944 to 1957 (Source: Larson and Roesch 1954)
--Plastic - Open Window -1 cm Tissue ....... Tantalum -·- Iron
1
0.01 L.----l.--i~.J....:...J....:..1.1----l.---l.'-"-' ...;...• ...................... _ _._....._...__ ..............
0.01 0.1 1 10 Photon Energy, MeV 38907143.10
FIGURE 7.2. Hanford Multi-Element Film Dosimeter Response from 1962 to 1972 (Source: Kocher, Bramson, and Unruh 1963)
7.3
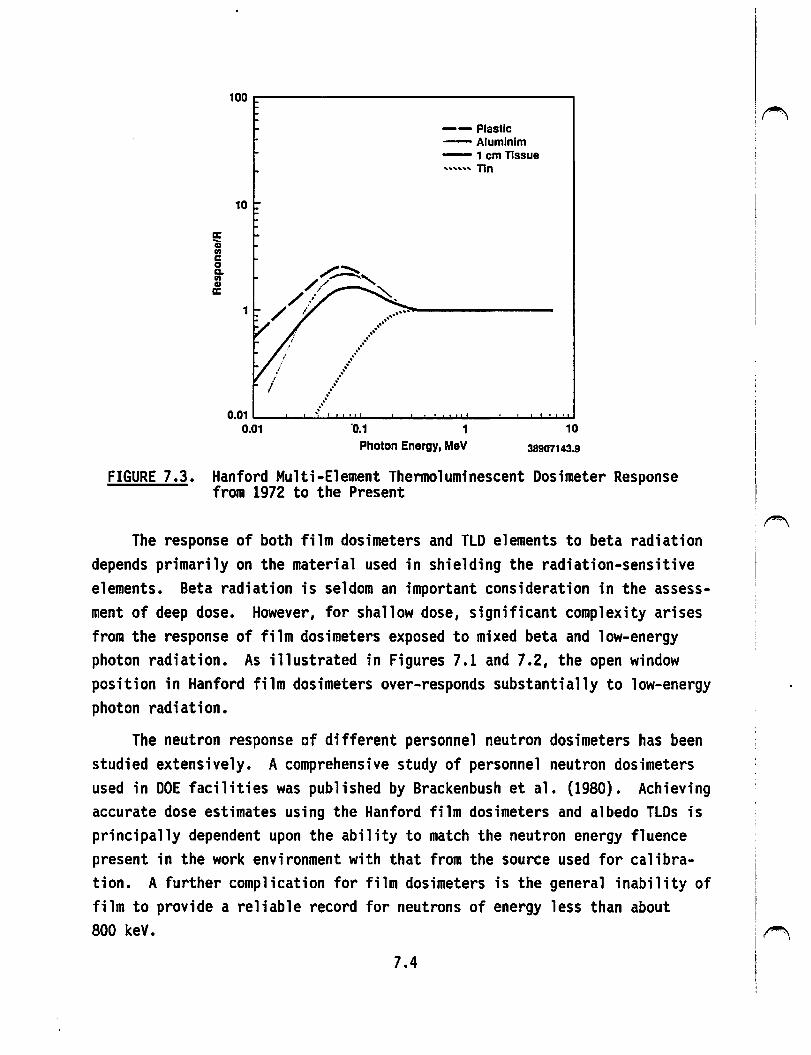
~ Ill c 0 c. Ill ID a:
10
1 _ ...... " .. .. .. .. .. .. · .. .. ..,, .......
..
-- Plastic -Alumlnlm -1 cm Tissue
............. 0.01 ._._..._._ .................... u..i...._..._.._,_-'-1..~----........................
0.01 ·0.1
Photon Energy, MeV 10
38907143.9
FIGURE 7.3. Hanford Multi-Element Thennoluminescent Dosimeter Response from 1972 to the Present
The response of both film dosimeters and TLD elements to beta radiation depends primarily on the material used in shielding the radiation-sensitive elements. Beta radiation is seldom an important consideration in the assessment of deep dose. However, for shallow dose, significant complexity arises from the response of film dosimeters exposed to mixed beta and low-energy photon radiation. As illustrated in Figures 7.1 and 7.2, the open window position in Hanford film dosimeters over-responds substantially to low-energy photon radiation.
The neutron response of different personnel neutron dosimeters has been studied extensively. A comprehensive study of personnel neutron dosimeters used in DOE facilities was published by Brackenbush et al. (1980). Achieving accurate dose estimates using the Hanford film dosimeters and albedo TLDs is principally dependent upon the ability to match the neutron energy fluence present in the work environment with that from the source used for calibration. A further complication for film dosimeters is the general inability of film to provide a reliable record for neutrons of energy less than about 800 keV.
7.4
i~ i ·.
I
The PuF4 source was implemented at Hanford in 1958 and was used to calibrate film dosimeters through 1972. With the introduction of the TLD, a sitespecific calibration was implemented, in which the dosimeter response in Hanford plutonium finishing facilities and in the laboratory exposed to the PuF4 source was normalized to the dose measured with a TEPC. The similarity between dosimeter response to neutron radiation from this source and Hanford work environments has been verified on several occasions. Prior to 1958, PoB and PoBe sources, as well as the positive ion accelerator, were used to calibrate Hanford NTA film dosimeters. Each of these sources of neutron radiation have an effective energy greater than expected to be present in Hanford work environments; thus, it is likely that recorded neutron dose was underestimated. The inability of film to accurately measure neutron radiation was recognized by Hanford radiation protection personnel from the very beginning. This resulted in the administrative practice of maintaining personnel exposures to less than allowable limits.
7.1.2 Thermoluminescent Dosimeter
The history of performance for the Hanford TLD can be separated into ~ three distinct periods during which different dose-determination methods were
used and thus impacted the x-ray and gamma radiation dose response. The radiation response of the LiF crystals used in the Hanford dosimeter is shown in Figure 7.3. Calibration and dose algorithms are used to convert this response to estimates of radiation dose. These periods and the procedures used to determine dose from the TLD during these periods are described as follows:
• From 1972 to 1984--The penetrating dose from x-ray and gamma radiation was in direct proportion to the response of the aluminumfiltered LiF phosphor in position 2. Calibration was based on exposing dosimeters in-air to radium gamma radiation until 1977 when the ca 1 i brat ion source was changed to 1a1cs.
• From 1984 to 1987--All aspects of the dosimeter and algorithm remained the same with the single exception that calibration was conducted on-phantom. A difference of about 10% is observed between in-air and on-phantom calibration. The in-air calibration results in the detennination of higher personnel doses.
• From 1987 to the present--An energy-flattening algorithm was implemented to flatten the dose response of the dosimeter for all photon energies. This resulted in improved accuracy of the deep dose for all photon energies. In addition, a new beta/photon dosimeter was
7.5
introduced to improve the capability of Hanford dosimeters for mixtures of low-energy photons and beta radiation.
The changes beginning in 1984 were based on procedures being adopted in national personnel dosimeter performance testing standards, as discussed in more detail in Section 7.3.
The neutron response of the TLD is primarily the result of reflected (i.e., albedo) neutrons from the body. As such, the response of the dosimeter is highly dependent upon the energy of the incident neutrons. At Hanford, dosimeter calibration is based upon measurements at the plutonium finishing facility's glovebox operations. The TLD responds to essentially all neutron energies important to Hanford operations. For routine calibrations the dosimeter response to the Hanford field-specific calibration is simulated by extending the exposure time by a factor of 1.73 to the bare 252cf source in the low-scatter room of the Hanford Calibration Facility (318 Building). Consistency of the laboratory simulated and measured doses in the work environment was determined on several occasions. Doses measured with TEPCs were compared with doses measured with dosimeters at the same location (Fix et al. 1981; 1982). Because of the complexities of neutron dosimetry, the overall accuracy of personnel neutron recorded dose is estimated to be • 50%.
7.1.3 Dosimeter Detection Levels
The detection level for film dosimeters was analyzed by Wilson (1960) and Baumgartner (1960). Based on their efforts, it is estimated that the detection level of the original DuPont 502 film was about 40 mR at the 95% confidence level for radium gamma radiation. The DuPont 508 film implemented during 1960 had a detection level of approximately 15 mR at the 95% confidence level for radium ganuna radiation. Each of these films is significantly more·sensitive to low-energy photons. The detection level of the thennoluminescent dosimetry system implemented in 1972 is estimated to be about 20 mR for radium ganuna radiation.
The detection level for neutron radiation for film dosimeters is highly dependent upon the energy of the neutrons. Assuming comparability of current and historical work environments, the detection level for film would be expected to be from 50 mrem to several 100 mrem. The detection level for albedo TLDs to current work environments is likely to be about 50 mrem at the
7.6
95% confidence level. The detection level for film dosimeters or TLDs is ~ significantly impacted by mixed neutron and photon exposures. There is little
doubt that neutron dose was significantly underestimated with film dosimeters for a small group of personnel invol~ed in plutonium glovebox operations.
7.2 1989 INTERCOMPARISON STUDY
In 1989 an intercomparison study of Hanford personnel film dosimeters was conducted. All types of personnel film dosimeters used at Hanford from 1944 to the present were exposed simultaneously to sources that were currently being used for calibration purposes. During the period from 1950 to 1958, neutron measurements with NTA film were made using the regular beta/photon film dosimeter in service at the time. A prototype neutron dosimeter holder was designed early in 1965 by Kocher for more accurate neutron eval~ation: it had rhodium filtration and was also included for comparison purposes. This holder was never actually placed in routine service, but work done in its development provided a basis for the development of the albedo TLD that was implemented in 1972. Hanford film dosimeter holders and the selected radiation sources and doses levels to which they were simultaneously exposed are sununarized in Tables 7.1 and 7.2, respectively. As much as possible, the original procedures for determining dose, as described in Chapter 4.0 and in Appendixes A and B of this report, were followed. Three to five dosimeters of each type were used for each radiation source. The measured response of these dosimeters was used to calculate the calibration coefficients. The results obtained are idealized, considering that variations in dosimeter response between dosimeters as well as from environmentar or radiation field effects are minimized. However, the results illustrate the dose response of the different dosimeter types and algorithms.
The delivered deep dose for each radiation type and dose level was compared with the calculated whole body dose for each dosimeter type. The results of this comparison are shown in Table 7.3. All results are tabulated in Appendix D. It is apparent from the tabulated data that the deep dose response for all multi-element film dosimeters compares well with the delivered deep dose at all energies. For the original two-element dosimeters, a significant under-response to x-rays is apparent. There is little or no response to 16-keV x-rays and a response of about 30% to 59-keV x-rays.
7.7
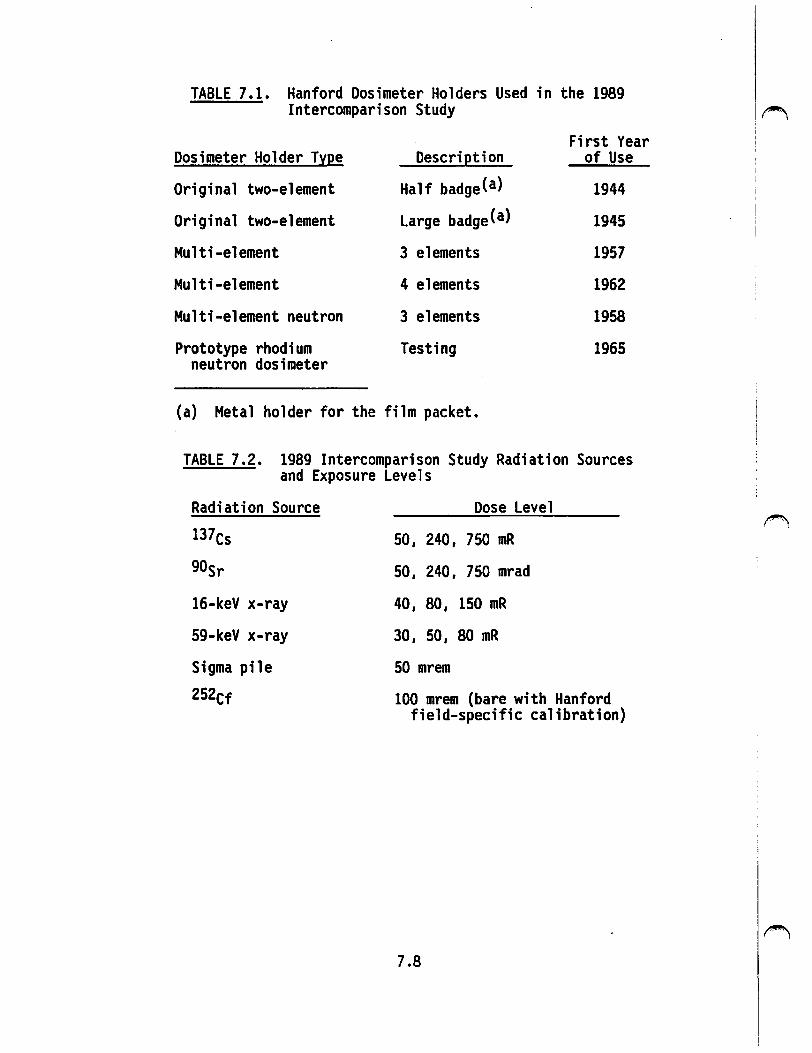
TABLE 7.1. Hanford Dosimeter Holders Used in the 1989 Intercomparison Study
Dosimeter Holder T~Qe DescriQtion
Original two-element Half badgeCa)
Original two-element Large badge(a)
Multi-element 3 elements
Multi-element 4 elements
Multi-element neutron 3 elements
Prototype rhodium Testing neutron dosimeter
(a) Metal holder for the film packet.
First Year of Use
1944
1945
1957
1962
1958
1965
TABLE 7.2. 1989 Intercomparison Study Radiation Sources and Exposure Levels
7.8
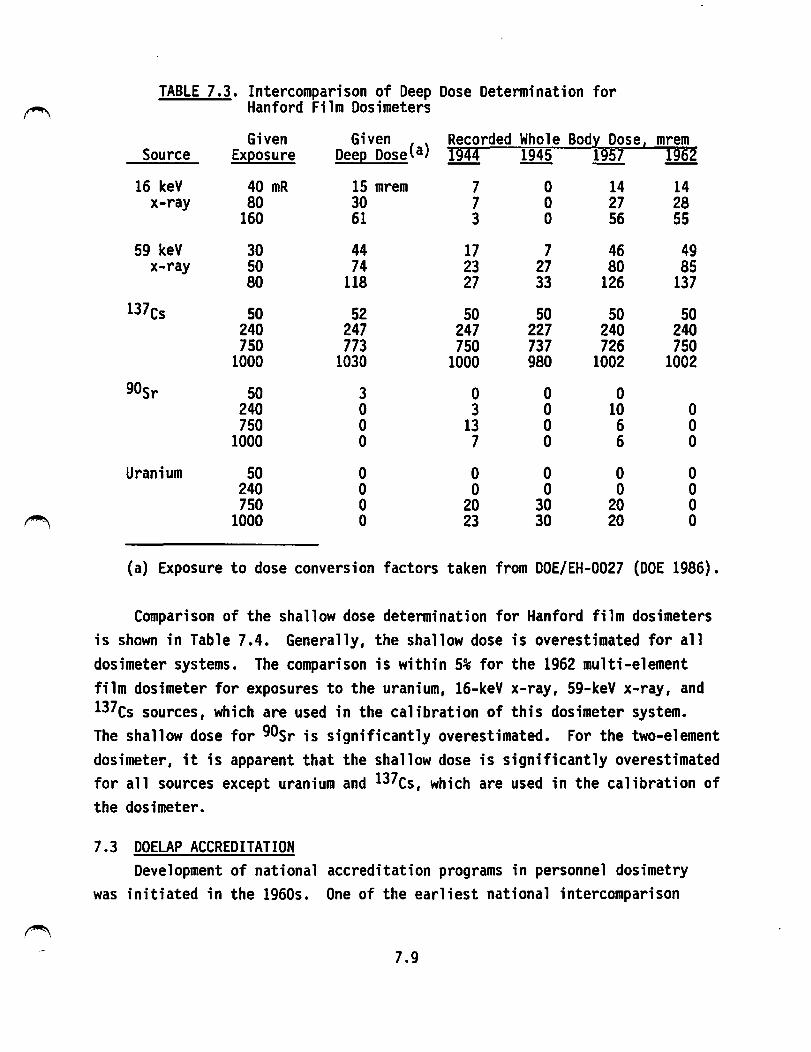
~
~
TABLE 7.3. Intercomparison of Deep Dose Detennination for Hanford Film Dosimeters
Given Given Recorded Whole Bod~ Dose, mrem Source Exposure Deep DoseCa) 1944 1945 1957 1962
16 keV 40 mR 15 mrem 7 0 14 14 x-ray 80 30 7 0 27 28
160 61 3 0 56 55
59 keV 30 44 17 7 46 49 x-ray 50 74 23 27 80 85
80 118 27 33 126 137
137cs 50 52 50 50 50 50 240 247 247 227 240 240 750 773 750 737 726 750
1000 1030 1000 980 1002 1002
90sr 50 3 0 0 0 240 0 3 0 10 0 750 0 13 0 6 0
1000 0 7 0 6 0
Uranium 50 0 0 0 0 0 240 0 0 0 0 0 750 0 20 30 20 0
1000 0 23 30 20 0
(a) Exposure to dose conversion factors taken from DOE/EH-0027 (DOE 1986).
Comparison of the shallow dose detennination for Hanford film dosimeters is shown in Table 7.4. Generally, the shallow dose is overestimated for all dosimeter systems. The comparison is within 5% for the 1962 multi-element film dosimeter for exposures to the uranium, 16-keV x-ray, 59-keV x-ray, and 137cs sources, which are used in the calibration of this dosimeter system. The shallow dose for 90sr is significantly overestimated. For the two-element dosimeter, it is apparent that the shallow dose is significantly overestimated for all sources except uranium and 137cs, which are used in the calibration of the dosimeter.
7.3 DOELAP ACCREDITATION Development of national accreditation programs in personnel dosimetry
was initiated in the 1960s. One of the earliest national intercomparison
7.9
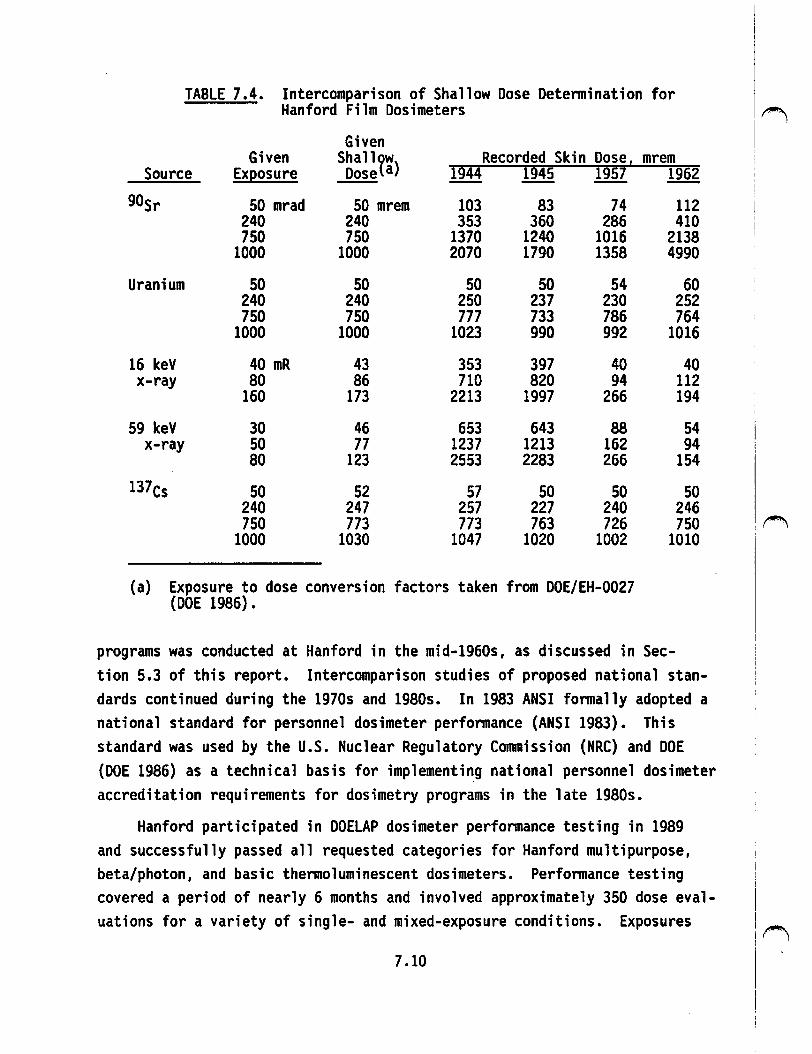
TABLE 7.4. Intercomparison of Shallow Dose Determination for Hanford Film Dosimeters
Given Given Shallyw) Recorded Skin Dose 1 mrem
Dose a Source Ex~osure 1944 1945 1957
90sr 50 mrad 50 mrem 103 83 74 240 240 353 360 286 750 750 1370 1240 1016
1000 1000 2070 1790 1358
Uranium 50 50 50 50 54 240 240 250 237 230 750 750 777 733 786
1000 1000 1023 990 992
16 keV 40 mR 43 353 397 40 x-ray 80 86 710 820 94
160 173 2213 1997 266
59 keV 30 46 653 643 88 x-ray 50 77 1237 1213 162
80 123 2553 2283 266
137cs 50 52 57 50 50 240 247 257 227 240 750 773 773 763 726
1000 1030 1047 1020 1002
(a) Exposure to dose conversion factors taken from DOE/EH-0027 (DOE 1986).
1962
112 410
2138 4990
60 252 764
1016
40 112 194
54 94
154
50 246 750
1010
programs was conducted at Hanford in the mid-1960s, as discussed in Sec-tion 5.3 of this report. Intercomparison studies of proposed national standards continued during the 1970s and 1980s. In 1983 ANSI formally adopted a national standard for personnel dosimeter performance (ANSI 1983). This standard was used by the U.S. Nuclear Regulatory Co1Tmission (NRC) and DOE (DOE 1986) as a technical basis for implementing national personnel dosimeter accreditation requirements for dosimetry programs in the late 1980s.
Hanford participated in DOELAP dosimeter performance testing in 1989 and successfully passed all requested categories for Hanford multipurpose, beta/photon, and basic thermoluminescent dosimeters. Performance testing covered a period of nearly 6 months and involved approximately 350 dose evaluations for a variety of single- and mixed-exposure conditions. Exposures
7.10
~
~
I :fl I
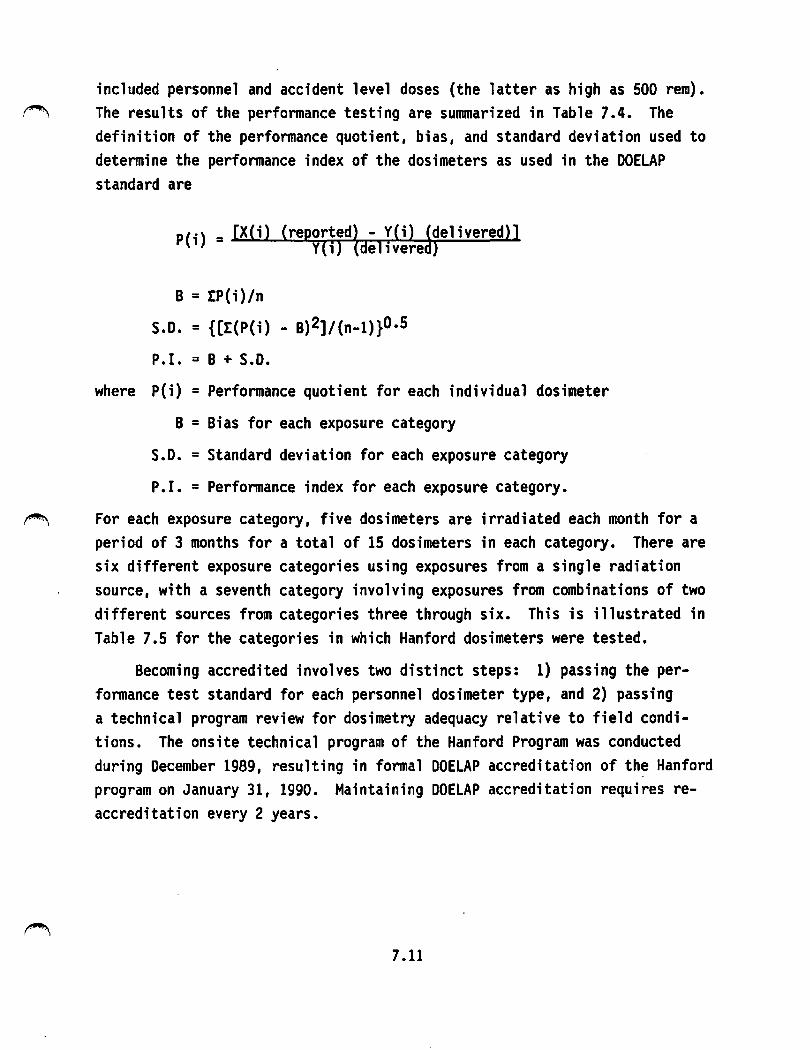
included personnel and accident level doses (the latter as high as 500 rem). ,~ The results of the performance testing are sunanarized in Table 7.4. The
definition of the performance quotient, bias, and standard deviation used to determine the performance index of the dosimeters as used in the DOELAP standard are
P(i) = [X(i) (reported! - Y(i) ~delivered)] Y(i) delivere )
B = IP(i)/n
s.o. = {[I(P(i) - B)2]/(n-l)}0.5
P.I. = B + S.D.
where P(i) = Performance quotient for each individual dosimeter
B = Bias for each exposure category
S.D. = Standard deviation for each exposure category
P.I. = Performance index for each exposure category.
~ For each exposure category, five dosimeters are irradiated each month for a period of 3 months for a total of 15 dosimeters in each category. There are six different exposure categories using exposures from a single radiation source, with a seventh category involving exposures from combinations of two different sources from categories three through six. This is illustrated in Table 7.5 for the categories in which Hanford dosimeters were tested.
Becoming accredited involves two distinct steps: 1) passing the performance test standard for each personnel dosimeter type, and 2) passing a technical program review for dosimetry adequacy relative to field conditions. The onsite technical program of the Hanford Program was conducted during December 1989, resulting in formal DOELAP accreditation of th~ Hanford program on January 31, 1990. Maintaining DOELAP accreditation requires reaccreditation every 2 years.
7 .11
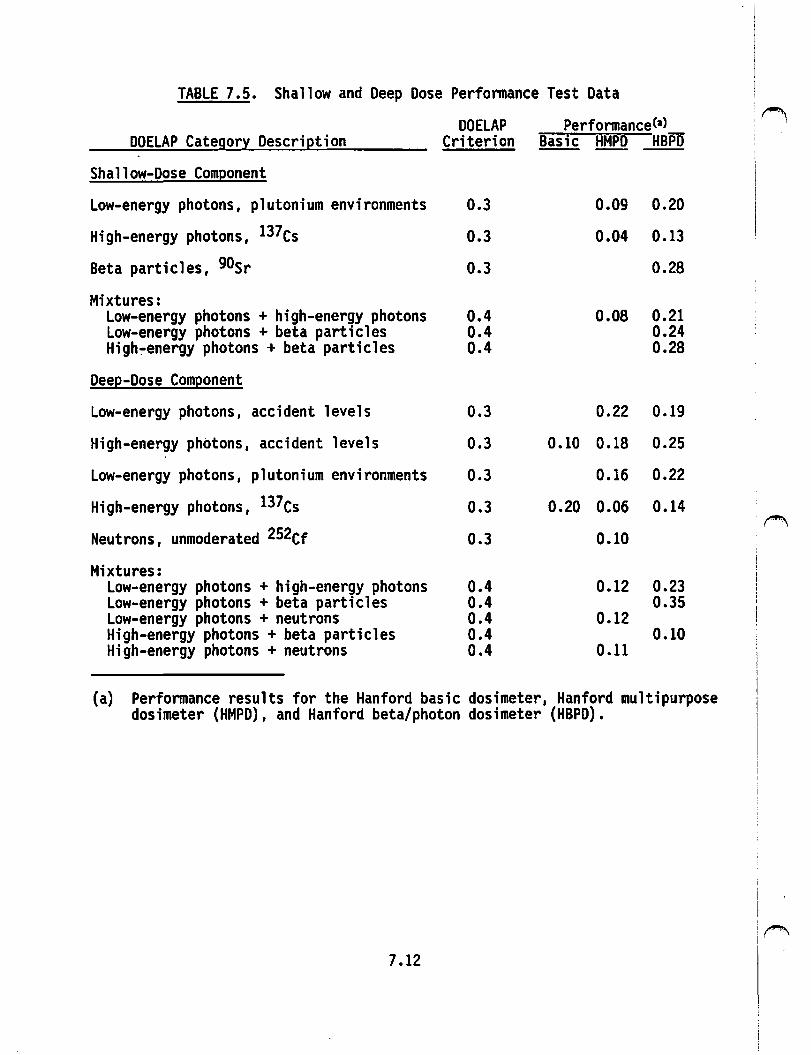
TABLE 7.5. Shallow and Deep Dose Perfonnance Test Data
DOELAP Perf onnanceCa) 'r'l DOELAP Category Description Criterion Bask HMPD HBPD
Shallow-Dose Component
Low-energy photons, plutonium environments 0.3 0.09 0.20
High-energy photons, 137cs 0.3 0.04 0.13
Beta particles, 90sr 0.3 0.28
Mixtures: Low-energy photons + high-energy photons 0.4 0.08 0.21 Low-energy photons + beta particles 0.4 0.24 High~energy photons + beta particles 0.4 0.28
Deep-Dose Component
Low-energy photons, accident levels 0.3 0.22 0.19
High-energy photons, accident levels 0.3 0.10 0.18 0.25
Low-energy photons, plutonium environments 0.3 0.16 0.22
High-energy photons, 137cs 0.3 0.20 0.06 0.14
Neutrons, unmoderated 252cf ,,-...,,
0.3 0.10
Mixtures: Low-energy photons + high-energy photons 0.4 0.12 0.23 Low-energy photons + beta particles 0.4 0.35 Low-energy photons + neutrons 0.4 0.12 High-energy photons + beta particles 0.4 0.10 High-energy photons + neutrons 0.4 0.11
(a) Performance results for the Hanford basic dosimeter, Hanford multipurpose dosimeter (HMPD), and Hanford beta/photon dosimeter (HBPD).
7.12
CHAPTER 8.0
DEEP DOSE EVALUATION
8.0 DEEP DOSE EVALUATION
In this chapter the response characteristics for Hanford film dosimeters and TLDs described in the previous chapters are used in conjunction with expected beta, photon, and neutron radiation fields present in Hanford facilities to compare the recorded whole body dose with the expected deep dose. It is important to note that the dose interpretation methods used are based on the professional knowledge of the authors through many years of experience in radiation dosimetry. The basis for each different dose assessments is described. In a few cases, conclusions provided by authors of earlier studies referenced in Chapter 5.0 may differ from conclusions presented in this chapter. This is to be expected, considering the information available at the time of the original studies, evolving dosimetry technology, and the scientific information currently available. Laboratory study reports, such as those presented in Chapter 7.0, are extremely useful, but they often do not include full descriptions of the performance of dosimeters in actual field conditions where the complex relationships of dose response with energy and fluence in mixed beta, photon, and neutron radiation fields must be con-
.~ sidered. An attempt has been made in this chapter to estimate the expected performance of Hanford dosimeters used by personnel in typical field conditions.
8.1 HANFORD PERSONNEL DOSIMETRY PRACTICES AND SYSTEMS
Hanford personnel involved in radiation work have always been required to wear personnel dosimeters in a prescribed manner. Complete records of Hanford personnel radiation exposure have been maintained since 1944. If a dosimeter record for any individual was unavailable during a routine exchange period (i.e., weekly, monthly, etc.), an investigation was conducted to determine and record a dose. Recently, Gilbert (1990) compared the computerized dose estimates used in the Hanford Health and Mortality Study with the dose that would be calculated from the original microfilm and microfiche records of film dosimeter results for 139 employees. This study concluded that there were no discrepancies that would be likely to impact the conclusions of the Mortality Study. Generally, the larger discrepancies noted occurred in the earliest years of Hanford operations (i.e., from 1944 to 1946).
8.1
From 1944 through 1989 numerous changes have been made to the Hanford dosimetry program to adopt improved methodology and to better adjust the pro- '~ gram to radiation fields present in Hanford facilities. Significant changes in Hanford dosimeters, calibration methods and sources, methods to interpret dose, and administration of the program during this 4-decade period are sununarized in Table 4.1.
8.2 HANFORD FACILITIES
Six distinct facilities at Hanford have contributed the majority of radiation dose received by personnel since Hanford startup. These are the 1) reactor fuel fabrication facilities, 2) reactors, 3) irradiated fuel reprocessing facilities, 4) plutonium finishing facilities, 5) waste facilities, and 6) general laboratory facilities. The radiation fields typical of each of these types of facilities are described as follows:
1. Fuel Fabrication--Beginning in 1944 uranium metal was fabricated into fuel elements at Hanford. During the 1960s only encapsulated fuel elements were received at Hanford for use in fabricating fuel elements.) All fuel fabrication facilities were located in the 300 Area. Beta and photon radiation from uranium comprise the external radiation fields from fuel fabrication operations. Many Hanford personnel, particularly during ~ the early years, were exposed to relatively low levels of occupational radiation from uranium in these facilities.
2. Reactors--Nine different production reactors were located in the 100 Areas of Hanford. Operations for the majority of the reactors were tenninated in the late 1960s. The Fast Flux Test Reactor initiated operations in the late 1970s. Radiation to which personnel were exposed at the reactors was typically high-energy photon radiation greater than 100 keV, because extensive shielding removed low-energy photons from the field. Neutron radiation was present but personn~l received low doses from neutron radiation compared with the dose from photon radiation. The majority of Hanford personnel exposure to beta and photon radiation occurred in the reactor facilities, primarily during maintenance operations.
3. Irradiated Fuel Re rocessin Facilities--Significant beta and photon ra 1at1on 1e s accompanied the reprocessing of irradiated fuel in several different facilities in the Hanford 200 Areas. Extensive shielding is used throughout these facility operations and thus personnel exposure is primarily due to photon radiation greater than 100 keV. Certain operations involving maintenance or decontamination involved exposure to beta and photon radiation typical of mixed fission products. Historically, these facilities provided the second largest contributor of external radiation exposure to Hanford personnel.
8.2
4. Plutonium Finishing Facilities--Plutonium finishing involves purifying plutonium and is conducted in facilities located in the Hanford 200-West Area. Most of this work is done by personnel in glovebox operations. Radiation fields are primarily from plutonium low-energy x-rays and spontaneous fission neutrons. During the early years of plutonium finishing operations, essentially all photon radiation resulted from plutonium x-rays. Later, 59-keV gamma radiation contributed significantly to the personnel exposure. The 59-keV ganma radiation was from 241Am. Americium-241 (half-life, 458 years) ingrowth resulted from the 241Pu (half-life, 14.4 years), which was present at about 1% by weight in the relatively low-exposure, "weapons-grade 11 plutonium produced at Hanford. Neutron radiation is substantially enhanced in part of the finishing operation when alpha radiation from plutonium interacts with fluorine. Although relatively few Hanford personnel were involved in plutonium finishing, these facilities provided the majority of personnel exposure to neutron radiation.
5. Waste Facilities--Personnel exposure at Hanford waste facilities, primarily in the 200 Areas, is typically from beta and photon radiation resulting from one or more mixed fission products. Many radionuclides are present in the waste streams with a broad spectrum of possible radiation energies. Extensive shielding is used in these facilities; thus the radiation fields encountered by personnel are similar to those present in the reprocessing facilities.
6. Laboratory Facilities--Personnel exposure at large laboratory facilities is typica ly from beta and photon radiation from uranium and/or plutonium
f""i'i'\ as well as one or more mixed fission products. For some laboratory facilities, external radiation exposure to low-energy photons from x-rays and/or specific radionuclides is possible.. Generally, personnel exposures are carefully considered and monitored because of the specific nature of the work. Overall, relatively few personnel were expected to be significantly exposed in these facilities. Laboratory facilities were located within all of the operating areas. However, the major laboratory facilities were located within the 200 and 300 Areas.
8.3 EVALUATION OF RECORDED DOSE
Complex interactions of radiation with matter and the comparison of dosimeter response with tissue dose result in uncertainty in the evaluation of recorded whole body dose compared with the deep dose for past Hanford dosimetry systems. Potential sources of uncertainty have been grouped for these systems, as follows:
1. Dosimeter design • Radiation response • Angular response • Energy threshold
8.3
2. Radiation fields • Geometry of exposure • Radiation types(s) • Energy
3. Dose interpretation • Calibration protocol and source{s) • Dose conversion factors • Dose algorithm.
Note that the evaluations to be presented in this report are primarily of the recorded whole body dose relative to the deep dose for beta and photon radiation. The shallow {i.e., skin) dose response of the dosimeters is more complicated due to the increased uncertainty of dosimeter response to beta and low-energy photons. However, there is little deep dose from beta radiation (i.e., energies greater than 2.0 MeV are necessary to penetrate 1 cm in tissue). Deep dose from low-energy photons is less than from higher-energy photons greater than 100 keV. An assessment of these sources of uncertainty in Hanford facilities is presented in the following subsections on doses received from beta and photon radiation and from neutron radiation. Dosimetry for personnel with little or no occupational exposure is also discussed.
8.3.1 Dose from Beta and Photon Radiation
Dosimeter design, radiation fields, and dose interpretation methods are critical elements of evaluating doses from beta and photon radiation.
Dosimeter Design
For Hanford film dosimeters, the mass density of the silver filter used from 1944 to 1961 or the tantalum filters used from 1962 to 1972 to cover the portion of film used to measure the whole body dose is approximately 1000 mg/cm2. Recorded whole body dose for any beta radiation sufficiently energetic (i.e., > 2 MeV) to penetrate these filters would result in an estimate of the deep dose. For Hanford TLDs, the whole body dose from beta radiation would be overestimated. For example, a deep dose equal to approximately 30% of the shallow dose would be recorded for the encapsulated 90sr/90y source used in DOELAP performance testing when, in fact, no deep dose should be recorded. It should be noted that beta radiation contributed little to the recorded whole body dose in Hanford facilities.
8.4
The photon radiation response of Hanford film dosimeters and TLDs is presented in Chapter 7.0 relative to the deep dose. A study of the angular response of the Hanford film dosimeter is described in Chapter 5.0 (Little 1960). Little concluded that the film density was uniform between* 75° from normal. This response is expected to be representative of all Hanford film dosimeters. The angular response of Hanford TLDs has been measured for several photon energies, showing an increase in the uniform response from approximately * 30° from normal for 16-keV photons to * 90° from normal for 137cs. The photon angular energy response of Hanford dosimeters is summarized in Chapter 7.0. These data demonstrate that Hanford dosimeters respond without any significant bias for photons of energy greater than 100 keV. The dosimeter response is nearly identical for higher-energy photons even at large incident angles. The film density behind the silver filter for the original Hanford two-element film dosimeter did under-respond to low-energy photons (as discussed in Section 8.4.1 of this chapter).
Radiation Fields
Most Hanford personnel exposure to occupational sources of radiation is received to the front of the body. Typically workers are facing the work being done and, for routine radiation exposure over long time periods, the front of the torso can be reasonably expected to receive the largest cumulative exposure. Thus, ~anford dosimeters have always been worn on the front of the torso to maximize the recorded whole body dose. For certain work environments, such as glovebox and laboratory hoods, only the upper portion of the torso, along with the dosimeter, are directly exposed.
The majority of Hanford personnel exposure is from photons. Generally, photon radiation at Hanford was of energies greater than 100 keV from mixed fission and activation products. Radiation shielding used extensively in Hanford facilities to reduce the intensity of high-energy radiations effectively removed much of the lower-energy photon radiation. Neutron radiation was present in the reactor facilities, but contributed less than 5% to personnel exposure compared with the dose from photon radiation greater than 100 keV. Low-energy photons as well as neutrons were prevalent in the plutonium finishing facilities.
8.5
Dose Interpretation
Methods used to determine dose for the different Hanford dosimeters are discussed in Chapters 2.0 through 6.0. For each dosimeter type, dose components were determined based on comparison of the observed dosimeter response behind different areas of the dosimeter with a calibration response. Dose components are identified on historical records as beta, gamma, nonpenetrating, x-ray, penetrating, etc., depending upon the dosimeter design and the methods of calibration and dose interpretation. However for all Hanford film dosimeters, the whole body dose from photon radiation was detennined fundamentally as the sum of the 11 penetrating 11 component resulting from the film response from photons that penetrate the thick silver (used from 1944 to 1962) or tantalum filters (used from 1962 to 1972), plus 35% of the 11 x-ray 11 component detennined from the film response behind the other filters (used from 1957 to 1972). This relationship is shown as follows:
Dose = Penetrating Component + 35% x-ray Component
Hanford film dosimeters were calibrated in-air to radium gamma radiation until 1965 when the dosimeters were exposed on-phantom. This practice is estimated to result in a difference of about 10% in calculated dose. The deep dose was underestimated for photons of less than 100 keV for the two-element dosimeter used from 1944 to 1957 because of the use of the single film position shielded with 1 mm of silver. With the implementation of the multielement film dosimeter in 1957, the exposure from lower-energy photons was interpreted based on a calibration exposure to 16 keV k-fluorescent radiation. In 1958 Hanford adopted the practice of adding 35% of the x-ray exposure detennined with the multi-element film dosimeter to the whole body dose component. This is very close to the exposure to a deep dose conversion factor of 0.38 used in the current DOE Laboratory Perfonnance Testing of personnel dosimeters for 16-keV photon radiation (DOE 1986).
From 1972 through 1986 the whole body dose for the multi-element TLD was based directly on the signal of the thennoluminescent chip in position 2. The signal in position 2, normalized to its response to 137cs, shows a relatively unifonn response above 100 keV, an over-response at intermediate photon energies reaching a maximum of about 35% at 40 keV, and a declining response
8.6
;~
I
for photons less than 40 keV. The response to 16-keV photons is nearly ~ equivalent to the deep dose when the dosimeter is calibrated to 137cs gamma
radiation. Procedures used to determine dose from TLDs can be divided into three distinct periods as follows:
• 1972-1984--Dosimeter was calibrated to 1a1cs gamma radiation in-air until 1984 when exposures were done on-phantom resulting in a difference of about 10% for all photon energies. For example, the dose response for 1a1cs-irradiated dosimeters on phantom is 10% higher than for similarly frradiated dosimeters in-air.
• 1985-1987--Dosimeters were calibrated on-phantom. The reported whole body dose for photons greater than about 100 keV was equal to the deep dose. For intermediate photon energies a maximum positive bias of about 35% for 40-keV photons is observed. No significant bias in reported whole body dose is observed for 16-keV photon radiation.
• 1988-1989--Dosimeter algorithm was improved. No significant deep dose bias is observed at any photon energies observed in Hanford work environs.
8.3.2 Dose from Neutron Radiation
The total whole body dose recorded at Hanford is equal to the sum of the ~ whole body dose from photons and the whole body dose from neutrons. Dose for
all Hanford neutron dosimeters was based on a direct comparison of the observed dosimeter signal during field use with the signal from a calibration exposure to a known radiation dose. Essentially four sources of neutron radiation have been used at Hanford for calibration: PoB (used from 1950 to 1957), positive ion accelerator (used from 1957 to 1958), PuF4 (used from 1958 to 1981), and 252cf (used from 1982 to the present). For the 252cf source, a site-specific calibration was implemented, in which the dosimeter response in the field and in the laboratory was normalized to the dose measured with a TEPC. During the 1950s the dose recorded from neutrons was based on the first-collision dose from the different calibration sources used at that time. All calibration sources prior to the implementation of the PuF4 source in 1958 have higher neutron energies than the energies of neutrons in work environments of Hanford reactor and plutonium finishing facilities. This situation resulted in an underestimate of the actual neutron dose.
It is known that, until the introduction of the TLD in 1972, the recorded whole body dose from neutron radiation in Hanford facilities was
8.7

underestimated. The boron-lined pencil dosimeter used from 1944 to 1949 responded to thermal neutron radiation only, whereas the majority of personnel exposure occurred from intermediate energy neutrons that were not measured. The NTA film introduced in 1950 had an energy threshold of approximately 800 keV. The majority of Hanford personnel exposure is expected to result from neutrons between 200 keV and 500 keV based on measurements conducted during the 1970s and 1980s. These energies are less than the energy threshold of the NTA film and, as such, were not measured.
Calibration of Hanford TLDs based on PuF4 has been verified on several occasions during the 1970s and 1980s using parallel measurements between the dosimeter and neutron dose instruments, including Bonner spheres and TEPCs. The neutron spectrum was also determined.
The determination of dose from neutrons is complex. The dose from neutrons is currently based on the maximum dose equivalent in a 30-cmdiameter tissue-equivalent sphere as defined by the International Commission of Radiation and Measurements (ICRU 1988). This dose is not easily converted to a deep dose in tissue as is done for photons because of greater uncertainty
'~ ' .
in the dosimeter response and because of the energy fluence of neutrons in the ~
workplace.
8.3.3 Dosimetry for Personnel with Little or No Occupational Exposure
It has been Hanford practice to monitor nearly all personnel for external radiation exposure. This includes personnel in facilities where no occupational radiation exposure is received and where the total radiation exposure is essentially equal to natural background radiation levels. The majority of Hanford personnel fall within this category. The relative uncertainty in the measurement of doses near background levels is very large. With film dosimeters this occurs because at low doses a small change in the net optical density (the quantity actually measured) results in a large change in the estimated exposure. For example, in an investigation of film dosimetry in atmospheric nuclear tests (NAS 1989), the uncertainties introduced in laboratory processing and calibration of film dosimeters for many of the test series evaluated were assessed by assigning a standard error that was 10% of the estimated exposure for exposures above 200 mR. However, this standard error was judged to be about 20%, 50%, and 100% for readings of 100 mR, 40 mR,
8.8
and 20 mR, respectively. This means that exposures below about 40 mR could f""'\ not be statistically distinguished from zero. Similar results would be
expected for the Hanford dosimetry system used from 1944 to 1957. Large relative errors at low doses would also be expected for the Hanford dosimetry system.
An additional problem occurs because the estimation of occupational dose requires adjustment for background exposure, which is accomplished by subtracting readings from control dosimeters. For personnel with little or no true occupational dose, this subtraction can yield negative estimates and these estimates are recorded as zeros. Because positive results for unexposed personnel are recorded and are not compensated by the subtraction of negative results, cumulative doses for personnel with little or no occupational exposure tend to be overestimated.
In addition, examination of data on the proportion of readings recorded as zero for various groups of Hanford personnel (Gilbert 1990) suggests that practices for handling very low recorded exposures may have varied from year to year. These procedures are not well documented and it is difficult to
~ assess the bias that may have resulted. However, it should be noted that doses as low as 10 mR were recorded in all years.
The problems noted above were not of great concern for radiation protection purposes because the doses involved are much smaller than regulatory limits. The difficulties in measuring very low doses are not considered further in this report. However, it is emphasized that distinctions between very low doses or between small positive exposures and zero exposure are not likely to be meaningful.
8.4 DOSIMETER RESPONSE IN HANFORD FACILITIES
The dose response of past Hanford dosimeter systems can be estimated by considering the radiation fields in Hanford facilities (as discussed in Section 8.2) and the uncertainties in dosimeter response (as discussed in Section 8.3). The expected performance of the Hanford two-element film dosimeter, Hanford multi-element film dosimeter, and Hanford multi-element TLD are discussed in the following subsections. In the material that follows, bias correction factors are specified. These bias factors are intended to
8.9
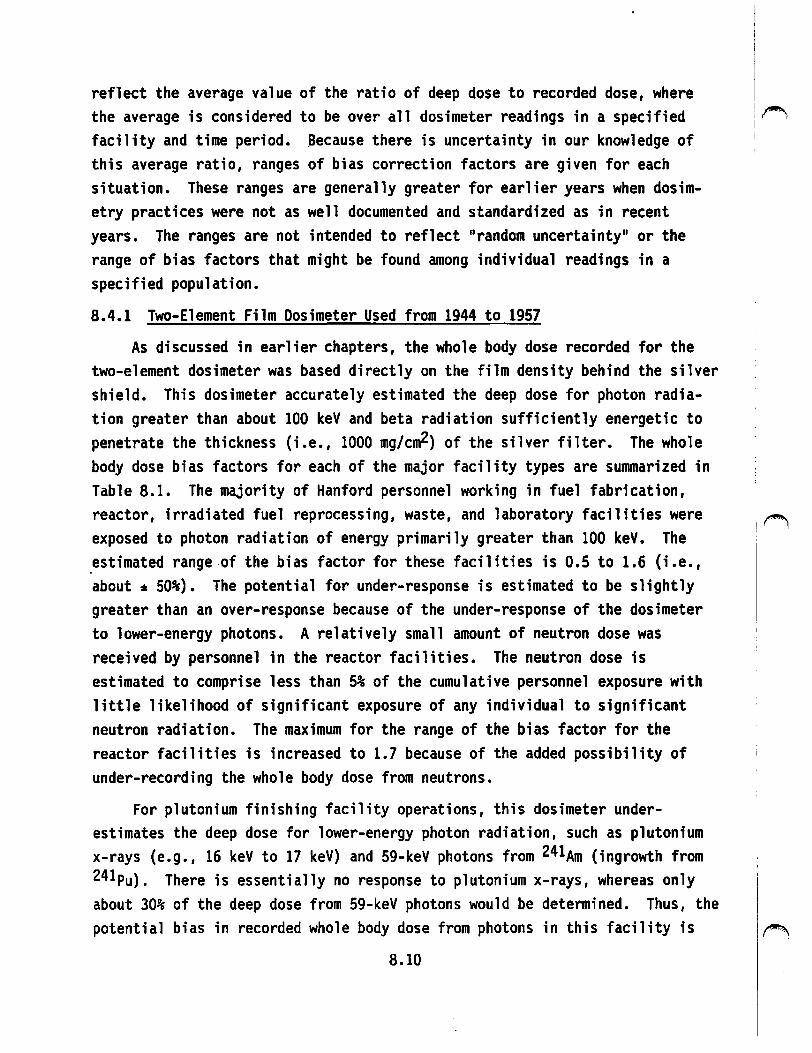
reflect the average value of the ratio of deep dose to recorded dose, where the average is considered to be over all dosimeter readings in a specified r•·'\ facility and time period. .Because there is uncertainty in our knowledge of this average ratio, ranges of bias correction factors are given for each situation. These ranges are generally greater for earlier years when dosim-etry practices were not as well documented and standardized as in recent years. The ranges are not intended to reflect "random uncertainty" or the range of bias factors that might be found among individual readings in a specified population.
8.4.1 Two-Element Film Dosimeter Used from 1944 to 1957
As discussed in earlier chapters, the whole body dose recorded for the two-element dosimeter was based directly on the film density behind the silver shield. This dosimeter accurately estimated the deep dose for photon radiation greater than about 100 keV and beta radiation sufficiently energetic to penetrate the thickness (i.e., 1000 mg/cm2) of the silver filter. The whole body dose bias factors for each of the major facility types are summarized in Table 8.1. The majority of Hanford personnel working in fuel fabrication, reactor, irradiated fuel reprocessing, waste, and laboratory facilities were ~
exposed to photon radiation of energy primarily greater than 100 keV. The _estimated range of the bias factor for these facilities is 0.5 to 1.6 (i.e., about• 50%). The potential for under-response is estimated to be slightly greater than an over-response because of the under-response of the dosimeter to lower-energy photons. A relatively small amount of neutron dose was received by personnel in the reactor facilities. The neutron dose is estimated to comprise less than 5% of the cumulative personnel exposure with little likelihood of significant exposure of any individual to significant neutron radiation. The maximum for the range of the bias factor for the reactor facilities is increased to 1.7 because of the added possibility of under-recording the whole body dose from neutrons.
For plutonium finishing facility operations, this dosimeter underestimates the deep dose for lower-energy photon radiation, such as plutonium x-rays (e.g., 16 keV to 17 keV) and 59-keV photons from 241Am (ingrowth from 241pu). There is essentially no response to plutonium x-rays, whereas only about 30% of the deep dose from 59-keV photons would be determined. Thus, the potential bias in recorded whole body dose from photons in this facility is
8.10
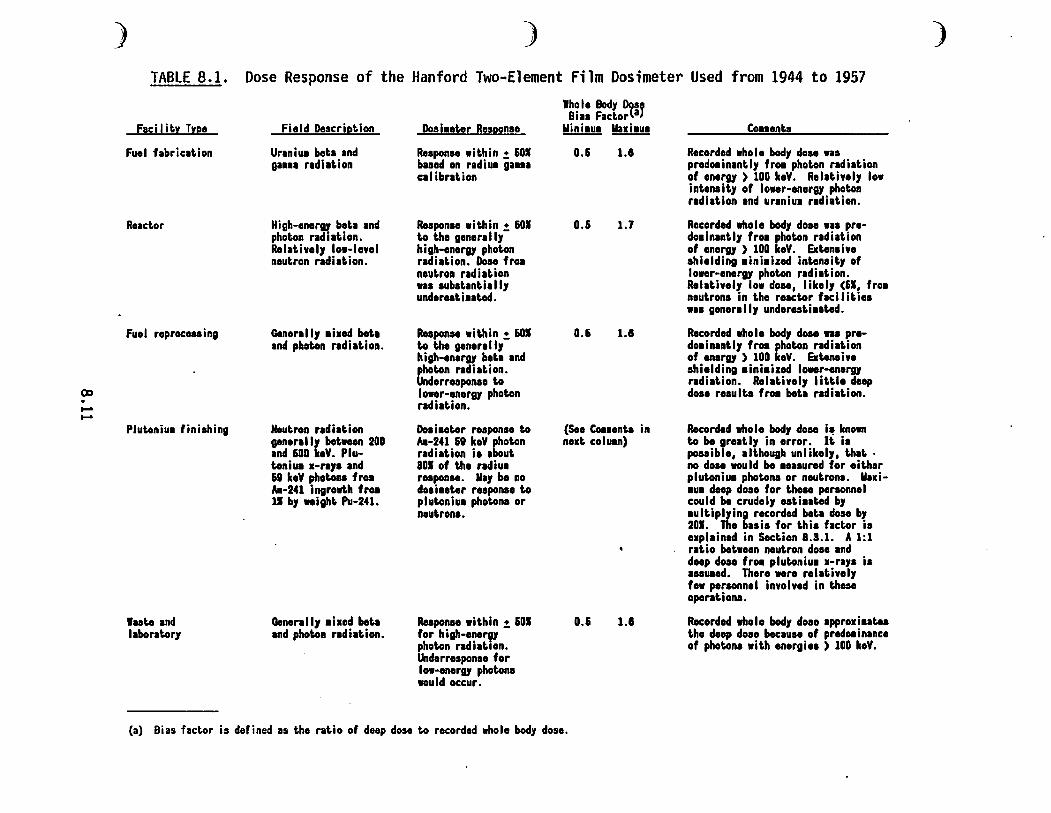
()0 . --
) )
TABLE 8.1. Dose Response of the Hanford Two-Element Film Dosimeter Used from 1944 to 1957
Faci I it.r Trpe
Fuel fabric1t.ion
React.or
Fuel reprocoaaing
Plut.oniu1 f inillhing
laat.e ind l1bor1t.ory
Field Descript.ion
Ur1niU1 bot.a and g1111 r1di1t.ion
High-enerQl bat.1 ind phot.on r1d11t.ion. Rol1t.ively low-level naut.ron r1di1t.ion.
Gener1ll7 •ixed bot.1 ind phot.on r1di1t.ion.
Neut.ron r1di1t.ion 9ener1ll7 bot.wean 200 ind 600 keV. Plut.onin x-raya and 69 keV phot.ona fro1 All-241 ingrowth fro 11 b7 •ight. Pu-241.
Generall7 •ixed bet.1 ind phot.on r1di1t.ion.
Dosi1et.er Response
Response wit.bin ! 601 based on r1diu1 91111 c1libr1t.ion
Response wit.bin ! 60I t.o t.he genera 117 high-energy phot.on r1di1t.ion. Dose fro neut.ron r1di1t.ion waa eubet.1nt.i1lly undereat.i•1t.ad.
Roeponse wit.bin ! 601 t.o t.he generally high-eneru bet.1 and phot.on r1di1t.ion. ~derreaponae t.o lower-ener91 phot.on r1di1t.ion.
Doai11t.er response t.o All-241 69 keV phot.on r1di1t.ion ia about. 3DI of t.he r1diU1 reaponse. U1y be no doei•et.er response t.o plut.oniu1 phot.ons or naut.rons.
Roeponse wit.hin ! 601 for high-eneru phot.on r1di1t.ion. ~derresponse for low-ener91 phot.ona would occur.
Whole Body Doso Bias F1ct.orlaJ
Uini•u• Uaxl1u1
O.& 1.8
O.& 1.7
0.6 1.8
(Seo Coll1ent.a in next. colU1n)
O.& 1.8
(a) Bias fact.or is defined as the ratio of deep dose t.o recorded whole body dose.
Co1Hnts
Recorded whole body dose w1s predo1inant.l7 fr01 phot.on r1di1t.ion of ener91 ) 100 keV. Rel1t.ivel7 low int.ensit.7 of lower-enor91 phot.on r1diat.ion and uraniu1 r1di1t.ion.
Recorded whole body dose 1111s predoainant.11 fro• phot.on radi1t.ion of energy ) 100 keV. Ext.ansive shielding •ini1izod int.ensit.1 of lower-energy phot.on radiat.ion. Relat.ivel1 low dose, likel1 (61, froa neut.rons int.he react.or f1cilit.ies 1111s general 11 undereat.i11t.od.
Recorded whole bod1 dose 11111 predoin1nt.l1 fro phot.on radi1t.ion of enar91 ) 100 keV. Ext.ensivo shielding aini1izocl lower-energy r1di1t.ion. Rel1t.ivel7 lit.t.le deep dose reault.s froa bot.a radi1t.ion.
Recorded whole body dose i~ known t.o bo gre1t.l1 in error. It. is posaible, alt.hough unlikel7, t.h1t. · no dose would bo 10asured for either plut.oniua phot.ons or nsut.rona. Maxiau1 deep dose for t.hese personnel could bo crudel1 eat.i11t.od b7 •ult.ipl1ing recorded bot.a dose by 201. The b1si1 for t.hia fact.or is explained in Sect.ion 8.3.1. A 1:1 rat.lo bet.ween neut.ron dose ind deep dose fro1 plut.oniu1 x-r111 is asauaod. There were rel1t.ivel1 few personnel involved in t.heae oporat.ions.
Recorded whole bod1 dose 1pproxi11t.e1 t.ho deep dose because of preda.in1nce of phot.ons wit.h energies ) 100 lceV.
)
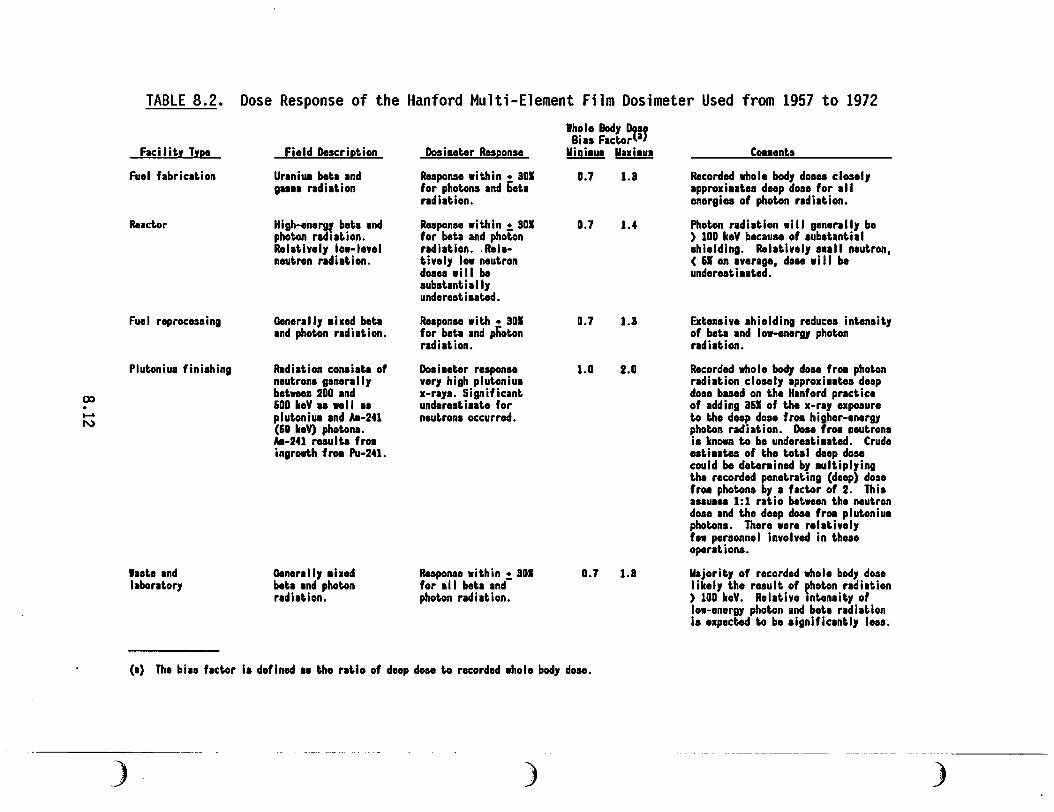
TABLE 8.2. Dose Response of the Hanford Multi-Element film Dosimeter Used from 1957 to 1972
lhole Boc11 ~7 Bi11 Factor a
Faci I it1 T11!! Field Descrietion Dosi•et.or Reseonse Uini•ue Ua1ieua CoHents
Fuel fabrication Urani1111 beta and Respon11t1 within ! 301 0.7 1.3 Recorded whole bod1 doaoa cloael1 ga1H radiation for photons and beta appro1i•atoa doop dose for all
radiation. energies of photon radiation.
Reactor Hi9h-onor91 beta and Response within !. 301 0.7 1.4 Photon radiation will 9onor1ll1 bo photon radiation. for beta and photon ) 100 keV because of substantial Rolativel1 low-level radiation •. Rela- shielding. Rol1tivel1 •••II neutron, neutron radiation. tivel1 low neutron ( 61 on average, dose will be
dosoa wi II be undereati•ated. aubstantial 11 undoroatiHtod.
Fuel roprocouing Oonorall1 ai1od beta Response with ! 301 D.7 1.3 Extensive shielding reduces int.onsit1 and photon radiation. for beta and photon of bot• ind low-oner91 photon
radiation. radi1tion.
Plutoniua finishing Rldiation conaiot.a of DosiHter response 1.0 2.0 Recorded whole bodJ dose froe photon neutrons gener1ll1 vor1 high plutoniua radiation closol1 1ppro1i•1tos deep
CD between 200 and 1-ra1a. Significant dose baaed on tho Hanford practice . 600 keV as .. 11 as underestiaat.o for of adding 361 of the 1-ra1 exposure
...... plutoni1111 ind Aa-241 neutrons occurred. to the deep dose froa higher-ener111 N (69 keV) photons. photon radiation. Dose froe neutrons Aa-241 roaulta fro• is known to be undoroatia1ted. Crudo ingrowth froa Pu-241. eatiaatoa of the total deep dose
could be dot.orainod b1 aultiplf ing the recorded penetrating (deep dose frot1 photona b1 1 factor of 2. This aaauaoa 1:1 ratio between tho neutron dose and the deep dose froe plutoniu• photons. There ware rel1tivel1 few poraonnol involved in those operations.
laato and Oonersll1 alxod Response within ! SDI 0.7 1.8 Uajorit1 of recorded whole bod1 dose laborator1 beta and photon for all beta and likel1 tho result of photon radiation
radiation. photon radiation. ) 100 koV. Relative intonsitJ of low-enor91 photon and beta radiation is expected to bo aignif ic1ntl1 leas.
(a) The bi1a factor is dof inod as the ratio of deep dose to recorded whole bod1 dose.
) ) )
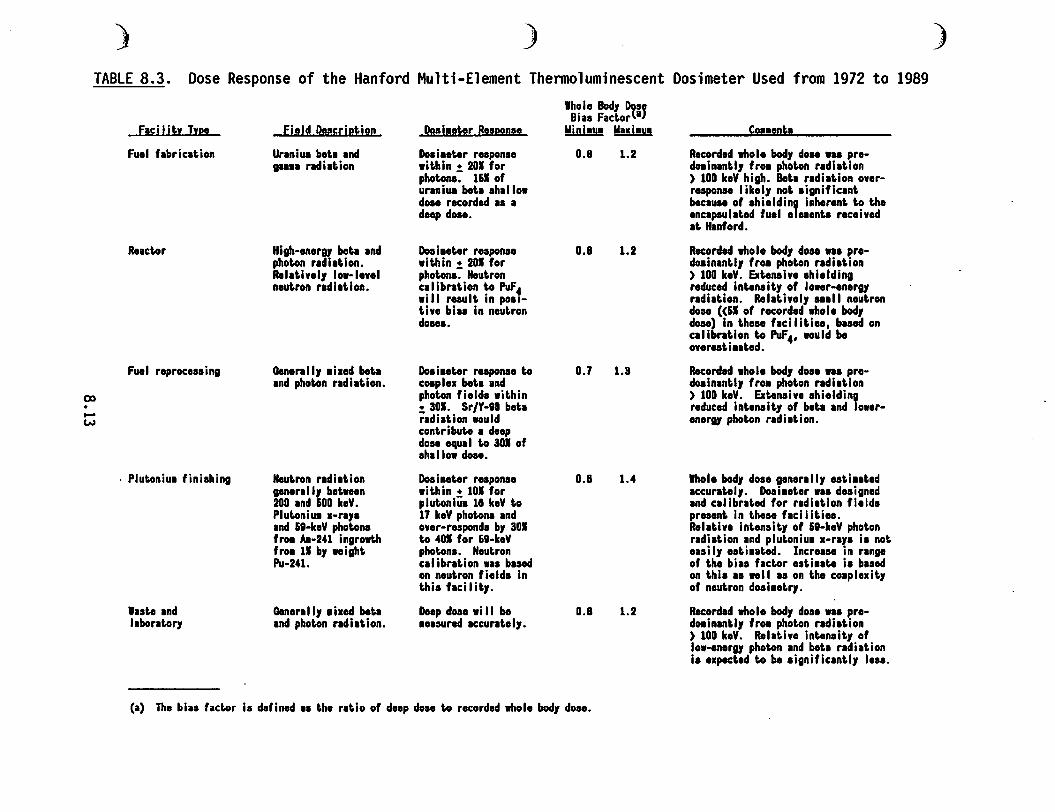
) ) )
TABLE 8.3. Dose Response of the Hanford Multi-Element Thermoluminescent Dosimeter Used from 1972 to 1989
lholo Body ~·J Bias Fact.or 1
Faci I it.1 T1e• Field Descriet.ion Doai•et.or Resl!!!nae Uini•u• U11i•u. CoHent.s
Fuel fabricat.ion Uranium bet.1 ind Doliaet.er response 0.8 1.2 Recorded whole body do .. waa pre-9a1H radi1t.ion wit.hin ! 201 for doain1nt.l1 froa phot.on radi1t.ion
phot.on1. 161 of ) 100 keV high. Bet.1 r1dl1t.ion over-uranium bet.1 shallow roaponao likel1 not. significant. dose recorded as 1 because of ahieldiny Inherent. t.o t.ha dsep doao. onc1paulat.od fuel o eaent.s received
1t. Hanford.
Re1ct.or Hi9h-onor91 bet.1 and Doaiaet.or roaponao 0.8 1.2 Recorded whole bod7 dose waa pro-phot.on radi1t.ion. wit.bin ! 201 for doain1nt.l1 fro. phot.on r1di1t.ion Ral1t.ivol1 low-level phot.ona. Hout.ron ) 100 keV. Ext.onaivo shielding naut.ron r1di1t.ion. c1librat.ion t.o PuF4 reduced int.onait.y of lowor-onor11
will roault. in pos1- radi1t.ion. Ral1t.ivol111111 nout.ron t.ivo bi11 in nout.ron doae (<61 of recorded whole bod1 doaoa. doa•i in t.heao f1cilit.ioa, baaed on
call rat.ion t.o PuF4, would be ovoroat.iHt.od.
Fuel roprocoaaing Oonor1ll11ixod bet.1 Doaiaet.or response t.o 0.7 1.8 Recorded whole bod1 dose w1a pro-ind phot.on r1di1t.ion. coaplo1 bet.1 ind doain1nt.l1 froa phot.on r1di1t.ion
<X> phot.on fields wit.bin ) 100 koV. Ext.onaive ahieldiny . ! 301. Sr/Y-10 bot.1 reduced int.enait.1 of bet.1 and ower-- r1di1t.ion would onor11 phot.on r1di1t.ion. w cont.ribut.o 1 deep doa1 equal t.o 301 of ah11low dose.
· Plutoniu1 finishing Hout.ron r1di1t.ion Dosiaet.er response 0.8 1.4 lholo bod1 dose gonor1ll1 oat.i11t.1d g1n1r1ll1 bet.ween wit.bin • 101 for 1ccur1t.ol1. Doaiaeter ••• designed 200 and 600 keV. plut.onlua 18 kaV t.o and c1libr1tod for r1di1tlon fields Plutoniua 1-r111 17 koV phot.ona and present. In these f1cilit.ioa. and 69-keV phot.ona over-responds b1 801 Relative int.on1it1 of 61-koV phot.on fr01 Aa-241 ingrowth t.o 401 for 69-koV radiation and plutoniua x-r11a is not. froa 11 b7 weight. photon•. Neutron 011il1 oatiaatod. Incroaao in range Pu-241. c1libr1t.ion was baaed of t.h• bi11 factor oat.i11to ia baaed
on neutron fields in on t.hie ••well as on tho coaplo1it.1 t.hia f1cilit7. of nout.ron doai11t.r1.
l111t.o and Oenor1ll11i1ed bet.a Deep doao wi 11 be 0.8 1.2 Recorded whole body dose waa pro-I 1bor1t.or1 and phot.on r1di1t.ion. 111sured 1ccurat.1l7. doain1nt.l1 froa phot.on r1di1t.ion
) 100 keV. Relative int.onsit.1 of low-onor11 phot.on and bet.1 r1di1t.ion ia expect.ad t.o be aignific1nt.l1 loss.
(a) Tho bias fact.or is defined 1s the ratio of deep dose t.o recorded whole body dose.
very large. The boron-lined pencil dosimeters used prior to 1950 to measure neutron dose in these facilities were generally poor. The NTA film imple- (""'., mented in 1950 was capable of reliably measuring dose from neutron radiation with energies of 800 keV or greater. Measurements in plutonium finishing facilities during the 1970s and 1980s have shown the average energy in the work environment to be between 200 keV and 500 keV because of scattering of the neutrons in the shielding. The problems of measuring neutron dose were well-known to early researchers at Hanford, but there was no available instrumentation to provide a better dose estimate.
It is possible to provide a crude estimate of dose from photons and neutrons for personnel in plutonium finishing facilities by extrapolating from the recorded beta and/or gannna dose. The film behind the open window of the dosimeter is very sensitive to low-energy photons (as shown in Section 7.3). Assuming that the film response was due to plutonium x-rays (i.e., 16 keV to 17 keV}, a recorded beta dose of 1000 mrad would correspond to a deep dose of 115 mrem. To obtain an estimate of the maximum likely whole body dose for x-rays the recorded beta dose could be multiplied by a factor of 0.1 (i.e., estimated from 115 mrem/1000 mrad}. The neutron dose received could be estimated by multiplying the estimated deep dose from x-rays by a factor of 2. This assumes a ratio 1:1 for the neutron dose to deep dose from plutonium x-rays. Hence, to estimate the total whole body dose from both x-rays and neutron radiation, the recorded beta dose would be multiplied by 20% (i.e., 2 * 0.1). The whole body dose calculated in this manner would likely be within a factor of 2 of the deep dose because of uncertainty in the neutron to deep dose ratio. For example, if the ratio between the neutron dose and deep dose from plutonium x-rays was 3 to l, the total dose would be calculated as 30% of the recorded beta dose.
8.4.2 Multi-Element Film Dosimeter Used from 1957 to 1972
Implementation of the multi-element dosimeter provided Hanford with the capability to distinguish between beta and low-energy photon radiation and hence to accurately estimate the deep dose from photons. Hanford adopted the practice of adding 35% of the x-ray exposure to the whole body dose (exposure} measured behind the thick silver shield. This practice provided an estimate
1
,
of the deep dose (e.g., current DOELAP dose conversion factor for 16-keV photon radiation is 38%). The multi-element film dosimeters provided an 1f"'l
8.14
accurate dose estimate for all Hanford facilities with the exception of neutron radiation present primarily at plutonium finishing facilities. The estimated range of the bias factor is shown -in Table 8.2. For fuel fabrication, reactor, fuel reprocessing, waste, and laboratory facilities, the range is estimated to be from 0.7 to 1.3 (i.e., •30%). The majority of the dose in these facilities resulted from photons of energy greater than about 100 keV.
The problems with neutron radiation were still present. The use of the PuF4 calibration source beginning in 1958 provided a realistic calibration for the neutron energies in the work environment. However, significant problems with underestimation of neutron dose continued. The maximum for the range of the bias factor is increased for the reactor facilities to 1.4 because of the presence of neutron radiation. The neutron dose continued to be a small percentage, less than 5%, of the overall dose. For plutonium finishing facilities, the most likely range of the bias factor was estimated to be from 1.0 to 2.0. The minimum of 1.0 is based on the assumption that all dose was measured. The maximum of 2.0 for the range was determined based on the assumption that none of the neutron dose was measured. These estimates assume that the neutron dose could be equal in magnitude to the deep dose from plutonium x-rays that were accurately measured.
8.4.3 Multi-Element Thermoluminescent Dosimeter Used from 1972 to 1989
This dosimeter provided the first capability to accurately measure the dose from all significant beta, photon, and neutron radiation present in Hanford facilities. The dosimeter over-responded by as much as 35% to 40-keV photons. However, with the exception of plutonium finishing facilities, the average photon energy was greater than 100 keV in Hanford facilities. The dosimeter responded accurately to plutonium x-rays, and it was calibrated to the neutron energies present in the plutonium finishing facilities.
Estimates of the range for the whole body dose bias factor for the TLD used from 1972 to 1984 are shown in Table 8.3. The range for all facilities (except the plutonium finishing facilities) is estimated to be 0.8 to 1.2 (i.e., a20%). For the plutonium finishing facilities, the uncertainty in dosimeter response to plutonium x-rays and/or 59-keV 241Am gamma radiation resulted in a best estimate of the range as 0.6 to 1.4 because of the complexity of neutron dosimetry, which is estimated to be about *50%. The
8.15
range for the different facilities for the whole body dose bias factor is shown in the Table 8.2. It should be noted that the deep dose for this dosimeter recorded a deep dose for beta radiation when, in fact, zero dose should have been determined. This over-response resulted in a deep dose contribution of about 15% and 30%, respectively, for uranium and 90sr radiation sources: but the relative significance of personnel deep dose from beta radiation is very low compared with the deep dose from photon radiation. However, because of the complexity of dose assessment for mixed fields of beta and photon radiation, the range for the fuel reprocessi·ng facilities in Table 8.3 is increas~d from 0.7 to 1.3.
Over the years many changes in the TLD calibration and dose algorithm procedures have been made. Initially, the dosimeter was calibrated in-air: then, beginning in 1985, it was calibrated on-phantom. This practice results in a difference of about 10% for the calculated dose. The over-response of the dosimeter to low-energy photons was improved in 1987 with the implementation of an improved algorithm, and the TLD provided an accurate estimate of the neutron dose in the plutonium finishing facilities. However, the uncertainty in neutron dosimetry was the basis for increasing the range of the bias factor for the plutonium finishing facilities.
8. 5 CONCLUSION
One of the goals of this report was to compare the recorded whole body dose with the actual tissue dose at 1000 mg/cm2 and evaluate Hanford dosimeter performance over time. The evaluation was based on a review of the historical documentation, an intercomparison study of Hanford film dosimeters conducted during 1989, results of DOELAP performance testing of the TLD during 1989, as well as the professional experience of the authors extending throughout nearly 5 decades of Hanford personnel dosimetry.
As a result of the evaluation the recorded whole body dose, on average, for the vast majority of Hanford personnel is estimated to be nearly equivalent to the actual deep dose with the exception of plutonium facilities personnel, particularly prior to 1957. For higher-energy photon fields (greater than 100 keV), which comprise the majority of personnel exposure in Hanford facilities, it is estimated that the comparison between the recorded whole body dose and the actual deep dose for occupationally exposed personnel is : ~
8.16
about •50%, •30% and •20%, respectively, for the 1) two-element film dosimeter (1944-1956), 2) multi-element film dosimeters (1957-1971), and 3) TLD (1972-1989). Greater difference between the recorded whole body dose and the actual deep dose occurs in facilities where complex mixtures of beta and photon radiation or neutron radiation are present. Comparison of the recorded neutron dose with the actual dose equivalent with the TLD is estimated to be •50%. Greater uncertainty was evident with the NTA film used from 1950 through 1972. These estimates are appropriate for personnel whose occupational radiation exposure is significantly greater than the natural environmental background radiation. Dosimetry for the plutonium facilities personnel was particularly impacted because of the difficulties in measuring the deep dose from plutonium x-rays (16 keV to 17 keV) prior to the use of the multielement film dosimeter in 1957 and because of the difficulty of measuring neutron dose prior to the use of the TLD in 1972.
Methods presented in the preceding sections could be used to improve the recorded whole body dose for plutonium facilities personnel. It should be noted that these personnel comprise a small percentage of the total personnel employed at Hanford since 1944 and would not be expected to significantly impact the evaluation of radiation risk for Hanford personnel using dose records. However, detennination of the source of exposure for higher exposed personnel should be considered to ensure that no significant error in the analyses occurs.
8.6 FUTURE WORK
Efforts have been under way for many years to better document Hanford dosimetry practices in support of the Hanford Health and Mortality Study. An early sunmary was provided by Heid and Allen in 1974.(a) Wilson provided an overview of radiation monitoring, portable instrument, radiological calibration, and internal and external dosimetry practices at Hanford (Wilson 1987). An overview of portable radiological instrumentation at Hanford was provided in 1989 (Howell et al. 1989).
(a) Heid, K. R., and H. w. Allen. 11 Input Data to the AEC Health and Mortality Study, Radiation Exposure Experience of Employees 1944 Through 1974. 11
Internal report, dated December 31, 1974, Pacific Northwest Laboratory, ("""\, Richland, Washington.
8.17

Recently, the National Academy of Sciences Committee on Film Badge Dosimetry in Atmospheric Nuclear Tests developed methodology for assessing the ~ overall bias and uncertainty in film dosimeter results, and applied this methodology to estimated doses for military and civilian personnel associated with atmospheric nuclear tests (NAS 1989). The approach required quantifying both the bias and uncertainty from each of several specified sources, and then combining the bias and uncertainty from the various sources to obtain an overall assessment. The NAS methodology uses a consistent analytical approach for evaluating each indentified source of bias and uncertainty as well as evaluating the combined effect of all sources.
There is interest in applying the NAS methodolgy to Hanford dosimetry in the future. However, there are several difficulties that will need to be addressed. One difficulty is that bias and uncertainty from many of the sources considered depend strongly on the energy and direction of the radiation. These have varied greatly in Hanford facilities over the years and are not specifically documented. Also, the NAS analysis did not address neutron radiation, which is significant for certain Hanford personnel. A possible approach is to restrict the NAS assessment to workers exposed primarily to high-energy photons, and to proceed by assessing each source for a range of energies and for two or three geometries. The overall assessment will require judgment regarding the actual distribution of energies and geometries that exist in various Hanford facilties.
8.18
·~
REFERENCES
~-
.•
.. ~ .. ··::-:
REFERENCES
American National Standards Institute (ANSI). 1983. American National Standard, Criteria for Testing Personnel Dosimetry Perfonnance, ANSI Nl3.11, New York, New York.
Baumgartner, W. V. 1958. Investigation of Eastman Personal Monitoring Type II Film For Potential Use at H.A.P.O. HW-55843, General Electric Company, Richland, Washington.
Baumgartner, W. V. 1959a. An X-Ray Spectrometry Method for Evaluating Doses to 2000 r on Film. HW-61893, General Electric COmpany, Richland, Washington.
Baumgartner, W. V. 1959b. A Study of the Radiation Response Characteristics of DuPont 552 Film. HW-58298 Rev, General Electric Company, Richland, Washington.
Baumgartner, W. V. 1960. Some Studies of Film Dosimeter Variables. HW-SA-2032, General Electric Company, Richland, Washington.
Brackenbush, L. W., et al. 1980. Personnel Neutron Dosimetry at Department of Energy Facilities. PNL-3213, Pacific Northwest Laboratory, Richland, Washington.
Bramson, P. E. 1962. Hanford Criticality Dosimeter. HW-71710, General Electrk Company, Rich.land, Washington. ·
DePhanger, J. 1957. Double Moderator Neutron Detector. HW-54584, General Electric Company, Richland, Washington.
DePhanger, J. 1958. NEUTRON MEASUREMENTS III: Calibration of Long Counter No. 2 with Radioactive Neutron Sources. HW-56199, General Electric Company, Richland, Washington.
Endres, G. W. R. 1964. Neutron Spectrum Measurements at Hanford Work Locations. HW-SA-3525, General Electric Company, Richland, Washington.
48 FR (146) 34316-34318. Thursday, July 28, 1983. "National Voluntary Laboratory Accreditation Program. 11 Federal Register.
52 FR (30) 4601-4604. Friday, February 13, 1987. "Improved Personnel Dosimetry Processing. 11 Federal Register.
28 FR 9411. Cited in 52 FR 4601. Friday, February 13, 1987. "Improved Personnel Dosimetry Processing." Federal Register.
Fix, J. J., et al. 1981. Hanford Personnel Dosimeter su9portinq Studies FY-1980. PNL-3536, Pacific Northwest Laboratory, Richlan , Washington.
Fix, J. J., et al. 1982. Hanford Personnel Dosimeter Su9portinq Studies FY-1981. PNL-3736, Pacific Northwest Laboratory, Richlan , Washington.
Ref .1
Fix, J. J., K. L. Holbrook, and K. L. Soldat. 1983. Hanford Beta-Gamma Personnel Dosimeter Protot¥pes and Evaluation. PNL-4481, Pacific Northwest Laboratory, Richland, Wash1ngton.
Gamertsfelder, C. C., et al. 1962. Some Notes on Practical Neutron Dosimetry. HW-SA-2785, General Electric Company, Richland, Washington.
General Electric Company (GE). 1952. Manual of Radiation Protection Standards. HW-25457, Richland, Washington.
Gilbert, E. S. 1990. Stud¥ of Detailed Dosimetry Records for a Sample of Workers Included in the Han ord Mortality Study. PNL-7439, Pacific Northwest Laboratory, Richland, Washington.
Gilbert, E. S., G. R. Petersen, and J. A. Buchanan. 1989. "Mortality of Workers at the Hanford Site: 1944-1981." Health Physics 56:11-25.
Hart, J. c. 1946. Manual of Standard Procedures for Personnel Meters. 7-4282, E. I. DuPont de Nemours Company, Richland, Washington.
Hart, J. c. 1967. Derivation of Dose Data from Hanford-DuPont Personnel Meter Exposure Records Applicable to the Mancuso Study. 67-3-10, Oak Ridge National Laboratory, Oak Ridge, Tennessee.
Haverfield, A. J., L. L. Nichols, and G. w. R. Endres. 1972. A Thennoluminescent Dosimetry System for Gamma, Beta, and Neutron Personnel Exposure. BNWL-SA-4355, Pacific Northwest Laboratory, Richland, Washington.
Healy, J. W. 1944. Film Rings. DuH-4476, E. I. DuPont de Nemours Company, Richland, Washington.
Howell, W. P., C. D. Corbit, J. D. Kenoyer, L. V. Zuerner, M. L. Kress. D. M. Fleming, K. L. Swinth, and H. W. DeHaven. 1989. Historical Review of Portable Health Physics Instruments and Their Use in Rad1at1on Protect1on Program at Hanford, 1944 Through 1988. PNL-6980, Pacific Northwest Laboratory, Richland, Washington.
Hurst, G. S. 1956. "Techniques of Measuring Neutron Spectra with Threshold Detectors - Tissue Dose Determination." Review of Scientific Instruments 27:153.
International Agency for Research on Cancer (IARC). 1989. "Combined Analyses of Cancer Mortality Among Nuclear Industry Workers." IARC Internal Report 80/005, Lyon, France.
International Commission on Radiation Units and Measurements (ICRP). 1988. Determination of Dose Equivalents from External Radiation Sources-Part 2. ICRU Report 43, Bethesda, Maryland.
International Standards Organization (ISO). 1979. 11 X and Gama Reference Radiations for Calibrating Dosimeters and Dose Rate Meters and For Determining Their Response as a Function of Photon Energy. 11 No. 4037, Technical Committee ISO/TC85, Geneva, Switzerland.
Ref .2
Kathren, R. L. 1970. Evaluation of Hanford Basic Thennoluminescent ~ Dosimeter. BNWL-CC-2633, Pacific Northwest Laboratory, Richland, Washington.
Kathren, R. L., L. F. Kocher, and G. W. R. Endres. 1970. 11Thennoluminescence Personnel Dosimetry at Hanford. 11 In Proceedings of Second International Congress of the International Radiation Protection Association, Brighton, England.
Kathren, R. L., L. F. Kocher, and G. W. R. Endres. 1971. Thennoluminescence Personnel Dosimetry at Hanford. BNWL-SA-2793, Pacific Northwest Laboratory, Richland, Washington.
Kathren, R. L., F. L. Rising, and H. V. Larson. 1971. 11 K-Fluorescence X-Rays: A Multi-Use Tool for Health Physics. 11 Health Physics 21:~85-293.
Kocher, L. F. 1957a. The Plastic LK Film Badge. HW-48740, General Electric Company, Richland, Washington.
Kocher, L. F. 1957b. Energy Discrimination in Gannna Dose Evaluation. HW-52325, General Electric Company, Richland, Washington.
Kocher L. F. 1959. A Rotating Source For Calibration Purposes. HW-62386, Hanford Works, Richland, Washington.
Kocher, L. F. 1962. A Personnel Dosimeter Filter System for Measuring Beta and Gamma Doses in Mixed Radiation Fields. HW-71764, General Electric Company, Richland, Washington.
Kocher, L. F., P. E. Bramson, and C. M. Unruh. 1963. The New Hanford Film Badge Dosimeter. HW-76944, General Electric Company, Richland, Washington.
Kocher, L. F., G. W. R. Endres, L. L. Nichols, D. B. Shipler, and A. J. Haverfield. 1971. The Hanford Thennoluminescent Multipureose Dosimeter. BNWL-SA-3955, Pacific Northwest Laboratory, Richland, Wash1ngton.
Larson, H. V., and W. C. Roesch. 1954. Gannna Dose Measurement With Hanford Film Badges. HW-32516, General Electric Company, Richland, Washington.
Larson, H. V. 1954. Heavily Filtered X-Rays. HW-31883, General Electric Company, Richland, Washington.
Larson, H. V., R. C. Myers, and W. C. Roesch. 1955. A Wide Beam Fluorescent X-Ray Source. HW-31781, Hanford Works, Richland, Wash1ngton.
Larson, H. v., C. M. Unruh, T. M. Beetle, and A. R. Keene. 1967. Factors Involved in Establishing Film Dosimeter Perfonnance Criteria. BNWL-SA-1277, Pacific Northwest Laboratory, Richland, Washington.
Little, G. A. 1960. Ganuna AnVular Dependence of HAPO Film Badge. HW-61980, General Electric Company, Rich and, Washington.
Ref .3
Mancuso, T. F., et al. 1966. Feasibility Study of the Correlation of Lifetime Health and Mortality Experience of AEC and AEC Contractor Employees ~ with Occupational Ex~osure. NY0-3394-5, Graduate School of Occupational Health, University o Pittsburgh, Pittsburgh, Pennsylvania.
National Academy of Science (NAS). 1989. Film Badge Dosimetry in Atmospheric Nuclear Tests. National Research Council, Washington, D.C.
National Bureau of Standards (NBS). 1954a. Protection Against Radiations from Radium, Cobalt-60 and Cesium-137. NBS Handbook 54, U.S. Department of Commerce, Washington, D.C.
National Bureau of Standards (NBS). 1954b. Permissible Dose from External Sources of Ionizing Radiation. NBS Handbook 59, U.S. Department of Commerce, Washington, D.C.
National Bureau of Standards (NBS). 1957. Protection Against Neutron Radiation Up to 30 Million Electron Volts. NBS Handbook 63, U.S. Department of Commerce, Washington, D.C.
Nees, W. L. 1969. Photon Angular Dependence of the Hanford Film Badge. BNWL-CC-2018, Pacific Northwest Laboratory, Richland, Washington.
Nichols, L. L., G. W. R. Endres, D. B. Shipler, E. E. Oscarson, and L. L. Crass. 1972. Hanford Multipurpose TL Dosimeter Field Tests and Evaluation. BNWL-B-127, Pacific Northwest Laboratory, Richland, Washington.
Nichols, L. L. 1977. A Test of the Performance of Personnel Dosimeters. BNWL-2159, Pacific Northeast Laboratory, Richland, Washington.
Pardue, L. A., N. Goldstein, and E. O. Wollan. 1944. Photographic Film as a Pocket Radiation Dosimeter. CH-1553-A-2223, Metallurgical Laboratory, Chicago, Illinois.
Parker, H. M. 1945. Comparison of Badge Film Readings at the Metallurgical Laboratory, Clinton Laboratory, and Hanford Engineering Works. HW-7-3090, E. I. DuPont de Nemours Company, Richland, Washington.
Parker, H. M. 1946. Review of Personnel Monitoring at Hanford Engineering Works. HW-7-4211, E. I. DuPont de Nemours Company, Richland, Washington.
Parker, H. M. 1954. Radiation Protection in the Atomic EnerTy Industr¥ - A Ten-Year Review. HW-34365 RD, General Electric Company, Rich and, Wash1ngton.
Schwartz, R. B., and C. M. Eisenhauer. 1982. Procedures for Calibrating Neutron Personnel Dosimeters. National Bureau of Standards, Washington, D.C.
Swanberg, F. 1959. A Personnel Film Badge Neutron Dosimeter. HW-56827, General Electric Company, Richland, Washington.
Unruh, C. M., et al. 1964. The Status of New Personnel Neutron Dosimeter Development. HW-SA-3526, General Electric Company, Richland, Washington.
Ref .4
Unruh, C. M., et al. 1966. Personnel Neutron Dosimeter Developments. ~ BNWL-SA-537, Pacific Northwest Laboratory, Richland, Washington.
Unruh, C. M., et al. 1967. The Establishment and Utilization of Film Dosimeter Performance Criteria. BNWL-542, Pacific Northwest Laboratory, Richland, Washington.
Unruh, C. M., H. V. Larson, and T. M. Beetle. 1968. Film Dosimeter Performance Criteria and an Assessment of Current Performance Levels. BNWL-SA-1836, General Electric Company, Richland, Washington.
U.S. Department of Energy (DOE). 1986. Department of Energy Standard for the Performance Testing of Personnel Dosimetry Systems. ·DOE/EH-0027, Washington, D.C. U.S. Department of Energy (DOE). 1987. Department of Energy Laboratory Accreditation Program for Personnel Dosimetry. DOE 5480.15, Washington, D.C.
Watson, E. C. 1951. Fast Neutron Monitoring of Personnel. HW-21552, General Electric Company, Richland, Washington.
Watson, E. C. 1957. Fadin9 Effect in Eastman NTA Emulsion. HW-49444, General Electric Company, Richland, Washington.
Watson, E. C. 1959. A Review of the NTA Fast neutron Film Pro ram. HW-61008, General Electric Company, Ric an , Was ington.
~ Wilson, R. H. 1957. Reeroducibility of Personnel Monitoring Film Densities. HW-51934, General Electric Company, Richland, Washington.
Wilson, R. H. 1960. Detection Level of the Film Badge System. HW-67697, General Electric Company, Richland, Washington.
Wilson, R. H., et al. 1960. Gamma Calibration and Evaluation Techniques for Hanford Beta-Gamma Film Badge Dosimeters. HW-71702, General Electric Company, Richland, Washington.
Wilson, R. H., and H, v. Larson. 1961. Film Capabilities for High Level Dose Evaluation. HW-71133, General Electric Company, Richland, Washington.
Wilson, R. H. 1962. A Method for Inanediate Detection of High Level Neutron Exposure by Measurement of Sodium-24 in Humans. HW-73891 Rev., General Electric Company, Richland, Washington.
Wilson, R. H. 1987. Historical Review of Personnel Dosimetry Development and its Use in Radiation Protection Programs at Hanford: 1944 to the 1980s. PNL-6125, Pacific Northwest Laboratory, Richland, Washington.
Ref .5
~ ·-

BIBLIOGRAPHY
BIBLIOGRAPHY
Beetle, T. M. -1970. Reconvnended Precision Specification and Audit Test for the Hanford Basic Thennoluminescence Dosimetry Process. BNWL-B-11, Pacific Northwest Laboratory, Richland, Washington.
Beetle, T. M. 1972. A Probability Model for Thennoluminescent Dosimetry. BNWL-1641, Pacific Northwest Laboratory, Richland, Washington.
Bovingdon, J. R. 1958. Optimum Aperture for the Densitometers. HW-54654, General Electric Company, Richland, Washington.
Endres, G. W. R., and L. F. Kocher. 1968a. The Response of Selected Thennoluminescent Materials to Fast Neutron Exposures. BNWL-SA-1830, Pacific Northwest Laboratory, Richland, Washington.
Endres, G. W. R., and L. F. Kocher. 1968b. Response of Selected Thennoluminescent Materials to Fast Neutron Exposures. BNWL-SA-1831, Pacific Northwest Laboratory, Richland, Washington.
Endres, G. W. R., et al. 1969. Energy Dependence and Application of TLD Materials in Operational Health Physics. BNWL-SA-1940, Pacific Northwest Laboratory, Richland, Washington.
Endres, G. W. R., et al. 1973. Annealing TLDs Exposed to High Levels of Neutron and Gamma Radiation. BNWL-SA-4526, Pacific Northwest Laboratory, Richland, Washington.
Kocher, L. F. 1959. A Rotating Source for Calibration Purposes. HW-62386, General Electric Company, Richland, Washington.
Nelson, I. C. 1955. Dose-Density Characteristics of DuPont SX 233 Film. HW-39179, General Electric Company, Richland, Washington.
Nelson, I. C., et al. 1966. Interpretation of Dose from N16 Radiation with the Hanford Film Badge Dosimeter. BNWL-CC-485, Pacific Northwest Laboratory, Richland, Washington.
Nichols, L. L., and C. E. Newton. 1975. Perfonnance Tests of Convnercial Personnel Monitoring Services. BNWL-SA-419, Pacific Northwest Laboratory, Richland, Washington.
Shipler, D. B. 1972. 11 Thennoluminescence from Adhesive Coated Teflon Tape. 11
Health Physics Journal 22:195-196.
Unruh, C. M. 1968. Methods of Measurement and Interpretation of Results in Radiation Monitorin3 and Dosimetry. BNWL-SA-2128, Pacific Northwest Laboratory, Richlan , Washington.
Unruh, C. M. 1969. 11 Notes from the AEC Workshop on Personnel Neutron Dosimetry." BNWL-SA-2978, Pacific Northwest Laboratory, Richland, Washington.
Wilson, R. H., et al. 1960. "The Hanford Film Dosimeter and the Calibration of Film for Gamma Dose Evaluation". Film Dosimetry Infonnation Exchange, ~ General Electric Company, Richland, Washington.
Biblio.2
I l"""1\
APPENDIX A
DOSE ALGORITHM FOR THE BETA/PHOTON FILM
DOSIMETER USED FROM 1957 TO 1962
·,
.~
i j '
!
1 i J
i ' ;
i j
\ 1 l I
1 , l
l ·~
j l
I . .1
APPENDIX A
DOSE ALGORITHM FOR THE BETA/PHOTON FILM DOSIMETER USED FROM 1957 TO 1962
Wilson (1960) reported on a system for evaluating beta and gamma doses in mixed radiation fields. The dose algorithm for the beta/photon film dosimeter used from 1958 to 1962, as reported by Wilson, is described in this appendix.
GAMMA DOSE INTERPRETATION
Interpretation of gamma dose was accomplished by measuring the film density behind the thick silver shield and comparing it with a calibration curve. The calibration curve was established from a set of film exposed to 0-, 30-, 60-, 90-, 120-, 180-, 240-, 300-, 500-, 750-, and 1000-mrem doses and processed in the same batch as the unknown film for which dose interpretation was required. Additional calibration doses of 2000, 5000, and 10,000 mrem are included and processed with each set, but were not used in the routine program.
Immediate use of the calibrated film values was accomplished by plotting the dose-density relationships directly on graph paper and drawing the best· fit by eye through the calibration levels from the zero intercept to 1000 mrem. Fast estimates of dose were made from this curve to determine the dose for any unusual film found in that particular batch. Hanford experience with the DuPont 502 emulsion showed very close agreement between estimates calculated manually and electronically.
All routine dose estimates were automatically calculated from parameters established for each calibration set by electronic data processing equipment. The dose for any density within the limits of the calibrations were calculated from the batch parameters.
The initial Hanford electronic computer program resulted in each calibration set being fitted to a linear curve by the least-squares method. This method was entirely adequate because the DuPont 502 emulsion response is essentially linear for the density values used in routine dose calculations.
A.1
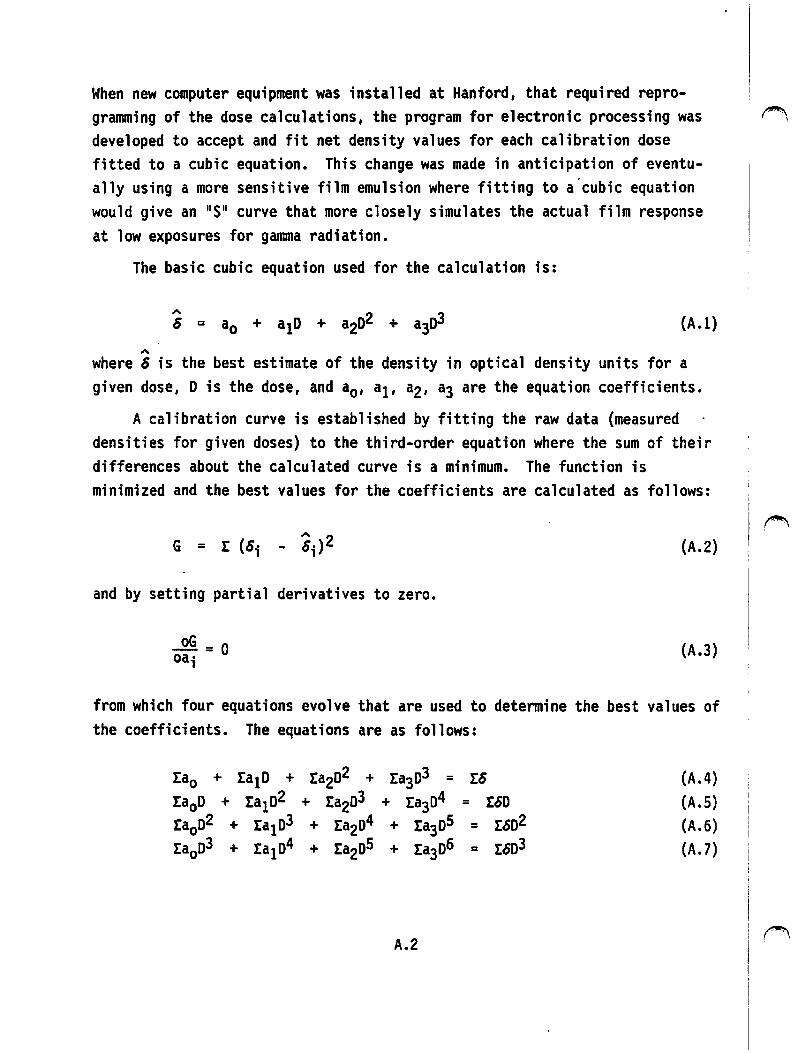
When new computer equipment was installed at Hanford, that required repro-gramming of the dose calculations, the program for electronic processing was ~ developed to accept and fit net density values for each calibration dose fitted to a cubic equation. This change was made in anticipation of eventu-ally using a more sensitive film emulsion where fitting to a'cubic equation would give an 11 $ 11 curve that more closely simulates the actual film response at low exposures for gamma radiation.
The basic cubic equation used for the calculation is:
"' where 6 is the best estimate of the density in optical density units for a given dose, D is the dose, and a0 , a1, a2, a3 are the equation coefficients.
A calibration curve is established by fitting the raw data (measured densities for given doses) to the third-order equation where the sum of their differences about the calculated curve is a minimum. The function is minimized and the best values for the coefficients are calculated as follows:
(A.2)
and by setting partial derivatives to zero.
(A.3)
from which four equations evolve that are used to detennine the best values of the coefficients. The equations are as follows:
ra0 + ra1o + ra2o2 + ra3o3 = rB ra0D + ra1o2 + ra2o3 + ra3o4 = rso ra002 + ra1o3 + ra2o4 + ra3oS = rso2 ra003 + ra1o4 + ra2oS + ra3o6 = r603
A.2
(A.4)
(A.5)
(A.6) (A.7)
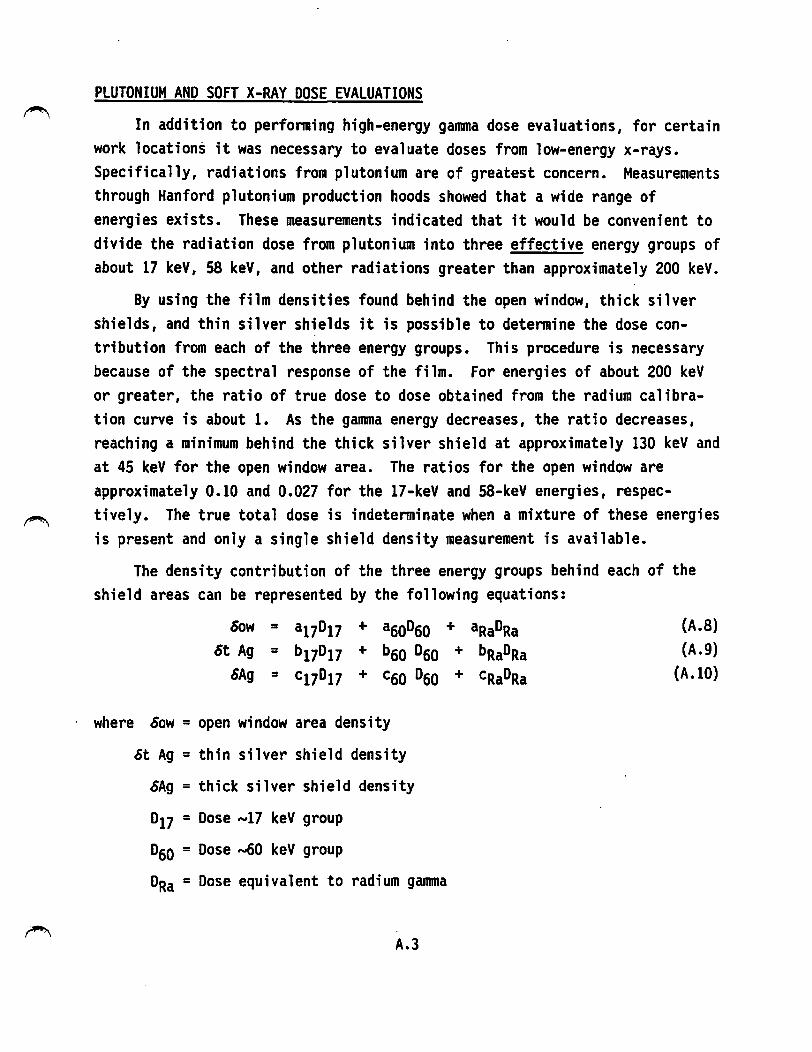
PLUTONIUM AND SOFT X-RAY DOSE EVALUATIONS
In addition to performing high-energy gamma dose evaluations, for certain work locations it was necessary to evaluate doses from low-energy x-rays. Specifically, radiations from plutonium are of greatest concern. Measurements through Hanford plutonium production hoods showed that a wide range of energies exists. These measurements indicated that it would be convenient to divide the radiation dose from plutonium into three effective energy groups of about 17 keV, 58 keV, and other radiations greater than approximately 200 keV.
By using the film densities found behind the open window, thick silver shields, and thin silver shields it is possible to determine the dose contribution from each of the three energy groups. This procedure is necessary because of the spectral response of the film. For energies of about 200 keV or greater, the ratio of true dose to dose obtained from the radium calibration curve is about 1. As the gamma energy decreases, the ratio decreases, reaching a minimum behind the thick silver shield at approximately 130 keV and at 45 keV for the open window area. The ratios for the open window are approximately 0.10 and 0.027 for the 17-keV and 58-keV energies, respectively. The true total dose is indeterminate when a mixture of these energies is present and only a single shield density measurement is available.
The density contribution of the three energy groups behind each of the shield areas can be represented by the following equations:
Sow = a17D17 + a50D50 + aRaDRa St Ag = b17D17 + b50 D50 + bRaDRa
SAg = c17D17 + c50 D50 + CRaDRa
where Sow = open window area density
St Ag = thin silver shield density
SAg = thick silver shield density
D17 = Dose -17 keV group
D50 = Dose ""60 keV group
DRa = Dose equivalent to radium gamma
A.3
(A.8) (A.9)
(A.10)
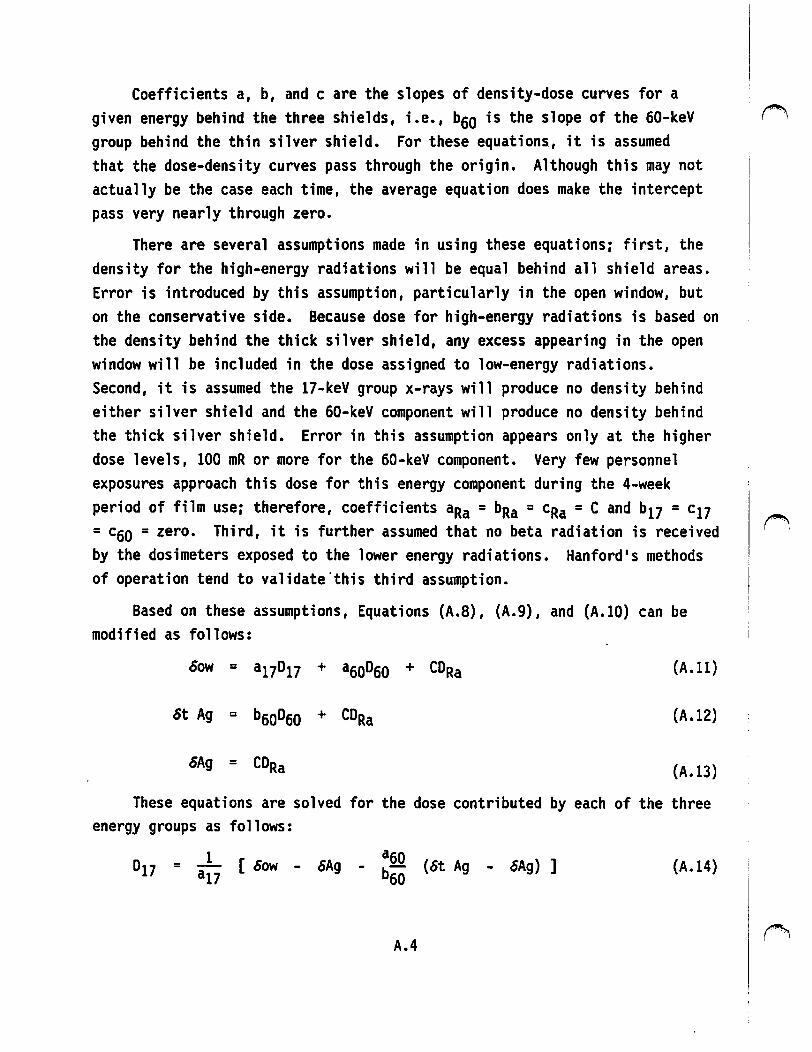
Coefficients a, b, and c are the slopes of density-dose curves for a given energy behind the three shields, i.e., b6o is the slope of the 60-keV group behind the thin silver shield. For these equations, it is assumed that the dose-density curves pass through the origin. Although this may not actually be the case each time, the average equation does make the intercept pass very nearly through zero.
There are several assumptions made in using these equations; first, the density for the high-energy radiations will be equal behind all shield areas. Error is introduced by this assumption, particularly in the open window, but on the conservative side. Because dose for high-energy radiations is based on the density behind the thick silver shield, any excess appearing in the open window will be included in the dose assigned to low-energy radiations. Second, it is assumed the 17-keV group x-rays will produce no density behind either silver shield and the 60-keV component will produce no density behind the thick silver shield. Error in this assumption appears only at the higher dose levels, 100 mR or more for the 60-keV component. Very few personnel exposures approach this dose for this energy component during the 4-week period of film use; therefore, coefficients aRa = bRa = cRa = C and b17 = c17 = c60 = zero. Third, it is further assumed that no beta radiation is received by the dosimeters exposed to the lower energy radiations. Hanford's methods of operation tend to validate.this third assumption.
Based on these assumptions, Equations (A.8), (A.9), and (A.10) can be modified as follows:
(A.11)
(A.12)
6Ag = CDRa (A.13)
These equations are solved for the dose contributed by each of the three energy groups as follows:
1 a6o D17 = a17
[ 6ow - 6Ag - b60
(6t Ag - 6Ag) ] (A.14)
A.4
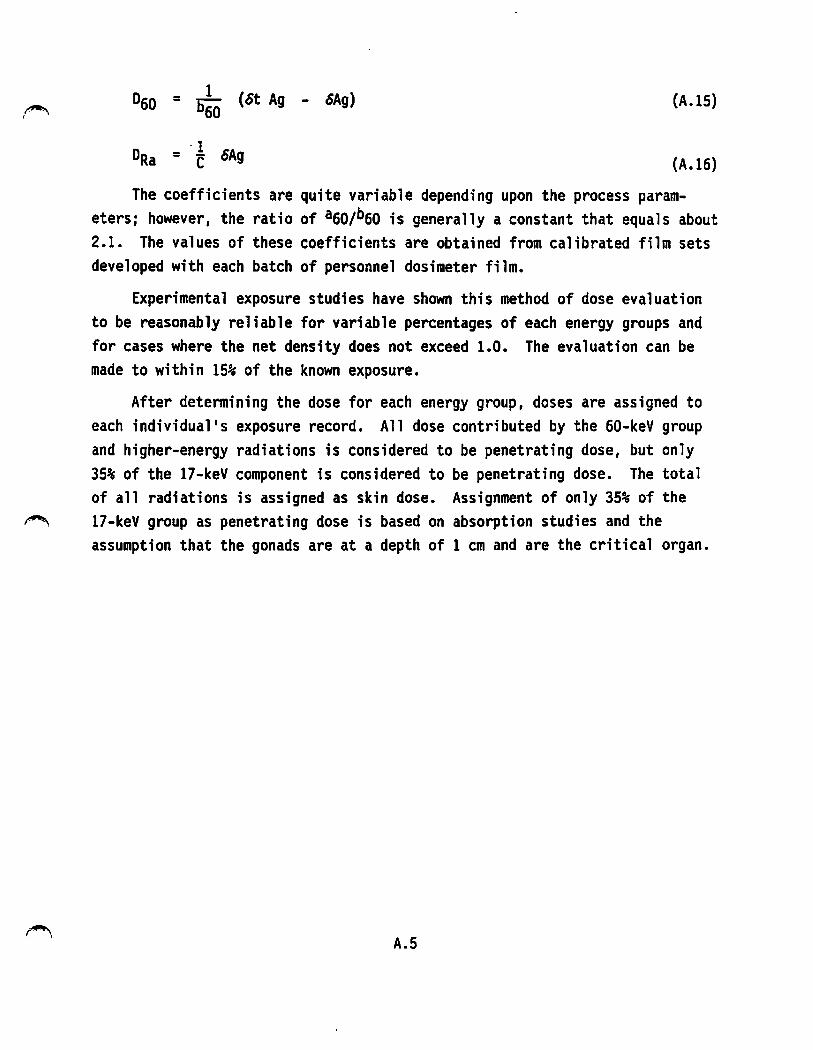
~ r
1 = 660
(cSt Ag - cSAg) (A.15)
·1 DRa = c oAg (A.16)
The coefficients are quite variable depending upon the process parameters: however, the ratio of a50/b60 is generally a constant that equals about 2.1. The values of these coefficients are obtained from calibrated film sets developed with each batch of personnel dosimeter film.
Experimental exposure studies have shown this method of dose evaluation to be reasonably reliable for variable percentages of each energy groups and for cases where the net density does not exceed 1.0. The evaluation can be made to within 15% of the known exposure.
After determining the dose for each energy group, doses are assigned to each individual's exposure record. All dose contributed by the 60-keV group and higher-energy radiations is considered to be penetrating dose, but only 35% of the 17-keV component is considered to be penetrating dose. The total of all radiations is assigned as skin dose. Assignment of only 35% of the
~ 17-keV group as penetrating dose is based on absorption studies and the assumption that the gonads are at a depth of 1 cm and are the critical organ.
A.5
APPENDIX B
DOSE ALGORITHM FOR THE BETA/PHOTON FILM DOSIMETER
USED FROM 1962 TO 1972
. . . . , ~ . .~ :. • ' > '
'
j ~ 1
\
I ! ;
h I l l l j
l i ; I \ i
i ' I 1
I A l' )
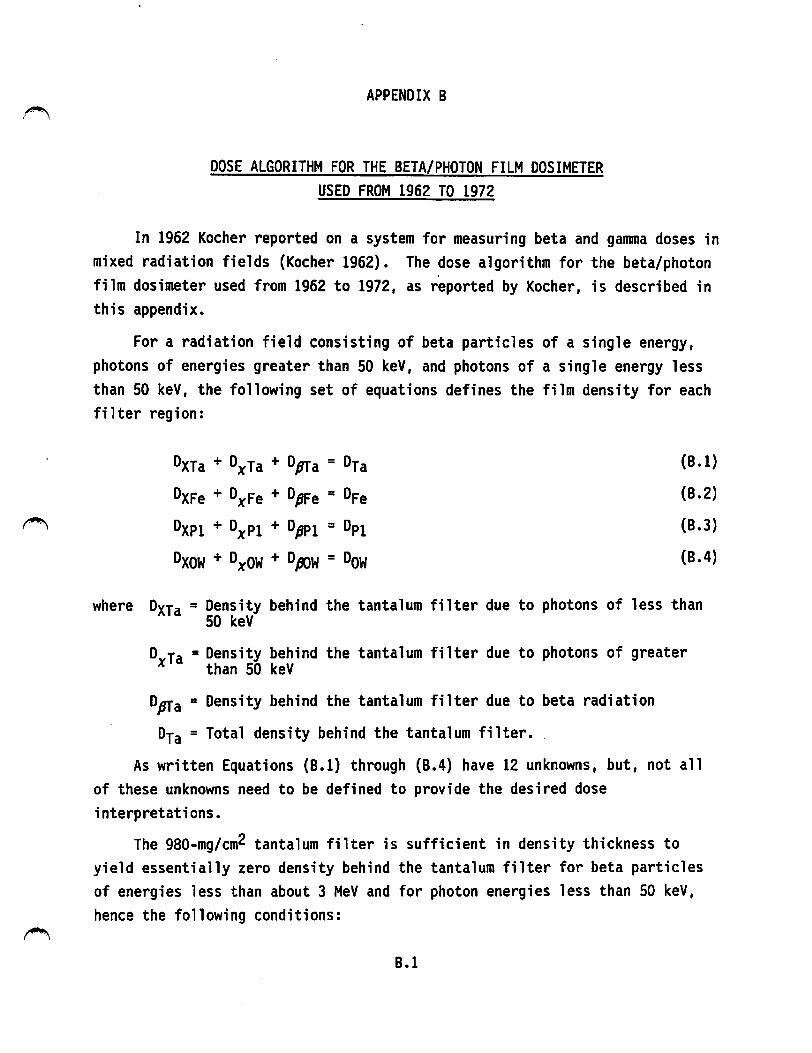
APPENDIX B
DOSE ALGORITHM FOR THE BETA/PHOTON FILM DOSIMETER USED FROM 1962 TO 1972
In 1962 Kocher reported on a system for measuring beta and gamma doses in mixed radiation fields (Kocher 1962). The dose algorithm for the beta/photon film dosimeter used from 1962 to 1972, as reported by Kocher, is described in this appendix.
For a radiation field consisting of beta particles of a single energy, photons of energies greater than 50 keV, and photons of a single energy less than 50 keV, the following set of equations defines the film density for each filter region:
DxTa + Dxra + Dpra = DTa
DxFe + DxFe + DpFe = DFe
Dxp1 + 0xP1 + Dpp1 = Dp1
Dxow + Dxow + o~w = Dow
(B.1)
(B.2)
(B.3)
(B.4)
where Dxra = Density behind the tantalum filter due to photons of less than 50 keV
DxTa = Density behind the tantalum filter due to photons of greater than 50 keV
Dpra = Density behind the tantalum filter due to beta radiation
Dra = Total density behind the tantalum filter.
As written Equations (B.1) through (B.4) have 12 unknowns, but, not all of these unknowns need to be defined to provide the desired dose interpretations.
The 980-mg/cm2 tantalum filter is sufficient in density thickness to yield essentially zero density behind the tantalum filter for beta particles of energies less than about 3 MeV and for photon energies less than 50 keV, hence the following conditions:
B.1
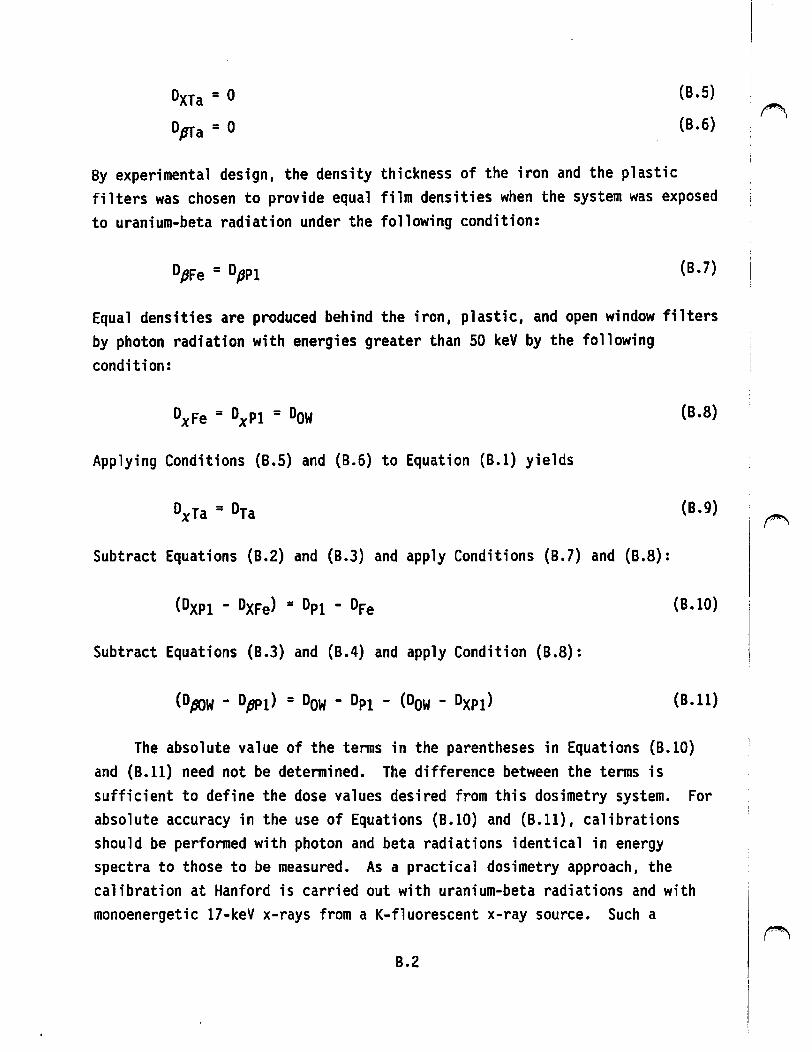
DxTa = O
Dpra = 0
(B.5)
(B.6)
By experimental design, the density thickness of the iron and the plastic filters was chosen to provide equal film densities when the system was exposed to uranium-beta radiation under the following condition:
DpFe = Dpp1 (B.7)
Equal densities are produced behind the iron, plastic, and open window filters by photon radiation with energies greater than 50 keV by the following condition:
0xFe = 0xPl = 0ow (B.8)
Applying Conditions (B.5) and (B.6) to Equation (B.l) yields
0xTa = 0Ta (B.9)
Subtract Equations (B.2) and (B.3) and apply Conditions (B.7) and (B.8):
(B.10)
Subtract Equations (B.3) and (B.4) and apply Condition (B.8):
(B.11)
The absolute value of the terms in the parentheses in Equations (B.10) and (B.11) need not be determined. The difference between the terms is sufficient to define the dose values desired from this dosimetry system. For absolute accuracy in the use of Equations (B.10) and (B.11), calibrations should be performed with photon and beta radiations identical in energy spectra to those to be measured. As a practical dosimetry approach, the calibration at Hanford is carried out with uranium-beta radiations and with monoenergetic 17-keV x-rays from a K-fluorescent x-ray source. Such a
B.2
~ 1· .. ,,
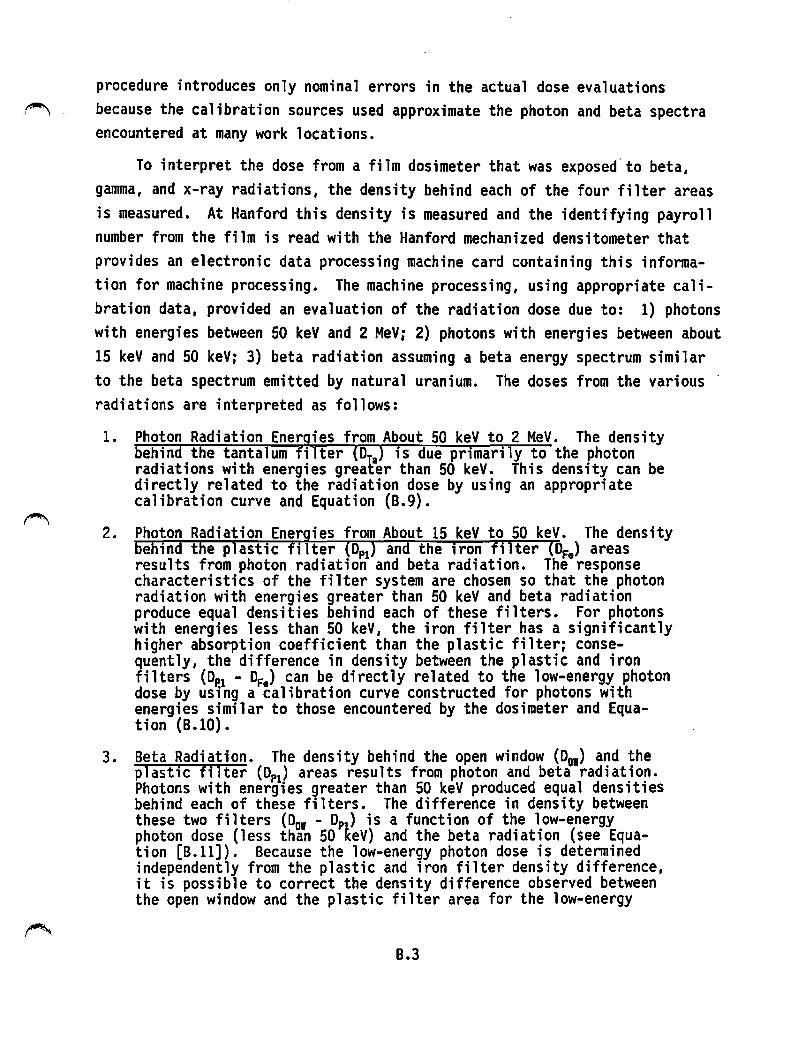
procedure introduces only nominal errors in the actual dose evaluations ~ because the calibration sources used approximate the photon and beta spectra
encountered at many work locations.
To interpret the dose from a film dosimeter that was exposed.to beta, gamma, and x-ray radiations, the density behind each of the four filter areas is measured. At Hanford this density is measured and the identifying payroll number from the film is read with the Hanford mechanized densitometer that provides an electronic data processing machine card containing this information for machine processing. The machine processing, using appropriate calibration data, provided an evaluation of the radiation dose due to: 1) photons with energies between 50 keV and 2 MeV; 2) photons with energies between about 15 keV and 50 keV; 3) beta radiation assuming a beta energy spectrum similar to the beta spectrum emitted by natural uranium. The doses from the various · radiations are interpreted as follows:
1. Photon Radiation Energies from About 50 keV to 2 MeV. The density behind the tantalum filter (D
1) is due primarily to the photon
radiations with energies grea~er than 50 keV. This density can be directly related to the radiation dose by using an appropriate calibration curve and Equation (B.9).
2. Photon Radiation Energies from About 15 keV to 50 keV. The density behind the plastic filter (Dp1) and the iron fllter (OF
0) areas
results from photon radiation and beta radiation. The response characteristics of the filter system are chosen so that the photon radiation with energies greater than 50 keV and beta radiation produce equal densities behind each of these filters. For photons with energies less than 50 keV, the iron filter has a significantly higher absorption coefficient than the plastic filter: consequently, the difference in density between the plastic and iron f i 1 ters ( DP.1 - aF.) can be direct 1 y re 1 ated to the 1 ow-energy photon dose by using a calibration curve constructed for photons with energies similar to those encountered by the dosimeter and Equation (B.10).
3. Beta Radiation. The density behind the open window (D01) and the plastic filter (Dp1) areas results from photon and beta radiation. Photons with energies greater than 50 keV produced equal densities behind each of these filters. The difference in density between these two filters (D01 - Dp) is a function of the low-energy photon dose (less than 50 ~eV) and the beta radiation (see Equation [B.11]). Because the low-energy photon dose is determined independently from the plastic and iron filter density difference, it is possible to correct the density difference observed between the open window and the plastic filter area for the low-energy
B.3
photon dose contributions by using an appropriate calibration correction curve. After this correction is made, the remaining density difference between the open window and the plastic filter may be calculated using a beta dose calibration curve and the beta dose may be determined using Equation (B.11).
Field tests of the dosimeter filter system were conducted by exposing dosimeters to radium-gamma radiation, plutonium photon radiation, and uraniumbeta radiation. Evaluation of the doses from the exposures yielded an accuracy of • 10% for each of the applied doses.
REFERENCE
Kocher, L. F. 1962. A Personnel Dosimeter Filter System for Measuring Beta and Ganuna Doses in Mixed Radiation Fields. HW-71764, General Electric Company, Richland, Washington.
8.4
~ )
APPENDIXC
THERMOLUMINESCENT DOSIMETER ALGORITHMS
. ·, ,.,_ ·, ~;
. l . '
; '.~ .;
i i l. ·. ·,
1 .
!
' ' i l I l j
1
~
i 1
i !
1 n I t 1
APPENDIX C
THERMOLUMINESCENT DOSIMETER ALGORITHMS
Thennoluminescent dosimeters were implemented at Hanford in 1971 with the basic dosimeter and in 1972 with the multipurpose dosimeter. The calibration sources, exposure geometry, and algorithm have been modified over the years. The procedures originally used with each dosimeter, the changes that involved both dosimeters, and the method of detennining the recorded skin, whole body, and extremity dose components are discussed in this appendix.
BASIC DOSIMETER
A single calibration factor was detennined for basic dosimeters using a radium source with exposures in-air. A set of 10 calibration and 10 blank (i.e., not exposed) dosimeters was used to detennine the calibration constant. The calibration constant was tenned Co and was calculated as follows:
_ 1000 mR Co - Mean Value of Basic Calibration Dosimeters (C. l)
where 1000 represents the 1000 mR exposure in-air given to the basic calibration dosimeters. To calculate dose the observed chip count minus the average of the 10 blank dosimeters was multiplied by the calibration constant as follows:
Penetrating Dose= Co(R(l) - B(l)) (C.2)
where c0 is the calibration factor in millirem per chip signal described earlier for basic dosimeters, R(l) is the response of the chip in position 1 B(l) is the average of the basic blank dosimeters.
MULTIPURPOSE DOSIMETER
The multipurpose dosimeter had 5 chip positions that provided an estimate of the nonpenetrating, penetrating, fast neutron, and slow neutron dose components. A set of calibration dosimeters was used to detennine the
C. l
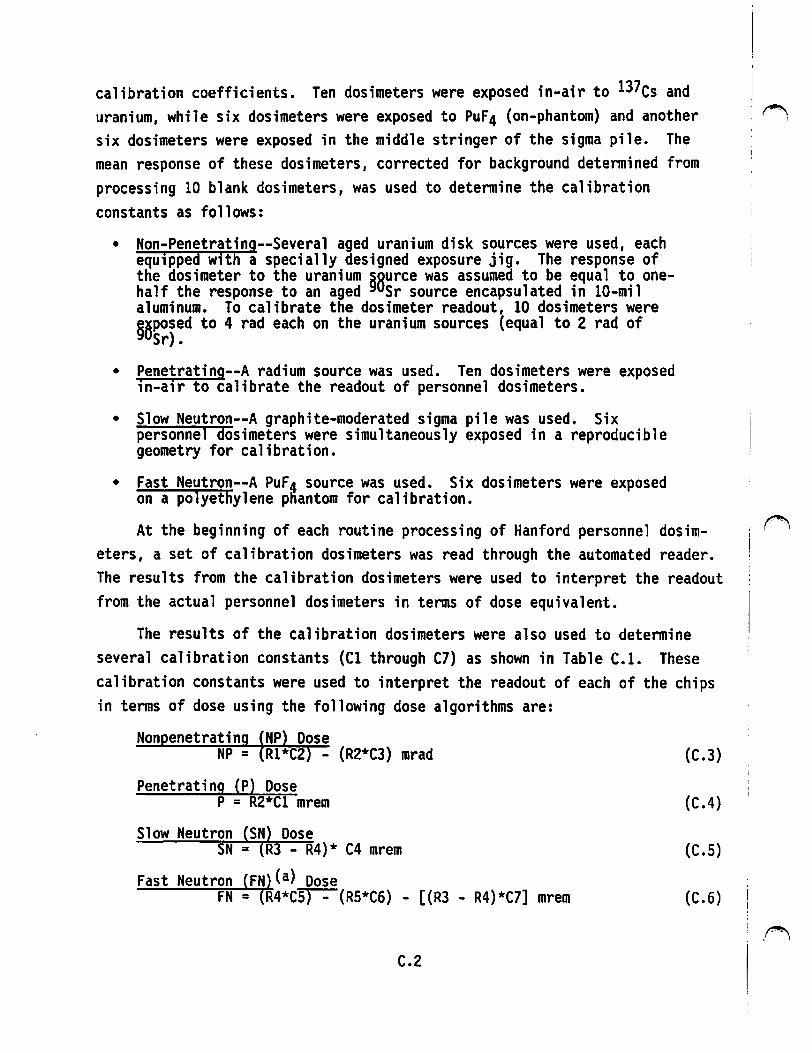
calibration coefficients. Ten dosimeters were exposed in-air to 137cs and uranium, while six dosimeters were exposed to PuF4 (on-phantom) and another six dosimeters were exposed in the middle stringer of the sigma pile. The mean response of these dosimeters, corrected for background determined from processing 10 blank dosimeters, was used to determine the calibration constants as follows:
• Non-Penetrating--Several aged uranium disk sources were used, each equipped with a specially designed exposure jig. The response of the dosimeter to the uranium 98urce was assumed to be equal to onehalf the response to an aged Sr source encapsulated in 10-mil aluminum. To calibrate the dosimeter readout, 10 dosimeters were §~posed to 4 rad each on the uranium sources (equal to 2 rad of
Sr).
• Penetrating--A radium source was used. Ten dosimeters were exposed in-air to calibrate the readout of personnel dosimeters.
• Slow Neutron--A graphite-moderated sigma pile was used. Six personnel dosimeters were simultaneously exposed in a reproducible geometry for calibration.
• Fast Neutron--A Puf 4 source was used. Six dosimeters were exposed on a polyethylene pnantom for calibration.
At the beginning of each routine processing of Hanford personnel dosimeters, a set of calibration dosimeters was read through the automated reader. The results from the calibration dosimeters were used to interpret the readout from the actual personnel dosimeters in terms of dose equivalent.
The results of the calibration dosimeters were also used to determine several calibration constants (Cl through C7) as shown in Table C.1. These calibration constants were used to interpret the readout of each of the chips in terms of dose using the following dose algorithms are:
Non enetratin NP Dose NP = Rl*C2 - (R2*C3) mrad (C.3)
Penetrating (P) Dose P = R2*Cl mrem {C.4)
Slow Neutron (SN) Dose SN = (R3 - R4}* C4 mrem {C.5}
Fast Neutron (FN){a) Dose FN = (R4*C5) - {RS*C6) - [(R3 - R4)*C7] mrem (C.6)
C.2
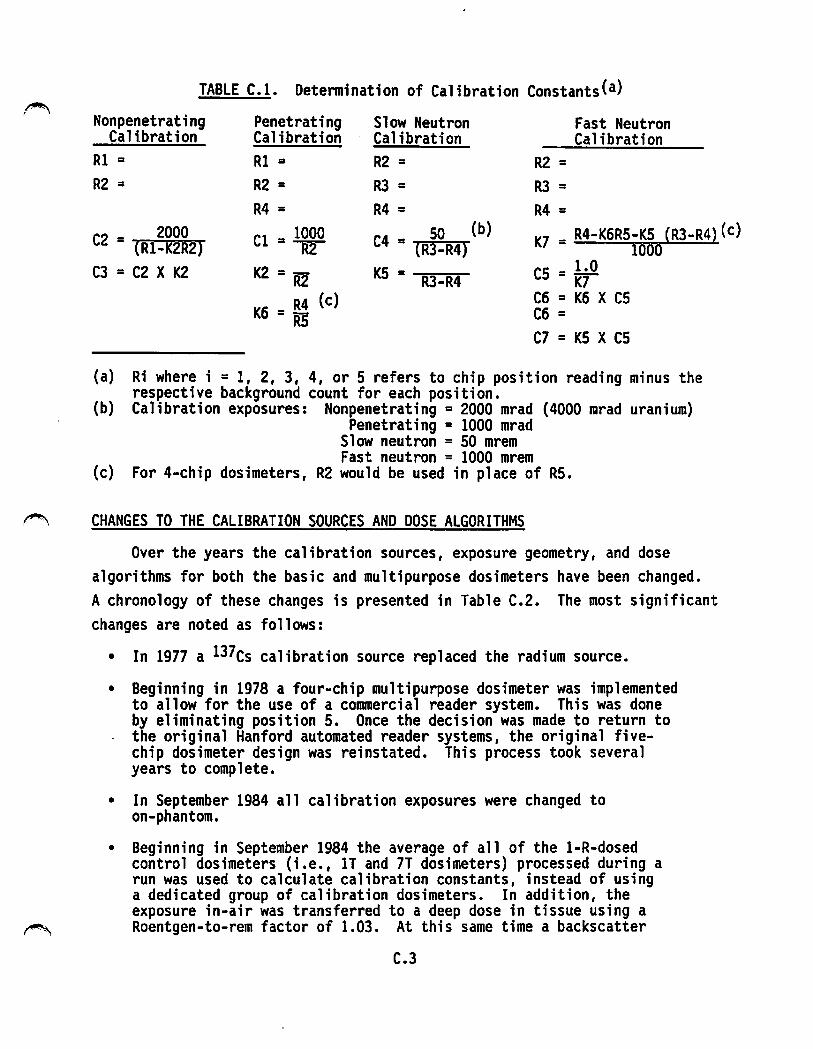
'~ TABLE C.1. Detennination of Calibration ConstantsCa)
Nonpenetrating Penetrating Slow Neutron Fast Neutron Cali.bration Calibration Calibration Calibration
Rl = Rl = R2 = R2 = R2 = R2 = R3 = R3 =
R4 = R4 = R4 = - 2000 Cl _ 1000 C4 - 50 (b) K7 = R4-K6R5-K5 (R3-R4}(c)
C2 - (Rl-K2R2) - R2 - (R3-R4) 1000 C3 = C2 X K2 K2 = R2 KS = R3-R4
cs - 1.0 - K7 K6 - R4 (c) C6 = K6 X CS
- R5 C6 = C7 = KS X CS
(a) Ri where i = 1, 2, 3, 4, or 5 refers to chip position reading minus the respective background count for each position.
(b) Calibration exposures: Nonpenetrating = 2000 mrad (4000 mrad uranium) Penetrating = 1000 mrad
Slow neutron = 50 mrem Fast neutron = 1000 mrem
(c) For 4-chip dosimeters, R2 would be used in place of RS.
~ CHANGES TO THE CALIBRATION SOURCES AND DOSE ALGORITHMS
Over the years the calibration sources, exposure geometry, and dose algorithms for both the basic and multipurpose dosimeters have been changed. A chronology of these changes is presented in Table C.2. The most significant changes are noted as follows:
• In 1977 a 137cs calibration source replaced the radium source.
• Beginning in 1978 a four-chip multipurpose dosimeter was implemented to allow for the use of a conanercial reader system. This was done by eliminating position 5. Once the decision was made to return to the original Hanford automated reader systems, the original fivechip dosimeter design was reinstated. This process took several years to complete.
• In September 1984 all calibration exposures were changed to on-phantom.
• Beginning in September 1984 the average of all of the 1-R-dosed control dosimeters (i.e., IT and 7T dosimeters) processed during a run was used to calculate calibration constants, instead of using a dedicated group of calibration dosimeters. In addition, the exposure in-air was transferred to a deep dose in tissue using a
~ Roentgen-to-rem factor of 1.03. At this same time a backscatter
C.3
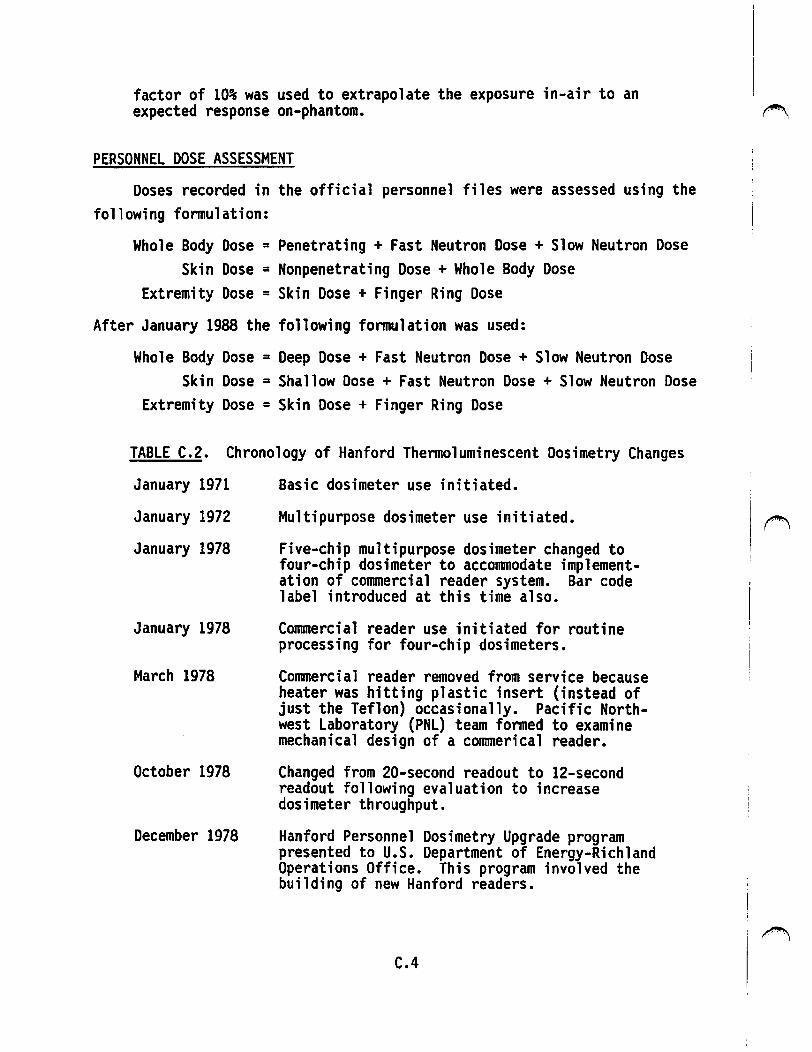
factor of 10% was used to extrapolate the exposure in-air to an expected response on-phantom.
PERSONNEL DOSE ASSESSMENT
Doses recorded in the official personnel files were assessed using the following fonnulation:
Whole Body Dose = Penetrating + Fast Neutron Dose + Slow Neutron Dose Skin Dose = Nonpenetrating Dose + Whole Body Dose
Extremity Dose = Skin Dose + Finger Ring Dose
After January 1988 the following fonnulation was used:
Whole Body Dose = Deep Dose + Fast Neutron Dose + Slow Neutron Dose Skin Dose = Shallow Dose + Fast Neutron Dose + Slow Neutron Dose
Extremity Dose = Skin Dose + Finger Ring Dose
TABLE C.2. Chronology of Hanford Thennoluminescent Dosimetry Changes
January 1971 Basic dosimeter use initiated.
January 1972 Multipurpose dosimeter use initiated.
January 1978 Five-chip multipurpose dosimeter changed to four-chip dosimeter to accommodate implement-ation of commercial reader system. Bar code label introduced at this time also.
January 1978 Commercial reader use initiated for routine processing for four-chip dosimeters.
March 1978 Commercial reader removed from service because heater was hitting plastic insert (instead of just the Teflon) occasionally. Pacific North-west Laboratory (PNL) team fanned to examine mechanical design of a commerical reader.
October 1978 Changed from 20-second readout to 12-second readout following evaluation to increase dosimeter throughput.
December 1978 Hanford Personnel Dosimetry Upgrade program presented to U.S. Department of Energy-Richland Operations Office. This program involved the building of new Hanford readers.
C.4
(""\,
I
~
~
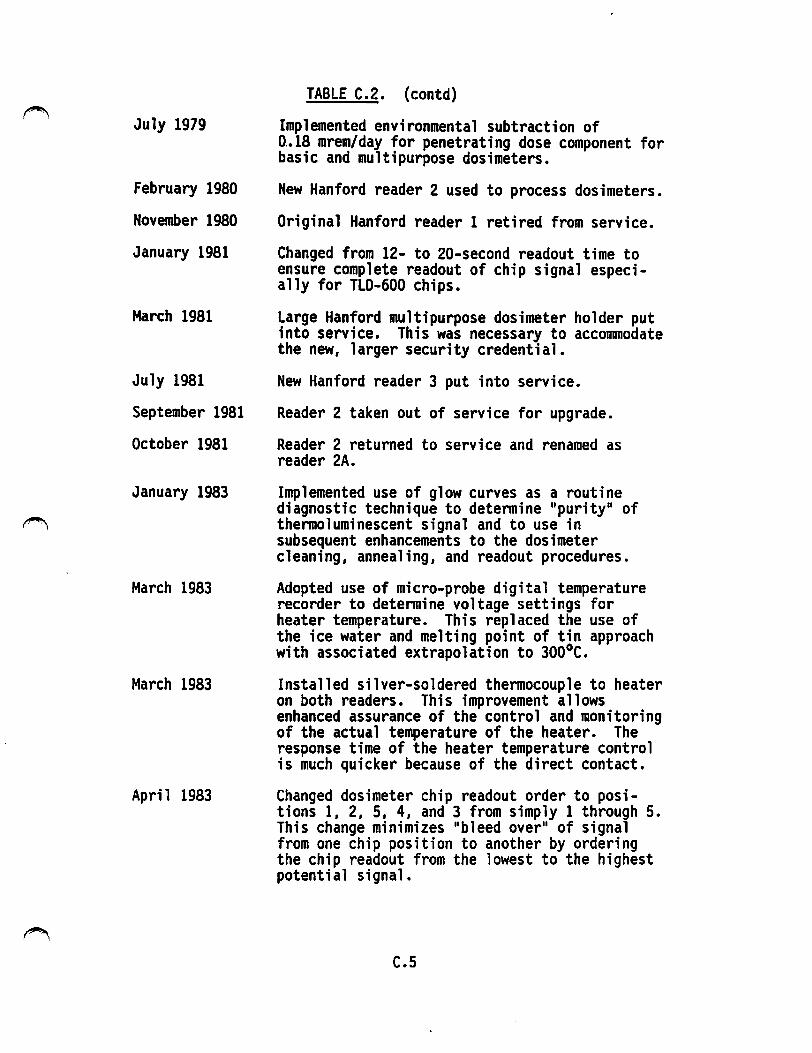
July 1979
February 1980
November 1980
January 1981
March 1981
July 1981
September 1981
October 1981
January 1983
March 1983
March 1983
April 1983
TABLE C.2. (contd)
Implemented environmental subtraction of 0 .• 18 mrem/day for penetrating dose component for basic and multipurpose dosimeters.
New Hanford reader 2 used to process dosimeters.
Original Hanford reader 1 retired from service.
Changed from 12- to 20-second readout time to ensure complete readout of chip signal especially for TLD-600 chips.
Large Hanford multipurpose dosimeter holder put into service. This was necessary to acconunodate the new, larger security credential.
New Hanford reader 3 put into service.
Reader 2 taken out of service for upgrade.
Reader 2 returned to service and renamed as reader 2A.
Implemented use of glow curves as a routine diagnostic technique to determine "purity" of thermoluminescent signal and to use in subsequent enhancements to the dosimeter cleaning, annealing, and readout procedures.
Adopted use of micro-probe digital temperature recorder to determine voltage settings for heater temperature. This replaced the use of the ice water and melting point of tin approach with associated extrapolation to 300°C.
Installed silver-soldered thermocouple to heater on both readers. This improvement allows enhanced assurance of the control and monitoring of the actual temperature of the heater. The response time of the heater temperature control is much quicker because of the direct contact.
Changed dosimeter chip readout order to positions 1, 2, 5, 4, and 3 from simply 1 through 5. This change minimizes "bleed over" of signal from one chip position to another by ordering the chip readout from the lowest to the highest potential signal.
C.5
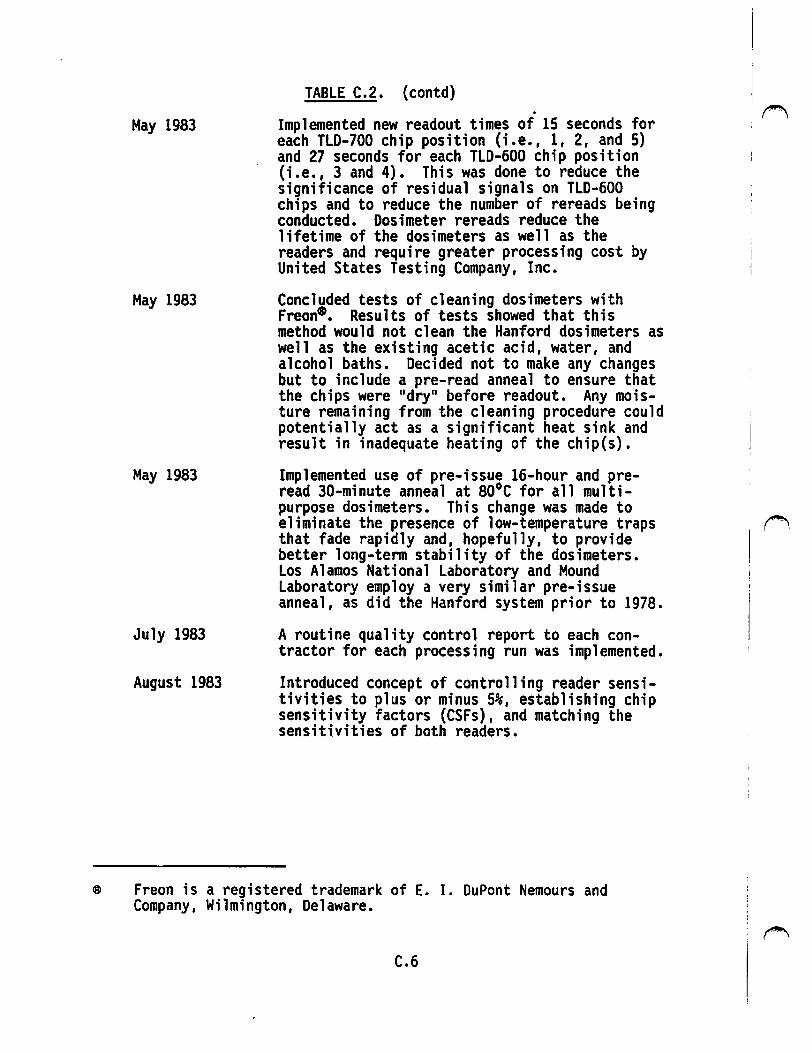
May 1983
May 1983
May 1983
July 1983
August 1983
TABLE C.2. (contd) .
Implemented new readout times of 15 seconds for each TLD-700 chip position (i.e., 1, 2, and 5) and 27 seconds for each TLD-600 chip position (i.e., 3 and 4). This was done to reduce the significance of residual signals on TLD-600 chips and to reduce the number of rereads being conducted. Dosimeter rereads reduce the lifetime of the dosimeters as well as the readers and require greater processing cost by United States Testing Company, Inc.
Concluded tests of cleaning dosimeters with Freon•. Results of tests showed that this method would not clean the Hanford dosimeters as well as the existing acetic acid, water, and alcohol baths. Decided not to make any changes but to include a pre-read anneal to ensure that the chips were 11 dry 11 before readout. Any moisture remaining from the cleaning procedure could potentially act as a significant heat sink and result in inadequate heating of the chip{s).
Implemented use of pre-issue 16-hour and preread 30-minute anneal at 80°C for all multipurpose dosimeters. This change was made to eliminate the presence of low-temperature traps that fade rapidly and, hopefully, to provide better long-tenn stability of the dosimeters. Los Alamos National Laboratory and Mound Laboratory employ a very similar pre-issue anneal, as did the Hanford system prior to 1978.
A routine quality control report to each contractor for each processing run was implemented.
Introduced concept of controlling reader sensitivities to plus or minus 5%, establishing chip sensitivity factors (CSFs), and matching the sensitivities of both readers.
Freon is a registered trademark of E. I. DuPont Nemours and Company, Wilmington, Delaware.
C.6
I ~
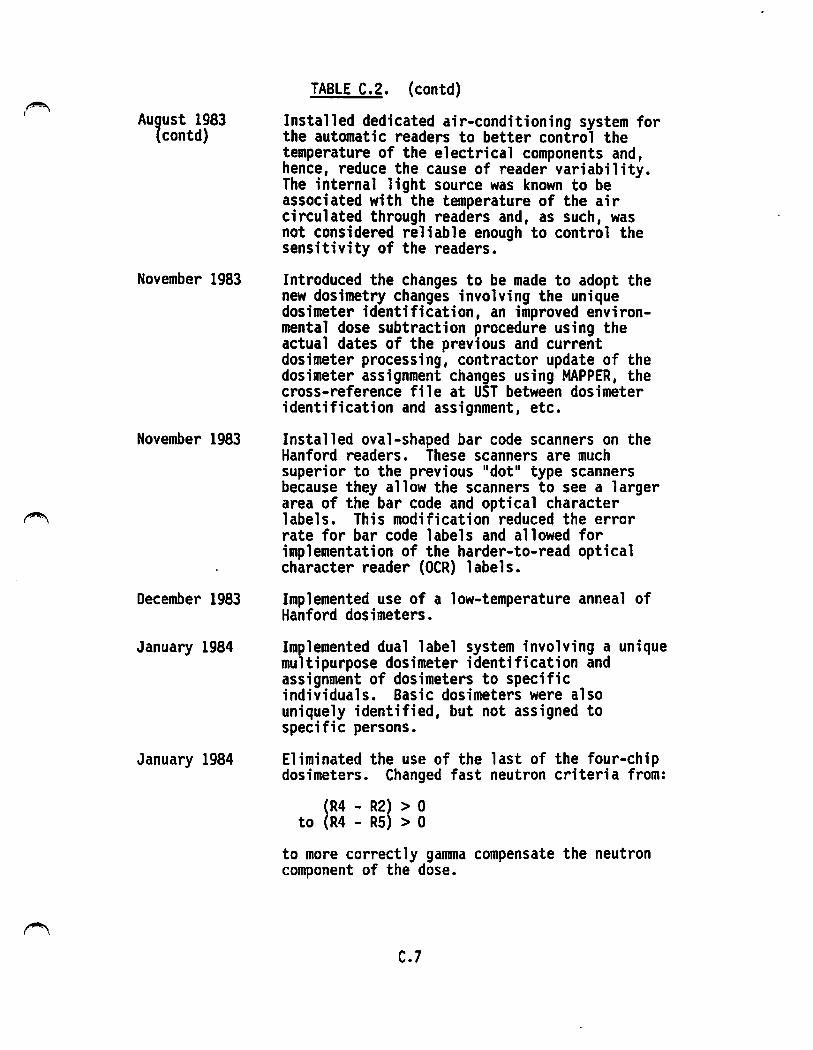
August 1983 (contd)
November 1983
November 1983
December 1983
January 1984
January 1984
TABLE C.2. (contd)
Installed dedicated air-conditioning system for the automatic readers to better control the temperature of the electrical components and, hence, reduce the cause of reader variability. The internal light source was known to be associated with the temperature of the air circulated through readers and, as such, was not considered reliable enough to control the sensitivity of the readers.
Introduced the changes to be made to adopt the new dosimetry changes involving the unique dosimeter identification, an improved environmental dose subtraction procedure using the actual dates of the previous and current dosimeter processing, contractor update of the dosimeter assignment changes using MAPPER, the cross-reference file at UST between dosimeter identification and assignment, etc.
Installed oval-shaped bar code scanners on the Hanford readers. These scanners are much superior to the previous 11 dot 11 type scanners because they allow the scanners to see a larger area of the bar code and optical character labels. This modification reduced the error rate for bar code labels and allowed for implementation of the harder-to-read optical character reader {OCR) labels.
Implemented use of a low-temperature anneal of Hanford dosimeters.
Implemented dual label system involving a unique multipurpose dosimeter identification and assignment of dosimeters to specific individuals. Basic dosimeters were also uniquely identified, but not assigned to specific persons.
Eliminated the use of the last of the four-chip dosimeters. Changed fast neutron criteria from:
(R4 - R2) > 0 to (R4 - RS) > 0
to more correctly gamma compensate the neutron component of the dose.
C.7
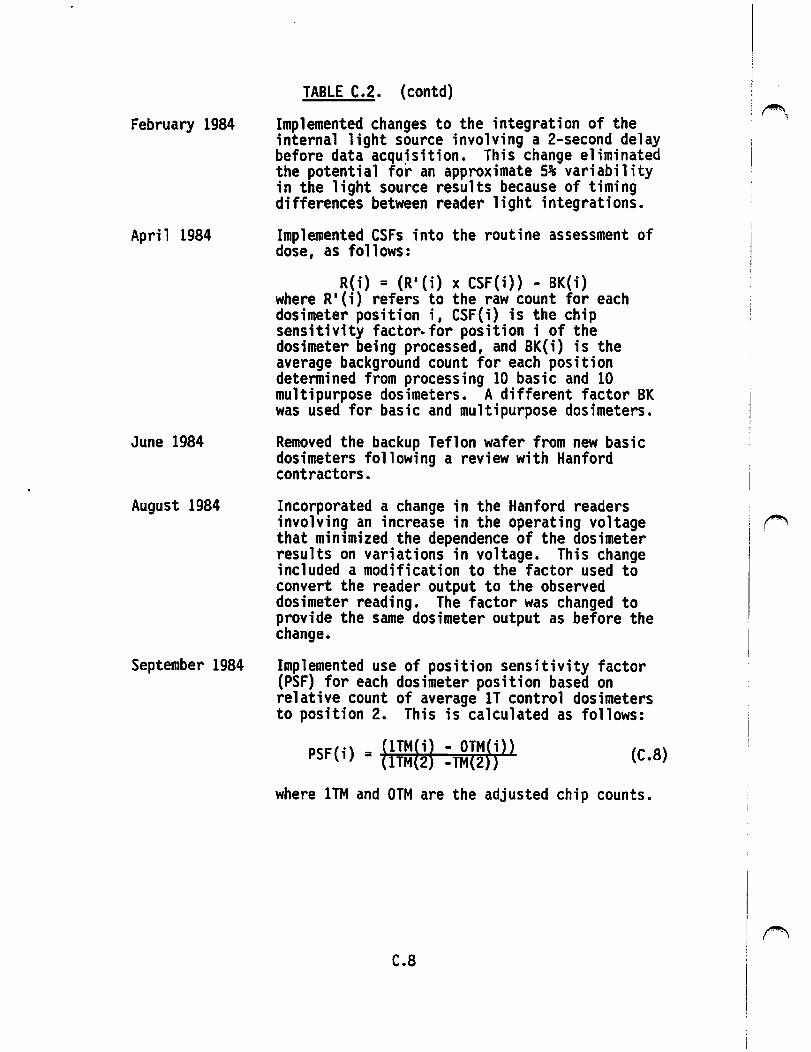
February 1984
April 1984
June 1984
August 1984
September 1984
TABLE C.2. (contd)
Implemented changes to the integration of the internal light source involving a 2-second delay before data acquisition. This change eliminated the potential for an approximate 5% variability in the light source results because of timing differences between reader light integrations.
Implemented CSFs into the routine assessment of dose, as follows:
R(i) = (R 1 (i) x CSF(i)) - BK(i) where R1 (i) refers to the raw count for each dosimeter position i, CSF(i) is the chip sensitivity factor.for position i of the dosimeter being processed, and BK(i) is the average background count for each position determined from processing 10 basic and 10 multipurpose dosimeters. A different factor BK was used for basic and multipurpose dosimeters.
Removed the backup Teflon wafer from new basic dosimeters following a review with Hanford contractors.
Incorporated a change in the Hanford readers involving an increase in the operating voltage that minimized the dependence of the dosimeter results on variations in voltage. This change included a modification to the factor used to convert the reader output to the observed dosimeter reading. The factor was changed to provide the same dosimeter output as before the change.
Implemented use of position sensitivity factor (PSF) for each dosimeter position based on relative count of average lT control dosimeters to position 2. This is calculated as follows:
PSF(i) = f lTMf i~ - OTMf i)) lTM 2 -TM(2 ) (C.8)
where lTM and OTM are the adjusted chip counts.
C.8
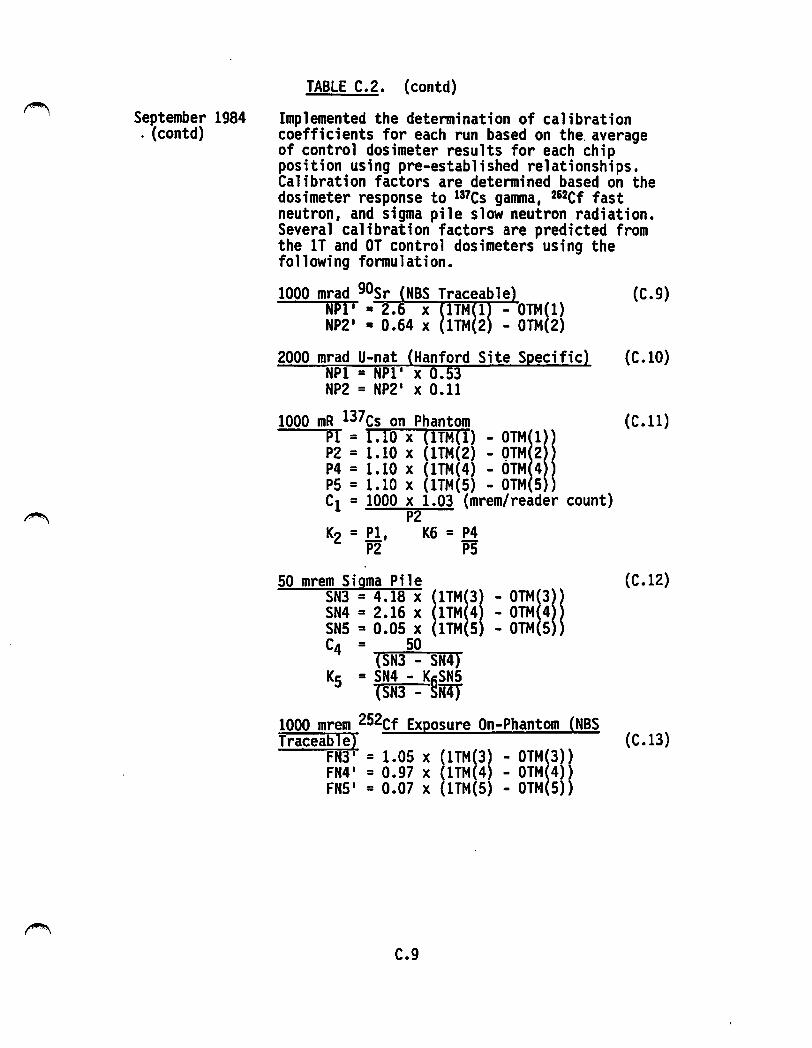
September 1984 . (contd)
TABLE C.2. (contd)
Implemented the determination of calibration coefficients for each run based on the. average of control dosimeter results for each chip position using pre-established relationships. Calibration factors are determined based on the dosimeter response to 1a1cs gamma, 2&2Cf fast neutron, and sigma pile slow neutron radiation. Several calibration factors are predicted from the lT and OT control dosimeters using the following formulation.
1000 mrad 90sr NBS Traceable (C.9) NPl 1 = . x TM 1 - OTM(l) NP2' = 0.64 x lTM 2) - OTM(2)
2000 mrad U-nat (Hanford Site Specific) (C.10) NPl = NPl' x 0.53 NP2 = NP2' x 0.11
1000 mR 137cs on Phantom (C.11) Pl = 1.10 x lTM 1) - OTM(l)) P2 = 1.10 x (lTM 2) - QTM(2)) P4 = 1.10 x (1TM(4) - OTM(4)) PS= 1.10 x (lTM(S) - OTM(S)) c1 = 1000 x 1.03 (mrem/reader count)
P2 K2 = Pl I K6 = P4
P2 PS
SO mrem Sigma Pile (C.12) SN3 = 4.18 x (1TM(3l - OTM!3)) SN4 = 2.16 x (1TM(4 - OTM 4)) SNS = 0.05 x (lTM(S - OTM 5)) C4 = 50
(SN3 - SN4) Ks = SN4 - K6SN5
(SN3 - SN4}
1000 mrem 252cf Exposure On-Phantom (NBS Traceah1e1 (C.13)
FN3 = 1.05 x (1TM(3) - OTM!3)) FN4' = 0.97 x (1TM(4) - OTM 4)) FNS' = 0.07 x (lTM(S) - OTM 5))
C.9
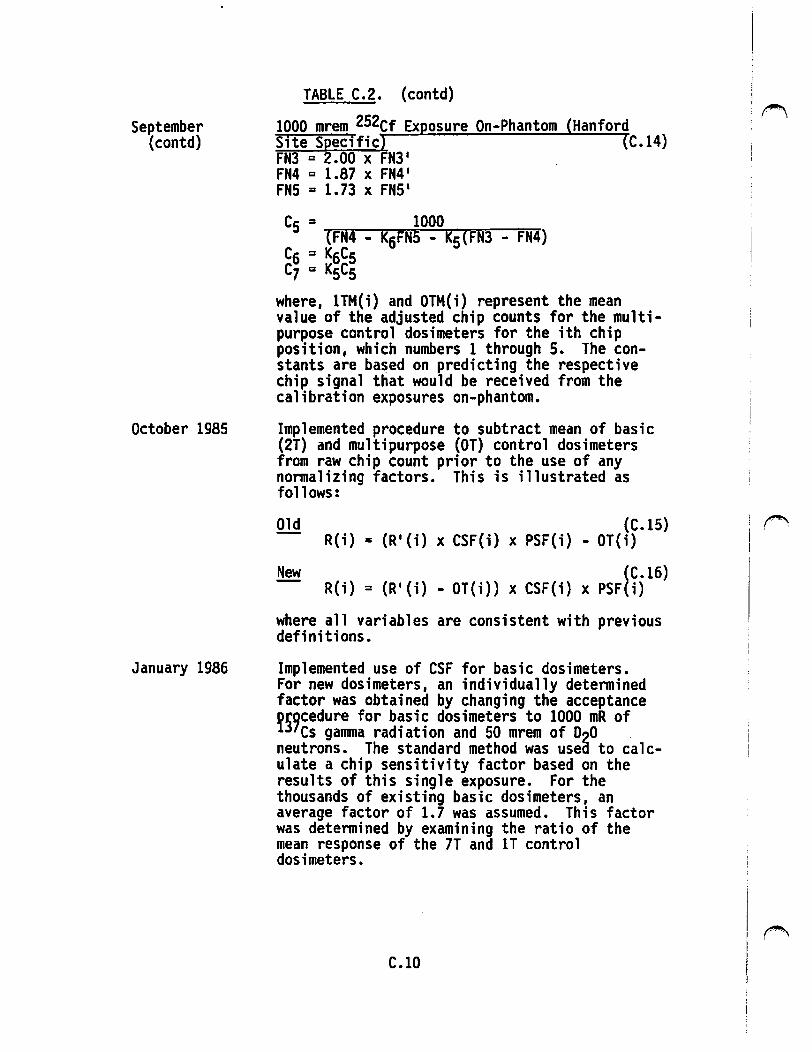
September (contd)
October 1985
January 1986
TABLE C.2. (contd)
1000 mrem 252cf Ex osure On-Phantom Hanford s;te S ec;fic C.14) FN3 = 2.00 x FN3' FN4 = 1.87 x FN4' FNS = 1.73 x FNS'
C5 = 1000 (FN4 - KfiFNS - Ks(FN3 - FN4)
Cs = K5C5 C7 = KsCs
where, lTM(i) and OTM(i) represent the mean value of the adjusted chip counts for the multipurpose control dosimeters for the ith chip position, which numbers 1 through 5. The constants are based on predicting the respective chip signal that would be received from the calibration exposures on-phantom.
Implemented procedure to subtract mean of basic (2T) and multipurpose (OT) control dosimeters from raw chip count prior to the use of any normalizing factors. This is illustrated as follows:
Old
New
(C.15) = (R'(i) x CSF(i) x PSF(i) - OT(i)
(C.16) R(i) = (R' (i) - OT(i)) x CSF(i) x PSF(i)
where all variables are consistent with previous definitions.
Implemented use of CSF for basic dosimeters. For new dosimeters, an individually determined factor was obtained by changing the acceptance ~~9cedure for basic dosimeters to 1000 mR of
Cs gamma radiation and 50 mrem of 020 . neutrons. The standard method was usea to calculate a chip sensitivity factor based on the results of this single exposure. For the thousands of existing basic dosimeters, an average factor of 1.7 was assumed. This factor was determined by examining the ratio of the mean response of the 7T and lT control dosimeters.
C.10
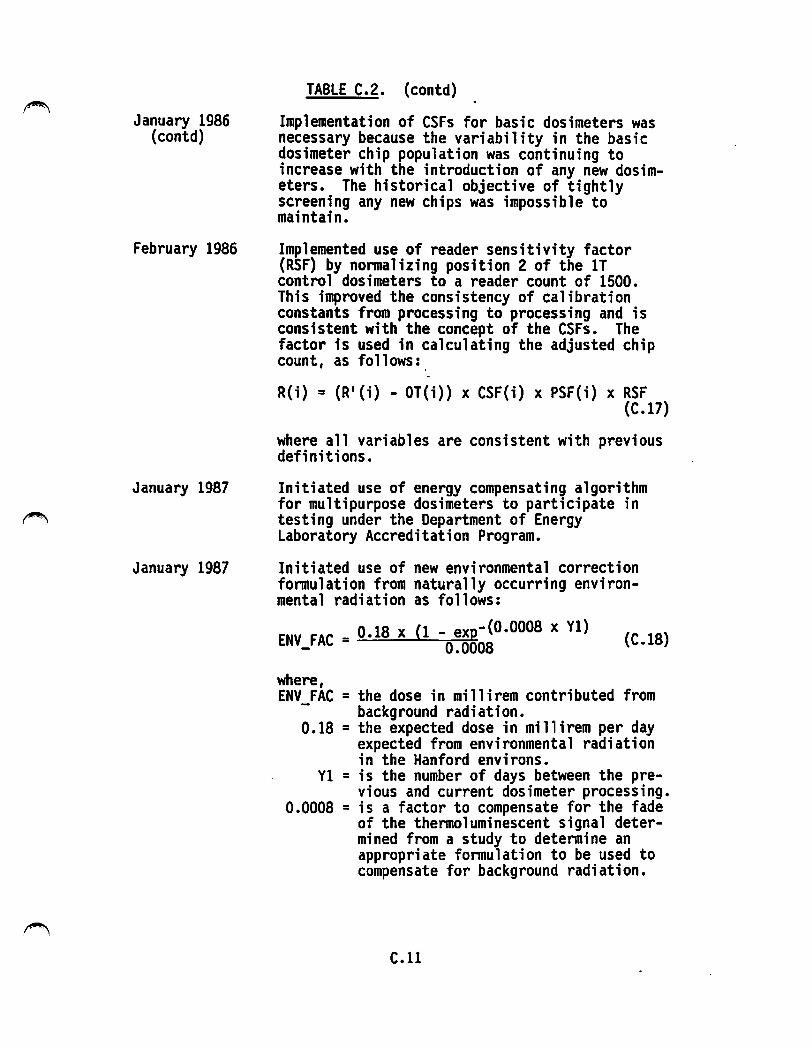
January 1986 (contd)
February 1986
January 1987
January 1987
TABLE C.2. (contd)
Implementation of CSFs for basic dosimeters was necessary because the variability in the basic dosimeter chip population was continuing to increase with the introduction of any new dosimeters. The historical objective of tightly screening any new chips was impossible to maintain.
Implemented use of reader sensitivity factor (RSF) by normalizing position 2 of the lT control dosimeters to a reader count of 1500. This improved the consistency of calibration constants from processing to processing and is consistent with the concept of the CSFs. The factor is used in calculating the adjusted chip count, as follows:
R(i) = (R 1 (i) - OT(i)) x CSF(i) x PSF(i) x RSF (C.17)
where all variables are consistent with previous definitions.
Initiated use of energy compensating algorithm for multipurpose dosimeters to participate in testing under the Department of Energy Laboratory Accreditation Program.
Initiated use of new environmental correction formulation from naturally occurring environmental radiation as follows:
_ 0•18 x (l _ exp-(0.0008 x Yl) ENV_FAC - 0.0008 (C.18)
where, ENV FAC =the dose in millirem contributed from
- background radiation. 0.18 = the expected dose in millirem per day
expected from environmental radiation in the Hanford environs.
Yl = is the number of days between the previous and current dosimeter processing.
0.0008 = is a factor to compensate for the fade of the thermoluminescent signal determined from a study to detennine an appropriate formulation to be used to compensate for background radiation.
c.11

June 1987
October 1987
January 1988
October 1988
TABLE C.2. (contd)
Initiated routine availability of area dosimeter to measure beta and ganuna dose components in selected Hanford working environments.
Initiated routine availability of beta/photon dosimeter for special field conditions.
Initiated individually detennined CSFs for basic dosimeters. Procedure identical for all new dosimeters.
Site-wide dosimeter processing transferred to PNL. Upgraded Hanford readers were used to conduct the processing. These readers introduced electronic glow curve recording. These records were stored for 60 business days for use in resolving any questions regarding the processing.
c .12
'~
APPENDIX D
DATA FOR BETA/PHOTON AND NEUTRON DOSIMETERS EVALUATED
DURING THE 1989 INTERCOMPARISON STUDY
i j i i
I ~ (' }
APPENDIX D
DATA "FOR BETA/PHOTON AND NEUTRON DOSIMETERS EVALUATED DURING THE 1989 INTERCOMPARISON STUDY
During 1989 an intercomparison study was conducted of all types of personnel film dosimeters used at Hanford from 1944 to the present. The data for beta/photon dosimeters is presented in Tables D.l through D.4, which summarize dose evaluation data for the years 1944, 1945, 1957, and 1962, respectively. The data for film neutron dosimeters is presented in Tables D.5 and D.6.
D.l
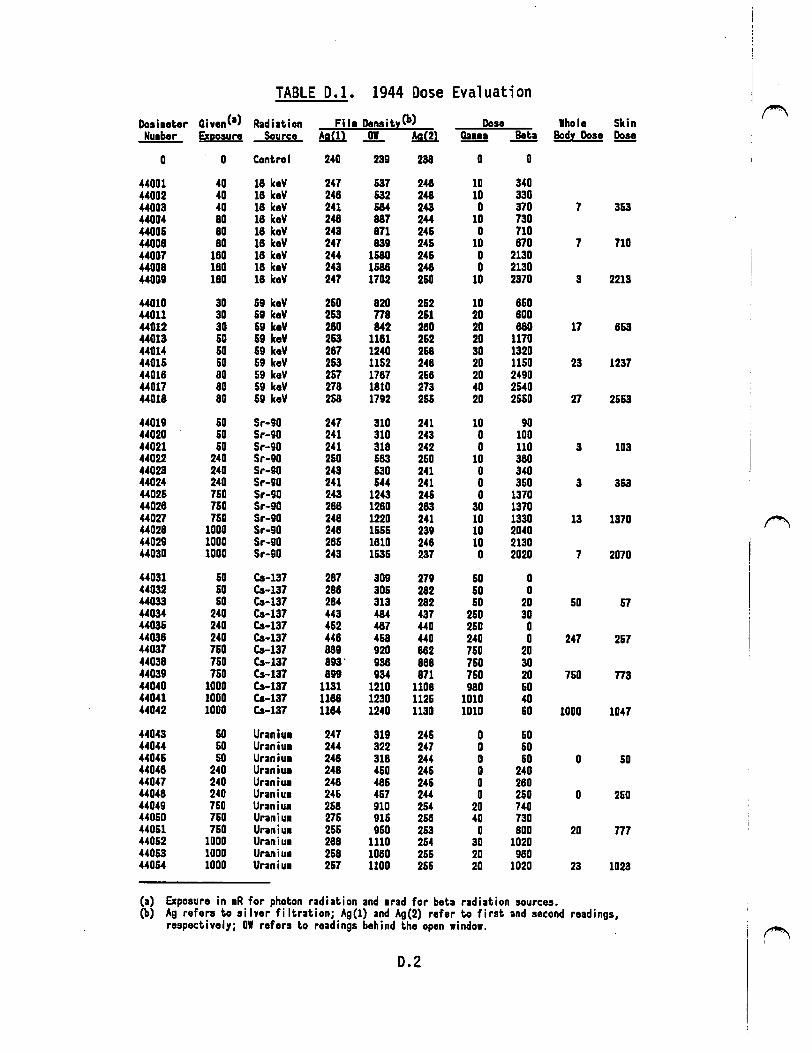
TABLE D.l. 1944 Dose Evaluation
QivenC•) Fi I• DensitxCb) ("""\
Dosimeter Radiation Dose lhole Skin Nu1ber Exeosure Source 69..C!l J!!_ ~ Q!!!! Beta Bodx Dose Dose
0 0 Control 240 239 238 0 0
44001 40 18 keV 247 637 248 10 340 44002 40 18 keV 248 632 248 10 330 44003 40 18 keV 241 684 243 0 370 7 363 44004 80 18 keV 248 887 244 10 730 44006 80 18 keV 243 871 246 0 710 44008 80 18 keV 247 839 246 10 870 7 710 44007 180 18 keV 244 1680 246 0 2130 44008 180 18 keV 243 1688 248 0 2130 44009 180 18 keV 247 1702 260 10 2370 3 2213
44010 30 69 keV 260 820 262 10 860 44011 30 69 keV 263 n8 261 20 800 44012 30 69 keV 280 842 280 20 880 17 863 44013 60 69 keV 263 1181 262 20 1170 44014 60 69 keV 287 1240 268 30 1320 44016 60 69 keV 263 1152 248 20 1160 23 1237 44018 80 59 keV 267 1787 258 20 2490 44017 80 59 keV 278 1810 273 40 2540 44018 80 69 keV 268 1792 266 20 2550 27 2663
44019 so Sr-90 247 310 241 10 90 44020 so Sr-90 241 310 243 0 100 44021 60 Sr-90 241 318 242 0 110 3 103 44022 240 Sr-90 260 683 260 10 360 44023 240 Sr-90 243 630 241 0 340 44024 240 Sr-90 241 &« 241 0 360 3 363 44025 750 Sr-90 243 1243 246 0 1370 44028 760 Sr-90 288 1280 283 30 1370 44027 760 Sr-90 248 1220 241 10 1330 13 1370 ~ 44028 1000 Sr-90 248 1556 239 10 2040 44029 1000 Sr-90 286 1810 248 10 2130 44030 1000 Sr-90 243 1636 237 0 2020 7 2070
44031 60 Cs-137 287 309 279 so 0 44032 60 Cs-137 288 306 282 60 0 44033 60 Cs-137 284 313 282 50 20 so 67 44034 240 Cs-137 443 484 437 250 30 44036 240 Cs-137 462 487 440 260 0 44038 240 Cs-137 448 468 440 240 0 247 267 44037 7SO Cs-137 889 920 882 760 20 44038 7SO Cs-137 893' 938 888 760 30 44039 760 Cs-137 899 934 871 760 20 760 n3 44040 1000 Cs-137 1131 1210 1108 980 60 44041 1000 Cs-137 1188 1230 1126 1010 40 44042 1000 Cs-137 1184 1240 1130 1010 60 1000 1047
44043 60 Uraniu• 247 319 24S 0 60 44044 60 Uranium 244 322 247 0 60 44046 60 Uranium 248 318 244 0 60 0 50 44048 240 Uraniu• 248 460 246 0 240 44047 240 Uranium 248 486 246 0 260 44048 240 Uraniu• 246 467 244 0 250 0 260 44049 750 Uraniu• 258 910 254 20 740 44050 760 Uraniu• 276 916 266 40 730 44051 760 Uraniu• 255 950 263 0 800 20 777 44052 1000 Uraniu• 288 1110 264 30 1020 44053 1000 Uranium 258 1060 265 20 980 44064 1000 Uraniu• 267 1100 256 20 1020 23 1023
(a) Exposure in •R for photon radiation and 1rad for beta radiation sources. (b) Ag refora to silver filtration; Ag(l) and Ag(2) refer to first and second readings,
respectively; DI rofors to readings behind the open window. ~
0.2
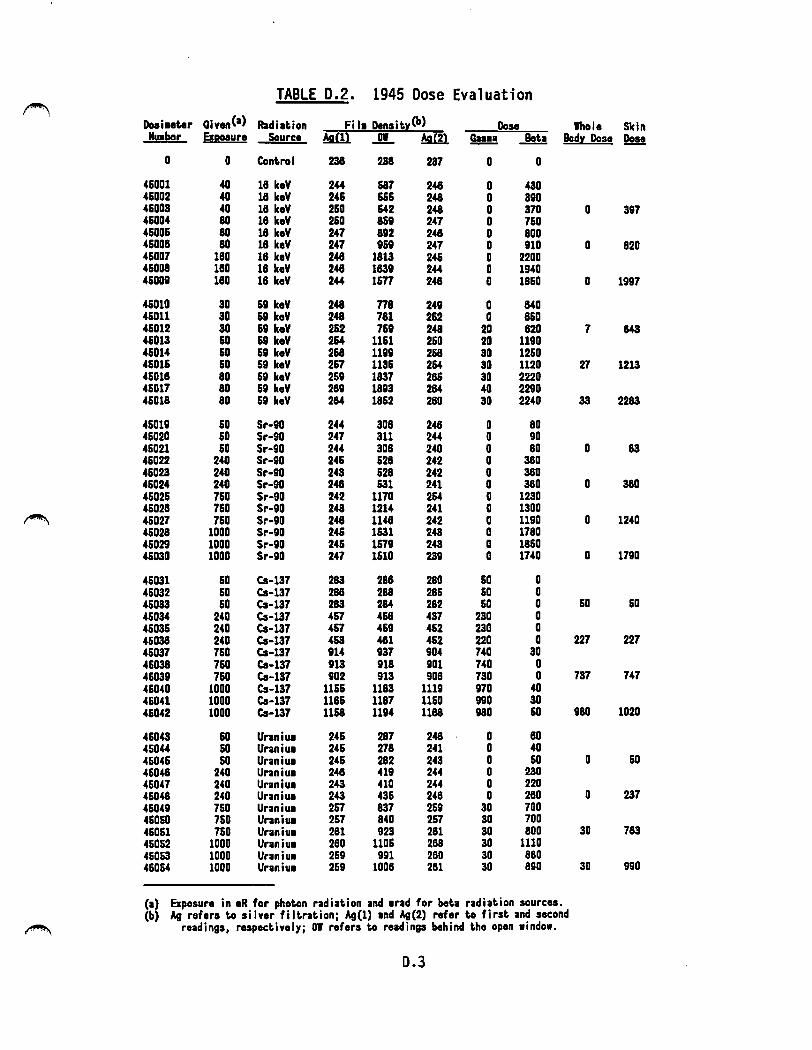
TABLE 0.2. 1945 Dose Evaluation ~
OivenC•) Fi I• Densit.zCb) DoaiHter Radiation Dose lhole Skin Number Exl!!!:!ure Source ~ J!L ~ !!!!!! Bet.a Bodz Dose e
o o Cont.rol 238 238 237 o o 46001 40 18 keV 244 687 248 0 430 46002 40 18 keV 246 666 248 0 390 46003 40 18 keV 260 642 248 0 370 0 397 46004 80 18 koV 260 869 247 0 760 46006 80 18 koV 247 892 248 0 800 46008 80 18 keV 247 969 247 0 910 0 820 46007 180 18 keV 248 1813 246 0 2200 46008 180 18 keV 248 1839 244 0 1940 4&009 180 18 keV 244 1577 248 0 1850 0 1997
4&010 30 &9 keV 248 778 249 o 840 46011 30 69 koV 248 781 252 o 860 46012 30 69 keV 252 769 248 20 820 7 843 46013 50 69 koV 264 11&1 260 20 1190 45014 50 69 koV 268 1199 268 30 12&0 4&01& &O 69 keV 2&7 113& 264 30 1120 27 1213 4&018 80 69 keV 259 1837 28& 30 2220 4&017 80 59 koV 289 1893 284 40 2290 45018 80 59 keV 284 1852 280 30 2240 33 2283
46019 50 Sr-90 244 308 248 80 46020 60 Sr-90 247 311 244 90 46021 60 Sr-90 244 308 240 80 0 83 4&022 240 Sr-90 24& &28 242 380 4&023 240 Sr-90 243 628 242 380 4&024 240 Sr-90 248 &31 241 380 0 380 4502& 7&0 Sr-90 242 1170 264 1230 4&028 7&0 Sr-90 243 1214 241 1300
~ 46027 7&0 Sr-90 248 1148 242 1190 0 12"0 46028 1000 Sr-90 24& 1&31 2 .. 3 1780 46029 1000 Sr-90 24& 1&79 2 .. 3 18&0 4&030 1000 Sr-90 247 1&10 239 1740 o 1790
46031 60 Cs-137 283 288 280 60 0 46032 60 Cs-137 288 288 28& 60 0 46033 60 Cs-137 283 284 282 &O 0 &O 60 46034 240 Cs-137 4&7 468 437 230 0 46036 240 Cs-137 467 469 462 230 o 4&038 240 Cs-137 4&3 481 4&2 220 0 227 227 4&037 7&0 Cs-137 914 937 904 740 30 4&038 7&0 Cs-137 913 918 901 740 0 46039 7&0 Cs-137 902 913 908 730 0 737 747 46040 1000 Cs-137 116& 1183 1119 970 40 4&041 1000 Cs-137 118& 1187 11&0 990 30 4&042 1000 Cs-137 1168 1194 1188 980 &O 980 1020
4&043 &O Uraniu 24& 287 248 0 80 45044 60 Uraniu 24& 278 241 0 40 4504& 60 Uranium 24& 282 243 0 60 0 60 46048 240 Uranium 248 419 244 o 230 460"7 240 Uranium 243 410 24" 0 220 46048 240 Uranium 243 436 248 o 280 0 237 46049 760 Uraniu 257 837 259 30 700 46050 750 Uraniu 257 840 257 30 700 4&0&1 7&0 Uranium 281 923 281 30 800 30 783 46052 1000 Uranium 280 110& 288 30 1110 46053 1000 Uranium 259 991 280 30 880 460&4 1000 Uranium 2&9 1008 281 30 890 30 990
(a) Exposure in •R for photon radiation and •rad for bot.a radiation sources. (b) Ag refers t.o silver filtration; Ag(l) and Ag(2) refer t.o first. and second
~ readings, respectively; DI refers to readings behind tho open window.
0.3
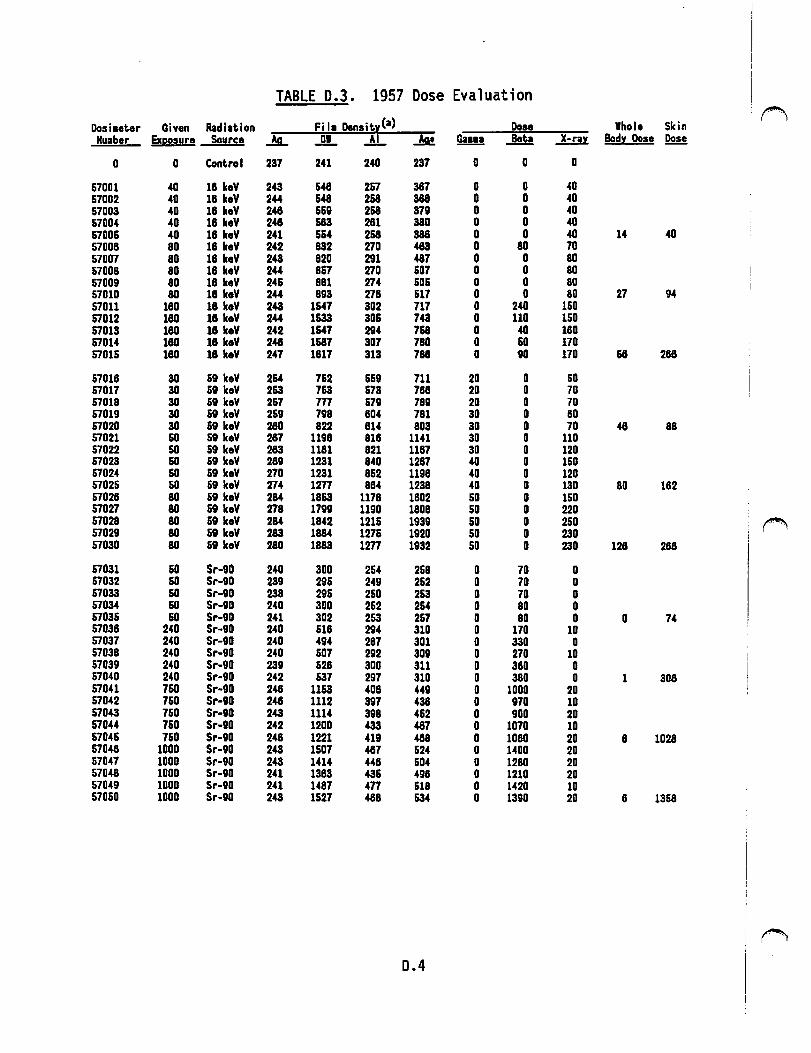
TABLE 0.3. 1957 Dose Evaluation
Fi I• Densit:r:Cal ~
Dosiaeter Civen Radiation Dose lholo Skin Humber Exesure Source £ J!L _&_ ~ ea ... Jlll! X-ra:r: Bod:r: Dose Dose
0 0 Control 237 241 240 237 0 0 0
&7001 40 18 keV 243 &48 2&7 387 0 40 57002 40 18 keV 244 548 258 388 0 40 57003 40 18 koY 248 &69 268 379 D 40 57004 40 18 keY 248 583 281 380 0 40 57005 40 18 keY 241 554 258 388 0 40 14 40 57008 80 18 keY 242 832 270 483 80 70 57007 80 18 keY 243 820 291 487 0 80 57008 8D 18 keY 244 867 270 607 0 80 57009 80 18 keV 24& 881 274 60& 0 80 57010 80 18 keV 244 893 278 517 0 80 27 94 57011 180 18 keV 243 1547 302 717 240 150 57012 180 18 keV 244 1533 30& 743 110 150 57013 180 18 keY 242 1547 294 758 40 180 57014 180 18 keV 248 1587 307 780 50 170 57015 180 18 keY 247 1817 313 788 90 170 58 288
57018 30 59 keV 254 752 559 711 20 50 57017 30 69 koV 253 753 573 788 2D 70 57018 30 69 keV 267 1n 579 7811 2D 7D &7019 30 59 keY 259 798 804 781 30 BO 57020 30 59 keY 280 822 814 803 30 70 88 57021 60 59 keV 287 1198 818 1141 30 110 57022 50 59 keY 283 1181 821 1187 30 120 57023 60 59 keV 2811 1231 84D 1287 40 15D 57024 50 59 keV 270 1231 852 1198 40 120 57025 50 &9 koV 274 12n 884 1238 4D 130 80 162 57028 80 &9 keY 284 1853 1178 1602 50 150 57027 80 &9 lceY 278 1799 1190 1808 so 220 57028 80 59 keY 284 1842 1215 1939 SD 250 ~ &7029 80 59 keY 283 1884 1276 1920 &O 23D 57030 80 59 keY 280 1883 1m 1932 SD 23D 128 268
57031 60 Sr-90 240 300 254 268 70 D 57032 60 Sr-90 239 295 249 252 70 D 57033 &O Sr-90 238 295 25D 253 70 D &7034 60 Sr-90 240 300 252 254 80 0 57035 60 Sr-90 241 302 263 257 8D 0 0 74 57038 240 Sr-9D 240 518 294 310 170 10 57037 240 Sr-9D 240 494 287 301 330 0 57038 240 Sr-90 240 507 292 309 270 lD 57039 240 Sr-90 239 528 aoo 311 380 0 57040 240 Sr-9D 242 537 297 310 380 D 1 308 57041 750 Sr-90 248 11&3 408 449 1000 20 57042 750 Sr-90 248 1112 397 438 970 10 57043 760 Sr-90 243 1114 398 452 900 20 57044 750 Sr-90 242 1200 433 487 1070 10 57046 750 Sr-90 248 1221 419 488 1080 20 8 1028 57048 1000 Sr-90 243 1507 487 624 1400 20 57047 1000 Sr-90 243 1414 448 504 1280 20 57048 1000 Sr-90 241 1363 43& 498 1210 20 57049 1000 Sr-90 241 1487 4n 618 1420 10 57050 1000 Sr-90 243 1527 488 534 1390 20 6 1358
0.4
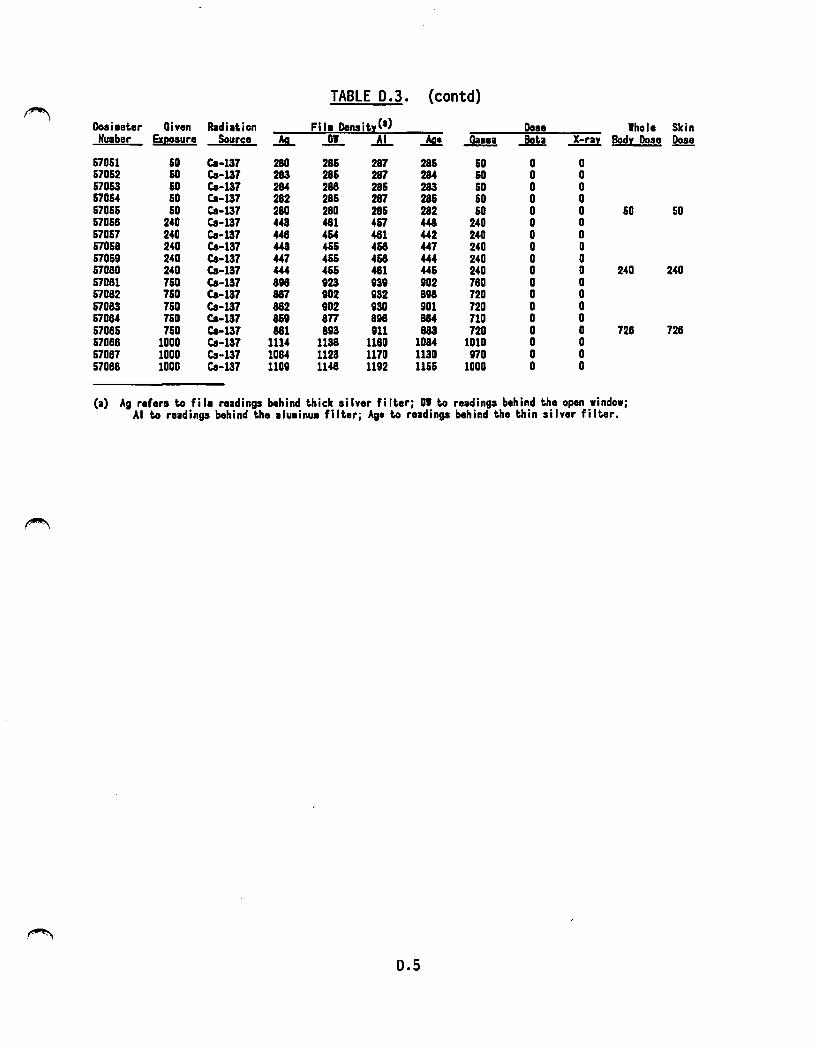
TABLE D.3. (contd)
Dosi1ater Qi van Radiation Fi I• DensitzC•) Dose Whole Skin Nu1ber Ex~ure Source .lL J!!_ ..!L ~ -9!!!! ~ X-rn Bodz Dose Dose
57051 60 Ca-137 280 285 287 286 60 0 57052 50 Ca-137 283 285 287 284 60 0 57053 60 Ca-137 284 288 286 283 60 0 5705-4 60 C.-137 282 285 287 28& 60 0 67055 60 Ca-137 280 280 28& 282 60 0 60 50 67068 240 C.-137 4-43 481 457 448 240 0 67067 240 Ca-137 448 454 481 442 240 0 57058 240 Ca-137 4-43 465 458 447 240 0 57059 240 Ca-137 447 455 458 444 240 0 57080 240 Ca-137 444 465 481 445 240 0 240 240 57081 750 Ca-137 898 923 939 902 780 0 57082 750 Ca-137 887 902 932 898 720 0 57083 760 Ca-137 882 902 930 901 720 0 57084 750 C.-137 869 877 898 884 710 0 57085 750 C.-137 881 893 911 883 720 0 728 728 57088 1000 Ca-137 1114 1138 1180 1084 1010 0 67087 1000 Ca-137 1084 1123 1170 1130 970 0 57088 1000 Ca-137 1109 1148 1192 115& 1000 0
(a) Ag refers to fil• readings behind thick silver filter; DI to readings behind the open window; Al to re1dings behind the 1lu•inu• filter; Ag• to readings behind the thin silver filter.
o.s
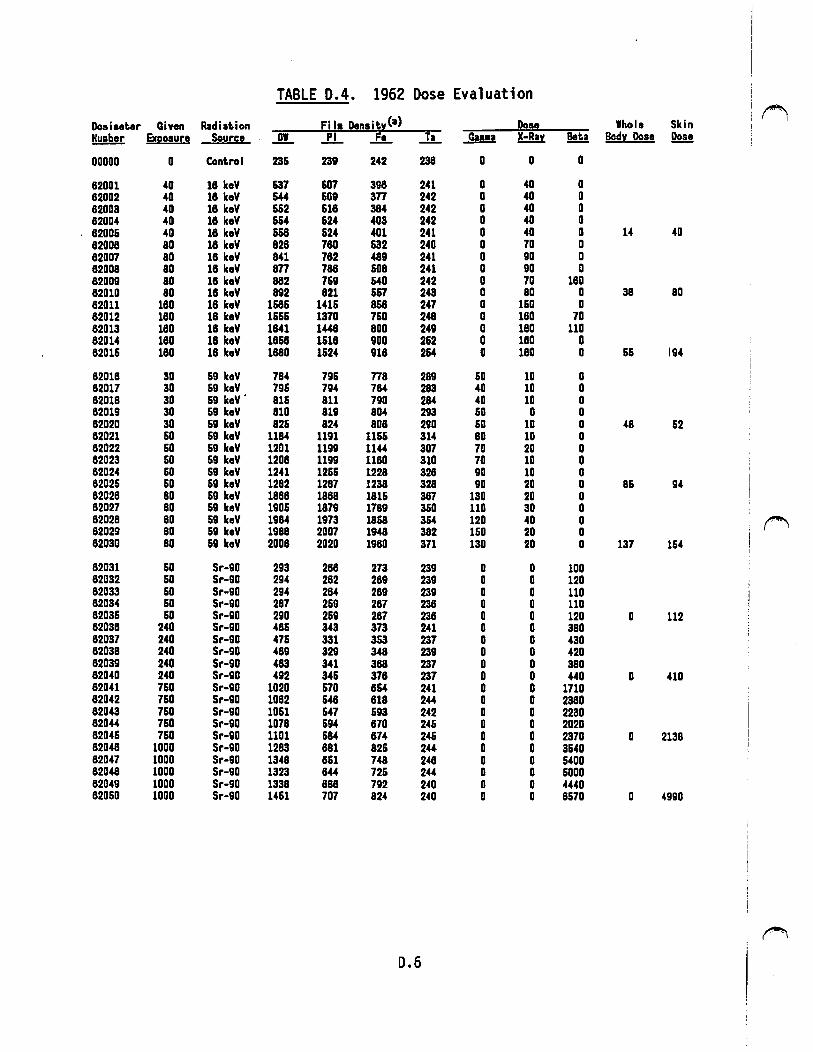
TABLE 0.4. 1962 Dose Evaluation
Fi I• Den1it.1C•) ~
Qivon Radiat.ion Dose Whole Skin I Doaiaeter Number Exl!osuro Source J!!... _!!_ .£!.... ...!!... ...QI!!! X-Rn Beta Bod1 Dose ~
00000 0 Control 236 2311 242 238 0 0 0
82001 40 18 koV 637 607 398 241 40 0 82002 40 18 koV 544 &Oii 377 242 40 0 82003 40 18 koV 662 618 384 242 40 0 82004 40 18 koV &64 624 403 242 40 0 82006 40 18 koV &68 &24 401 241 40 0 14 40 82008 80 18 koV 828 780 632 240 70 0 82007 80 18 keV 841 782 489 241 90 0 82008 80 18 keV 877 788 &08 241 90 0 82009 80 18 keV 882 769 640 242 70 180 82010 80 18 koV 892 821 &&7 243 80 0 38 80 82011 180 18 koV 168& 141& 868 247 160 0 82012 180 18 keV 15&& 1370 760 248 180 70 82013 180 18 keV 1841 1448 800 249 180 110 82014 180 18 keV 1868 1&18 900 262 180 0 8201& 180 18 koV 1880 1624 918 264 180 0 6& 194
82018 30 &9 keV 784 796 778 289 &O 10 82017 30 &9 keV 79& 7114 784 283 40 10 82018 30 59 keV. 81& 811 790 284 40 10 82019 30 &9 koV 810 8111 804 293 &O 0 82020 30 &II koV 826 824 808 290 &O 10 48 &2 82021 &O &9 keV 1184 1191 11&& 314 80 10 82022 &O &9 keV 1201 11911 1144 307 70 20 82023 &O &9 koV 1208 1199 1180 310 70 10 82024 &O &9 koV 1241 12&6 1228 328 90 10 82025 &O &II keV 1282 1287 1238 328 90 20 8& 94 82028 80 &9 keV 1888 1888 181& 387 130 20 82027 80 &9 keV 1906 1879 1789 360 110 30 82028 80 59 koV 1984 1973 18&8 364 120 40 ~ 82029 BO &II koV 1988 2007 1948 382 150 20 82030 80 &II koV 2008 2020 1980 371 130 20 137 164
82031 &O Sr-90 293 288 273 239 100 82032 &O Sr-90 294 282 289 239 120 82033 &O Sr-90 294 284 289 239 110 82034 50 Sr-90 287 269 287 238 110 8203& &O Sr-90 290 2611 287 238 120 0 112 82038 240 Sr-90 48& 343 373 241 380 82037 240 Sr-90 47& 331 353 237 430 82038 240 Sr-90 489 329 348 239 420 82039 240 Sr-90 483 341 388 237 380 82040 240 Sr-90 492 346 378 237 440 0 410 82041 760 Sr-90 1020 670 864 241 1710 82042 760 Sr-90 1082 &48 818 244 2380 82043 760 Sr-90 10&1 &47 &93 242 2230 82044 760 Sr-90 1078 694 870 24& 2020 8204& 760 Sr-90 1101 684 874 24& 2370 0 2138 82048 1000 Sr-90 1283 881 826 244 3640 82047 1000 Sr-90 1348 861 748 248 &400 82048 1000 Sr-90 1323 844 72& 244 &ODO 82049 1000 Sr-90 1338 888 792 240 4440 82050 1000 Sr-90 14&1 707 824 240 8670 0 4990
D.6
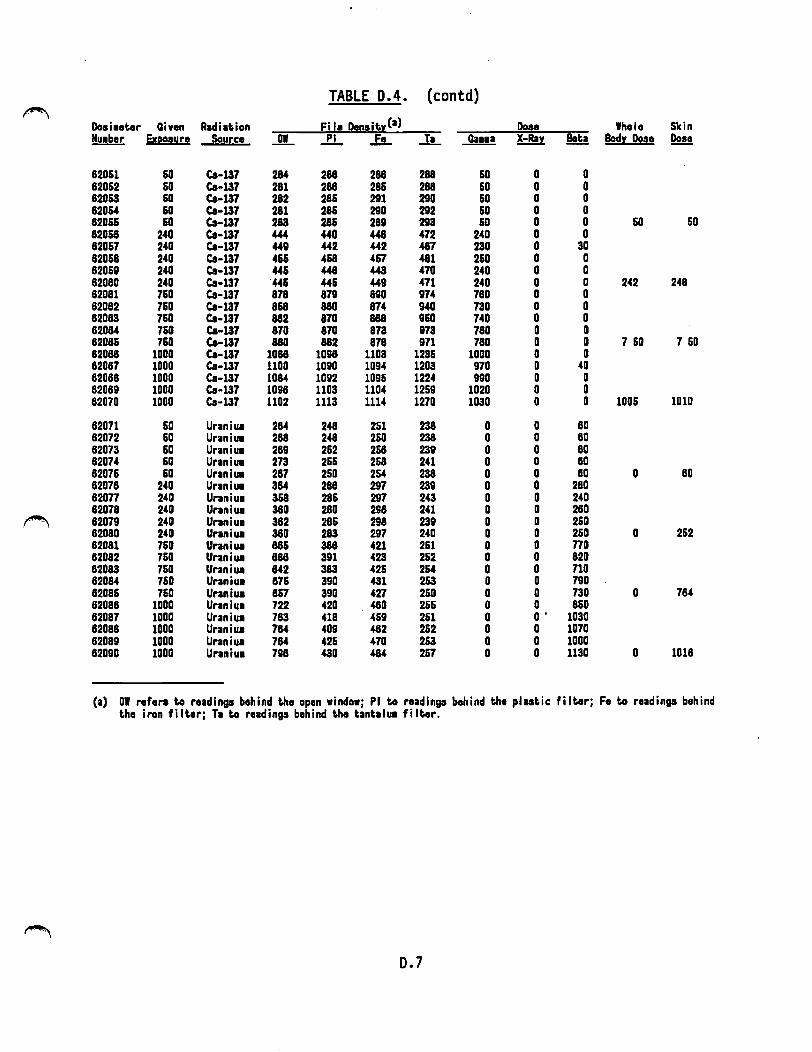
TABLE D.4. (contd) ~
Fi I• DenaitzCa) DoaiHter Given Radiation Dose thole Skin Humber Exeoaure Source J!!... ~ ..£!.... -1!... ClaH X-Raz Beta Bodz Dose ~
82061 &O Ca-137 284 288 288 288 60 0 82062 60 Ca-137 281 288 28& 288 60 0 820&3 60 Ca-137 282 28& 291 290 &O 0 82054 &O Ca-137 281 28& 290 292 &O 0 820&& &O Ca-137 283 28& 289 293 &O 0 50 50 82068 240 Ca-137 444 .wJ 448 472 240 0 82057 240 Ca-137 449 442 442 487 230 30 82068 240 Ca-137 4&& 468 4&7 481 250 0 82069 240 Ca-137 44& 448 443 470 240 0 82080 240 Ca-137 44& 44& 449 471 240 0 242 248 82081 750 Ca-137 878 879 890 974 780 0 82082 750 Ca-137 868 880 874 940 730 0 82083 7&0 Ca-137 882 870 888 950 740 0 82084 7&0 C.-137 870 870 873 973 780 0 8208& 7&0 Ca-137 880 882 878 971 780 0 1 50 1 60 82088 1000 Ca-137 1088 1098 1103 123& 1000 0 82087 1000 Ca-137 1100 1090 1094 1203 970 40 82088 1000 Ca-137 1084 1092 1095 1224 990 0 82089 1000 Ca-137 1098 1103 1104 1269 1020 0 82070 1000 Ca-137 1102 1113 1114 1270 1030 0 1005 1010
82071 50 Uraniua 284 248 251 238 80 82072 60 Uranium 288 248 250 238 80 82073 60 Uranium 289 2&2 258 239 80 82074 60 Uraniua 273 266 268 241 80 82076 60 Uraniua 287 250 264 238 80 0 80 82078 240 Uranium 384 288 297 239 280 82077 240 Uraniua 368 286 297 243 240 82078 240 Ur1ni1111 380 280 298 241 280
~ 82079 240 Uraniua 382 286 298 239 250 82080 240 Urani1111 380 283 297 240 250 0 252 82081 760 Uraniua 886 388 421 261 770 82082 750 Uraniua 888 391 423 252 820 82083 750 Uraniu. 842 383 425 254 710 82084 750 Uraniua 875 390 431 2&3 790 82086 760 Uraniua 8&7 390 427 250 730 0 784 82088 1000 Uraniu• 722 420 480 266 860 82087 1000 Uraniua 783 418 469 251 1030 82088 1000 Uraniu. 784 409 482 252 1070 82089 1000 Uraniu• 784 425 470 253 1000 82090 1000 Uraniu• 798 430 484 257 1130 0 1018
(a) DI refers to readings behind the open window; Pl to readings behind the plastic filter; Fe te readings behind the iron filter; Tate readings behind the tantalua filter.
0.7

TABLE D.6. Prototype Rhodium Film Dosimeter Neutron Response
Dosimeter Given (a) Radiation (b) Film Densit:,:Cc) ~
Number Dose Source Rh+Cd Rh+Sn Sn+SS --00000 0 0 236 235 233 00001 1.07 Cf252U 281 283 280 00002 1.07 Cf252U 281 281 274 00003 1.07 Cf252U 278 276 275 00004 1.07 Cf252U 279 279 277
.. 00005 1.18 CF252M 493 493 388 00006 1.18 Cf252M 506 504 387 00007 1.18 Cf252M 504 501 392 00008 1.18 Cf252M 496 496 388 00013 1.18 Cf252M 518 515 400 00014 1.18 Cf252M 520 513 397
00009 0.051 Sigma 513 453 258 00010 0.051 Sigma 525 460 258 00011 0.050 Sigma 522 464 263 00012 0.050 Sigma 533 463 263
(a) Given dose in rem. (b) Cf252U = a bare Cf252 source exposure;
Cf252M = a Cf252 source moderated with D20 in a cadmium shield; ~ sigma pile = the middle stringes of the sigma pile.
(c) Rh+Cd = combination rhodium and cadmium filter; Rh+Sn = combination rhodium and tin filter; Sn+SS = combination tin and stainless steel filter.
D.8

TABLE D.5. Hanford Nuclear Track Emulsion Neutron Response
Dosimeter Given Ca) Radiation Cb) T/25(c)
Standard Number Dose Source Mean Deviation
00000 0 0 1 58001 1.07 Cf252U 60 58002 1.07 Cf252U 45 58003 1.07 Cf 252U 58 58004 1.07 Cf252U 65 58013 1.07 Cf252U 71 58014 1.07 Cf252U 70 58015 1.07 Cf252U 45 58016 1.07 Cf252U 59 58.375 9.13
58005 1.18 Cf252M 71 58006 1.18 Cf252M 80 58007 1.18 Cf252M 52 58008 1.18 Cf252M 54 58017 1.18 Cf252M 66 58018 1.18 Cf252M 57 58019 1.18 Cf252M 61 58020 1.18 Cf252M 66 63.375 9.35
58009 0.051 Sigma 3 58010 0.051 Sigma 1
,,,-,.., 58011 0.051 Sigma 2 58012 0.051 Sigma 2 58021 0.051 Sigma 1 58022 0.051 Sigma 1 58023 0.051 Sigma 2 58024 0.051 Sigma 3 1.875 0.835
(a) Given dose in rem. (b) Cf252U = a bare Cf252 source exposure;
Cf252M = a Cf252 source moderated with 020 in a cadmium shield; sigma pile = the middle stringes of the sigma pile.
(c) Tracks per 25 fields.
D.9
APPENDIX E
ADDITIONAL LETTERS ON HISTORICAL RADIATION PROTECTION
PRACTICES AT HANFORD
I j j
·~
!
l !
i J I , ;
I I
!
' ; I .,
i i
I ~.
~
r \
I !
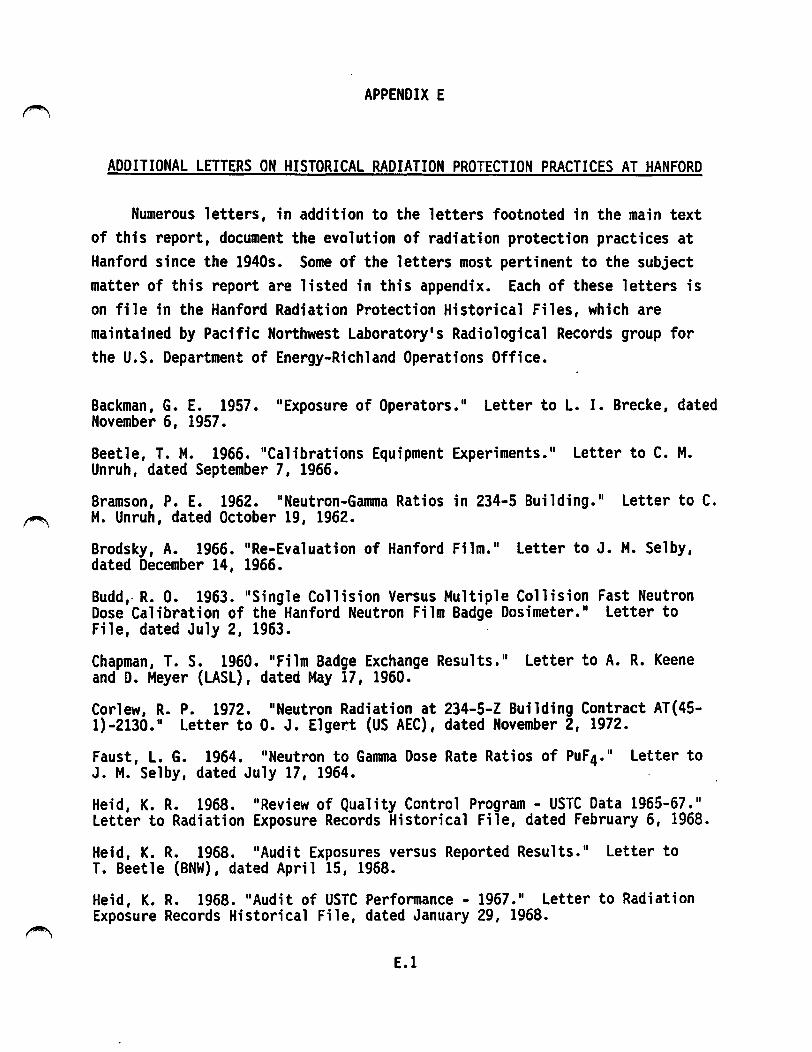
APPENDIX E
ADDITIONAL LETTERS ON HISTORICAL RADIATION PROTECTION PRACTICES AT HANFORD
Numerous letters, in addition to the letters footnoted in the main text of this report, document the evolution of radiation protection practices at Hanford since the 1940s. Some of the letters most pertinent to the subject matter of this report are listed in this appendix. Each of these letters is on file in the Hanford Radiation Protection Historical Files, which are maintained by Pacific Northwest Laboratory's Radiological Records group for the U.S. Department of Energy-Richland Operations Office.
Backman, G. E. 1957. 11 Exposure of Operators. 11 Letter to L. I. Brecke, dated November 6, 1957.
Beetle, T. M. 1966. "Calibrations Equipment Experiments." Letter to C. M. Unruh, dated September 7, 1966.
Bramson, P. E. 1962. 11 Neutron-Ganuna Ratios in 234-5 Building." Letter to C. ~ M. Unruh, dated October 19, 1962.
Brodsky, A. 1966. "Re-Evaluation of Hanford Film. 11 Letter to J. M. Selby, dated December 14, 1966.
Budd,· R. O. 1963. "Single Collision Versus Multiple Collision Fast Neutron Dose Calibration of the Hanford Neutron Film Badge Dosimeter." Letter to File, dated July 2, 1963.
Chapman, T. S. 1960. "Film Badge Exchange Results." Letter to A. R. Keene and D. Meyer {LASL), dated May 17, 1960.
Corlew, R. P. 1972. "Neutron Radiation at 234-5-Z Building Contract AT{45-l)-2130." Letter to O. J. Elgert {US AEC), dated November 2, 1972.
Faust, L. G. 1964. "Neutron to Ganuna Dose Rate Ratios of PuF4. 11 Letter to J. M. Selby, dated July 17, 1964. ·
Heid, K. R. 1968. "Review of Quality Control Program - USTC Data 1965-67. 11
Letter to Radiation Exposure Records Historical File, dated February 6, 1968.
Heid, K. R. 1968. "Audit Exposures versus Reported Results." Letter to T. Beetle (BNW), dated April 15, 1968.
Heid, K. R. 1968. 11 Audit of USTC Performance - 1967. 11 Letter to Radiation Exposure Records Historical File, dated January 29, 1968.
E.1
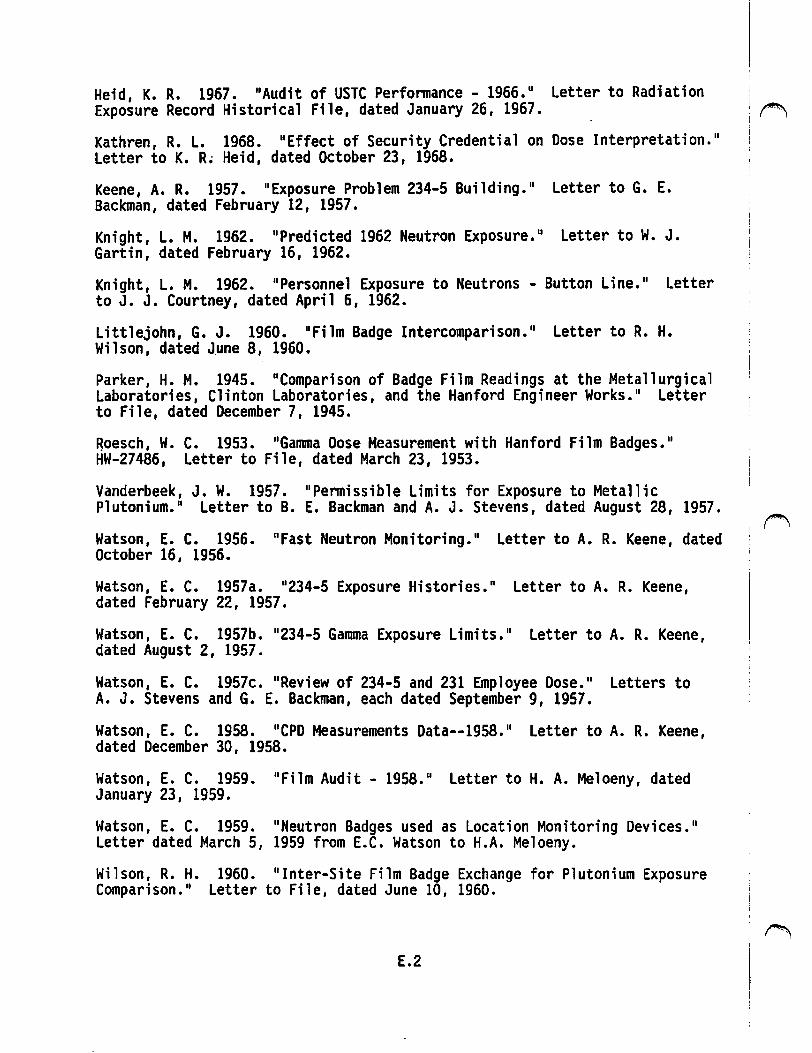
Heid, K. R. 1967. "Audit of USTC Perfonnance - 1966. 11 Letter to Radiation Exposure Record Hhtorkal File, dated January 26, 1967. ', (""'\,
Kathren, R. L. 1968. "Effect of Security Credential on Dose Interpretation. 11
Letter to K. R~ Heid, dated October 23, 1968.
Keene, A. R. 1957. 11 Exposure Problem 234-5 Building." Letter to G. E. Backman, dated February 12, 1957.
Knight, L. M. 1962. 11 Pred kted 1962 Neutron Exposure. 11 Letter to W. J • Gartin, dated February 16, 1962.
Knight, L. M. 1962. "Personnel Exposure to Neutrons - Button Line." Letter to J. J. Courtney, dated April 6, 1962.
Littlejohn, G. J. 1960. "Film Badge Intercomparison. 11 Letter to R. H. Wi 1 son, dated J.une 8, 1960.
Parker, H. M. 1945. "Comparison of Badge Film Readings at the Metallurgical Laboratories, Clinton Laboratories, and the Hanford Engineer Works." Letter to File, dated December 7, 1945.
~oesch, W. C. 1953. 11 Gannna Dose Measurement with Hanford Film Badges. 11
HW-27486, Letter to File, dated March 23, 1953.
Vanderbeek, J. W. 1957. 11 Pennissible Limits for Exposure to Metallic Plutonium. 11 Letter to B. E. Backman and A. J. Stevens, dated August 28, 1957.
Watson, E. C. 1956. "Fast Neutron Monitoring. 11 Letter to A. R. Keene, dated October 16, 1956.
Watson, E. C. 1957a. 11 234-5 Exposure Histories. 11 Letter to A. R. Keene, dated February 22, 1957.
Watson, E. C. 1957b. 11 234-5 Gama Exposure Limits. 11 Letter to A. R. Keene, dated August 2, 1957.
Watson, E. C. 1957c. 11 Review of 234-5 and 231 Employee Dose. 11 Letters to A. J. Stevens and G. E. Backman, each dated September 9, 1957.
Watson, E. C. 1958. 11 CPD Measurements Data--1958. 11 Letter to A. R. Keene, dated December 30, 1958.
Watson, E. C. 1959. "Film Audit - 1958." Letter to H. A. Meloeny, dated January 23, 1959.
Watson, E. C. 1959. "Neutron Badges used as Location Monitoring Devices. 11
Letter dated March 5, 1959 from E.C. Watson to H.A. Meloeny.
Wilson, R.H. 1960. 11 Inter-Site Film Badge Exchange for Plutonium Exposure Comparison." Letter to File, dated June 10, 1960.
E.2
~ I
Wilson, R. H. 1960. "Addendum, Inter-Site Film Badge Exchange for Plutonium ~ Exposure Comparison." Letter to File, dated June 10, 1960.
Wilson, R. H. 1961. "Audit of Film Badge System - 1960. 11 Letter to H. A. Meloeny, dated January 24, 1961.
Wilson, R. H. 1960. "Film Badge Intercomparison. 11 Letter to G. Littlejohn (LASL), dated May 10, 1960.
Wilson, R.H. 1960. "Film Badge Intercomparison. 11 Letter to C. N. Wright (SRP), dated July 20, 1960.
Wright, c. N. (SRP). 1960. "Comparison Tests of SRP and HW Film Badge Response to Low-Energy Radiations." Letter to File, dated April 19, 1960.
E.3
l
~ i
No. of Copies
OFFSITE
12 DOE/Office of Scientific and Technical Infonnation
A. B. Ahmed Oak Ridge National Laboratory P.O. Box 2008 Building 2008, MS 6041 Oak Ridge, TN 37831-6041
R. Bistline Rockwell International Rocky Flats Plant Medical Department (Bldg. 122) P.O. Box 464 Golden, CO 80401
G. Cowper 118 Dynasty Drive Cary, NC 27511
R. Falk Rockwell International Rocky Flats Plant External Dosimetry P.O. Box 464 Golden, CO 80401
S. Fry Director Center of Epidemiological
Research Oak Ridge Associated Uni vers-i ty P.O. Box 117 Oak Ridge, TN 37831-0117
DISTRIBUTION
No. of Copies
R. Goldsmith Office of Health, EH-40 U.S. Department of Energy Washington, DC 20545
P. Groer Center of Epidemiological Research Oak Ridge Associated University P.O. Box 117 Oak Ridge, TN 37831-0117
W. Inkret
PNL-7447 UC-606
Los Alamos National Laboratory MS K483
Distr.1
Los Alamos, NM 87545
A. G. Johnson Oregon State University Director, Radiation Center 35th and Jefferson A-100 Corvallis, OR 97331-5903
L. Kocher 2514 Alexander Court Richland, WA 99352
R. E. Shore Department of Environmental
Medicine New York University Medical Center 314 E. 25th St. New York, NY 10010-2598
No. of Copies
G. Voelz Los Alamos National Laboratory Epidemiology Group HSE-14 MS K404 P.O. Box 1663 Los Alamos, NM 87545
R. Wilson (3) 2430 S. Everett Pl. Kennewick, WA 99336
FOREIGN
E. Cardis Unit of Biostatistics Research
and Informatics International Agency for
Research on Cancer 150, Coeur Albert-Thomas 69372 Lyon Cedex 08 FRANCE
L. Salmon B364 Harwell Laboratory Environmental Studies Group Oxfordshire OXll ORA UNITED KINGDOM
ONSITE
6 DOE Richland Operations Office
E. A. Erichsen (3) D. T. Evans M. W. Tiernan G. R. Yesberger
3 Westinghouse Hanford Company
D. S. Cunningham W. A. Decker P. R. Prevo
No. of Copies
Kaiser
D. J. Foust
3 Hanford Environmental Health Foundation
S. R. Dietert R. L. Kathren G. R. Petersen
43 Pacific Northwest Laboratory
W. J •. Bair
Distr.2
w. v. Baumgartner O. E. Bihl A. W. Endres G. W. R. Endres S. K. Ennor L. G. Faust J. J. Fix (10) O. M. Fleming E. S. Gilbert (7) 0. P. Higby J. R. Houston J. R. Johnson J. A. Mahaffey L. L. Nichols F. E. Owen R. J. Paul J. D. Peters L. A. Rathbun J. M. Selby K. L. Soldat P. S. Stansbury Publishing Coordination Technical Report Files (5)