Embed Size (px)
Citation preview
Copyright 2014 by Collier Research Corp.
Published by Society for the Advancement of Material and Process Engineering with permission
Design and Analysis of Alternative Structural Concepts for the
Orion Heat Shield Carrier Structure
James J. Ainsworth1, Eric A. Gustafson2, Craig S. Collier1 1Collier Research Corp.
760 Pilot House Dr.
Newport News, VA 23606 2Structural Design and Analysis, Inc. (SDA)
46030 Manekin Plaza Ste. 120
Sterling, VA 20166
1. ABSTRACT
During a two year contract, Collier Research Corp. and SDA worked side-by-side with the
NASA Engineering and Safety Center and Lockheed Martin Space Systems to design an
alternate concept for the heat shield carrier structure for the Orion Multi-Purpose Crew Vehicle.
The heat shield carrier structure must hold the 5-meter diameter thermal protection system
securely to the Orion spacecraft. Several structural concepts were investigated, including designs
that incorporated load sharing with the crew module backbone, replacing the existing wagon
wheel stringer design with an H beam configuration, and switching the composite
Carbon/Cyanate Ester skin to Titanium material and orthogrid stiffening concept. Analytical
methods were developed to evaluate the strength and stability of the heat shield carrier structure
for launch and reentry loads, greater than 2923 K (2,650 °C) reentry temperatures, and dynamic
splash down impact events. Transient nonlinear landing simulations were run in LS-DYNA to
capture the load introduction. These simulations introduced the complete vehicle to a water pool
at various speeds and orientations. The dynamic FEA results were imported into HyperSizer and
automated closed-form analysis methods were used for detailed sizing and margin of safety
reports. This paper outlines the design and analysis process and reviews the analytical methods
used to perform the trade studies of the Orion heat shield carrier structure. The analysis methods
have been verified with nonlinear FEA and validated with dynamic impact testing.
2. INTRODUCTION
In 2012, an independent technical assessment team with the NASA Engineering and Safety
Center's (NESC) was tasked with designing an alternative structural concept for the Orion Heat
Shield Carrier (HSC) structure. The team concluded that a titanium orthogrid design for the
carrier structure could reduce the overall system mass by more than 363 kg (800 lb)
(approximately 25%). During the two year contract, Collier Research and SDA developed
analytical methods for the structural analysis of the alternate HSC structure. The primary
objective was to develop an automated sizing process for the HSC structure that included
analytical methods required to assess the strength and stability of a reentry vehicle heat shield
that is subject to harsh reentry and water landing environments.
2.1 Orion Multi-Purpose Crew Vehicle
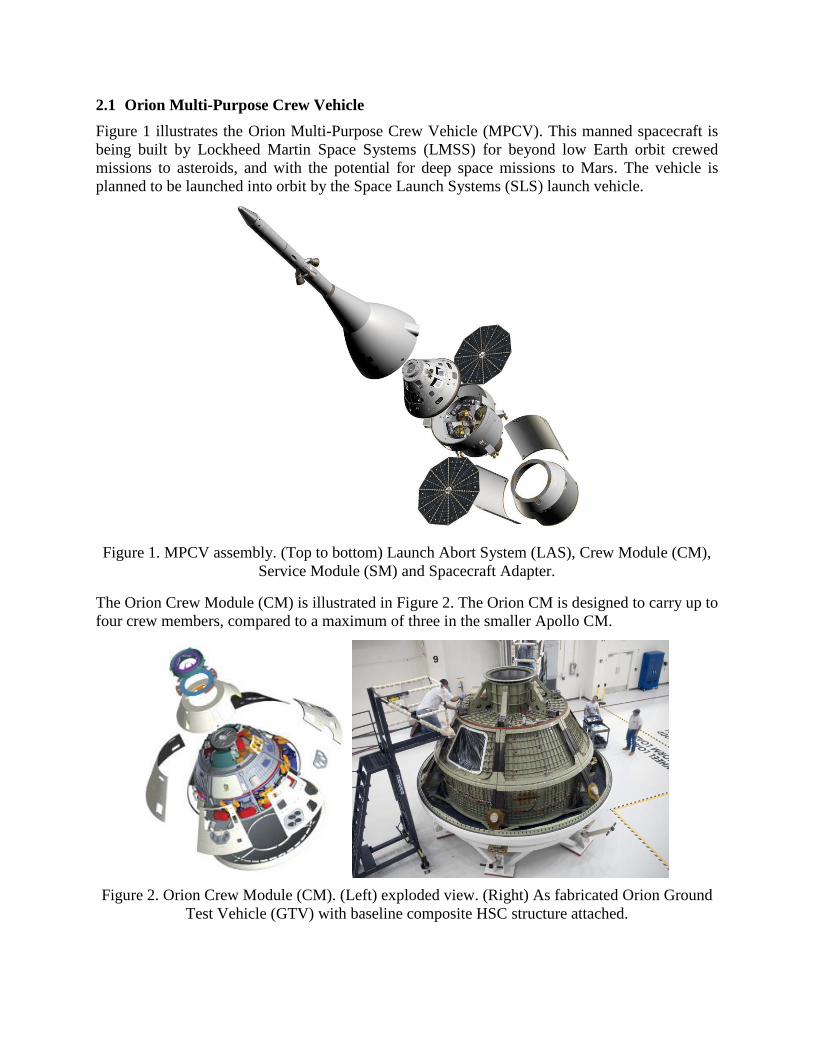
Figure 1 illustrates the Orion Multi-Purpose Crew Vehicle (MPCV). This manned spacecraft is
being built by Lockheed Martin Space Systems (LMSS) for beyond low Earth orbit crewed
missions to asteroids, and with the potential for deep space missions to Mars. The vehicle is
planned to be launched into orbit by the Space Launch Systems (SLS) launch vehicle.
Figure 1. MPCV assembly. (Top to bottom) Launch Abort System (LAS), Crew Module (CM),
Service Module (SM) and Spacecraft Adapter.
The Orion Crew Module (CM) is illustrated in Figure 2. The Orion CM is designed to carry up to
four crew members, compared to a maximum of three in the smaller Apollo CM.
Figure 2. Orion Crew Module (CM). (Left) exploded view. (Right) As fabricated Orion Ground
Test Vehicle (GTV) with baseline composite HSC structure attached.
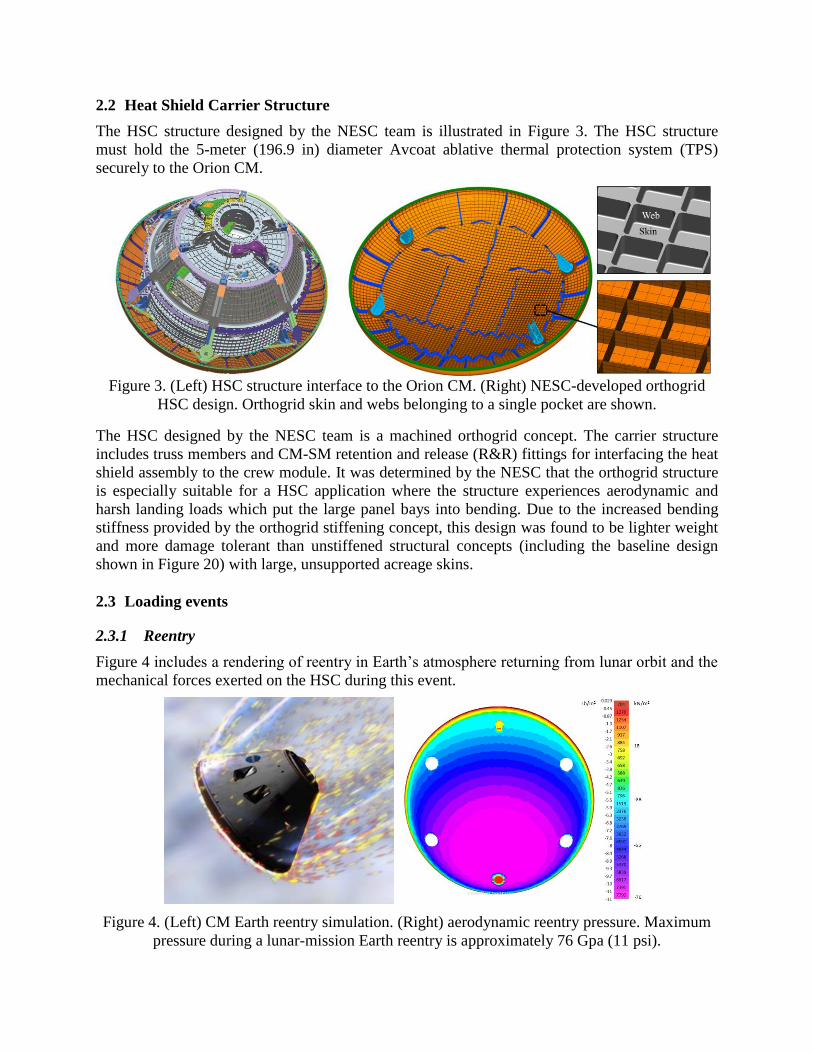
2.2 Heat Shield Carrier Structure
The HSC structure designed by the NESC team is illustrated in Figure 3. The HSC structure
must hold the 5-meter (196.9 in) diameter Avcoat ablative thermal protection system (TPS)
securely to the Orion CM.
Figure 3. (Left) HSC structure interface to the Orion CM. (Right) NESC-developed orthogrid
HSC design. Orthogrid skin and webs belonging to a single pocket are shown.
The HSC designed by the NESC team is a machined orthogrid concept. The carrier structure
includes truss members and CM-SM retention and release (R&R) fittings for interfacing the heat
shield assembly to the crew module. It was determined by the NESC that the orthogrid structure
is especially suitable for a HSC application where the structure experiences aerodynamic and
harsh landing loads which put the large panel bays into bending. Due to the increased bending
stiffness provided by the orthogrid stiffening concept, this design was found to be lighter weight
and more damage tolerant than unstiffened structural concepts (including the baseline design
shown in Figure 20) with large, unsupported acreage skins.
2.3 Loading events
2.3.1 Reentry
Figure 4 includes a rendering of reentry in Earth’s atmosphere returning from lunar orbit and the
mechanical forces exerted on the HSC during this event.
Figure 4. (Left) CM Earth reentry simulation. (Right) aerodynamic reentry pressure. Maximum
pressure during a lunar-mission Earth reentry is approximately 76 Gpa (11 psi).
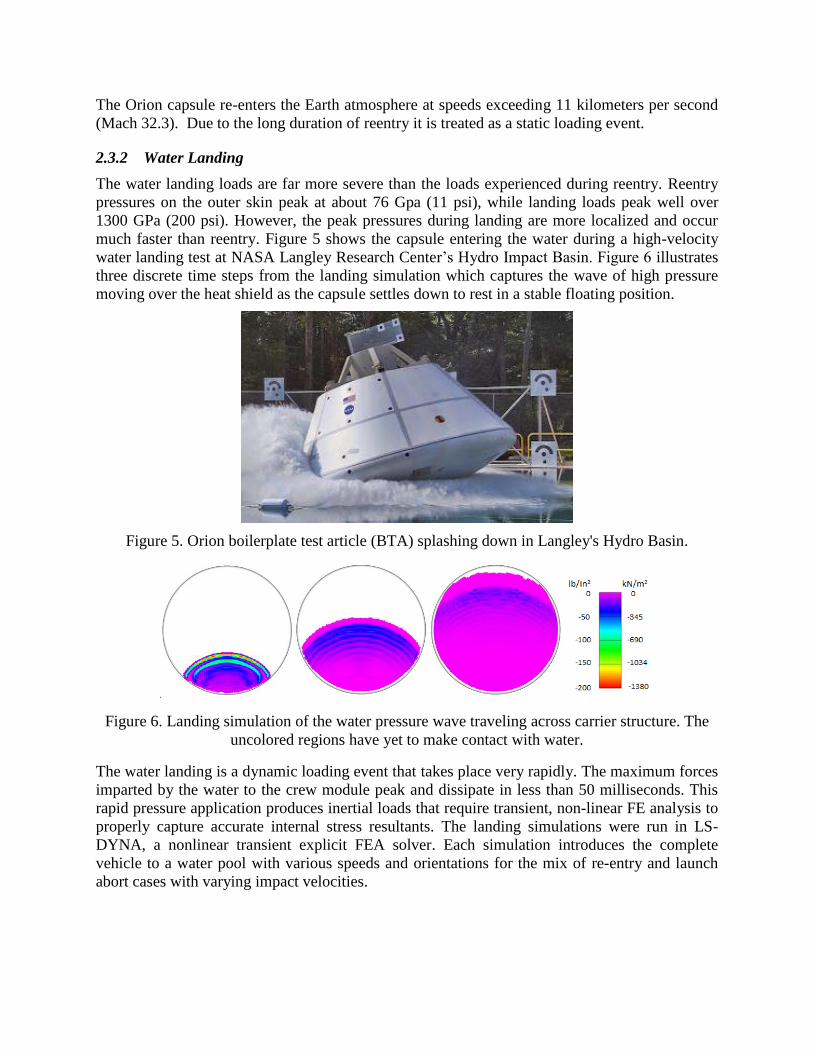
The Orion capsule re-enters the Earth atmosphere at speeds exceeding 11 kilometers per second
(Mach 32.3). Due to the long duration of reentry it is treated as a static loading event.
2.3.2 Water Landing
The water landing loads are far more severe than the loads experienced during reentry. Reentry
pressures on the outer skin peak at about 76 Gpa (11 psi), while landing loads peak well over
1300 GPa (200 psi). However, the peak pressures during landing are more localized and occur
much faster than reentry. Figure 5 shows the capsule entering the water during a high-velocity
water landing test at NASA Langley Research Center’s Hydro Impact Basin. Figure 6 illustrates
three discrete time steps from the landing simulation which captures the wave of high pressure
moving over the heat shield as the capsule settles down to rest in a stable floating position.
Figure 5. Orion boilerplate test article (BTA) splashing down in Langley's Hydro Basin.
Figure 6. Landing simulation of the water pressure wave traveling across carrier structure. The
uncolored regions have yet to make contact with water.
The water landing is a dynamic loading event that takes place very rapidly. The maximum forces
imparted by the water to the crew module peak and dissipate in less than 50 milliseconds. This
rapid pressure application produces inertial loads that require transient, non-linear FE analysis to
properly capture accurate internal stress resultants. The landing simulations were run in LS-
DYNA, a nonlinear transient explicit FEA solver. Each simulation introduces the complete
vehicle to a water pool with various speeds and orientations for the mix of re-entry and launch
abort cases with varying impact velocities.
2.4 Selected Material System
Ti-6Al-4V was selected as the material system for the orthogrid. The temperature knockdowns
and Ramberg-Osgood parameters are referenced in MMPDS-06. The AMS 4920 Ftu/Fty
specification of 896/827 MPa (130/120 ksi) allowables are reduced to appropriate knocked-down
design allowables. Discussions with the forging supplier indicated only the latter strengths could
be guaranteed for the entire forging. One of the factors for the selection of a metallic material is
the non-linear strength and plastic bending capability at ultimate applied load, discussed in
section 4.
3. SIZING
HyperSizer software was used with linear and non-linear FEA solvers (Nastran and LS-DYNA)
as the sizing and optimization software tool for the NESC HSC structure. The HyperSizer sizing
approach is based on detailed and accurate analysis methods that include the complete set of
potential failure modes required for final design and margin of safety reporting. See section 4 for
a listing of failure analysis used to size the titanium heat shield carrier structure. The integrated
FEA-HyperSizer sizing approach was used throughout the life of the program, from preliminary
sizing to detailed sizing and final analysis.
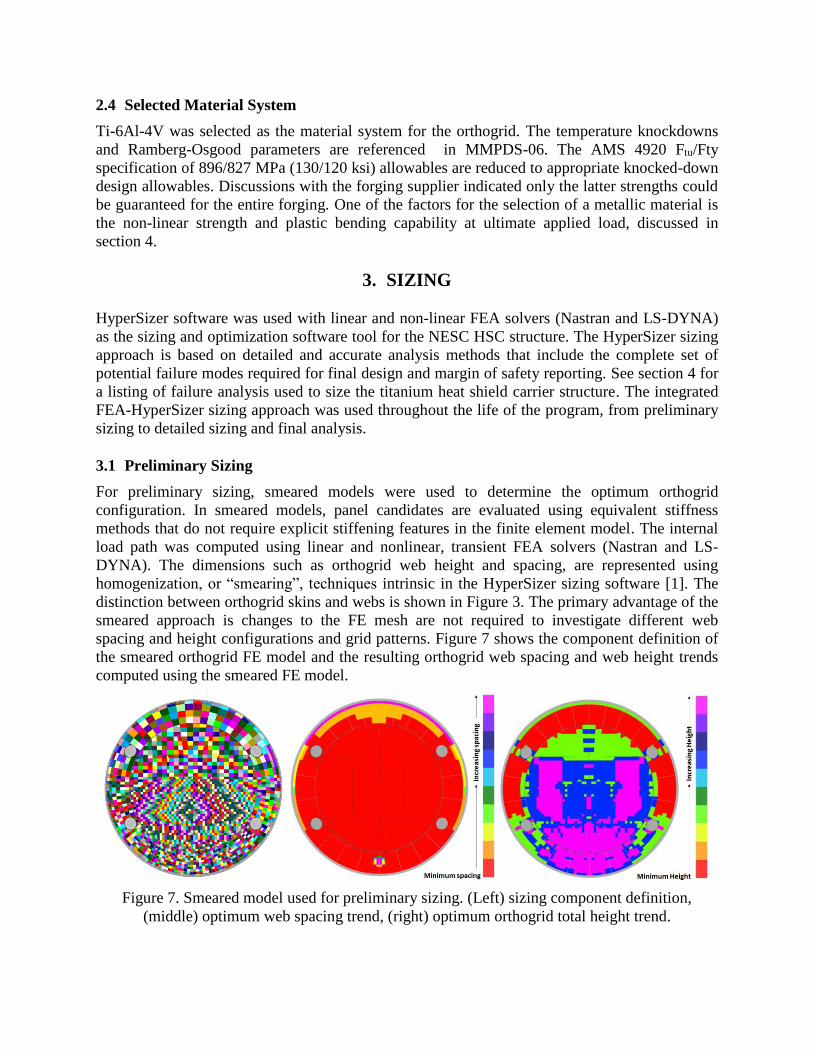
3.1 Preliminary Sizing
For preliminary sizing, smeared models were used to determine the optimum orthogrid
configuration. In smeared models, panel candidates are evaluated using equivalent stiffness
methods that do not require explicit stiffening features in the finite element model. The internal
load path was computed using linear and nonlinear, transient FEA solvers (Nastran and LS-
DYNA). The dimensions such as orthogrid web height and spacing, are represented using
homogenization, or “smearing”, techniques intrinsic in the HyperSizer sizing software [1]. The
distinction between orthogrid skins and webs is shown in Figure 3. The primary advantage of the
smeared approach is changes to the FE mesh are not required to investigate different web
spacing and height configurations and grid patterns. Figure 7 shows the component definition of
the smeared orthogrid FE model and the resulting orthogrid web spacing and web height trends
computed using the smeared FE model.
Figure 7. Smeared model used for preliminary sizing. (Left) sizing component definition,
(middle) optimum web spacing trend, (right) optimum orthogrid total height trend.
The orthogrid web spacing was driven to a minimum allowed spacing everywhere by the snap-
through buckling requirement during reentry (see section 4.1). The total orthogrid height was
driven by global buckling requirements. The minimum spacing and maximum height restrictions
were set based on discussions with the HSC manufacturing team.
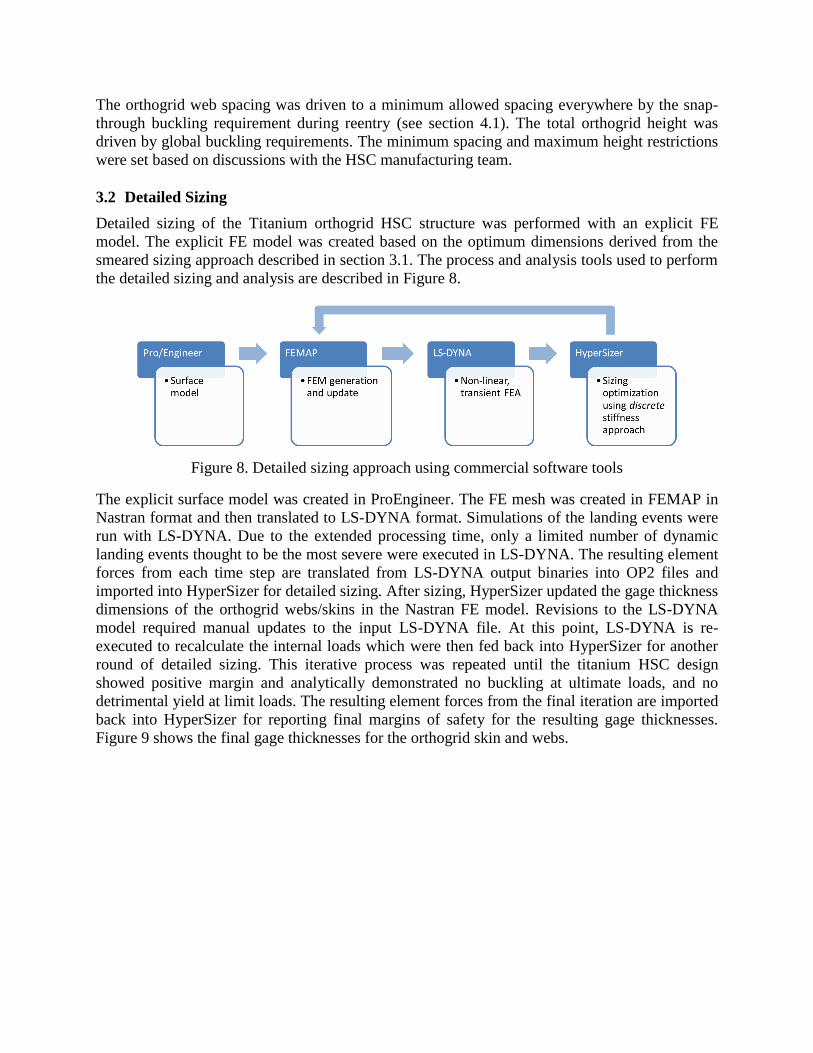
3.2 Detailed Sizing
Detailed sizing of the Titanium orthogrid HSC structure was performed with an explicit FE
model. The explicit FE model was created based on the optimum dimensions derived from the
smeared sizing approach described in section 3.1. The process and analysis tools used to perform
the detailed sizing and analysis are described in Figure 8.
Figure 8. Detailed sizing approach using commercial software tools
The explicit surface model was created in ProEngineer. The FE mesh was created in FEMAP in
Nastran format and then translated to LS-DYNA format. Simulations of the landing events were
run with LS-DYNA. Due to the extended processing time, only a limited number of dynamic
landing events thought to be the most severe were executed in LS-DYNA. The resulting element
forces from each time step are translated from LS-DYNA output binaries into OP2 files and
imported into HyperSizer for detailed sizing. After sizing, HyperSizer updated the gage thickness
dimensions of the orthogrid webs/skins in the Nastran FE model. Revisions to the LS-DYNA
model required manual updates to the input LS-DYNA file. At this point, LS-DYNA is re-
executed to recalculate the internal loads which were then fed back into HyperSizer for another
round of detailed sizing. This iterative process was repeated until the titanium HSC design
showed positive margin and analytically demonstrated no buckling at ultimate loads, and no
detrimental yield at limit loads. The resulting element forces from the final iteration are imported
back into HyperSizer for reporting final margins of safety for the resulting gage thicknesses.
Figure 9 shows the final gage thicknesses for the orthogrid skin and webs.
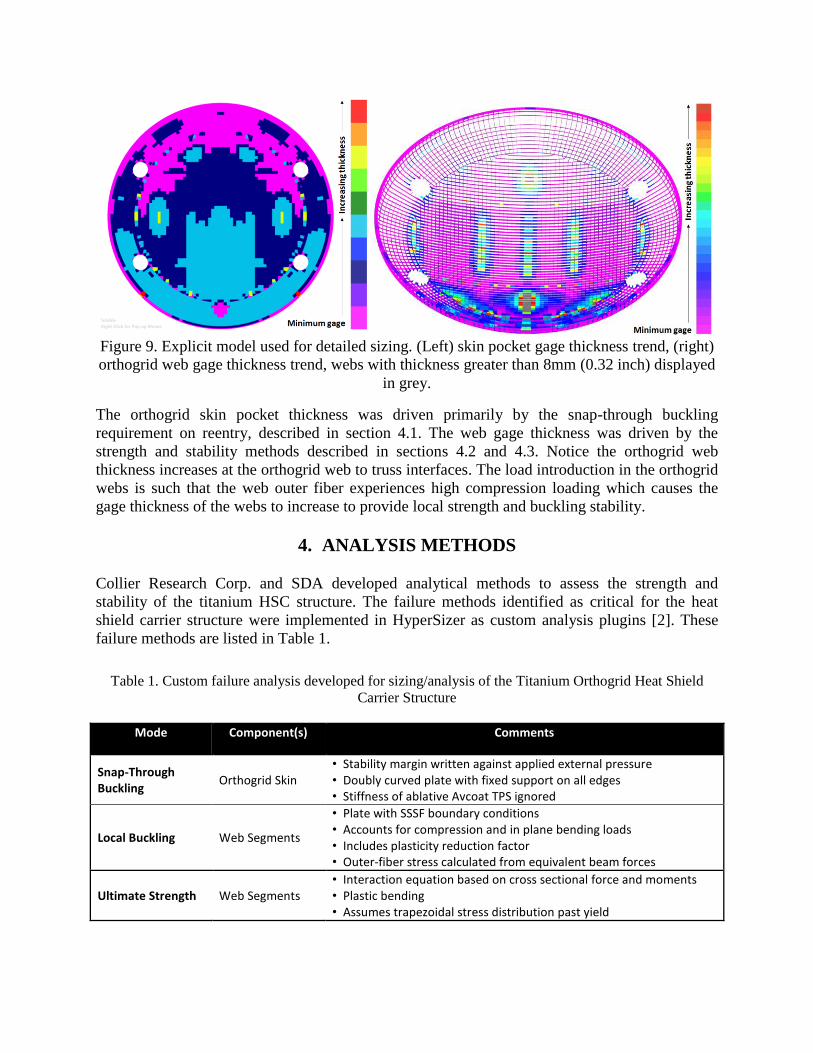
Figure 9. Explicit model used for detailed sizing. (Left) skin pocket gage thickness trend, (right)
orthogrid web gage thickness trend, webs with thickness greater than 8mm (0.32 inch) displayed
in grey.
The orthogrid skin pocket thickness was driven primarily by the snap-through buckling
requirement on reentry, described in section 4.1. The web gage thickness was driven by the
strength and stability methods described in sections 4.2 and 4.3. Notice the orthogrid web
thickness increases at the orthogrid web to truss interfaces. The load introduction in the orthogrid
webs is such that the web outer fiber experiences high compression loading which causes the
gage thickness of the webs to increase to provide local strength and buckling stability.
4. ANALYSIS METHODS
Collier Research Corp. and SDA developed analytical methods to assess the strength and
stability of the titanium HSC structure. The failure methods identified as critical for the heat
shield carrier structure were implemented in HyperSizer as custom analysis plugins [2]. These
failure methods are listed in Table 1.
Table 1. Custom failure analysis developed for sizing/analysis of the Titanium Orthogrid Heat Shield
Carrier Structure
Mode Component(s) Comments
Snap-Through Buckling
Orthogrid Skin • Stability margin written against applied external pressure • Doubly curved plate with fixed support on all edges • Stiffness of ablative Avcoat TPS ignored
Local Buckling Web Segments
• Plate with SSSF boundary conditions • Accounts for compression and in plane bending loads • Includes plasticity reduction factor • Outer-fiber stress calculated from equivalent beam forces
Ultimate Strength Web Segments • Interaction equation based on cross sectional force and moments • Plastic bending • Assumes trapezoidal stress distribution past yield
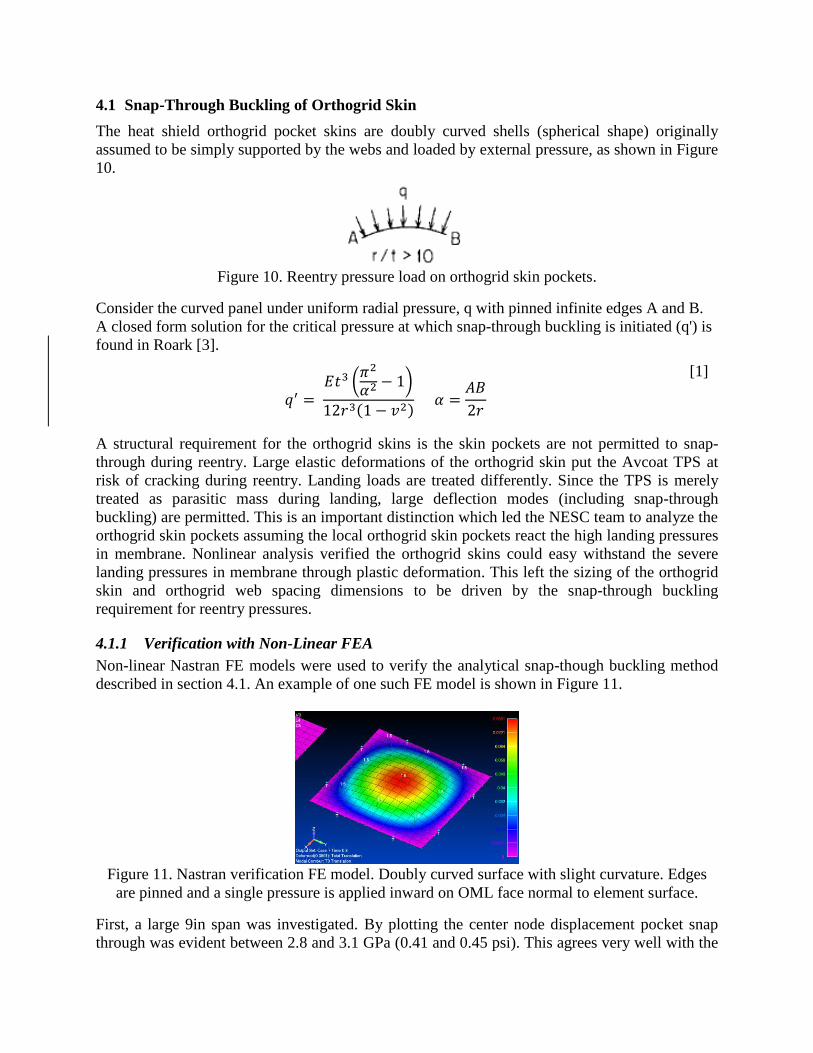
4.1 Snap-Through Buckling of Orthogrid Skin
The heat shield orthogrid pocket skins are doubly curved shells (spherical shape) originally
assumed to be simply supported by the webs and loaded by external pressure, as shown in Figure
10.
Figure 10. Reentry pressure load on orthogrid skin pockets.
Consider the curved panel under uniform radial pressure, q with pinned infinite edges A and B.
A closed form solution for the critical pressure at which snap-through buckling is initiated (q') is
found in Roark [3].
𝑞′ = 𝐸𝑡3 (
𝜋2
𝛼2 − 1)
12𝑟3(1 − 𝑣2) 𝛼 =
𝐴𝐵
2𝑟
[1]
A structural requirement for the orthogrid skins is the skin pockets are not permitted to snap-
through during reentry. Large elastic deformations of the orthogrid skin put the Avcoat TPS at
risk of cracking during reentry. Landing loads are treated differently. Since the TPS is merely
treated as parasitic mass during landing, large deflection modes (including snap-through
buckling) are permitted. This is an important distinction which led the NESC team to analyze the
orthogrid skin pockets assuming the local orthogrid skin pockets react the high landing pressures
in membrane. Nonlinear analysis verified the orthogrid skins could easy withstand the severe
landing pressures in membrane through plastic deformation. This left the sizing of the orthogrid
skin and orthogrid web spacing dimensions to be driven by the snap-through buckling
requirement for reentry pressures.
4.1.1 Verification with Non-Linear FEA
Non-linear Nastran FE models were used to verify the analytical snap-though buckling method
described in section 4.1. An example of one such FE model is shown in Figure 11.
Figure 11. Nastran verification FE model. Doubly curved surface with slight curvature. Edges
are pinned and a single pressure is applied inward on OML face normal to element surface.
First, a large 9in span was investigated. By plotting the center node displacement pocket snap
through was evident between 2.8 and 3.1 GPa (0.41 and 0.45 psi). This agrees very well with the
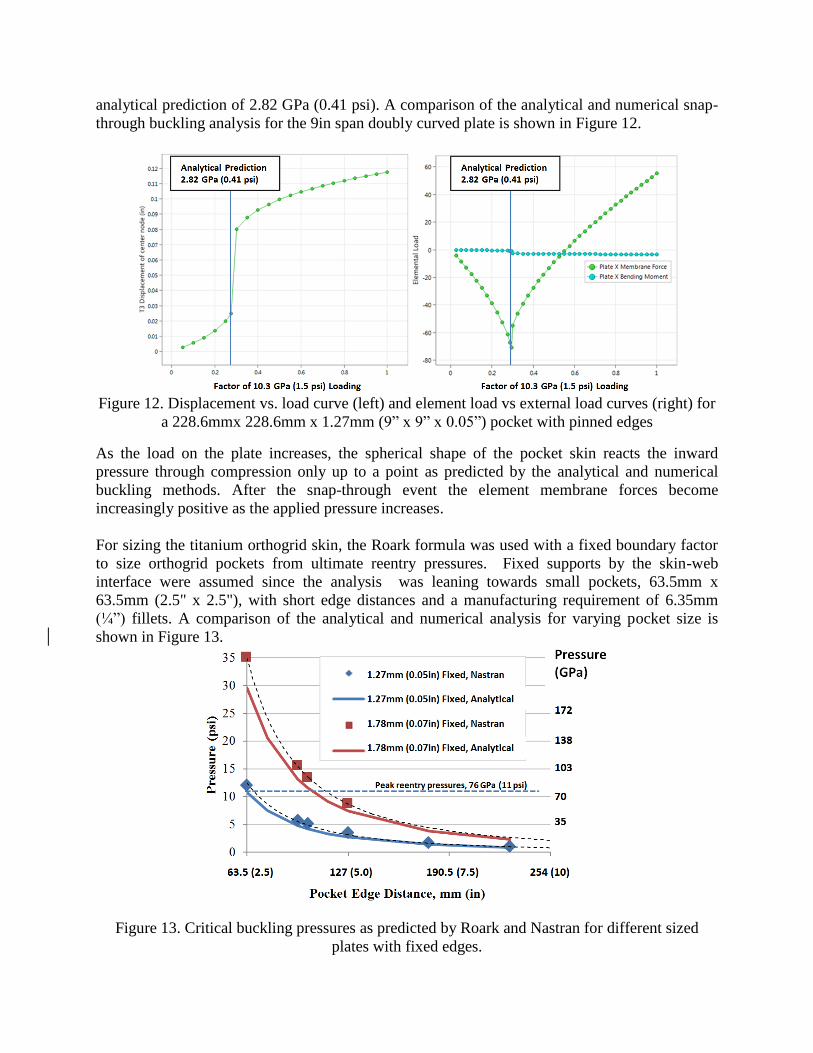
analytical prediction of 2.82 GPa (0.41 psi). A comparison of the analytical and numerical snap-
through buckling analysis for the 9in span doubly curved plate is shown in Figure 12.
Figure 12. Displacement vs. load curve (left) and element load vs external load curves (right) for
a 228.6mmx 228.6mm x 1.27mm (9” x 9” x 0.05”) pocket with pinned edges
As the load on the plate increases, the spherical shape of the pocket skin reacts the inward
pressure through compression only up to a point as predicted by the analytical and numerical
buckling methods. After the snap-through event the element membrane forces become
increasingly positive as the applied pressure increases.
For sizing the titanium orthogrid skin, the Roark formula was used with a fixed boundary factor
to size orthogrid pockets from ultimate reentry pressures. Fixed supports by the skin-web
interface were assumed since the analysis was leaning towards small pockets, 63.5mm x
63.5mm (2.5" x 2.5"), with short edge distances and a manufacturing requirement of 6.35mm
(¼”) fillets. A comparison of the analytical and numerical analysis for varying pocket size is
shown in Figure 13.
Figure 13. Critical buckling pressures as predicted by Roark and Nastran for different sized
plates with fixed edges.
By studying Figure 13, we observe the analytical predictions are conservative when compared to
the numerical analysis.
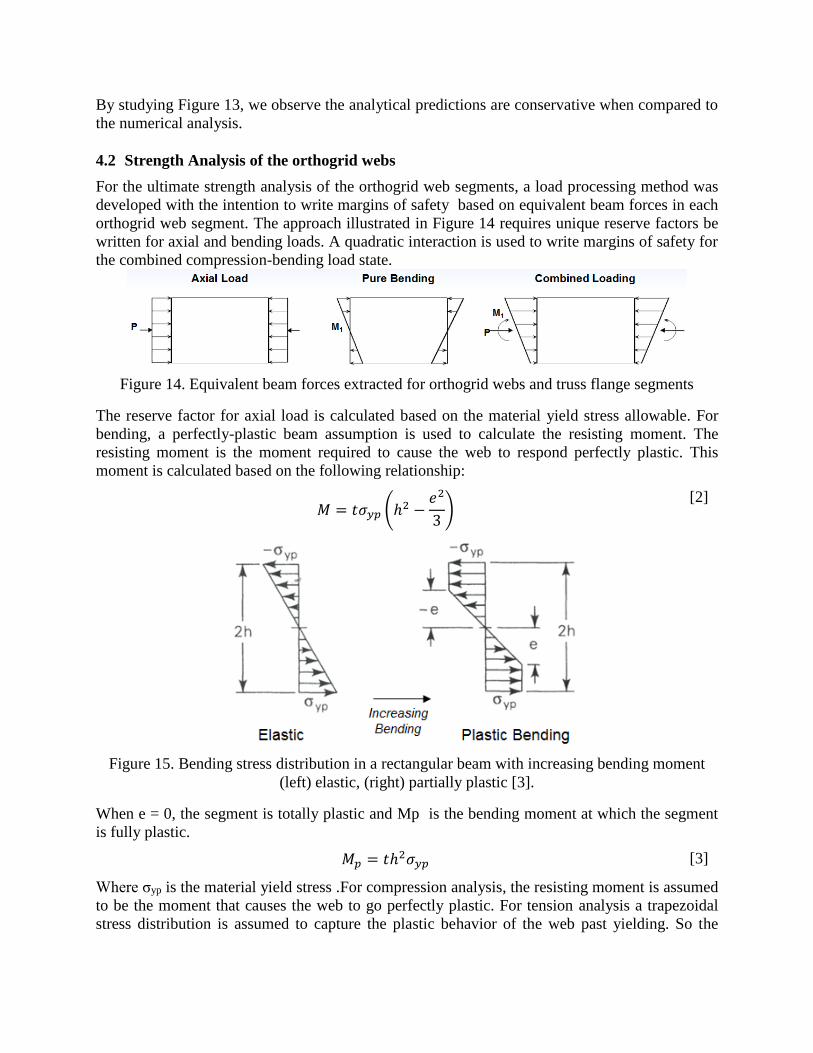
4.2 Strength Analysis of the orthogrid webs
For the ultimate strength analysis of the orthogrid web segments, a load processing method was
developed with the intention to write margins of safety based on equivalent beam forces in each
orthogrid web segment. The approach illustrated in Figure 14 requires unique reserve factors be
written for axial and bending loads. A quadratic interaction is used to write margins of safety for
the combined compression-bending load state.
Figure 14. Equivalent beam forces extracted for orthogrid webs and truss flange segments
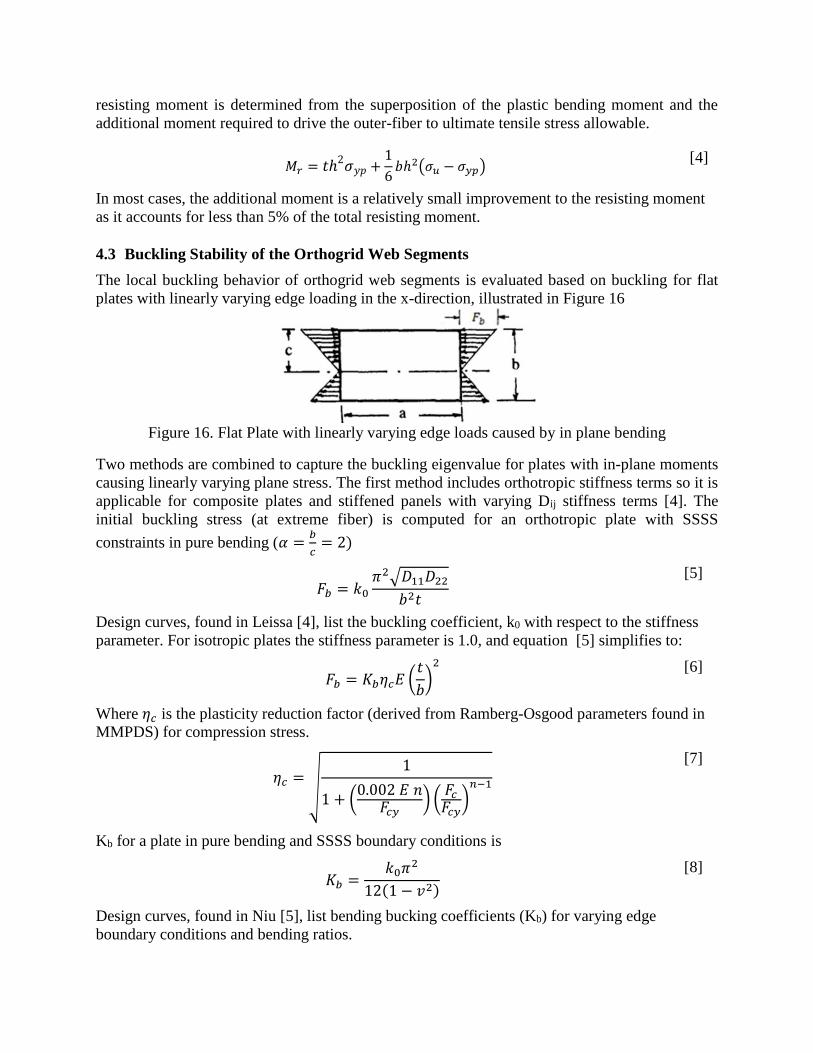
The reserve factor for axial load is calculated based on the material yield stress allowable. For
bending, a perfectly-plastic beam assumption is used to calculate the resisting moment. The
resisting moment is the moment required to cause the web to respond perfectly plastic. This
moment is calculated based on the following relationship:
𝑀 = 𝑡𝜎𝑦𝑝 (ℎ2 −𝑒2
3)
[2]
Figure 15. Bending stress distribution in a rectangular beam with increasing bending moment
(left) elastic, (right) partially plastic [3].
When e = 0, the segment is totally plastic and Mp is the bending moment at which the segment
is fully plastic.
𝑀𝑝 = 𝑡ℎ2𝜎𝑦𝑝 [3]
Where σyp is the material yield stress .For compression analysis, the resisting moment is assumed
to be the moment that causes the web to go perfectly plastic. For tension analysis a trapezoidal
stress distribution is assumed to capture the plastic behavior of the web past yielding. So the
resisting moment is determined from the superposition of the plastic bending moment and the
additional moment required to drive the outer-fiber to ultimate tensile stress allowable.
𝑀𝑟 = 𝑡ℎ2𝜎𝑦𝑝 +1
6𝑏ℎ2(𝜎𝑢 − 𝜎𝑦𝑝)
[4]
In most cases, the additional moment is a relatively small improvement to the resisting moment
as it accounts for less than 5% of the total resisting moment.
4.3 Buckling Stability of the Orthogrid Web Segments
The local buckling behavior of orthogrid web segments is evaluated based on buckling for flat
plates with linearly varying edge loading in the x-direction, illustrated in Figure 16
Figure 16. Flat Plate with linearly varying edge loads caused by in plane bending
Two methods are combined to capture the buckling eigenvalue for plates with in-plane moments
causing linearly varying plane stress. The first method includes orthotropic stiffness terms so it is
applicable for composite plates and stiffened panels with varying Dij stiffness terms [4]. The
initial buckling stress (at extreme fiber) is computed for an orthotropic plate with SSSS
constraints in pure bending (𝛼 =𝑏
𝑐= 2)
𝐹𝑏 = 𝑘0
𝜋2√𝐷11𝐷22
𝑏2𝑡
[5]
Design curves, found in Leissa [4], list the buckling coefficient, k0 with respect to the stiffness
parameter. For isotropic plates the stiffness parameter is 1.0, and equation [5] simplifies to:
𝐹𝑏 = 𝐾𝑏𝜂𝑐𝐸 (𝑡
𝑏)
2
[6]
Where 𝜂𝑐 is the plasticity reduction factor (derived from Ramberg-Osgood parameters found in
MMPDS) for compression stress.
𝜂𝑐 =√
1
1 + (0.002 𝐸 𝑛
𝐹𝑐𝑦) (
𝐹𝑐
𝐹𝑐𝑦)
𝑛−1
[7]
Kb for a plate in pure bending and SSSS boundary conditions is
𝐾𝑏 =𝑘0𝜋2
12(1 − 𝑣2)
[8]
Design curves, found in Niu [5], list bending bucking coefficients (Kb) for varying edge
boundary conditions and bending ratios.
Combining the methods into a single governing equation yields a method that accounts for
varying the orthotropic Dij stiffness, bending ratios and buckling boundary conditions. The
combined equation is written in the form:
𝐹𝑏 = 𝜂𝑐𝑘0
𝜋2√𝐷11𝐷22
𝑏2𝑡 𝐾𝑏(𝑑𝑒𝑠𝑖𝑟𝑒𝑑 𝑏𝑐)
𝐾𝑏 (SSSS) 𝛼 = 2
A more rigorous derivation of the method will be published as part of the NESC heat
shield final report.
[9]
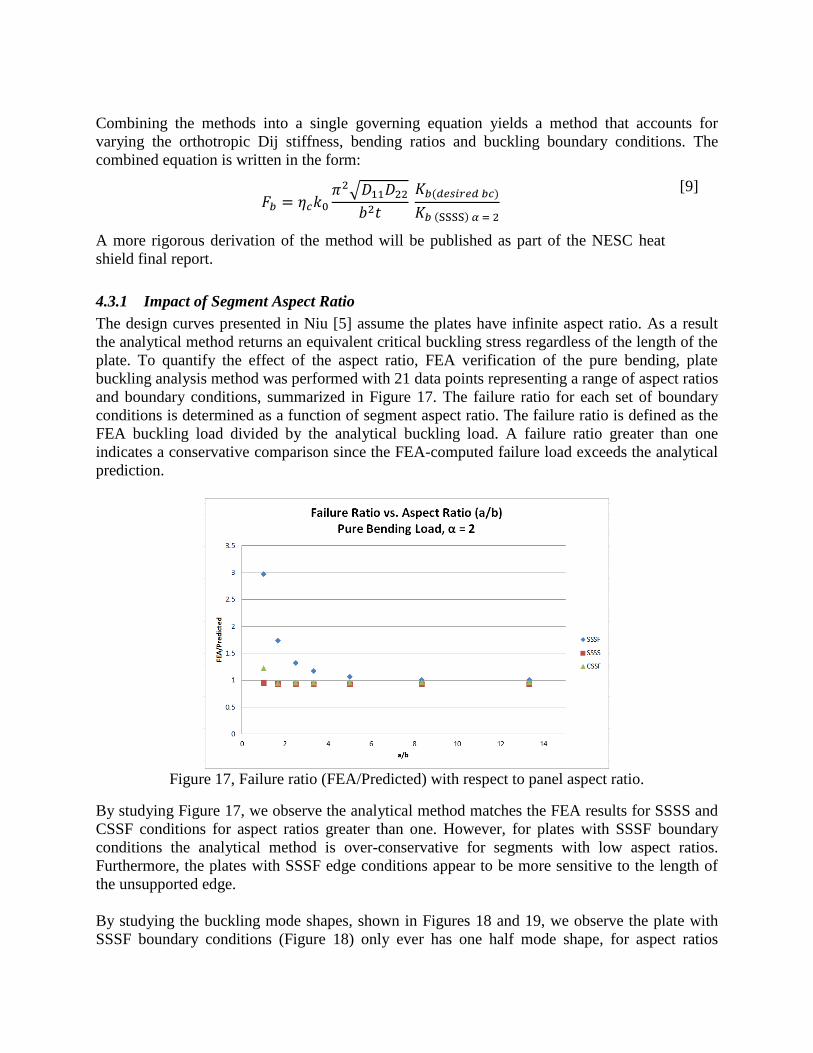
4.3.1 Impact of Segment Aspect Ratio
The design curves presented in Niu [5] assume the plates have infinite aspect ratio. As a result
the analytical method returns an equivalent critical buckling stress regardless of the length of the
plate. To quantify the effect of the aspect ratio, FEA verification of the pure bending, plate
buckling analysis method was performed with 21 data points representing a range of aspect ratios
and boundary conditions, summarized in Figure 17. The failure ratio for each set of boundary
conditions is determined as a function of segment aspect ratio. The failure ratio is defined as the
FEA buckling load divided by the analytical buckling load. A failure ratio greater than one
indicates a conservative comparison since the FEA-computed failure load exceeds the analytical
prediction.
Figure 17, Failure ratio (FEA/Predicted) with respect to panel aspect ratio.
By studying Figure 17, we observe the analytical method matches the FEA results for SSSS and
CSSF conditions for aspect ratios greater than one. However, for plates with SSSF boundary
conditions the analytical method is over-conservative for segments with low aspect ratios.
Furthermore, the plates with SSSF edge conditions appear to be more sensitive to the length of
the unsupported edge.
By studying the buckling mode shapes, shown in Figures 18 and 19, we observe the plate with
SSSF boundary conditions (Figure 18) only ever has one half mode shape, for aspect ratios
ranging between 1.5 and 5. On the other hand, the web segments with CSSF boundary conditions
(Figure 19) switch to multiple half mode shapes as the aspect ratio increases, which makes the
buckling modes less sensitive to increasing aspect ratio.
Figure 18, Buckling mode shapes for segments with in plane bending and SSSF boundary
conditions. (Left) a/b = 1.5, (middle) a/b = 2.5, (right) a/b = 5.
Figure 19, Buckling mode shapes for segments with in plane bending and CSSF boundary
conditions. (Left) a/b = 1.5, (middle) a/b = 2.5, (right) a/b = 5.
In summary, an additional FEA-derived buckling coefficient is required to reduce the
conservatism of the analytical method for plates with SSSF conditions with low aspect ratios.
The critical shear buckling stress is calculated for flat plates with uniform shear loading using
curves from NASA TN D-8257 [6]. The method is valid for varying aspect ratios. Design curves
are required to define the shear buckling coefficients for plates with various boundary conditions
[5]. Interaction equations for combined compression, bending and shear were used.
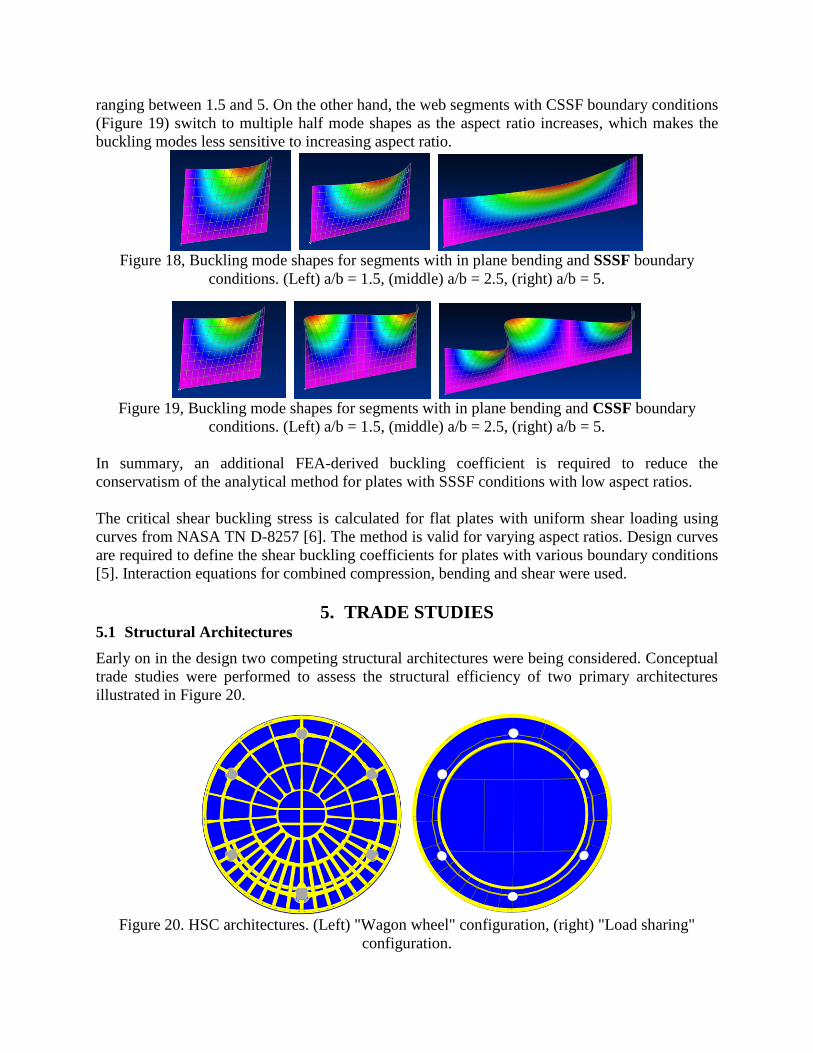
5. TRADE STUDIES 5.1 Structural Architectures
Early on in the design two competing structural architectures were being considered. Conceptual
trade studies were performed to assess the structural efficiency of two primary architectures
illustrated in Figure 20.
Figure 20. HSC architectures. (Left) "Wagon wheel" configuration, (right) "Load sharing"
configuration.
The original design was a skin-stringer design referenced to as the "wagon wheel". Numerous
skin material and structural concepts were evaluated using the wagon wheel architecture, see
Table 2.
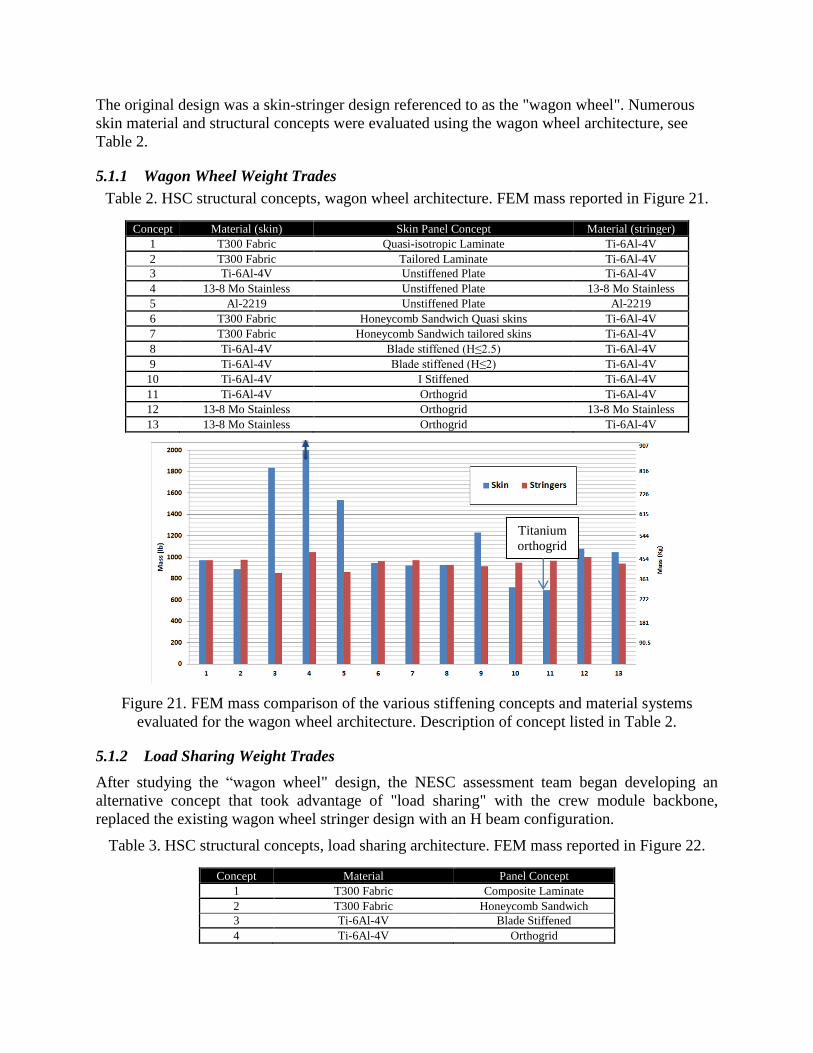
5.1.1 Wagon Wheel Weight Trades
Table 2. HSC structural concepts, wagon wheel architecture. FEM mass reported in Figure 21.
Concept Material (skin) Skin Panel Concept Material (stringer)
1 T300 Fabric Quasi-isotropic Laminate Ti-6Al-4V
2 T300 Fabric Tailored Laminate Ti-6Al-4V
3 Ti-6Al-4V Unstiffened Plate Ti-6Al-4V
4 13-8 Mo Stainless Unstiffened Plate 13-8 Mo Stainless
5 Al-2219 Unstiffened Plate Al-2219
6 T300 Fabric Honeycomb Sandwich Quasi skins Ti-6Al-4V
7 T300 Fabric Honeycomb Sandwich tailored skins Ti-6Al-4V
8 Ti-6Al-4V Blade stiffened (H≤2.5) Ti-6Al-4V
9 Ti-6Al-4V Blade stiffened (H≤2) Ti-6Al-4V
10 Ti-6Al-4V I Stiffened Ti-6Al-4V
11 Ti-6Al-4V Orthogrid Ti-6Al-4V
12 13-8 Mo Stainless Orthogrid 13-8 Mo Stainless
13 13-8 Mo Stainless Orthogrid Ti-6Al-4V
Figure 21. FEM mass comparison of the various stiffening concepts and material systems
evaluated for the wagon wheel architecture. Description of concept listed in Table 2.
5.1.2 Load Sharing Weight Trades
After studying the “wagon wheel" design, the NESC assessment team began developing an
alternative concept that took advantage of "load sharing" with the crew module backbone,
replaced the existing wagon wheel stringer design with an H beam configuration.
Table 3. HSC structural concepts, load sharing architecture. FEM mass reported in Figure 22.
Concept Material Panel Concept
1 T300 Fabric Composite Laminate
2 T300 Fabric Honeycomb Sandwich
3 Ti-6Al-4V Blade Stiffened
4 Ti-6Al-4V Orthogrid
Titanium
orthogrid
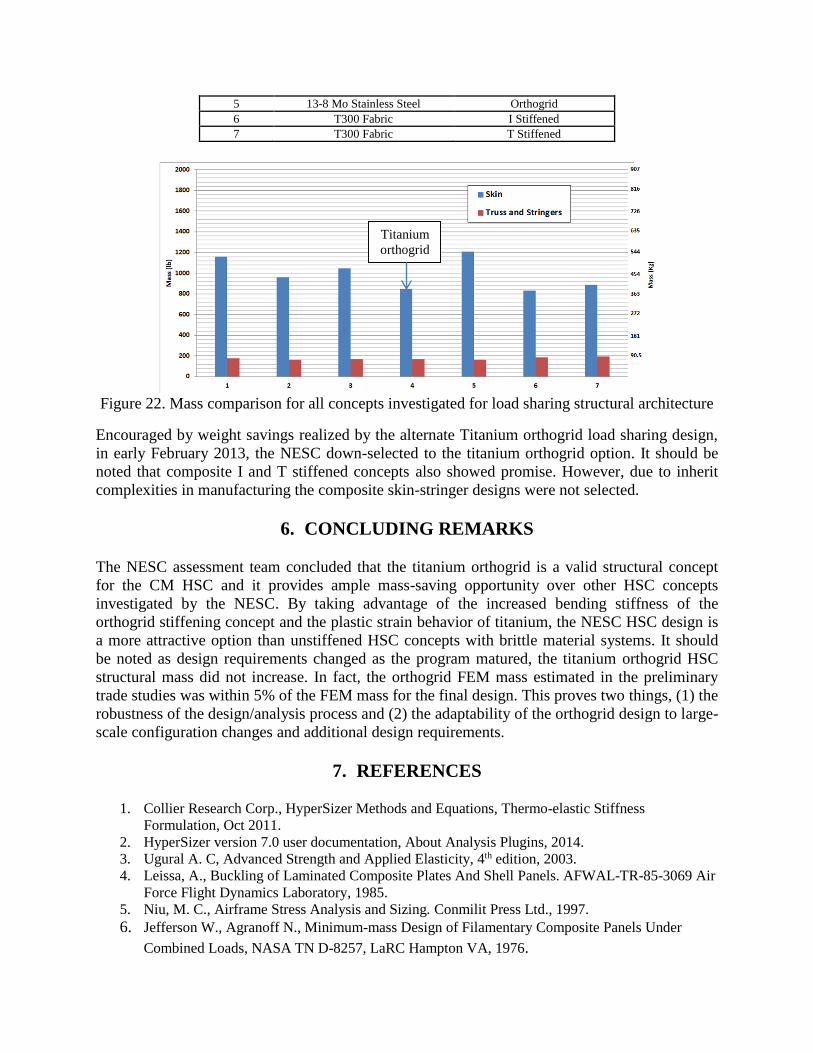
5 13-8 Mo Stainless Steel Orthogrid
6 T300 Fabric I Stiffened
7 T300 Fabric T Stiffened
Figure 22. Mass comparison for all concepts investigated for load sharing structural architecture
Encouraged by weight savings realized by the alternate Titanium orthogrid load sharing design,
in early February 2013, the NESC down-selected to the titanium orthogrid option. It should be
noted that composite I and T stiffened concepts also showed promise. However, due to inherit
complexities in manufacturing the composite skin-stringer designs were not selected.
6. CONCLUDING REMARKS
The NESC assessment team concluded that the titanium orthogrid is a valid structural concept
for the CM HSC and it provides ample mass-saving opportunity over other HSC concepts
investigated by the NESC. By taking advantage of the increased bending stiffness of the
orthogrid stiffening concept and the plastic strain behavior of titanium, the NESC HSC design is
a more attractive option than unstiffened HSC concepts with brittle material systems. It should
be noted as design requirements changed as the program matured, the titanium orthogrid HSC
structural mass did not increase. In fact, the orthogrid FEM mass estimated in the preliminary
trade studies was within 5% of the FEM mass for the final design. This proves two things, (1) the
robustness of the design/analysis process and (2) the adaptability of the orthogrid design to large-
scale configuration changes and additional design requirements.
7. REFERENCES
1. Collier Research Corp., HyperSizer Methods and Equations, Thermo-elastic Stiffness
Formulation, Oct 2011.
2. HyperSizer version 7.0 user documentation, About Analysis Plugins, 2014.
3. Ugural A. C, Advanced Strength and Applied Elasticity, 4th edition, 2003.
4. Leissa, A., Buckling of Laminated Composite Plates And Shell Panels. AFWAL-TR-85-3069 Air
Force Flight Dynamics Laboratory, 1985.
5. Niu, M. C., Airframe Stress Analysis and Sizing. Conmilit Press Ltd., 1997.
6. Jefferson W., Agranoff N., Minimum-mass Design of Filamentary Composite Panels Under
Combined Loads, NASA TN D-8257, LaRC Hampton VA, 1976.
Titanium
orthogrid