Embed Size (px)
Citation preview
ISSN 2393 9079(Print) e-ISSN 2393 9087(Online)
Research Communication
Design and Optimization of Aceclofenac Sustained Release Matrix Tablets Using 32 Factorial Design
Raavi Kishna Swetha*, K. S. G. Arul Kumaran, Jenila B,
Ganesh P C, Sravan Kumar Y * Department of Pharmaceutics, KMCH College of Pharmacy,
Coimbatore, Tamilnadu, India. E-mail: [email protected]
Abstract: Design, development and optimization of Aceclofenac SR matrix tablets by direct compression
technique. It is composed of two different ratios of waxes. The optimization was carried out by using 32 factorial designs with Design Expert Software. IR studies reveled that drug and the waxes are compatible with each other. The tablets were subjected for various evaluations like pre and post compression parameters. All the parameters are within the limits. The release profile showed that as the concentration of bees wax increases the drug release decreases and it was not steady after definite concentration of bees wax. This may due to poor binding between the drug and waxes. The formulation (F7) with the ratios of 0.31:0.15 bees and lanette waxes respectively Show best sustained release and flow property. The dissolution profile showed 58.74% at 8th hr. It was observed that the bees and lanette waxes fulfilled the conditions for an optimum formulation for sustain release. Keywords: Aceclofenac, matrix tablet, bees wax, lanette wax, design expert software, optimization
Introduction
For many decades treatment of acute diseases or chronic illnesses have been mostly
accomplished by delivery of drugs to patients using various pharmaceutical dosage forms
including tablets, capsules, suppositories, creams, ointments, aerosols and injectable. Even
today these conventional dosage forms are the primary pharmaceutical vehicles commonly seen in the prescription and over the counter drug market. The oral conventional types of drug
delivery systems provide a timely release of drug. Therefore, to maintain the drug
concentration in the therapeutically effective range, it is necessary to take several times a day.
This result in a significant fluctuation in drug levels often with sub therapeutic and/or toxic
levels and wastage of drug (1-4). Recently several technical advancements have resulted in the
development of new systems for controlling the rate of drug delivery, sustaining the extent of
therapeutic activity the delivery of drug to the tissue.
The term “controlled release” implies a system that provides continuous delivery of the drug for a predetermined period with predictable and reproducible kinetics and known
mechanism of release. This means that the release of active ingredients from a drug inhibited
release drug delivery system takings at a rate that is not only expected kinetically, but also
reproducible from one unit to other. On the other hand the “sustained release” is usually used
to explain a pharmaceutical dosage form prepared such that the liberation of the drug in the systemic circulation is prolonged over time resulting in plasma profile, which is sustained in
duration (5-9).
The aim of most of the original controlled release systems was to attain a delivery profile
that would produce a high blood level of the drug over an extended period of time in which the
level raises after each administration of drug and then reduces until the next management. The
key point with traditional drug administration is that the blood level of the agent should stay
behind between a highest value, which may represent a lethal level, and a minimum value,
lower than which the drug is no longer effective. In controlled drug delivery system designed for long term application, the drug level in the blood follows the profile as exposed in fig, lasting
constant, between the required maximum and minimum, for prolonged period of time.
Raavi Kishna Swetha et al. Design and Optimization of Aceclofenac.... 19
Indian Journal of Pharmacy and Pharmacology Vol.1, No.1, September 2014
Drugs can be administered through different routes; however of all the routes of
administration, oral rote of administration is most convenient for administering drugs for
systemic effect because of ease of administration by manufacturing and dosage adjustments. Oral route of drug administration has wide acceptable and of the drugs administered orally in
solid dosage forms represents the preferred class of product6. Solid dosage form of tablets and
capsules are more commonly employed, the tablets have advantages than capsules in that they
are tamper resistant and any adulterant of the tablet after its manufacture is almost certain to
be observed.
Ideal candidate for sustained release or controlled release drug delivery system:
The desired biopharmaceutical characteristics of drug to be used in the development of per
oral controlled release dosage forms are:
1. Molecular weight: <1000 daltons
2. Solubility: 0.1mcg/ml
3. Pka: >0.1% to 1% at pH 1 to 7.8 4. Apparent partition coefficient: o.5 to 2.0
5. General absorbability: from all GI segments
6. Stability: stable in GI environment. Released should not be influenced by Ph and enzyme.
7. Less protein binding: To evaluate whether a drug is viable candidate or not for the design
of per oral controlled release formulation, one must consider the following pharmacokinetic
parameters of the drug. 8. Elimination half-life: Preferably between 0.5 and 8 hrs.
9. Total body clearance: Should not be dose dependent.
10. Elimination rate constant : required for the design
11. Absolute bioavailability: should be 75% or more
12. Absorption rate: must be greater than release rate 13. Therapeutic concentration: the lower css and the smaller vd the lesser is the amount
required.
14. Apparent volume of distribution (Vd): the larger the vd MEC the larger will be the dose size
required. The maximum dose to be incorporated in to a per oral control release formulations
is about 500mg. The smaller the vd, the easier is incorporation of drug into dosage form.
15. Minimum toxic concentration (MTC): MTC and MEC, the further apart this values are, the safer the dosage and also suitable for drugs with very short half-life.
Optimization Techniques
It is defined as follows: choosing the best element from some set of available
alternatives.
In pharmacy the word “optimization” is found in the literature referring to any study of
formula.
In development projects pharmacist generally experiments by a series of logical steps, carefully controlling the variables and changing one at a time until satisfactory results are
obtained. This is how the optimization done in the pharmaceutical industry.
Optimization is an act, process, or methodology of making design, system or desition as fully perfect, functional or as effective as possible.
Optimization of a product or process is the determination of the experimental conditions
resulting in its optimal performance.
Experimental Design
A full factorial 32 designs were used for optimization procedure. It is suitable for investigating the quadratic response surfaces and for constructing a second order polynomial
Raavi Kishna Swetha et al. Design and Optimization of Aceclofenac.... 20
Indian Journal of Pharmacy and Pharmacology Vol.1, No.1, September 2014
model, thus enabling optimization of the time-lagged coating process. Mathematical modeling,
evaluation of the ability to fit to the model, and response surface modeling were performed with
employing Design-Expert. A 32 randomized reduced factorial design was used in this study and 2 factors were evaluated, each at 3 levels; experimental trials were performed at all 9 possible
combinations prepared. The percentage of Bees wax (X1) and Lanette wax (X2) were selected as
independent variables. Drug released, and Hardness was selected as dependent variables. The
batches thus prepared by factorial design are evaluated and the effect of individual variable is
studied according to the response surface methodology.
𝑌 = 𝑏0+ 𝑃1𝑋1+ 𝑃2𝑋2+ 𝑃12𝑋1𝑋2+ 𝑃11𝑋21+ 𝑃22𝑋22
where 𝑌 is the dependent variable, 𝑏 0 is the arithmetic mean response of the 9 runs,
and bi (𝑃1, 𝑃2, 𝑃12, 𝑃11, and 𝑃22) is the estimated coefficient for the corresponding factor Xi
(𝑋1,𝑋2,X1X2, 𝑋12, and 𝑋22), which represents the average result of changing 1 factor at a time
from its low to high value. The interaction term (X1X2) shows how the response changes when 2
factors are simultaneously changed. The polynomial terms (𝑋21 and 𝑋22) are included to investigate nonlinearity.
Methodology
Determination of λmax of Aceclofenac
Absorption spectra of Aceclofenac
a) A solution of 1µg/ml Aceclofenac prepared by dissolving 100mg of a drug in 5 ml of
methonal and make up to 100 ml with phosphate buffer pH 6.8 in a volumetric flask.
b) Then the solution was diluted and the λmax of solution found in the range from 200-400 nm.
c) The absorbtion maxium was found to be 274nm.
Determination of Standard curve of Aceclofenac
a) Weigh accurately 1mg of Aceclofenac and dissolve in 5 ml of methonal and made up to
100 ml with phosphate buffer pH 6.8 in a standard flask to get 10µg/ml solution.
b) Then the solution was serially diluted to get 5, 10, 15, 20, 25 and 30 µg/ml stock solution and the λmax of the stock was found out.
c) The absorbance of the diluted solutions was measured in a UV spectrophotometer at
274nm.
d) A calibration curve was plotted by taking concentration of the solution in µg on X-axis
and absorbance on Y-axis and correlation co-efficient “r” was calculated.
Preparation of Sustained Release Matrix Tablet
The ingredients (listed in table no.5) were accurately weighed and sifted through sieve
#60, magnesium stearate and talc sifted through sieve #80. Then the materials blended except
magnesium stearate and talc for 20 minutes in ascending order. Then the powder mixture
blended with magnesium stearate and talc for 5 minutes.
Evaluation of Powder Blend
Bulk Density
The powder blend under test was screened through sieve no 18. And 10g was \accurately
weighed and filled in a 25ml graduated cylinder and the powder was levelled and the unsettled
volume, V0 was noted.
Raavi Kishna Swetha et al. Design and Optimization of Aceclofenac.... 21
Indian Journal of Pharmacy and Pharmacology Vol.1, No.1, September 2014
Bulk density (δ0) = M/ V0
M = Mass of powder taken
V0 = Apparent unstrried volume
Tapped Density
The powder blend under test was screened through sieve no.18 and the weight of sample equivalent to 10g was filled in 25ml graduated cylinder. The mechanical tapping of the
cylinder was carried out using tapped density tester at a nominal rate of 300 drops per minute
for 500 times initially and the tapped volume V0 was noted. Tapping was preceded further for
an additional tapping 750 times and tapped volume, Vb was noted. The tapping was continued
until difference between two successive tapped volumes was less than 2%. The tapped density
was calculated in g/cm3 by the formula.
Tapped Density (δt) = M/Vf
M = Weight of sample powder
Vf = Tapped volume
Carr’s index
The carr’s index of the powder was determined by using:
Carr’s index (%) = [(TBD - LBD) × 100]/TBD
LBD = Loose bulk density
TBD = Tapped bulk density
Hausner ratio
Hausner ratio is calculated from the formula:
Hausner ratio= (δt/ δ0)
δt = Tapped density
δ0 = Bulk density
Angle of repose
It is determined by the funnel method. 10g of the powder was accurately weighed and taken
in a funnel and closed at the bottom with a cotton plug. Height of the funnel was adjusted such that the tip of the funnel touches the heap of the powder. The powder was allowed to flow
through tunnel freely onto the surface. The diameter of the powder cone was measured and
angle of repose was calculated using the following equation.
Tan θ = h/r
Therefore,
θ = tan -1 h/r
θ = angle of repose
h = height of the cone
Raavi Kishna Swetha et al. Design and Optimization of Aceclofenac.... 22
Indian Journal of Pharmacy and Pharmacology Vol.1, No.1, September 2014
r = radius of the cone base
Evaluation of Tablets
Weight variation
Weight variation test for the tablets was performed as per the IP procedure. Ten tablets
were weighed individually and the average weight was determined. The individual weights of all
the ten tablets were noted. The percentage deviation of the individual weights from the average
weight was then calculated. Deviation was not exceeding the values given in the table:
Tablet thickness: The thicknesses of the tablets were determined by using vernier calipers,
and the results are expressed as mean values of 10 determinations.
Tablet hardness: Tablet hardness has been defined as the force required for breaking a tablet in a diametric compression test. A tablet was placed between two anvils of the hardness tester,
force was applied to the anvils, and the crushing strength that caused the tablet to break was
recorded.
Drug content
Ten tablets were randomly sampled from each formulation batch, finely powdered and
individually estimated for the drug content after suitable dilution, using UV-VIS
spectrophotometer (UV-1601, Shimadzu) at 313.5 nm.
Friability test
The friability of the tablets was measured in a friability apparatus (Camp-bell
Electronics, Mumbai). Ten tablets were initially weighed (wintial) and placed in the friabilator.
The friabilator was operated at 25rpm for 4 minutes and then the tablets were dedusted and
weighed final (wfinal). Percentage friability was calculated from the loss in weight as given in
equation as below. The weight loss should not be more than 1%. Determintion was made in
triplicate.
% 𝑓𝑟𝑖𝑎𝑏𝑖𝑙𝑖𝑡𝑦 =Wintial − Wfinal
Winitial× 100
Disintegration test
Disintegration test was done by using disintegration appratus (camp-bell
electronics, Mumbai). Place one tablet in each of the 6 tubes of the basket Disintegration
apparatus was used without disc. The apparatus using distilled water was maintained at
37±2ºC. The assembley should be raised and lowered between 28-32 cycles per minute in the solution maintained at 37±2ºC. The time taken for complete disintegration tablet with no
palpable mass remaining in the apparatus was measured and recorded.
invitro drug release studies
The in vitro release of the drug of all formulations were performed using USP apparatus
Type I (Basket) Electro lab, India. The dissolution medium consisted of 900 ml of phosphate
buffer pH 6.8. Dissolution was performed at 37±0.5°C, with stirring speed of 100 rpm. 5 ml of solution was withdrawn at time intervals of 5min,15min,30min,1,2,3,4,5,6,7,8 Hrs. The
medium was replaced with same amount of fresh dissolution media each time. The then
solutions were make upto 10 ml with the dissolution media. The samples were analyzed by UV-
VIS spectrophotometer (UV-1700, Pharmaspec, Shimadzu Ltd, Japan) at 274nm and
absorbance were recorded.
Raavi Kishna Swetha et al. Design and Optimization of Aceclofenac.... 23
Indian Journal of Pharmacy and Pharmacology Vol.1, No.1, September 2014
Stability Studies
Stability testing of tablets were carried at accelerated conditions at extreme temperature
of 400C RH of 70 %±5%C.The sample were withdrawn at 30th and 45th days and evaluated for
physical appearance, drug content ,hardness and dissolution studies the data was given the
table .The results obtained at those temperatures has no effect on hardness, physical
appearance, dissolution time.
Results and Discussion
Drug-Polymer Interaction/Compatibility Study Using FTIR
The IR spectra of drug and the excipients are shown in the figure from the ir spectra it
was observed that there was no major changes in the peak positions of drug and mixture drug with recipients, it showed that there was no interactions between drug and excipients
Spectrophotometric characterization
Determination of λmax of Aceclofenac
A solution of 1µg/ml Aceclofenac prepared by dissolving 100mg of a drug in 5 ml of
methonal and make up to 100 ml with phosphate buffer pH 6.8 in a volumetric flask. Then the
solution was diluted and the λmax of solution found in the range from 200-400 nm. The
absorbtion maxium was found to be 274nm.
Standard calibration curves of Aceclofenac
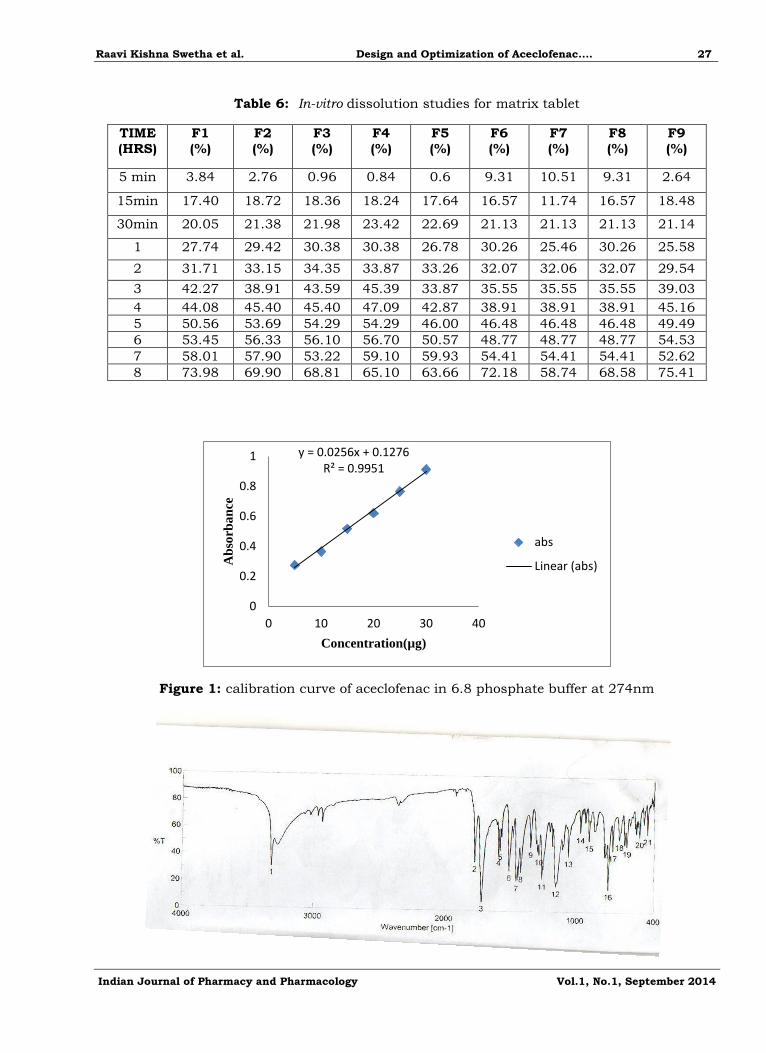
Calibration curve of aceclofenac sodium was constructed in 5% of methanol and phosphate buffer with pH 6.8 at 274 nm using uv spectrophotometer. The calibration curve
shows linearity in the range of 5-30Calibration curve of aceclofenac sodium was constructed in
5% of methanol and phosphate buffer with pH 6.8 at 274 nm using uv spectrophotometer. The
calibration curve shows linearity in the range of 5-30µg/ml and regression coefficient value of
0.995.
Pre compression parameters
All the materials are passed through mesh 60# as per the composition shown in the table 4. They were evaluated for the pre-compression studies shown in the table 4 .The bulk
density and the tapped density are in the range of 0.51gm/cm2 -0.56gm/cm2 and 0.58gm/cm2-
0.75gm/cm2 respectively. The carr’s index and Hausners ratio were found to be 13.29%-
26.31%, 1.15-1.35 respectively and angle of repose was found to be 26.56-32.61.All
formulations shows good to fair flow property. The F7 formulation showed better physical
properties than the other formulations shown in the below table.
Post compression parameters
The tablets are prepared by direct compression method as per the table 5. The prepared
formulations were evaluated for weight variation, hardness, friability they were shown in the
table. The percentage weight variation found to be in the limit of ± 5%, hardness was in the
range of 3-5 kg/cm3 indicating that all the formulations showed good mechanical strength and
the friability was in the limit of < 1% as per B.P.
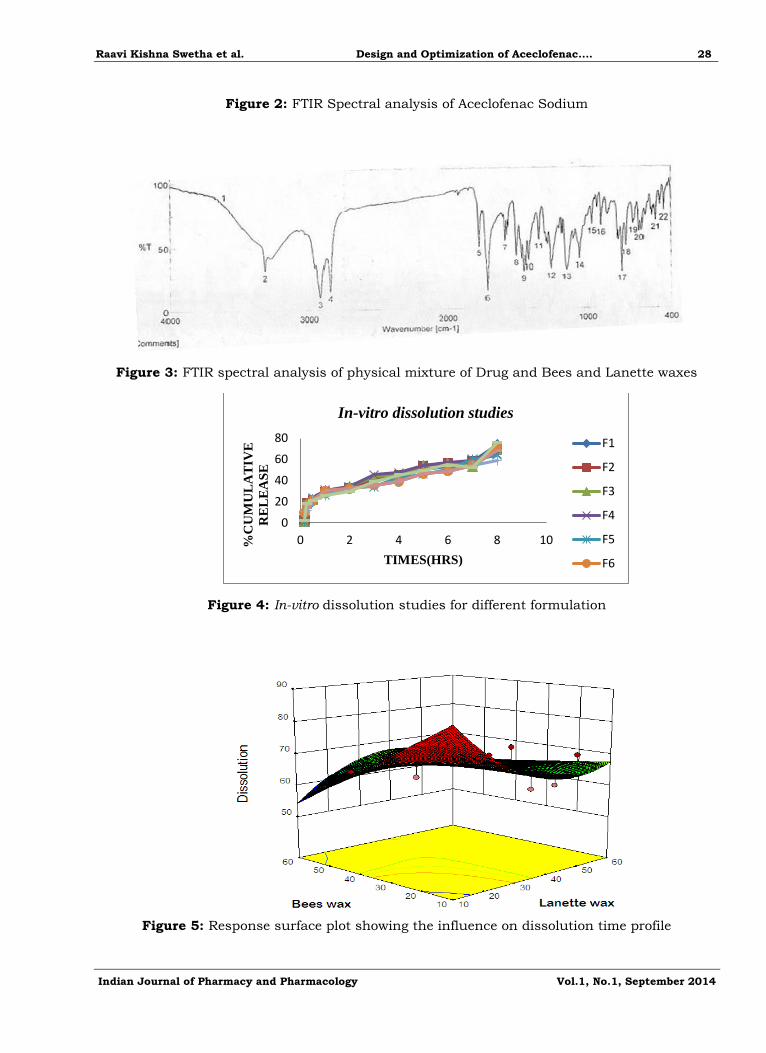
In vitro dissolution studies
The dissolution studies were carried out for the formulations as per the British
Pharmacopoeia. The release data of all the formulations are shown in the table, and they are
Raavi Kishna Swetha et al. Design and Optimization of Aceclofenac.... 24
Indian Journal of Pharmacy and Pharmacology Vol.1, No.1, September 2014
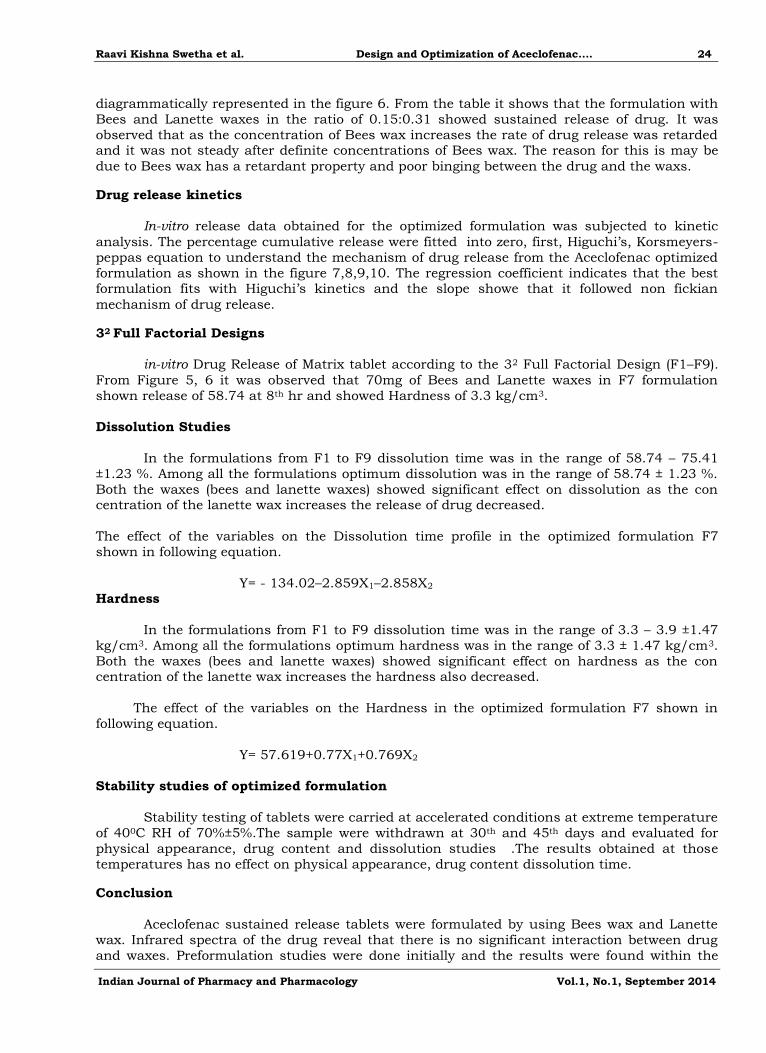
diagrammatically represented in the figure 6. From the table it shows that the formulation with
Bees and Lanette waxes in the ratio of 0.15:0.31 showed sustained release of drug. It was
observed that as the concentration of Bees wax increases the rate of drug release was retarded and it was not steady after definite concentrations of Bees wax. The reason for this is may be
due to Bees wax has a retardant property and poor binging between the drug and the waxs.
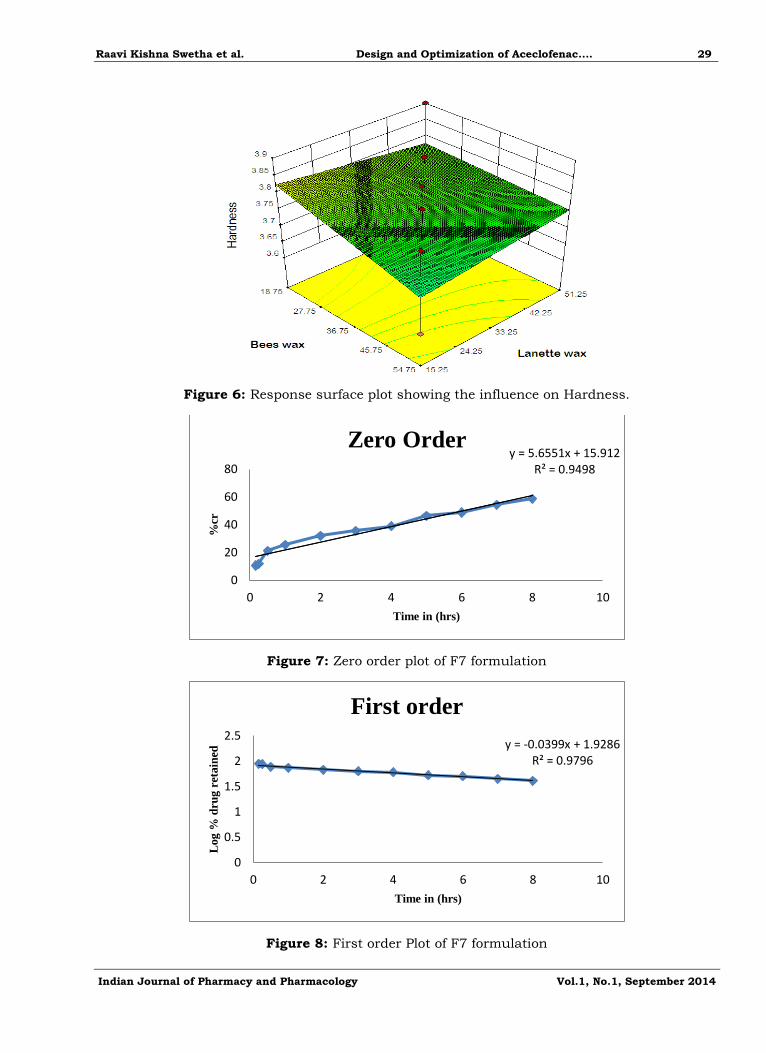
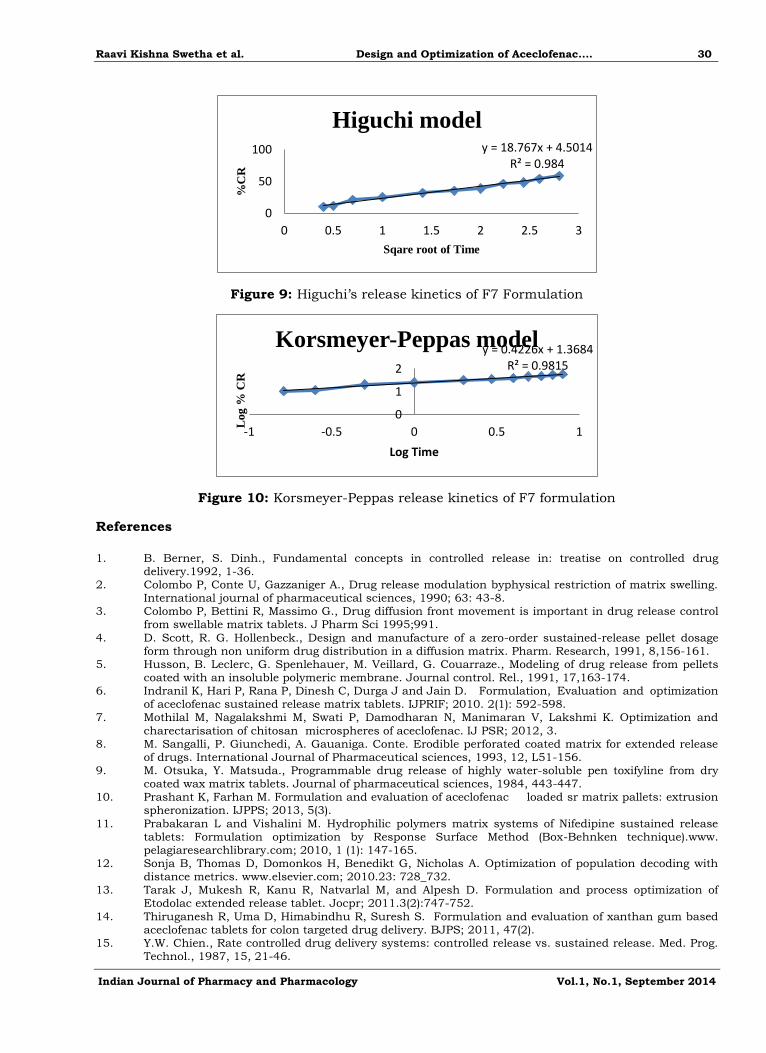
Drug release kinetics
In-vitro release data obtained for the optimized formulation was subjected to kinetic
analysis. The percentage cumulative release were fitted into zero, first, Higuchi’s, Korsmeyers-
peppas equation to understand the mechanism of drug release from the Aceclofenac optimized
formulation as shown in the figure 7,8,9,10. The regression coefficient indicates that the best formulation fits with Higuchi’s kinetics and the slope showe that it followed non fickian
mechanism of drug release.
32 Full Factorial Designs
in-vitro Drug Release of Matrix tablet according to the 32 Full Factorial Design (F1–F9).
From Figure 5, 6 it was observed that 70mg of Bees and Lanette waxes in F7 formulation
shown release of 58.74 at 8th hr and showed Hardness of 3.3 kg/cm3.
Dissolution Studies
In the formulations from F1 to F9 dissolution time was in the range of 58.74 – 75.41
±1.23 %. Among all the formulations optimum dissolution was in the range of 58.74 ± 1.23 %.
Both the waxes (bees and lanette waxes) showed significant effect on dissolution as the con centration of the lanette wax increases the release of drug decreased.
The effect of the variables on the Dissolution time profile in the optimized formulation F7
shown in following equation.
Y= - 134.02–2.859X1–2.858X2 Hardness
In the formulations from F1 to F9 dissolution time was in the range of 3.3 – 3.9 ±1.47
kg/cm3. Among all the formulations optimum hardness was in the range of 3.3 ± 1.47 kg/cm3.
Both the waxes (bees and lanette waxes) showed significant effect on hardness as the con centration of the lanette wax increases the hardness also decreased.
The effect of the variables on the Hardness in the optimized formulation F7 shown in
following equation.
Y= 57.619+0.77X1+0.769X2
Stability studies of optimized formulation
Stability testing of tablets were carried at accelerated conditions at extreme temperature
of 400C RH of 70%±5%.The sample were withdrawn at 30th and 45th days and evaluated for
physical appearance, drug content and dissolution studies .The results obtained at those
temperatures has no effect on physical appearance, drug content dissolution time.
Conclusion
Aceclofenac sustained release tablets were formulated by using Bees wax and Lanette
wax. Infrared spectra of the drug reveal that there is no significant interaction between drug
and waxes. Preformulation studies were done initially and the results were found within the
Raavi Kishna Swetha et al. Design and Optimization of Aceclofenac.... 25
Indian Journal of Pharmacy and Pharmacology Vol.1, No.1, September 2014
limits. The evaluation tests results are found to be within pharmacopoeial specifications. From in-vitro dissolution study it is concluded that the formulation of sustained release tablet of
Aceclofenac containing Bees wax and lanette waxes in 70 mg proportions were taken for
optimizing formulation of sustained release tablet for 8 hours release as it fulfills all the requirement of sustained release tablet. Kinetic studies were observed as Non-fickian release
mechanism of drug through waxes. From the stability studies, it was concluded that no
significant difference in the drug content between initial and formulations stored at 40C ±20C,
for 45 days at RH 70±5% for 45 days in optimized formulation F7.
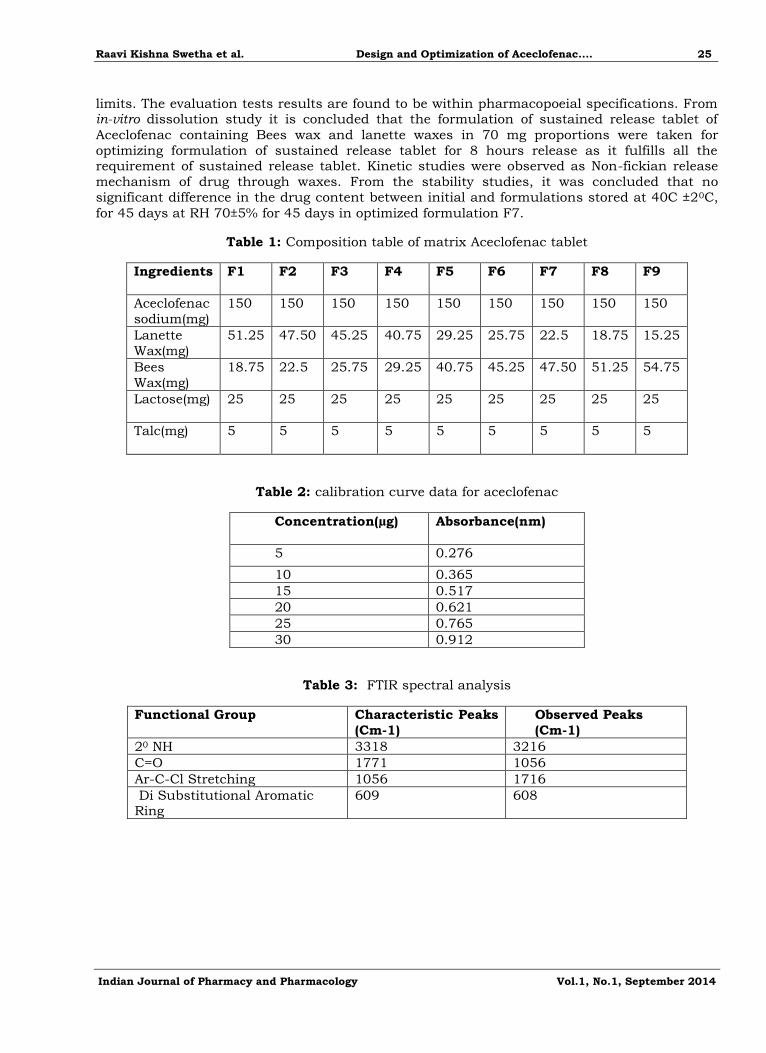
Table 1: Composition table of matrix Aceclofenac tablet
Ingredients F1 F2 F3 F4 F5 F6 F7 F8 F9
Aceclofenac
sodium(mg)
150 150 150 150 150 150 150 150 150
Lanette
Wax(mg)
51.25 47.50 45.25 40.75 29.25 25.75 22.5 18.75 15.25
Bees
Wax(mg)
18.75 22.5 25.75 29.25 40.75 45.25 47.50 51.25 54.75
Lactose(mg)
25 25 25 25 25 25 25 25 25
Talc(mg)
5 5 5 5 5 5 5 5 5
Table 2: calibration curve data for aceclofenac
Concentration(µg)
Absorbance(nm)
5 0.276
10 0.365
15 0.517
20 0.621
25 0.765
30 0.912
Table 3: FTIR spectral analysis
Functional Group Characteristic Peaks
(Cm-1)
Observed Peaks
(Cm-1)
20 NH 3318 3216
C=O 1771 1056
Ar-C-Cl Stretching 1056 1716
Di Substitutional Aromatic Ring
609 608
Raavi Kishna Swetha et al. Design and Optimization of Aceclofenac.... 26
Indian Journal of Pharmacy and Pharmacology Vol.1, No.1, September 2014
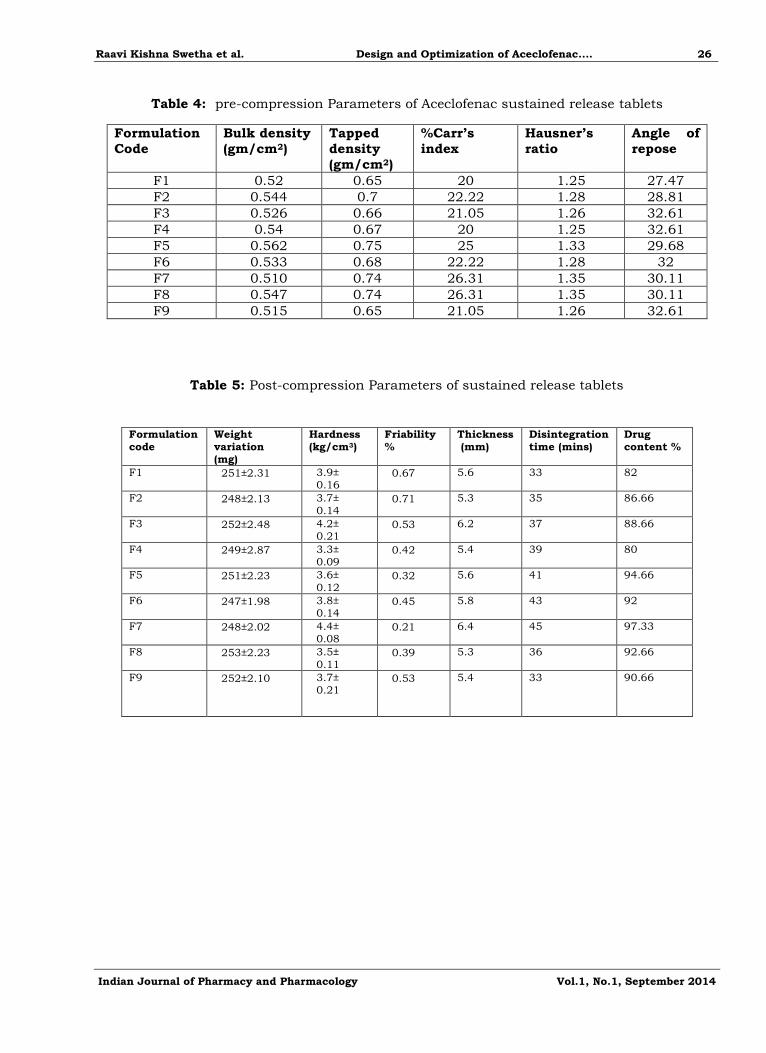
Table 4: pre-compression Parameters of Aceclofenac sustained release tablets
Formulation
Code
Bulk density
(gm/cm2)
Tapped
density
(gm/cm2)
%Carr’s
index
Hausner’s
ratio
Angle of
repose
F1 0.52 0.65 20 1.25 27.47
F2 0.544 0.7 22.22 1.28 28.81
F3 0.526 0.66 21.05 1.26 32.61
F4 0.54 0.67 20 1.25 32.61
F5 0.562 0.75 25 1.33 29.68
F6 0.533 0.68 22.22 1.28 32
F7 0.510 0.74 26.31 1.35 30.11
F8 0.547 0.74 26.31 1.35 30.11
F9 0.515 0.65 21.05 1.26 32.61
Table 5: Post-compression Parameters of sustained release tablets
Formulation code
Weight variation (mg)
Hardness (kg/cm3)
Friability %
Thickness (mm)
Disintegration time (mins)
Drug content %
F1 251±2.31
3.9± 0.16
0.67
5.6 33 82
F2 248±2.13
3.7±
0.14
0.71
5.3 35 86.66
F3 252±2.48
4.2± 0.21
0.53
6.2 37 88.66
F4 249±2.87
3.3± 0.09
0.42
5.4 39 80
F5 251±2.23
3.6±
0.12
0.32
5.6 41 94.66
F6 247±1.98
3.8± 0.14
0.45
5.8 43 92
F7 248±2.02
4.4± 0.08
0.21
6.4 45 97.33
F8 253±2.23
3.5±
0.11
0.39
5.3 36 92.66
F9 252±2.10
3.7± 0.21
0.53
5.4 33 90.66
Raavi Kishna Swetha et al. Design and Optimization of Aceclofenac.... 27
Indian Journal of Pharmacy and Pharmacology Vol.1, No.1, September 2014
Table 6: In-vitro dissolution studies for matrix tablet
TIME
(HRS)
F1
(%)
F2
(%)
F3
(%)
F4
(%)
F5
(%)
F6
(%)
F7
(%)
F8
(%)
F9
(%)
5 min 3.84 2.76 0.96 0.84 0.6 9.31 10.51 9.31 2.64
15min 17.40 18.72 18.36 18.24 17.64 16.57 11.74 16.57 18.48
30min 20.05 21.38 21.98 23.42 22.69 21.13 21.13 21.13 21.14
1 27.74 29.42 30.38 30.38 26.78 30.26 25.46 30.26 25.58
2 31.71 33.15 34.35 33.87 33.26 32.07 32.06 32.07 29.54
3 42.27 38.91 43.59 45.39 33.87 35.55 35.55 35.55 39.03
4 44.08 45.40 45.40 47.09 42.87 38.91 38.91 38.91 45.16
5 50.56 53.69 54.29 54.29 46.00 46.48 46.48 46.48 49.49
6 53.45 56.33 56.10 56.70 50.57 48.77 48.77 48.77 54.53
7 58.01 57.90 53.22 59.10 59.93 54.41 54.41 54.41 52.62
8 73.98 69.90 68.81 65.10 63.66 72.18 58.74 68.58 75.41
Figure 1: calibration curve of aceclofenac in 6.8 phosphate buffer at 274nm
y = 0.0256x + 0.1276R² = 0.9951
0
0.2
0.4
0.6
0.8
1
0 10 20 30 40
Ab
sorb
an
ce
Concentration(µg)
abs
Linear (abs)
Raavi Kishna Swetha et al. Design and Optimization of Aceclofenac.... 28
Indian Journal of Pharmacy and Pharmacology Vol.1, No.1, September 2014
Figure 2: FTIR Spectral analysis of Aceclofenac Sodium
Figure 3: FTIR spectral analysis of physical mixture of Drug and Bees and Lanette waxes
Figure 4: In-vitro dissolution studies for different formulation
Figure 5: Response surface plot showing the influence on dissolution time profile
0
20
40
60
80
0 2 4 6 8 10%C
UM
UL
AT
IVE
RE
LE
AS
E
TIMES(HRS)
In-vitro dissolution studies
F1
F2
F3
F4
F5
F6
Raavi Kishna Swetha et al. Design and Optimization of Aceclofenac.... 29
Indian Journal of Pharmacy and Pharmacology Vol.1, No.1, September 2014
Figure 6: Response surface plot showing the influence on Hardness.
Figure 7: Zero order plot of F7 formulation
Figure 8: First order Plot of F7 formulation
y = 5.6551x + 15.912R² = 0.9498
0
20
40
60
80
0 2 4 6 8 10
%cr
Time in (hrs)
Zero Order
y = -0.0399x + 1.9286R² = 0.9796
0
0.5
1
1.5
2
2.5
0 2 4 6 8 10
Log
% d
rug
ret
ain
ed
Time in (hrs)
First order
Raavi Kishna Swetha et al. Design and Optimization of Aceclofenac.... 30
Indian Journal of Pharmacy and Pharmacology Vol.1, No.1, September 2014
Figure 9: Higuchi’s release kinetics of F7 Formulation
Figure 10: Korsmeyer-Peppas release kinetics of F7 formulation
References
1. B. Berner, S. Dinh., Fundamental concepts in controlled release in: treatise on controlled drug
delivery.1992, 1-36. 2. Colombo P, Conte U, Gazzaniger A., Drug release modulation byphysical restriction of matrix swelling.
International journal of pharmaceutical sciences, 1990; 63: 43-8. 3. Colombo P, Bettini R, Massimo G., Drug diffusion front movement is important in drug release control
from swellable matrix tablets. J Pharm Sci 1995;991.
4. D. Scott, R. G. Hollenbeck., Design and manufacture of a zero-order sustained-release pellet dosage form through non uniform drug distribution in a diffusion matrix. Pharm. Research, 1991, 8,156-161.
5. Husson, B. Leclerc, G. Spenlehauer, M. Veillard, G. Couarraze., Modeling of drug release from pellets coated with an insoluble polymeric membrane. Journal control. Rel., 1991, 17,163-174.
6. Indranil K, Hari P, Rana P, Dinesh C, Durga J and Jain D. Formulation, Evaluation and optimization of aceclofenac sustained release matrix tablets. IJPRIF; 2010. 2(1): 592-598.
7. Mothilal M, Nagalakshmi M, Swati P, Damodharan N, Manimaran V, Lakshmi K. Optimization and
charectarisation of chitosan microspheres of aceclofenac. IJ PSR; 2012, 3. 8. M. Sangalli, P. Giunchedi, A. Gauaniga. Conte. Erodible perforated coated matrix for extended release
of drugs. International Journal of Pharmaceutical sciences, 1993, 12, L51-156. 9. M. Otsuka, Y. Matsuda., Programmable drug release of highly water-soluble pen toxifyline from dry
coated wax matrix tablets. Journal of pharmaceutical sciences, 1984, 443-447. 10. Prashant K, Farhan M. Formulation and evaluation of aceclofenac loaded sr matrix pallets: extrusion
spheronization. IJPPS; 2013, 5(3).
11. Prabakaran L and Vishalini M. Hydrophilic polymers matrix systems of Nifedipine sustained release tablets: Formulation optimization by Response Surface Method (Box-Behnken technique).www. pelagiaresearchlibrary.com; 2010, 1 (1): 147-165.
12. Sonja B, Thomas D, Domonkos H, Benedikt G, Nicholas A. Optimization of population decoding with distance metrics. www.elsevier.com; 2010.23: 728_732.
13. Tarak J, Mukesh R, Kanu R, Natvarlal M, and Alpesh D. Formulation and process optimization of Etodolac extended release tablet. Jocpr; 2011.3(2):747-752.
14. Thiruganesh R, Uma D, Himabindhu R, Suresh S. Formulation and evaluation of xanthan gum based aceclofenac tablets for colon targeted drug delivery. BJPS; 2011, 47(2).
15. Y.W. Chien., Rate controlled drug delivery systems: controlled release vs. sustained release. Med. Prog. Technol., 1987, 15, 21-46.
y = 18.767x + 4.5014R² = 0.984
0
50
100
0 0.5 1 1.5 2 2.5 3%
CR
Sqare root of Time
Higuchi model
y = 0.4226x + 1.3684R² = 0.9815
0
1
2
-1 -0.5 0 0.5 1
Log
% C
R
Log Time
Korsmeyer-Peppas model