Embed Size (px)
Citation preview
Design of an Integrated Microelectrode Array System for High Spatiotemporal Resolution Chemical Imaging
William Tedjo1, Rachel Feeny2, Chad Eitel3, Luke Schwerdtfeger3, Stacy Willett3, Charles Henry2, Stuart Tobet3, Tom Chen1
1Department of Electrical & Computer Engineering, Colorado State University, Fort Collins, Colorado, USA 2Department of Chemistry, Colorado State University, Fort Collins, Colorado, USA
3School of Biomedical Engineering, Colorado State University, Fort Collins, Colorado, USA
Abstract—There has been a growing interest in electrochemical measurement of the output from biological specimens. With the advent of silicon CMOS technology, it is possible to measure target molecule release and their movement through extracellular space using microelectrode arrays (MEAs). While MEAs have been used for electrophysiological measurements, their use for electrochemistry in physiological studies have only been explored more recently. This paper presents a unique design of a high-density MEA and its supporting circuits to acquire images of chemical gradients using electrochemical methods. Heat-map image acquisition is supported at the system level with custom designed MATLAB tools for data-to-image processing. The detection range of chemical concentrations is illustrated with experimental results demonstrating capture of neurotransmitter release from live adrenal slices.
Keywords—Biosensors; Microelectrodes; Electrochemical Sensors; Amperometric Sensors; CMOS Integrated Circuits; Potentiostat; Operational Amplifiers.
I. INTRODUCTION
Release of neurotransmitters, such as catecholamines, drive many biological phenomena including chemotaxis [1, 2] and cell-cell communication [3, 4]. The ability to monitor chemical release and resulting cellular responses will greatly improve the understanding of cell-cell interaction. Traditional fluorescence microscopy provides a platform that is able to accomplish biological imaging by excitation of fluorophore. However, the fluorescence-based optical method is limited to target analytes that are natively fluorescent or modified with fluorescent markers [5, 6]. In addition, photobleaching and phototoxicity are widely recognized issues associated with fluorescence microscopy methods [7, 8]. On the other hand, electrochemical methods offer label-free detection and do not require fluorescent illumination.
Recent advances in CMOS technology have created new options for design of microelectrode arrays (MEAs) to achieve biologically relevant resolutions through the miniaturization of integrated on-chip electronics for high fidelity spatiotemporal analyses. The notion of CMOS-based devices for electrochemical measurement at high spatiotemporal resolution has been previously introduced by others in controlled microfluidics experiments [9, 10], and in an experiment incorporating biological samples [11].
This paper describes a chemical imaging system based on our prior work examining different electrode designs for increased sensitivity [12], and high spatiotemporal resolution imaging results with controlled release of neurotransmitters using a microfluidic setup [13, 14]. To perform chemical
imaging on live tissues, both hardware and software modules were re-designed to further improve signal-to-noise ratio (SNR) and signal processing capability.
II. ELECTROCHEMICAL IMAGING SYSTEM
A. 3-Electrode Electrochemical Sensing The electrochemical imaging system adopts a traditional
three-electrode system method, employing Working Electrode (WE), Reference Electrode (RE), and Auxiliary Electrode (AE) as shown in Fig. 1. In amperometric measurement, the current detection of oxidation and reduction of electrochemically active compounds is activated by the constant potential difference between the WE and AE held by the RE and potentiostat. In the WE array, the current density is correlated with the concentration of the target chemical compound in each localized WE area [15].
B. On-Chip MEAs The silicon-based microchip is fabricated in a 600nm
CMOS technology with three metal layers and the top metal layer for MEAs, and housed in a 280-pin alumina package. The electrode, raised 1.5μm above the passivation surface, is arranged layers of Ti, Au, and Pt to maintain electrodes conductivity, mechanical stability, and bio-compatibility [16].
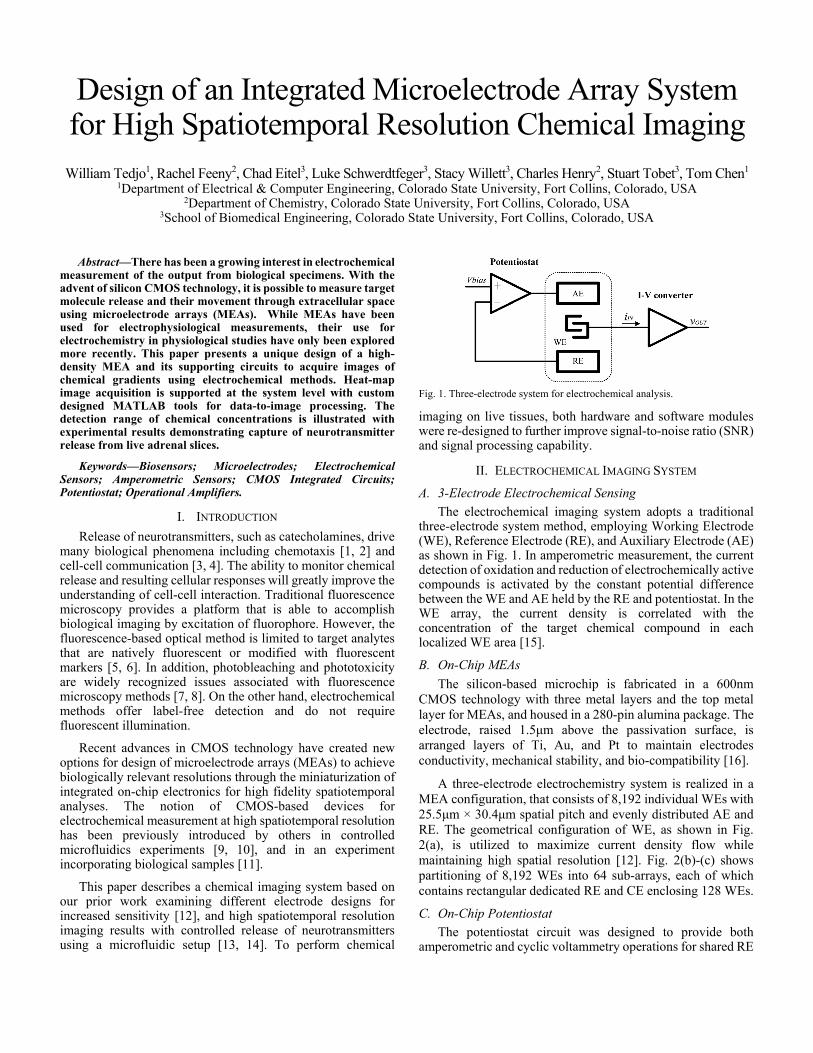
A three-electrode electrochemistry system is realized in a MEA configuration, that consists of 8,192 individual WEs with 25.5μm × 30.4μm spatial pitch and evenly distributed AE and RE. The geometrical configuration of WE, as shown in Fig. 2(a), is utilized to maximize current density flow while maintaining high spatial resolution [12]. Fig. 2(b)-(c) shows partitioning of 8,192 WEs into 64 sub-arrays, each of which contains rectangular dedicated RE and CE enclosing 128 WEs.
C. On-Chip Potentiostat The potentiostat circuit was designed to provide both
amperometric and cyclic voltammetry operations for shared RE
Fig. 1. Three-electrode system for electrochemical analysis.
and CE for all the WEs. As depicted in Fig.1, the on-chip potentiostat employs an operational amplifier (opamp) circuit forming a pseudo unity gain buffer with non-zero impedance path between AE and RE electrodes. The single-ended opamp schematic depicted in Fig. 3 is an inverter-based design topology. This novel opamp was designed to have a high open loop gain (>100dB), while maintaining low power consumption (<100uW) and a sufficient bandwidth (>10kHz) for electrochemical applications [17, 18].
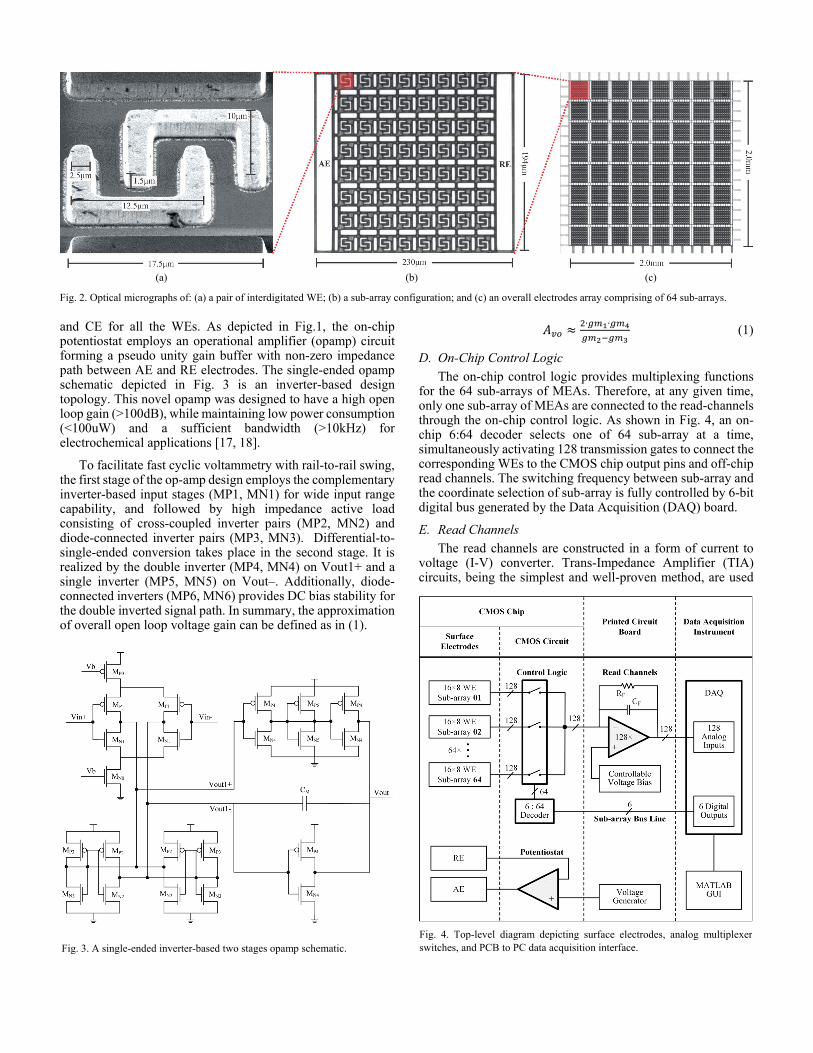
To facilitate fast cyclic voltammetry with rail-to-rail swing, the first stage of the op-amp design employs the complementary inverter-based input stages (MP1, MN1) for wide input range capability, and followed by high impedance active load consisting of cross-coupled inverter pairs (MP2, MN2) and diode-connected inverter pairs (MP3, MN3). Differential-to-single-ended conversion takes place in the second stage. It is realized by the double inverter (MP4, MN4) on Vout1+ and a single inverter (MP5, MN5) on Vout–. Additionally, diode-connected inverters (MP6, MN6) provides DC bias stability for the double inverted signal path. In summary, the approximation of overall open loop voltage gain can be defined as in (1).
∙ ∙
(1)
D. On-Chip Control Logic The on-chip control logic provides multiplexing functions
for the 64 sub-arrays of MEAs. Therefore, at any given time, only one sub-array of MEAs are connected to the read-channels through the on-chip control logic. As shown in Fig. 4, an on-chip 6:64 decoder selects one of 64 sub-array at a time, simultaneously activating 128 transmission gates to connect the corresponding WEs to the CMOS chip output pins and off-chip read channels. The switching frequency between sub-array and the coordinate selection of sub-array is fully controlled by 6-bit digital bus generated by the Data Acquisition (DAQ) board.
E. Read Channels The read channels are constructed in a form of current to
voltage (I-V) converter. Trans-Impedance Amplifier (TIA) circuits, being the simplest and well-proven method, are used
Fig. 3. A single-ended inverter-based two stages opamp schematic.
(a) (b) (c)
Fig. 2. Optical micrographs of: (a) a pair of interdigitated WE; (b) a sub-array configuration; and (c) an overall electrodes array comprising of 64 sub-arrays.
Fig. 4. Top-level diagram depicting surface electrodes, analog multiplexer switches, and PCB to PC data acquisition interface.
to convert the current readings from 128 current inputs from a sub-array MEA. There are 128 read channels, each read channel consists of: a single-ended opamp, a high precision 50MΩ thin-film resistor ( ), and a 1nF stabilization feedback capacitor ( ). The value of and are based on the need for high SNR and moderately low I-V conversion bandwidth (i.e. tens of kHz) for biological electrochemical imaging. The bandwidth of the TIA is defined by (2), where is the intercept frequency between the opamp open-loop gain and the feedback frequency response, is the opamp gain-bandwidth product, and is the total interconnects parasitic capacitance and the double-layer capacitances formed at the surface of WE.
1.4 1.4 (2)
Furthermore, as defined by (3), the output rms noise consists of three noise contributors: is the thermal noise of , is the shot noise due to input bias current of the opamp, and is the overall output noise generated by the opamp [19].
(3)
In this TIA read channel design, the use of opamp with extremely low output noise ( = 8.5nV/Hz½ at f = 1kHz) and input current noise ( = 0.6 fA/Hz½ at f = 1kHz) yields relatively negligible and . The R thermal noise ( ) over a bandwidth defined by ( + ) will dominate the output rms noise. Increasing will result in linear increase in I-V gain and a square root increase in output rms noise, leading to a higher SNR. In addition, the choices of and provide tradeoff between the required bandwidth in (2) and the output rms noise in (3). Given that = 1nF, = 150pF, and = 20Mhz, the resulting bandwidth and output rms noise will be 10.4kHz and 1.54μVrms, respectively. This theoretical tradeoff satisfies the requirement for a sub-pA current detection sensitivity of the read channel (refer to Section III for results).
F. Data Acquisition and Analysis The data collection is being handled by two commercial 96-
input 12-bit analog data acquisition boards (ADLINK DAQ-2208). The real time data observation, offline data processing, and heat-map movie generation are performed in custom designed MATLAB graphical user interface (GUI) and functions. For offline data processing, the acquired dataset is handled in multiple steps to generate a corresponding heat-map movie by applying following methods and algorithms:
• Regression analysis: sensor drift and offset removal • Gain calibration: minimize read channels gain
variation using previously generated sensitivity curve • Savitzky-Golay filtering: high frequency and digital-to-
analog quantization noise smoothing • Spatial mean filtering: heat-map image smoothing • Motion smoothing: frame-to-frame image interpolation
III. EXPERIMENTAL RESULTS
A. Sensitivity Measurement Sensor sensitivity determines the system noise floor and the
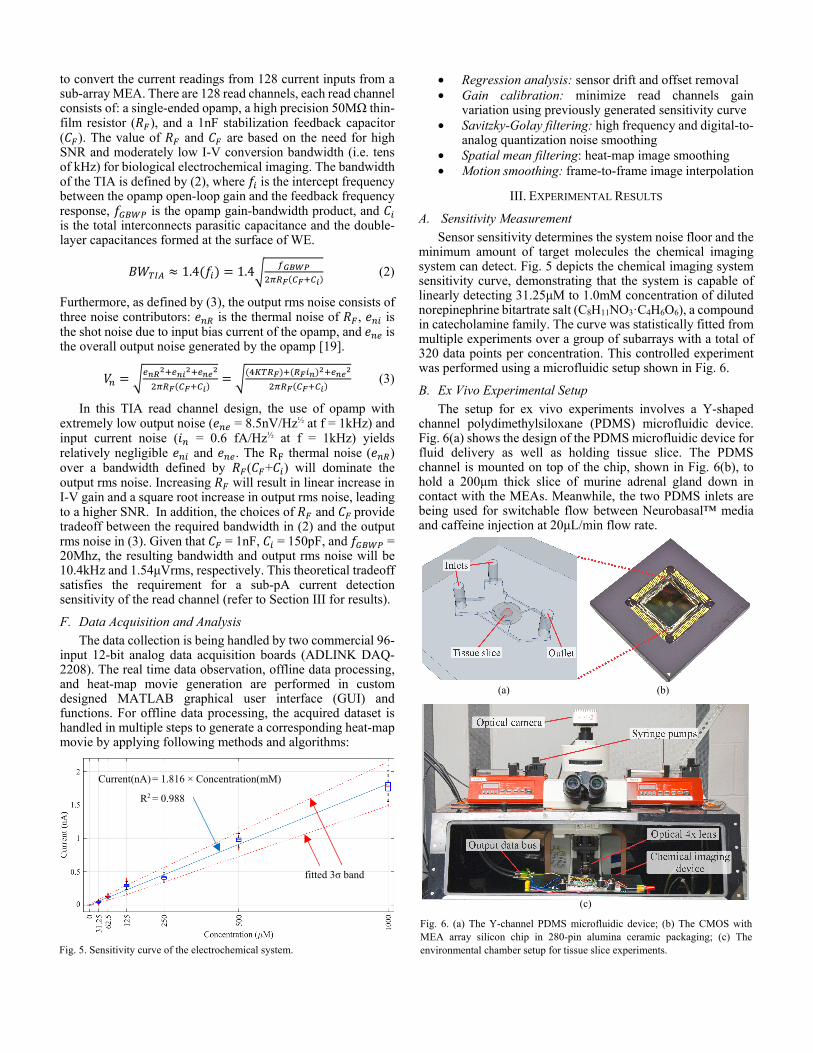
minimum amount of target molecules the chemical imaging system can detect. Fig. 5 depicts the chemical imaging system sensitivity curve, demonstrating that the system is capable of linearly detecting 31.25μM to 1.0mM concentration of diluted norepinephrine bitartrate salt (C8H11NO3·C4H6O6), a compound in catecholamine family. The curve was statistically fitted from multiple experiments over a group of subarrays with a total of 320 data points per concentration. This controlled experiment was performed using a microfluidic setup shown in Fig. 6.
B. Ex Vivo Experimental Setup The setup for ex vivo experiments involves a Y-shaped
channel polydimethylsiloxane (PDMS) microfluidic device. Fig. 6(a) shows the design of the PDMS microfluidic device for fluid delivery as well as holding tissue slice. The PDMS channel is mounted on top of the chip, shown in Fig. 6(b), to hold a 200μm thick slice of murine adrenal gland down in contact with the MEAs. Meanwhile, the two PDMS inlets are being used for switchable flow between Neurobasal™ media and caffeine injection at 20μL/min flow rate.
(a) (b)
(c)
Fig. 6. (a) The Y-channel PDMS microfluidic device; (b) The CMOS with MEA array silicon chip in 280-pin alumina ceramic packaging; (c) The environmental chamber setup for tissue slice experiments. Fig. 5. Sensitivity curve of the electrochemical system.
Current(nA) = 1.816 × Concentration(mM)
R2 = 0.988
fitted 3σ band
As shown in Fig. 6(c), The environmental chamber is used to maintain live tissue functions. Tissue samples are maintained at constant conditions of dark environment with 37C° temperature, 95% humidity, and 7.2-7.4pH level culture media (a mixture of Neurobasal™ media and HEPES). As a complete system, the environmental chamber encloses an optical microscope with recording camera, microfluidic devices, and the chemical imaging electronics.
C. Ex Vivo Result
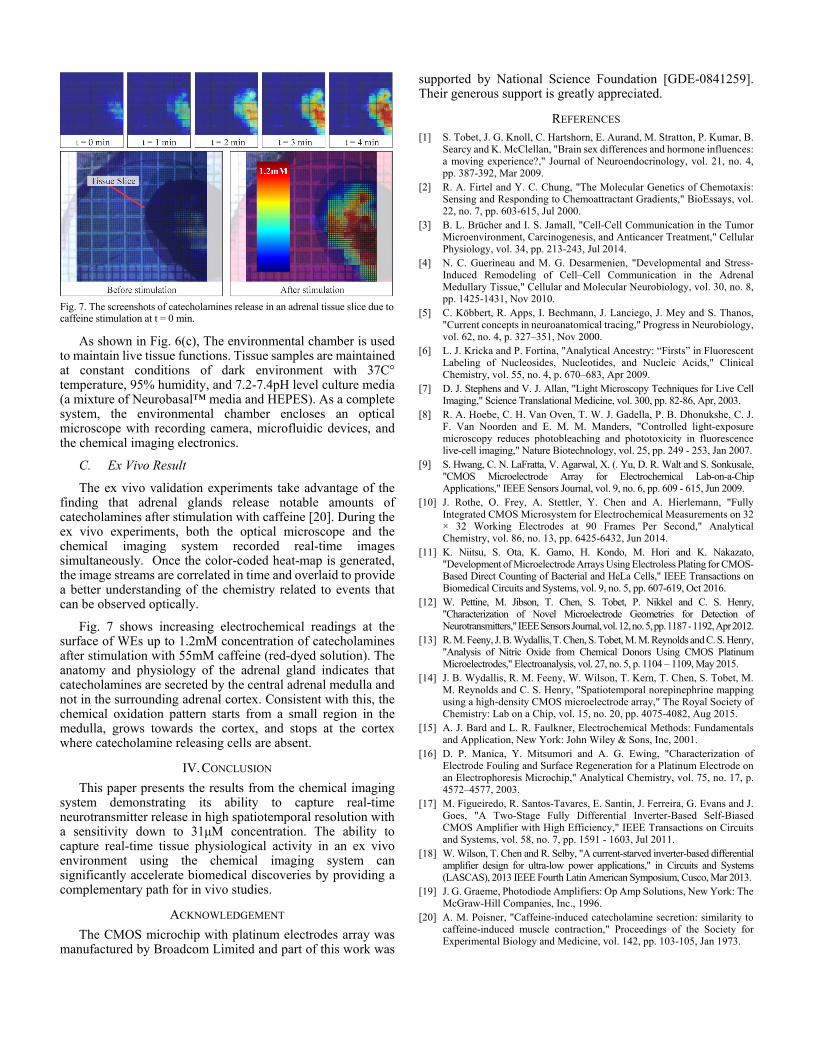
The ex vivo validation experiments take advantage of the finding that adrenal glands release notable amounts of catecholamines after stimulation with caffeine [20]. During the ex vivo experiments, both the optical microscope and the chemical imaging system recorded real-time images simultaneously. Once the color-coded heat-map is generated, the image streams are correlated in time and overlaid to provide a better understanding of the chemistry related to events that can be observed optically.
Fig. 7 shows increasing electrochemical readings at the surface of WEs up to 1.2mM concentration of catecholamines after stimulation with 55mM caffeine (red-dyed solution). The anatomy and physiology of the adrenal gland indicates that catecholamines are secreted by the central adrenal medulla and not in the surrounding adrenal cortex. Consistent with this, the chemical oxidation pattern starts from a small region in the medulla, grows towards the cortex, and stops at the cortex where catecholamine releasing cells are absent.
IV. CONCLUSION
This paper presents the results from the chemical imaging system demonstrating its ability to capture real-time neurotransmitter release in high spatiotemporal resolution with a sensitivity down to 31μM concentration. The ability to capture real-time tissue physiological activity in an ex vivo environment using the chemical imaging system can significantly accelerate biomedical discoveries by providing a complementary path for in vivo studies.
ACKNOWLEDGEMENT
The CMOS microchip with platinum electrodes array was manufactured by Broadcom Limited and part of this work was
supported by National Science Foundation [GDE-0841259]. Their generous support is greatly appreciated.
REFERENCES [1] S. Tobet, J. G. Knoll, C. Hartshorn, E. Aurand, M. Stratton, P. Kumar, B.
Searcy and K. McClellan, "Brain sex differences and hormone influences: a moving experience?," Journal of Neuroendocrinology, vol. 21, no. 4, pp. 387-392, Mar 2009.
[2] R. A. Firtel and Y. C. Chung, "The Molecular Genetics of Chemotaxis: Sensing and Responding to Chemoattractant Gradients," BioEssays, vol. 22, no. 7, pp. 603-615, Jul 2000.
[3] B. L. Brücher and I. S. Jamall, "Cell-Cell Communication in the Tumor Microenvironment, Carcinogenesis, and Anticancer Treatment," Cellular Physiology, vol. 34, pp. 213-243, Jul 2014.
[4] N. C. Guerineau and M. G. Desarmenien, "Developmental and Stress-Induced Remodeling of Cell–Cell Communication in the Adrenal Medullary Tissue," Cellular and Molecular Neurobiology, vol. 30, no. 8, pp. 1425-1431, Nov 2010.
[5] C. Köbbert, R. Apps, I. Bechmann, J. Lanciego, J. Mey and S. Thanos, "Current concepts in neuroanatomical tracing," Progress in Neurobiology, vol. 62, no. 4, p. 327–351, Nov 2000.
[6] L. J. Kricka and P. Fortina, "Analytical Ancestry: “Firsts” in Fluorescent Labeling of Nucleosides, Nucleotides, and Nucleic Acids," Clinical Chemistry, vol. 55, no. 4, p. 670–683, Apr 2009.
[7] D. J. Stephens and V. J. Allan, "Light Microscopy Techniques for Live Cell Imaging," Science Translational Medicine, vol. 300, pp. 82-86, Apr, 2003.
[8] R. A. Hoebe, C. H. Van Oven, T. W. J. Gadella, P. B. Dhonukshe, C. J. F. Van Noorden and E. M. M. Manders, "Controlled light-exposure microscopy reduces photobleaching and phototoxicity in fluorescence live-cell imaging," Nature Biotechnology, vol. 25, pp. 249 - 253, Jan 2007.
[9] S. Hwang, C. N. LaFratta, V. Agarwal, X. (. Yu, D. R. Walt and S. Sonkusale, "CMOS Microelectrode Array for Electrochemical Lab-on-a-Chip Applications," IEEE Sensors Journal, vol. 9, no. 6, pp. 609 - 615, Jun 2009.
[10] J. Rothe, O. Frey, A. Stettler, Y. Chen and A. Hierlemann, "Fully Integrated CMOS Microsystem for Electrochemical Measurements on 32 × 32 Working Electrodes at 90 Frames Per Second," Analytical Chemistry, vol. 86, no. 13, pp. 6425-6432, Jun 2014.
[11] K. Niitsu, S. Ota, K. Gamo, H. Kondo, M. Hori and K. Nakazato, "Development of Microelectrode Arrays Using Electroless Plating for CMOS-Based Direct Counting of Bacterial and HeLa Cells," IEEE Transactions on Biomedical Circuits and Systems, vol. 9, no. 5, pp. 607-619, Oct 2016.
[12] W. Pettine, M. Jibson, T. Chen, S. Tobet, P. Nikkel and C. S. Henry, "Characterization of Novel Microelectrode Geometries for Detection of Neurotransmitters," IEEE Sensors Journal, vol. 12, no. 5, pp. 1187 - 1192, Apr 2012.
[13] R. M. Feeny, J. B. Wydallis, T. Chen, S. Tobet, M. M. Reynolds and C. S. Henry, "Analysis of Nitric Oxide from Chemical Donors Using CMOS Platinum Microelectrodes," Electroanalysis, vol. 27, no. 5, p. 1104 – 1109, May 2015.
[14] J. B. Wydallis, R. M. Feeny, W. Wilson, T. Kern, T. Chen, S. Tobet, M. M. Reynolds and C. S. Henry, "Spatiotemporal norepinephrine mapping using a high-density CMOS microelectrode array," The Royal Society of Chemistry: Lab on a Chip, vol. 15, no. 20, pp. 4075-4082, Aug 2015.
[15] A. J. Bard and L. R. Faulkner, Electrochemical Methods: Fundamentals and Application, New York: John Wiley & Sons, Inc, 2001.
[16] D. P. Manica, Y. Mitsumori and A. G. Ewing, "Characterization of Electrode Fouling and Surface Regeneration for a Platinum Electrode on an Electrophoresis Microchip," Analytical Chemistry, vol. 75, no. 17, p. 4572–4577, 2003.
[17] M. Figueiredo, R. Santos-Tavares, E. Santin, J. Ferreira, G. Evans and J. Goes, "A Two-Stage Fully Differential Inverter-Based Self-Biased CMOS Amplifier with High Efficiency," IEEE Transactions on Circuits and Systems, vol. 58, no. 7, pp. 1591 - 1603, Jul 2011.
[18] W. Wilson, T. Chen and R. Selby, "A current-starved inverter-based differential amplifier design for ultra-low power applications," in Circuits and Systems (LASCAS), 2013 IEEE Fourth Latin American Symposium, Cusco, Mar 2013.
[19] J. G. Graeme, Photodiode Amplifiers: Op Amp Solutions, New York: The McGraw-Hill Companies, Inc., 1996.
[20] A. M. Poisner, "Caffeine-induced catecholamine secretion: similarity to caffeine-induced muscle contraction," Proceedings of the Society for Experimental Biology and Medicine, vol. 142, pp. 103-105, Jan 1973.
Fig. 7. The screenshots of catecholamines release in an adrenal tissue slice due tocaffeine stimulation at t = 0 min.