Embed Size (px)
Citation preview
Energy and Buildings 35 (2003) 1129–1143
Design of passive cooling by night ventilation: evaluation of a parametricmodel and building simulation with measurements
Jens Pfafferott∗, Sebastian Herkel, Martina JäschkeFraunhofer-Institute for Solar Energy Systems, Heidenhofstraße 2, 79098 Freiburg, Germany
Received 15 July 2003; received in revised form 5 September 2003; accepted 10 September 2003
Abstract
At the new institute building of Fraunhofer ISE, both mechanical and free night ventilation is used for passive cooling of the offices. Theresults from a long-term monitoring show, that room temperatures are comfortable even at high ambient air temperatures. In two offices,experiments were carried out in order to determine the efficiency of night ventilation dependent on air change rate, solar and internal heatgains. The aim is to identify characteristic building parameters and to determine the night ventilation effect with these parameters. Theexperiments (one room with and one without night ventilation) are evaluated by using both a parametric model and the ESP-r buildingsimulation programme. Both models are merged in order to develop a method for data evaluation in office buildings with night ventilationand to provide a simple model for integration in a building management system.© 2003 Elsevier B.V. All rights reserved.
Keywords: Night ventilation; Design; Parametric model; Building simulation; Performance criteria
1. Introduction
Night ventilation potential for improving comfort hasmainly been investigated by numerical means. Santamourisand co-workers[34,35] introduced an integrated methodto calculate the energy contribution of night ventilationtechniques to the cooling load of a building. Kolokotroniand Aronis[26] states that both free and mechanical nightventilation reduces the plant capacity and the energy con-sumption in air-conditioned office buildings.
This paper focuses on a full-scale experiment and its eval-uation. Kolokotroni et al.[25] used temperature/humidity-charts for data evaluation of results from a simulation inorder to generate a pre-design tool for summer cooling withnight ventilation for office buildings in moderate climates.Geros et al.[17] carried out an experimental evaluation ofnight ventilation of four different buildings. Additionally,simulation investigations are used to determine how the airchange rates, the building construction and the climatic pa-rameters affects the night ventilation. The data evaluationdeals with the nocturnal air change rates and the indoor airtemperature. Givoni[18] carried out experiments in a lowand a high mass building in order to determine the effective-
∗ Corresponding author. Tel.:+49-761-4588-5129;fax: +49-761-4588-9129.E-mail address: [email protected] (J. Pfafferott).
ness of mass and night ventilation in lowering the indoordaytime temperatures. Givoni derives a simple model forthe daytime maximum temperature from an extensive dataanalysis. This model does not take the user behaviour andinternal heat gains into account. Blondeau et al.[6] carriedout full-scale measurements in a three level office building.The data evaluation deals with both comfort criteria andenergy balance. Blondeau points out that the modelling ofheat transfer coefficients in building simulation programmesis difficult and emphasises that further research is necessaryto characterise the building potential for night ventilation.Herkel et al.[21] used a similar approach in order to evaluatethe night ventilation efficiency with data from a long-termmeasurement. The experiments, which are evaluated in thispaper, have been designed against this background.
1.1. Modelling the night ventilation efficiency
In modelling the night ventilation effect there are somecrucial points:
• Natural, hybrid and mechanical ventilation: As most nightventilation concepts are based on a free or a hybrid ven-tilation concept, the air change rates must be calculated.Due to the different driving forces (wind, buoyancy andfan driven ventilation), the design of free and hybrid venti-lation and interzonal air exchange is complex. Therefore,
0378-7788/$ – see front matter © 2003 Elsevier B.V. All rights reserved.doi:10.1016/j.enbuild.2003.09.005
1130 J. Pfafferott et al. / Energy and Buildings 35 (2003) 1129–1143
sophisticated design tools should be used in order to deter-mine the air change rates. Feustel and Dieris[14] presentsa survey of airflow models for multizone structures. Ayns-ley [4] introduces a resistance approach to analysis of nat-ural ventilation airflow networks. Most programmes workwith a resistances approach. An extensive overview overthe airflow through openings, ventilation, infiltration andinterzonal air exchange is given by Allard and Utsumi[3]. Often the discharge coefficients for openings are un-known. Some measurements of discharge coefficients andconclusions on air flow through buildings are summarisedby Flourentzou et al.[15]. Heiselberg[20] introduces theprinciples of hybrid ventilation. In urban areas, the en-vironmental impact on passive ventilation cooling has tobe taken into account. A survey is given by Kolokotroniet al. [27]. In addition to the interzonal air flow models,the air movements in naturally ventilated buildings shouldbe taken into account. The air movements can be investi-gated using CFD[5] or measurements[12].
• Heat transfer: As the night ventilation cools down thebuilding construction, an accurate modelling of theconvective heat transfer coefficient is essential for thesimulation of night ventilation. A good survey on differ-ent models for building applications is given by Dascalakiet al. [9]. The standard deviation in different models forcalculation of heat transfer coefficients is around 20–40%(cp. uncertainty in modelling). From the multitude ofmodels, the data correlations by Alamdari and Hammond[2] and Khalifa and Marshall[24] will be used for cal-culating the night ventilation efficiency because thesemodels show a good agreement between measurementand simulation.
• Heat storage: The heat storage capacity of a room con-sists of the thermally utilisable heat storage capacity ofall boundary surfaces and of the furniture. It is dependenton (1) the thickness of each construction, (2) its thermalproperties, (3) the period of the fluctuation of the undis-turbed air temperature and (4) the heat transfer at thesurface or the Biot number, respectively. As the amplitudeof the temperature oscillation diminishes with the depth,the analytical solution deals with the thermal penetrationdepth, cp.[7] or any other textbook on heat conduction.The thermally active heat storage capacity is calculatedanalytically according to Keller’s[22] recommendation.This method is similar to the numerical solution, whichis required by ISO 13786[13], and results in the sameheat storage capacity. A good survey on the convectiveheat balance of a room and the storable energy in a con-crete slab was given by Koschenz and Dorer[28]. Whilethe heat storage capacity influences the energy balancein winter only insignificantly, a high heat storage capac-ity diminishes room temperature fluctuations in summerduring a change in the weather[19].
As the night ventilation lowers the room temperature in or-der to improve the thermal comfort, the data analysis should
deal with comfort criteria. Different comfort criteria are inscientific discussion[31]. As the evaluation of passive cool-ing focuses on the energy balance, this paper deals with twosimple comfort criteria, which are based on the operativeroom temperature:
• According to the German norm DIN 1946[11], the op-erative room temperature should lie in between 22 and25◦C up to an ambient temperature of 26◦C. Still accept-able room temperatures lie in between 20 and 26◦C. Thecomfortable room temperature is higher at ambient tem-peratures above 26◦C. Though this norm is valid only forventilated and air conditioned buildings, it is also usedfor passively cooled buildings. As this comfort criteriontakes the ambient temperature into account, it can be useddirectly for data evaluation, cp.Fig. 6.
• According to Rouvel and co-workers’s study[10], theroom temperature should not exceed a given temperaturelimit at more than 10% of the working time. The temper-ature limit is dependent on a pre-defined climate region(e.g. Freiburg, Germany: 27◦C). As this criterion is notindependent from the ambient temperature, the evaluationof measured data is not universally valid. It can be noticedfrom an ongoing survey at a few office buildings[16], thatthese temperature limits are not restricted enough. Sur-veys in air conditioned residential buildings from the lateeighties affirm[23], that room temperatures should notexceed 25◦C. Thus, Rouvel’s comfort criterion is usedwith a temperature limit of 25◦C, cp.Fig. 5.
Some planning tools has been established in the last years.Keller [22] presented an analytical method for the thermaldesign of buildings, which is based on characteristic param-eters. These parameters are derived from a complete mathe-matics solution of the energy balance of a room and will beused in this paper. A similar model based on the non-linearcoupling between thermal mass and natural ventilation inbuildings has been presented by Yam et al.[38]. The designtool LESOCOOL[32] merges an air flow model with a heattransfer model. This simplified model for passive cooling cancalculate the cooling potential, temperature evolution andair flow rates for given heat gains and losses. A comparableprogramme is introduced by Rousseau and Mathews[33].The NatVent programme[30] takes infiltration, ventilationand thermal storage into account. The NatVent programmeis made to serve as a pre-design tool that can be used earlyin the design process before explicit data about the buildingand the ventilation system are made within the programme.The Swiss EMPA published a handbook on passive cooling[40]. This handbook summarises boundary conditions forpassive cooling and criteria for the design of different pas-sive cooling techniques. Concerning night ventilation, theover all cooling load should not succeed 150 Wh/(m2 perday), if the temperature difference between day and night isless than 5 K, and 250 Wh/(m2 per day), if the difference ishigher than 10 K. For cooling with free ventilation, Zeidler[39] gives a similar limit for heat gains of 30 W/m2 in an
J. Pfafferott et al. / Energy and Buildings 35 (2003) 1129–1143 1131
time lag
heat storage
heat gains
heat losses
solar heat gains, e.g.: solar shading g-value window area
internal heat gains, e.g.: reduction by day lighting artificial lighting office equipment persons
thermal properties structural design heat transfer effective penetration depth
day ventilation, e.g.: window opening ventilation system earth-to-air heat exchanger
night ventilation with: free ventilation mechanical ventilation hybrid ventilation
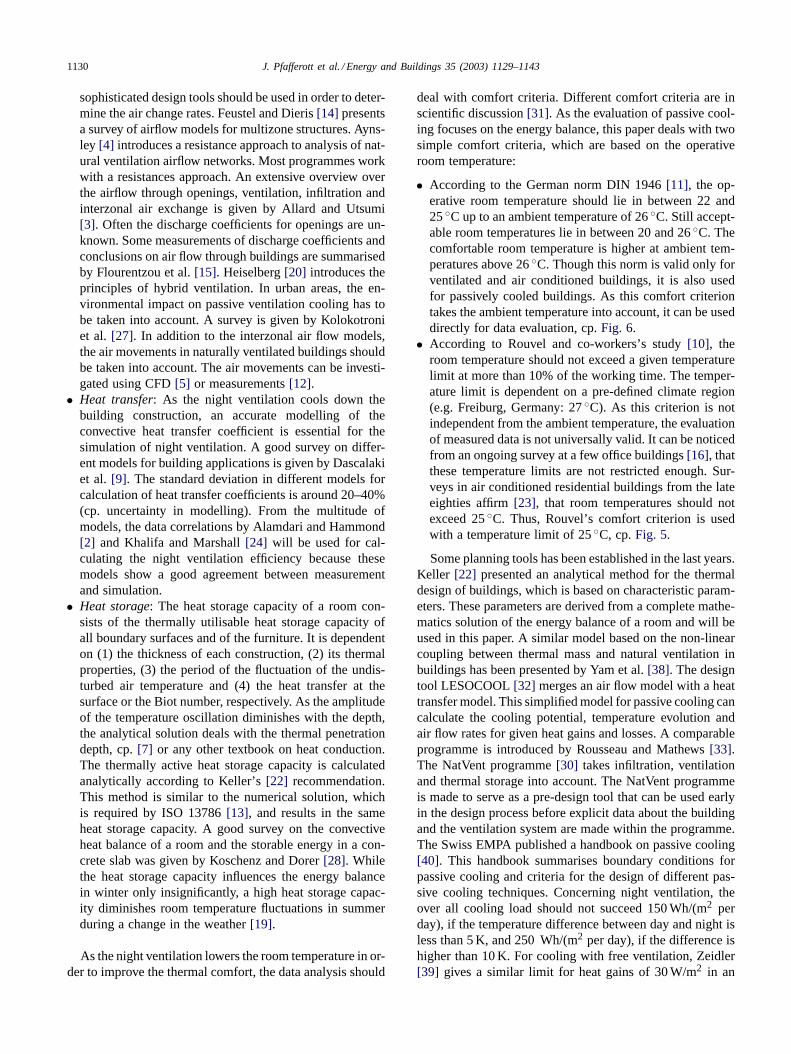
Fig. 1. Principle of night ventilation: energy balance.
office room with typical use. Surely, even more design toolsare available. Self-evident, building simulation programmescan be used favourably for the design of free and mechan-ical night ventilation. In this paper the building simulationprogramme ESP-r[8] is used. In addition, different otherstrategies can be evaluated with building simulation in or-der to avoid over-heating in summer, i.e. optimised windowfraction, solar gain coefficient, shading devices, hybrid ven-tilation with an earth-to-air heat exchanger, minimised in-ternal heat gains and control strategies.
Finally, night ventilation should be designed according tonational guidelines: the guideline VDI 2078[36] specifiesthe calculation procedure for the cooling load in Germany.An uncertainty analysis should complete the design processand should be taken into account in the modelling of nightventilation. Macdonald and Strachan[29] shows the prac-tical application of uncertainty analysis in building design.Herkel et al.[21] used an uncertainty analysis for data eval-uation with building simulation.
1.2. Methodology on evaluation of experimental data
Fig. 1 outlines the principle of night ventilation: due tothe heat storage, the daily heat gains are dissipated duringthe night. The night ventilation potential is deduced fromthis energy balance: heat gains, heat storage and heat losses.Thus, the aim is to identify three characteristic buildingparameters, i.e. the solar apertureG and internal gainsQ(heat gains), the heat storage capacityC (heat storage), andthe thermal loss factorH (heat losses). These characteris-tics, the weather data and their interactions are discussed inSection 4.
In two offices, experiments were carried out in order todetermine the efficiency of night ventilation, depending onair change rate, solar and internal heat gains. During theexperiments, meteorological data, air change rates, air tem-peratures (including three-dimensional temperature field),surface temperatures (floor, ceiling, window, and internalwall) and the operative room temperature (globe thermome-ter) were measured. The experiments (one room with and
one without night ventilation) are evaluated by using botha parametric model and the ESP-r building simulationprogramme:
• The parametric model deals only with three buildingcharacteristics and few boundary data. There is a suffi-cient match between the parametric model and the mea-surements, though the model does not agree well withmeasurements at each time step. This model assumes,that the heat storage oscillates harmonically.
• The results from the building simulation match the mea-surements accurately at each time step. As the simulationprogramme deals with many input parameters, the nightventilation effect is intransparently evaluated. This modeltakes transient conditions into account.
Both the parametric model and the building simulationprovide profits and hindrances. Therefore, both models aremerged in order to develop a method for data evaluationin office buildings with night ventilation and to provide asimple model for
• comparison of different strategies (design process),• data evaluation (during initial operation),• integration into a building management system (operation
and optimisation).
As a basic principle, results from experiments in buildingscannot be reproduced, as the heat storage of the building isa transient phenomenon. Using the building simulation, themeasurements can be transferred into a harmonic oscillatingmodel. With the parametric model, thermal building charac-teristics can be deduced from the simulation results. Thus,measured data are analysed by
1. Evaluation of measured data based on standardisedgraphs and indices.
2. Sophisticated building simulation using measured dataand boundary conditions.
3. Data evaluation of the results from the building simula-tion with standardised boundary conditions using a para-metric model.
1132 J. Pfafferott et al. / Energy and Buildings 35 (2003) 1129–1143
1.3. Definition of night ventilation efficiency
Buildings with night ventilation reach lower room tem-peratures than buildings without active or passive cooling.Moreover, the maximum room temperature arrives later inthe afternoon. Both effects are caused by the additional heatloss during the night and the heat dissipation from the fabricand the ceiling, respectively.
As shown in the previous section, the contribution of nightventilation to the operative room temperature is dependenton the heat storage capacity and the heat gains. Thus, thewhole energy balance has to be taken into account thoughthis paper focuses on night ventilation. Furthermore, heatgains and losses are dependent on the user behaviour (useof sun protection and windows) and on the operation of theventilation system.
The night ventilation efficiency can be quantified by thethermodynamically cause (energy balance) and by its effect(room temperature): this paper evaluates the night ventilationefficiency with
1. the reduction of the room temperature,2. the heat dissipation by night ventilation.
2. Data evaluation of long-term measurements
The institute building of Fraunhofer ISE consists of lab-oratories and offices[1]. The current use of the building forapplied research inevitably results in a high energy demand.
Table 1Key building information’s
Gross volume (m3) 64,320Net floor area (m2) 13,150Working hours Monday to Friday (8 a.m. to 6 p.m.)Occupants Approximately 300
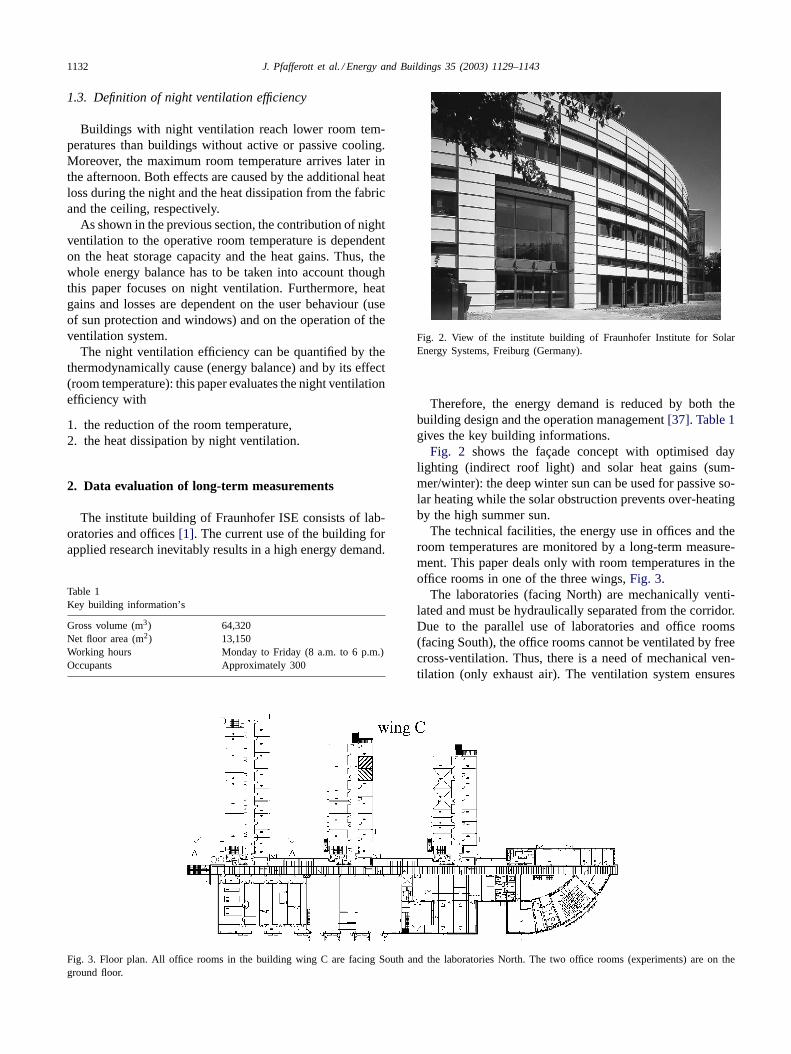
Fig. 3. Floor plan. All office rooms in the building wing C are facing South and the laboratories North. The two office rooms (experiments) are on theground floor.
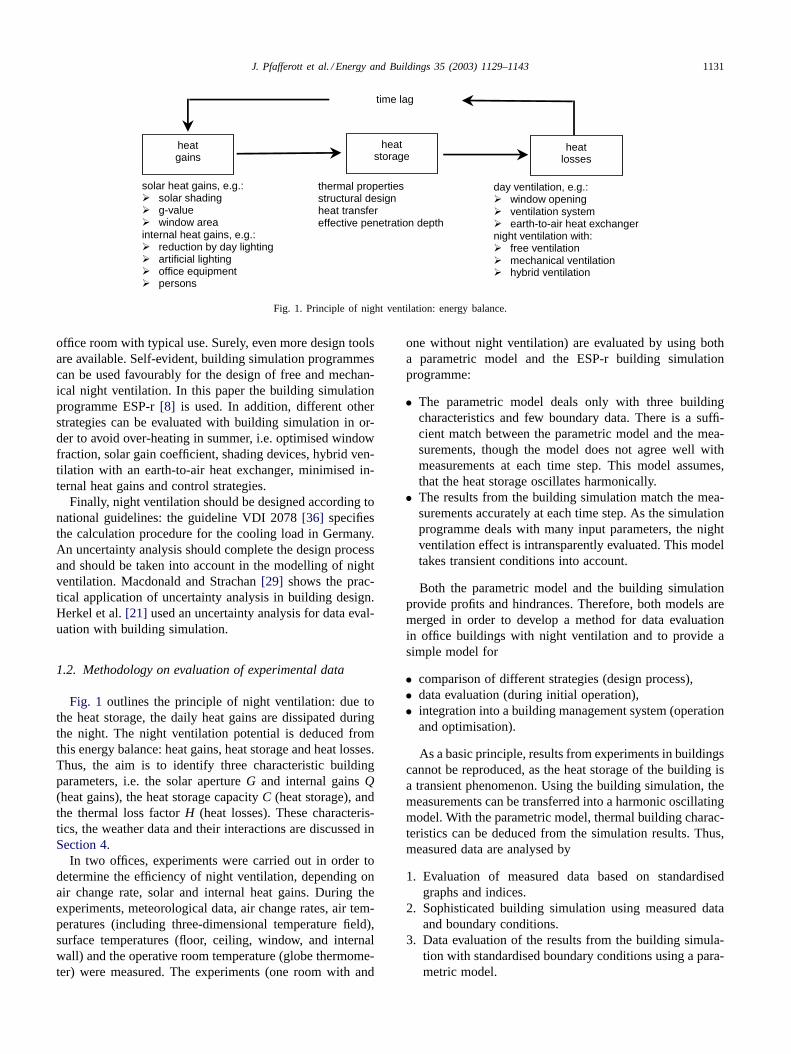
Fig. 2. View of the institute building of Fraunhofer Institute for SolarEnergy Systems, Freiburg (Germany).
Therefore, the energy demand is reduced by both thebuilding design and the operation management[37]. Table 1gives the key building informations.
Fig. 2 shows the façade concept with optimised daylighting (indirect roof light) and solar heat gains (sum-mer/winter): the deep winter sun can be used for passive so-lar heating while the solar obstruction prevents over-heatingby the high summer sun.
The technical facilities, the energy use in offices and theroom temperatures are monitored by a long-term measure-ment. This paper deals only with room temperatures in theoffice rooms in one of the three wings,Fig. 3.
The laboratories (facing North) are mechanically venti-lated and must be hydraulically separated from the corridor.Due to the parallel use of laboratories and office rooms(facing South), the office rooms cannot be ventilated by freecross-ventilation. Thus, there is a need of mechanical ven-tilation (only exhaust air). The ventilation system ensures
J. Pfafferott et al. / Energy and Buildings 35 (2003) 1129–1143 1133
exhaust air
ambient air
ventilationflaps slit valvel
windowi
variable lab ventilation
lab
officeco
rrid
or
shaf
t
heat
rec
over
y sy
stem
summer / winter bypass
openableskylight
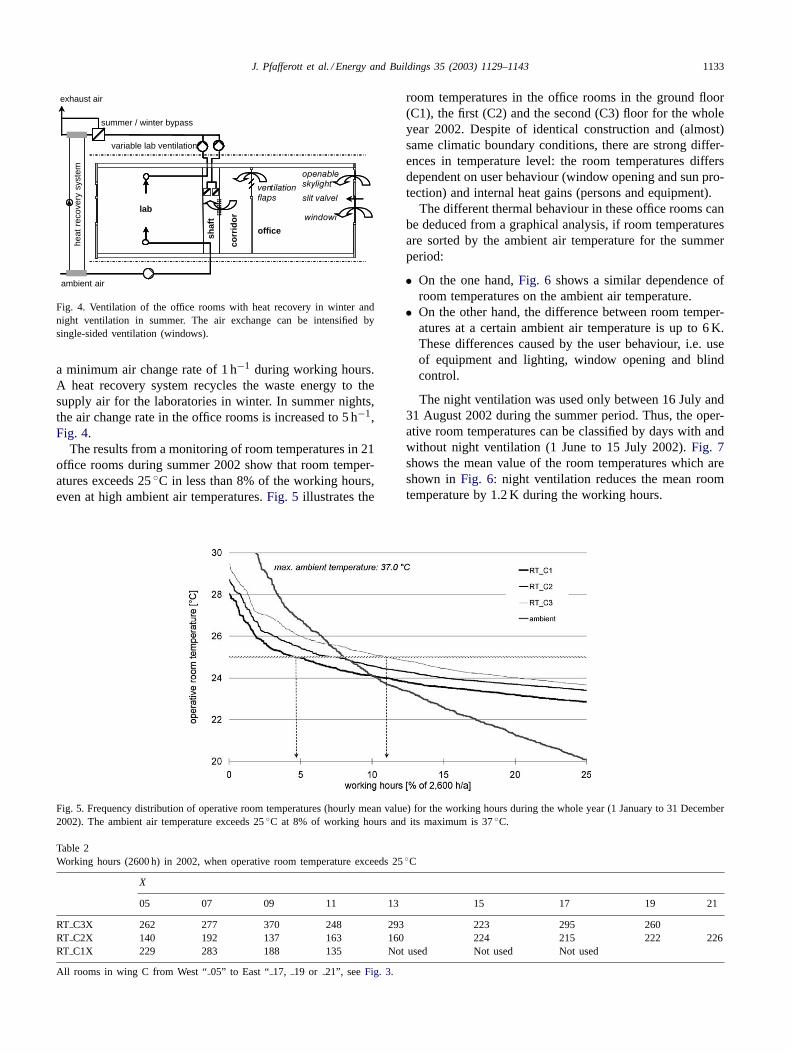
Fig. 4. Ventilation of the office rooms with heat recovery in winter andnight ventilation in summer. The air exchange can be intensified bysingle-sided ventilation (windows).
a minimum air change rate of 1 h−1 during working hours.A heat recovery system recycles the waste energy to thesupply air for the laboratories in winter. In summer nights,the air change rate in the office rooms is increased to 5 h−1,Fig. 4.
The results from a monitoring of room temperatures in 21office rooms during summer 2002 show that room temper-atures exceeds 25◦C in less than 8% of the working hours,even at high ambient air temperatures.Fig. 5 illustrates the
Fig. 5. Frequency distribution of operative room temperatures (hourly mean value) for the working hours during the whole year (1 January to 31 December2002). The ambient air temperature exceeds 25◦C at 8% of working hours and its maximum is 37◦C.
Table 2Working hours (2600 h) in 2002, when operative room temperature exceeds 25◦C
X
05 07 09 11 13 15 17 19 21
RT C3X 262 277 370 248 293 223 295 260RT C2X 140 192 137 163 160 224 215 222 226RT C1X 229 283 188 135 Not used Not used Not used
All rooms in wing C from West “05” to East “17, 19 or 21”, seeFig. 3.
room temperatures in the office rooms in the ground floor(C1), the first (C2) and the second (C3) floor for the wholeyear 2002. Despite of identical construction and (almost)same climatic boundary conditions, there are strong differ-ences in temperature level: the room temperatures differsdependent on user behaviour (window opening and sun pro-tection) and internal heat gains (persons and equipment).
The different thermal behaviour in these office rooms canbe deduced from a graphical analysis, if room temperaturesare sorted by the ambient air temperature for the summerperiod:
• On the one hand,Fig. 6 shows a similar dependence ofroom temperatures on the ambient air temperature.
• On the other hand, the difference between room temper-atures at a certain ambient air temperature is up to 6 K.These differences caused by the user behaviour, i.e. useof equipment and lighting, window opening and blindcontrol.
The night ventilation was used only between 16 July and31 August 2002 during the summer period. Thus, the oper-ative room temperatures can be classified by days with andwithout night ventilation (1 June to 15 July 2002).Fig. 7shows the mean value of the room temperatures which areshown inFig. 6: night ventilation reduces the mean roomtemperature by 1.2 K during the working hours.
1134 J. Pfafferott et al. / Energy and Buildings 35 (2003) 1129–1143
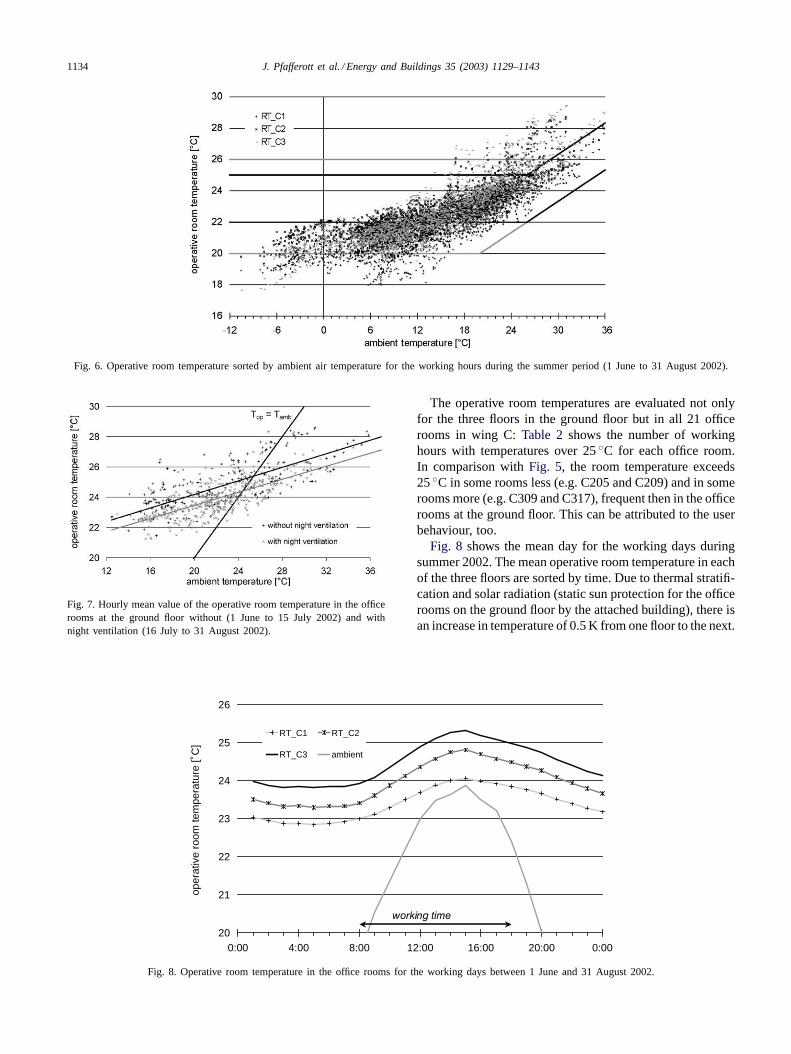
Fig. 6. Operative room temperature sorted by ambient air temperature for the working hours during the summer period (1 June to 31 August 2002).
Fig. 7. Hourly mean value of the operative room temperature in the officerooms at the ground floor without (1 June to 15 July 2002) and withnight ventilation (16 July to 31 August 2002).
20
21
22
23
24
25
26
0:00 4:00 8:00 12:00 16:00 20:00 0:00
oper
ativ
e ro
om te
mpe
ratu
re [˚
C]
RT_C1 RT_C2
RT_C3 ambient
working time
Fig. 8. Operative room temperature in the office rooms for the working days between 1 June and 31 August 2002.
The operative room temperatures are evaluated not onlyfor the three floors in the ground floor but in all 21 officerooms in wing C:Table 2shows the number of workinghours with temperatures over 25◦C for each office room.In comparison withFig. 5, the room temperature exceeds25◦C in some rooms less (e.g. C205 and C209) and in somerooms more (e.g. C309 and C317), frequent then in the officerooms at the ground floor. This can be attributed to the userbehaviour, too.
Fig. 8 shows the mean day for the working days duringsummer 2002. The mean operative room temperature in eachof the three floors are sorted by time. Due to thermal stratifi-cation and solar radiation (static sun protection for the officerooms on the ground floor by the attached building), there isan increase in temperature of 0.5 K from one floor to the next.
J. Pfafferott et al. / Energy and Buildings 35 (2003) 1129–1143 1135
2
3
4
5
6
7
12 14 16 18 20 22 24 26dayly mean ambient air temperature [˚C]
coef
ficie
nt o
f per
form
ance
[kW
h/kW
h]
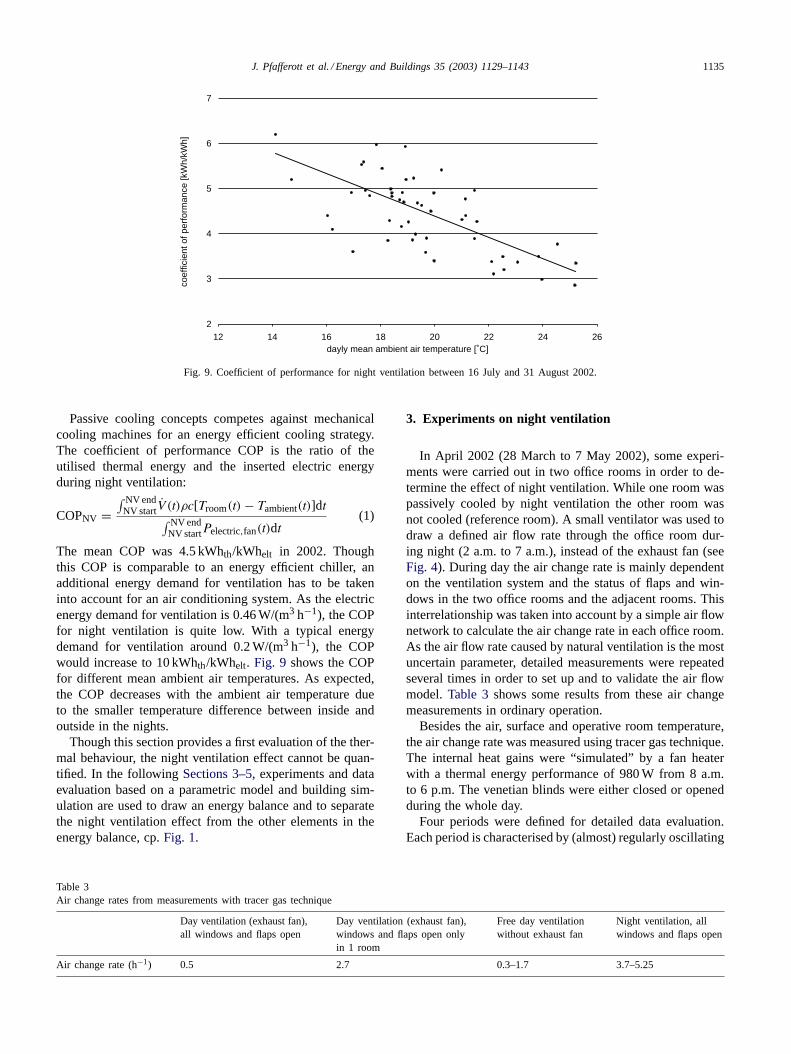
Fig. 9. Coefficient of performance for night ventilation between 16 July and 31 August 2002.
Passive cooling concepts competes against mechanicalcooling machines for an energy efficient cooling strategy.The coefficient of performance COP is the ratio of theutilised thermal energy and the inserted electric energyduring night ventilation:
COPNV =∫ NV end
NV startV̇ (t)ρc[Troom(t) − Tambient(t)]dt∫ NV endNV startPelectric,fan(t)dt
(1)
The mean COP was 4.5 kWhth/kWhelt in 2002. Thoughthis COP is comparable to an energy efficient chiller, anadditional energy demand for ventilation has to be takeninto account for an air conditioning system. As the electricenergy demand for ventilation is 0.46 W/(m3 h−1), the COPfor night ventilation is quite low. With a typical energydemand for ventilation around 0.2 W/(m3 h−1), the COPwould increase to 10 kWhth/kWhelt. Fig. 9 shows the COPfor different mean ambient air temperatures. As expected,the COP decreases with the ambient air temperature dueto the smaller temperature difference between inside andoutside in the nights.
Though this section provides a first evaluation of the ther-mal behaviour, the night ventilation effect cannot be quan-tified. In the followingSections 3–5, experiments and dataevaluation based on a parametric model and building sim-ulation are used to draw an energy balance and to separatethe night ventilation effect from the other elements in theenergy balance, cp.Fig. 1.
Table 3Air change rates from measurements with tracer gas technique
Day ventilation (exhaust fan),all windows and flaps open
Day ventilation (exhaust fan),windows and flaps open onlyin 1 room
Free day ventilationwithout exhaust fan
Night ventilation, allwindows and flaps open
Air change rate (h−1) 0.5 2.7 0.3–1.7 3.7–5.25
3. Experiments on night ventilation
In April 2002 (28 March to 7 May 2002), some experi-ments were carried out in two office rooms in order to de-termine the effect of night ventilation. While one room waspassively cooled by night ventilation the other room wasnot cooled (reference room). A small ventilator was used todraw a defined air flow rate through the office room dur-ing night (2 a.m. to 7 a.m.), instead of the exhaust fan (seeFig. 4). During day the air change rate is mainly dependenton the ventilation system and the status of flaps and win-dows in the two office rooms and the adjacent rooms. Thisinterrelationship was taken into account by a simple air flownetwork to calculate the air change rate in each office room.As the air flow rate caused by natural ventilation is the mostuncertain parameter, detailed measurements were repeatedseveral times in order to set up and to validate the air flowmodel.Table 3shows some results from these air changemeasurements in ordinary operation.
Besides the air, surface and operative room temperature,the air change rate was measured using tracer gas technique.The internal heat gains were “simulated” by a fan heaterwith a thermal energy performance of 980 W from 8 a.m.to 6 p.m. The venetian blinds were either closed or openedduring the whole day.
Four periods were defined for detailed data evaluation.Each period is characterised by (almost) regularly oscillating
1136 J. Pfafferott et al. / Energy and Buildings 35 (2003) 1129–1143
Table 4Boundary conditions and results from measurements
Period 1(31/03–08/04)
Period 2 (13/04–15/04;27/04–29/04)
Period 3(02/05–05/05)
Period 4(19/04–26/04)
Sun protection (venetian blinds) Closed Closed Closed OpenTa,m (◦C) (mean ambient air temperature) 11.31 9.42 8.5 11.97Iglobal,m (W/m2) (mean solar radiation) 204 84 52 134Qm (W) (mean internal heat gain) 408 408 408 408Office room with night ventilation Yes No Yes No Yes No Yes NoAir change rate (2 a.m. to 7 a.m.) 3.16 ≈1 5.03 ≈1 2.16 ≈1 5.03 ≈1Ti,m (◦C) (mean indoor air temperature) 21.8 22.4 21.1 22.6 20.7 22.8 21.9 22.7
climatic conditions.Table 4gives an overview over the mainexperimental set ups and boundary conditions.
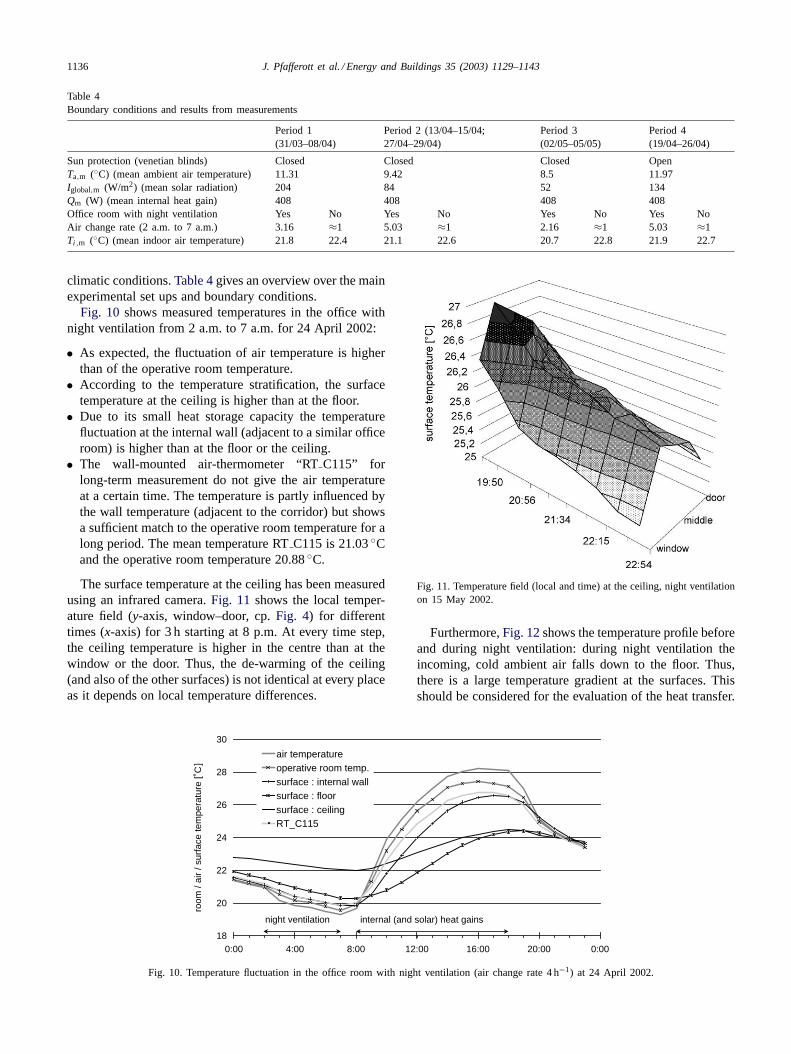
Fig. 10 shows measured temperatures in the office withnight ventilation from 2 a.m. to 7 a.m. for 24 April 2002:
• As expected, the fluctuation of air temperature is higherthan of the operative room temperature.
• According to the temperature stratification, the surfacetemperature at the ceiling is higher than at the floor.
• Due to its small heat storage capacity the temperaturefluctuation at the internal wall (adjacent to a similar officeroom) is higher than at the floor or the ceiling.
• The wall-mounted air-thermometer “RTC115” forlong-term measurement do not give the air temperatureat a certain time. The temperature is partly influenced bythe wall temperature (adjacent to the corridor) but showsa sufficient match to the operative room temperature for along period. The mean temperature RTC115 is 21.03◦Cand the operative room temperature 20.88◦C.
The surface temperature at the ceiling has been measuredusing an infrared camera.Fig. 11 shows the local temper-ature field (y-axis, window–door, cp.Fig. 4) for differenttimes (x-axis) for 3 h starting at 8 p.m. At every time step,the ceiling temperature is higher in the centre than at thewindow or the door. Thus, the de-warming of the ceiling(and also of the other surfaces) is not identical at every placeas it depends on local temperature differences.
18
20
22
24
26
28
30
0:00 4:00 8:00 12:00 16:00 20:00 0:00
room
/ ai
r / s
urfa
ce te
mpe
ratu
re [˚
C]
air temperatureoperative room temp.surface : internal wallsurface : floorsurface : ceilingRT_C115
night ventilation internal (and solar) heat gains
Fig. 10. Temperature fluctuation in the office room with night ventilation (air change rate 4 h−1) at 24 April 2002.
Fig. 11. Temperature field (local and time) at the ceiling, night ventilationon 15 May 2002.
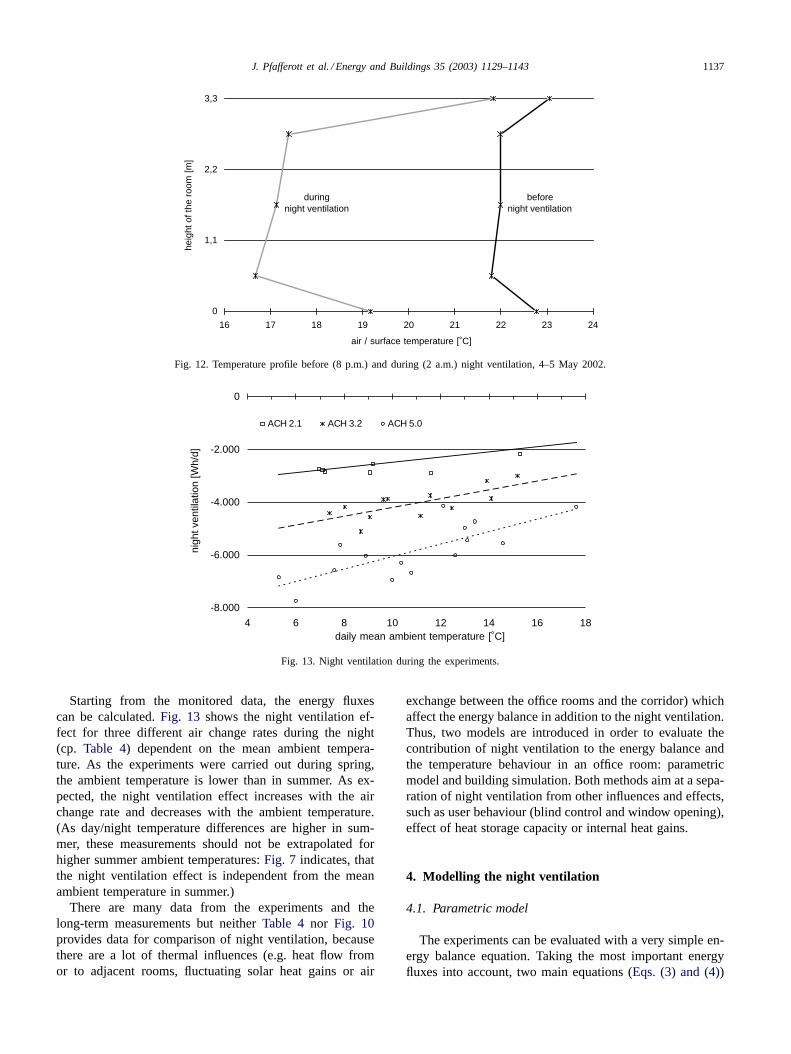
Furthermore,Fig. 12shows the temperature profile beforeand during night ventilation: during night ventilation theincoming, cold ambient air falls down to the floor. Thus,there is a large temperature gradient at the surfaces. Thisshould be considered for the evaluation of the heat transfer.
J. Pfafferott et al. / Energy and Buildings 35 (2003) 1129–1143 1137
0
1,1
2,2
3,3
16 17 18 19 20 21 22 23 24
air / surface temperature [˚C]
heig
ht o
f the
roo
m [m
]during
night ventilationbefore
night ventilation
Fig. 12. Temperature profile before (8 p.m.) and during (2 a.m.) night ventilation, 4–5 May 2002.
-8.000
-6.000
-4.000
-2.000
0
4 6 8 10 12 14 16daily mean ambient temperature [˚C]
nigh
t ven
tilat
ion
[Wh/
d]
18
ACH 2.1 ACH 3.2 ACH 5.0
Fig. 13. Night ventilation during the experiments.
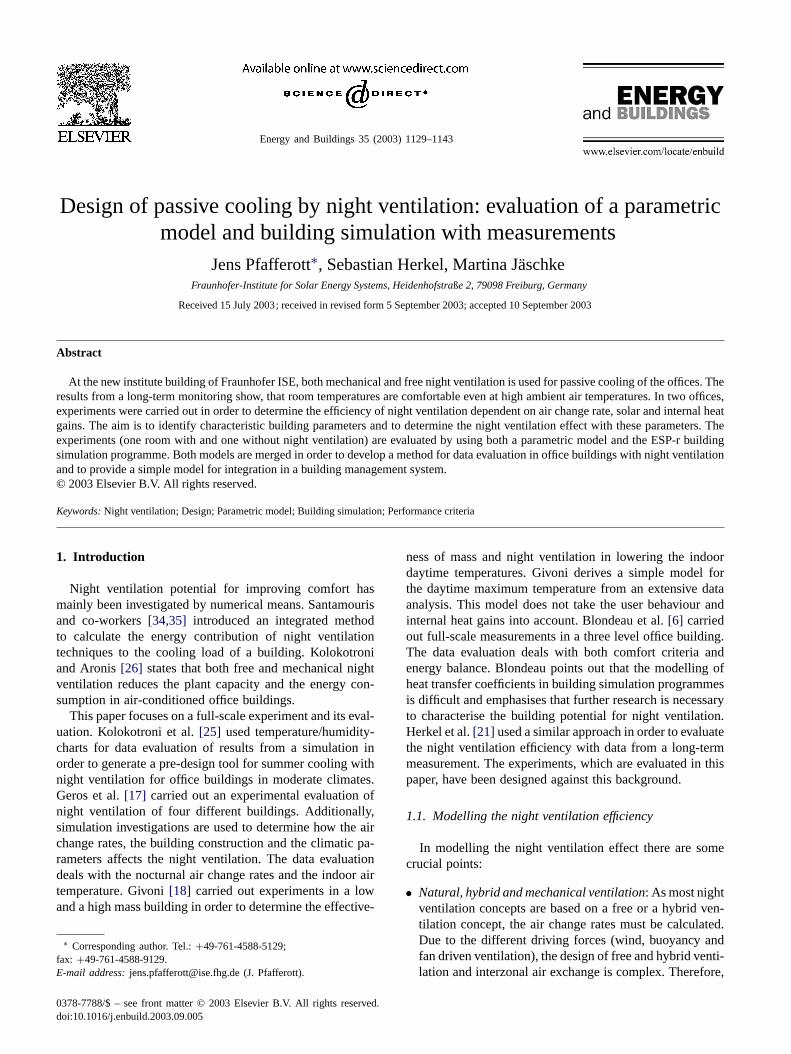
Starting from the monitored data, the energy fluxescan be calculated.Fig. 13 shows the night ventilation ef-fect for three different air change rates during the night(cp. Table 4) dependent on the mean ambient tempera-ture. As the experiments were carried out during spring,the ambient temperature is lower than in summer. As ex-pected, the night ventilation effect increases with the airchange rate and decreases with the ambient temperature.(As day/night temperature differences are higher in sum-mer, these measurements should not be extrapolated forhigher summer ambient temperatures:Fig. 7 indicates, thatthe night ventilation effect is independent from the meanambient temperature in summer.)
There are many data from the experiments and thelong-term measurements but neitherTable 4 nor Fig. 10provides data for comparison of night ventilation, becausethere are a lot of thermal influences (e.g. heat flow fromor to adjacent rooms, fluctuating solar heat gains or air
exchange between the office rooms and the corridor) whichaffect the energy balance in addition to the night ventilation.Thus, two models are introduced in order to evaluate thecontribution of night ventilation to the energy balance andthe temperature behaviour in an office room: parametricmodel and building simulation. Both methods aim at a sepa-ration of night ventilation from other influences and effects,such as user behaviour (blind control and window opening),effect of heat storage capacity or internal heat gains.
4. Modelling the night ventilation
4.1. Parametric model
The experiments can be evaluated with a very simple en-ergy balance equation. Taking the most important energyfluxes into account, two main equations (Eqs. (3) and (4))
1138 J. Pfafferott et al. / Energy and Buildings 35 (2003) 1129–1143
can be derived to calculate the mean air temperatureTi,m andits fluctuation�Ti according to Keller’s approach[22]. Incase all boundary conditions oscillate regularly, the variationof temperature with time can be approximated byEq. (2):
Ti(t) = Ti,m + �Ti sin(ωt) (2)
Ti,m = Ta,m + GIm + Qm/Aext.wall
H(3)
�Ti = T
2πτ·(
�Ta + G �I + �Q
H
)with τ ≈ C
K(4)
In this paper, the data evaluated focus on the mean air tem-perature (Eq. (3)) and the energy balance for certain periodsduring the experiments. These periods are characterised bythe mean ambient air temperatureTa,m, the mean global so-lar radiation on the surfaceIm, and the mean internal heatgainQm. All heat fluxes are related to the external wall area.
The thermal loss factorH (with the surface areaA of theexternal wall in m2, rate ACH in h−1 and air volumeV inm3, all thermal properties in SI units), the solar apertureG(with the surface areaA of transparent surfaces in m2 andtheir total solar energy transmittanceg), and the heat storagecapacityC (with the thickness and the thermal properties ofthe fabric in SI units, the time periodT = 24 h, and the Biotnumber) are defined as:
H = 1
Aext.wall
[n∑
i=1
Aext.wall,iUi + ACH · V(cρ)air
3600
](5)
G = 1
Aext.wall
k∑i=1
Atrans.surface,igi (6)
C = cρdeff with deff =√
T
2π
λ
cρC′(Bi, d) (7)
The thermally effective thicknessdeff is dependent on thethermal penetration depth and the heat transfer at the surfaceC′. The calculation procedure can be taken from[7]. Thefloor area is 18.4 m2, the external wall area 12.4 m2 and thegross volume 60.6 m3.
As this model is based on a harmonic oscillating heat bal-ance, some simplifications are considered: (1) the total solarenergy transmittanceg is independent from the incident an-gle, (2) variable shading is not taken into account, (3) con-stant air change rates, (4) no transient thermal behaviour, (5)fixed heat transfer coefficients, (6) no time shift between am-bient air temperature and solar radiation, (7) user behaviouris calculated by a standardised time profile dependent on theworking time, e.g. time profiles in[22] based on a Fourieranalysis, (8) there is no solar radiation on external walls and(9) no heat flux through internal walls. (10) As night venti-lation operates with an high air change rate during night anda lower air change rate during working hours, a variable airchange rate inEq. (5) necessarily has to be taken into ac-count: the variation of the air change rate is much higher in
Table 5Comparison for the air temperature according toEq. (2) from the mea-surement and the parametric model
Air change rate Period 1(3.16 h−1)
Period 3(2.16 h−1)
Period 4(5.03 h−1)
Meas Calc Meas Calc Meas Calc
Ti,m (◦C) 21.3 21.4 21.2 20.8 22.0 21.9�Ti (K) 4.1 2.9 4.0 3.5 2.9 2.0
the room with night ventilation (day: approximately 1 h−1,night: maximum 5 h−1) than in the room without night ven-tilation (around 1 h−1). While a constant temperature dif-ference between inside and outside is assumed, a thermallyeffective air change rate ACHeff should be calculated fromhourly data by:
ACHeff =∑24
t=1[ACH t(Ti,t − Ta,t)]∑24t=1(Ti,t − Ta,t)
(8)
Table 5compares the mean temperature and the temperatureamplitude from measurements (usingEq. (2) for parameteridentification) with the results from the parametric model(usingEqs. (3) and (4)) for three of the four periods, whichare defined inTable 4.
The parametric model fits better for the mean tempera-ture than for the temperature amplitude: while the energybalance (mean temperature) can be calculated accurately,the modelling of the heat storage capacity (temperatureamplitude) is uncertain due to the calculation procedure forharmonically oscillating temperatures (Eq. (7)), local tem-perature gradients (cp.Fig. 11) and uncertain heat transfercoefficients (cp.Fig. 12).
Though there are differences between measurement andcalculation, the parametric model can be used in principle.As the heat balance is calculated dynamically by the buildingsimulation program, a higher accuracy for the temperatureamplitude can be reached by the use of a building simulation.
4.2. Building simulation
The ESP-r simulation program, version 4.37a of June2002[8] was used for data evaluation, apart from the para-metric model. All input parameters and boundary conditions(i.e. climate, blind control, air flow rates, internal heat gains,user behaviour) are well known.
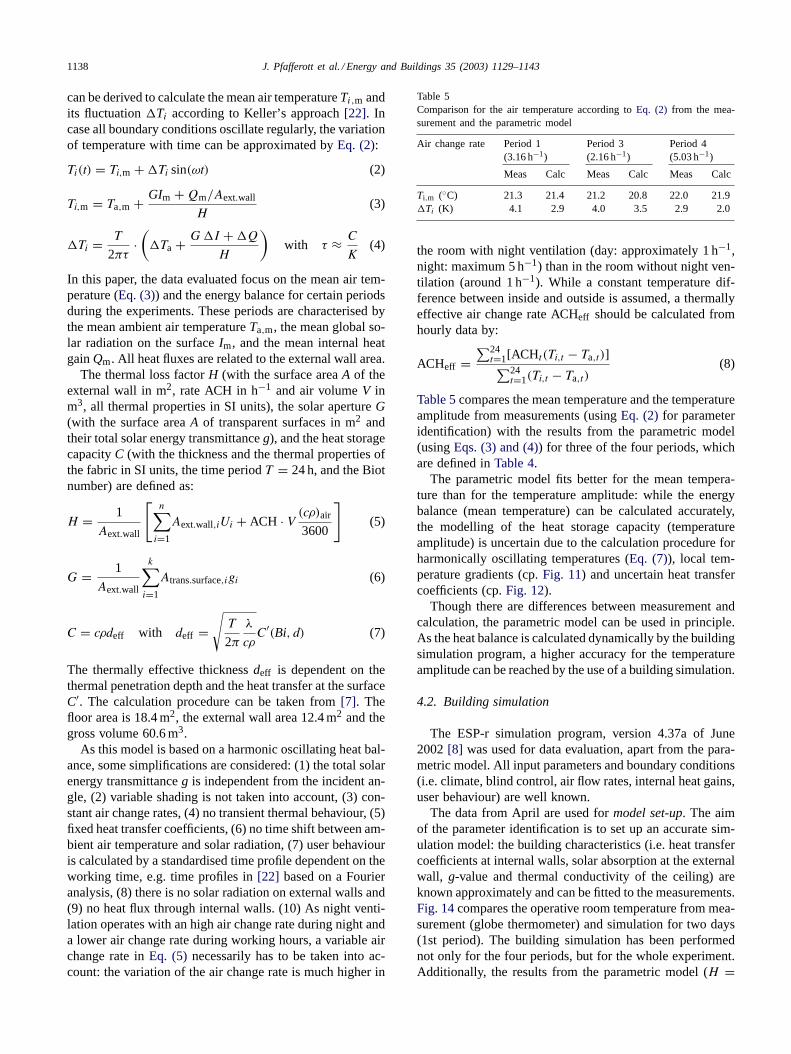
The data from April are used formodel set-up. The aimof the parameter identification is to set up an accurate sim-ulation model: the building characteristics (i.e. heat transfercoefficients at internal walls, solar absorption at the externalwall, g-value and thermal conductivity of the ceiling) areknown approximately and can be fitted to the measurements.Fig. 14compares the operative room temperature from mea-surement (globe thermometer) and simulation for two days(1st period). The building simulation has been performednot only for the four periods, but for the whole experiment.Additionally, the results from the parametric model (H=
J. Pfafferott et al. / Energy and Buildings 35 (2003) 1129–1143 1139
16
18
20
22
24
26
28
144 192hour of experiment (03/04/02 - 04/04/02)
oper
ativ
e ro
om te
mpe
ratu
re [˚
C]
measurement simulation parametric model
Fig. 14. Parameter identification with measurements from the experiments in April 2002: variation of temperature with time for two days: measurements,simulation and parametric model (withH, G and C calculated for the 1st period of experiment in April 2002,Table 4).
4.0 W/(m2 K), G = 0.046 andτ = 22 h for the 1st period)are shown.
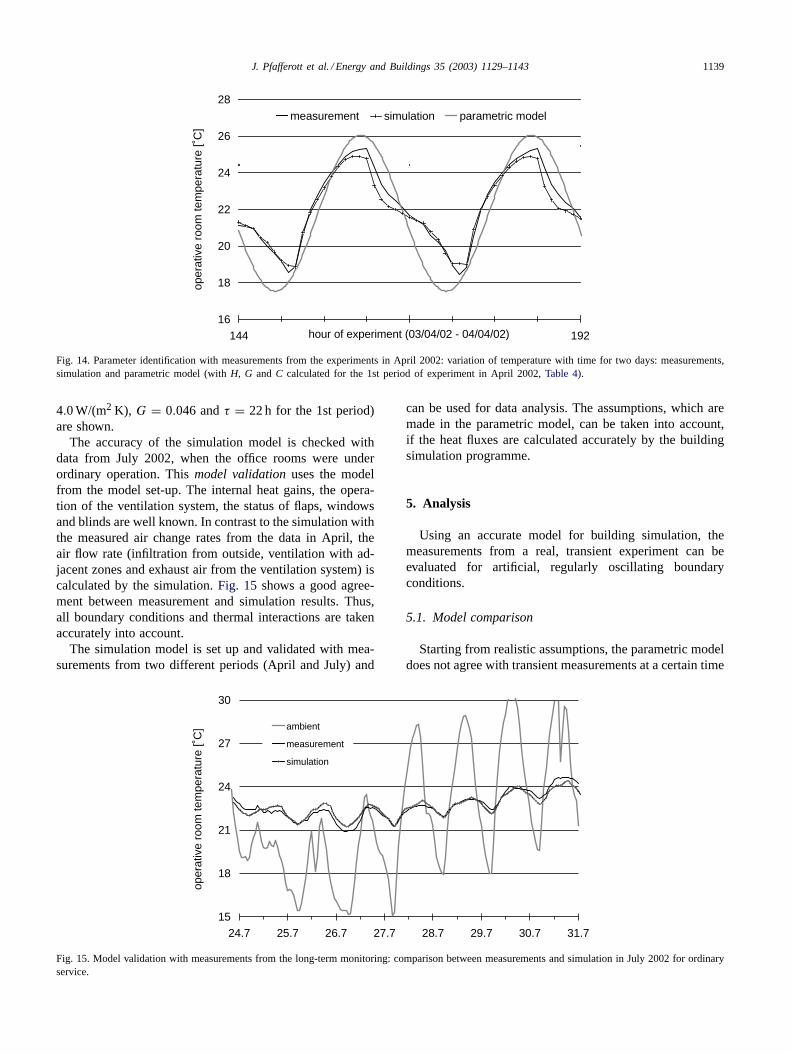
The accuracy of the simulation model is checked withdata from July 2002, when the office rooms were underordinary operation. Thismodel validation uses the modelfrom the model set-up. The internal heat gains, the opera-tion of the ventilation system, the status of flaps, windowsand blinds are well known. In contrast to the simulation withthe measured air change rates from the data in April, theair flow rate (infiltration from outside, ventilation with ad-jacent zones and exhaust air from the ventilation system) iscalculated by the simulation.Fig. 15 shows a good agree-ment between measurement and simulation results. Thus,all boundary conditions and thermal interactions are takenaccurately into account.
The simulation model is set up and validated with mea-surements from two different periods (April and July) and
15
18
21
24
27
30
24.7 25.7 26.7 27.7 28.7 29.7 30.7 31.7
oper
ativ
e ro
om te
mpe
ratu
re [˚
C] ambient
measurement
simulation
Fig. 15. Model validation with measurements from the long-term monitoring: comparison between measurements and simulation in July 2002 for ordinaryservice.
can be used for data analysis. The assumptions, which aremade in the parametric model, can be taken into account,if the heat fluxes are calculated accurately by the buildingsimulation programme.
5. Analysis
Using an accurate model for building simulation, themeasurements from a real, transient experiment can beevaluated for artificial, regularly oscillating boundaryconditions.
5.1. Model comparison
Starting from realistic assumptions, the parametric modeldoes not agree with transient measurements at a certain time
1140 J. Pfafferott et al. / Energy and Buildings 35 (2003) 1129–1143
Table 6Model comparison for the thermal loss factorH between the parametricmodel and simulation
Air change rate (h−1)
0 1 4 8
H from parametric model withEq. (5) 1.3 2.95 8.0 14.5H from simulation withEq. (3) 1.3 2.9 7.9 13.2
step while the building simulation shows a sufficient agree-ment with measured temperatures.
As the parametric model deals with simplified assump-tions, the accuracy of the parametric model and the buildingsimulation should be checked. The comparison is based onthe office room,Fig. 4. If (1) solar heat gains are ignored,(2) internal heat gains and (3) air change rate are consideredto be constant during the day, and (4) the ambient temper-ature oscillates regularly, then both models will result in asimilar conclusion:
• The parametric model overestimates the thermal loss fac-tor H by about 0–10%,Table 6.
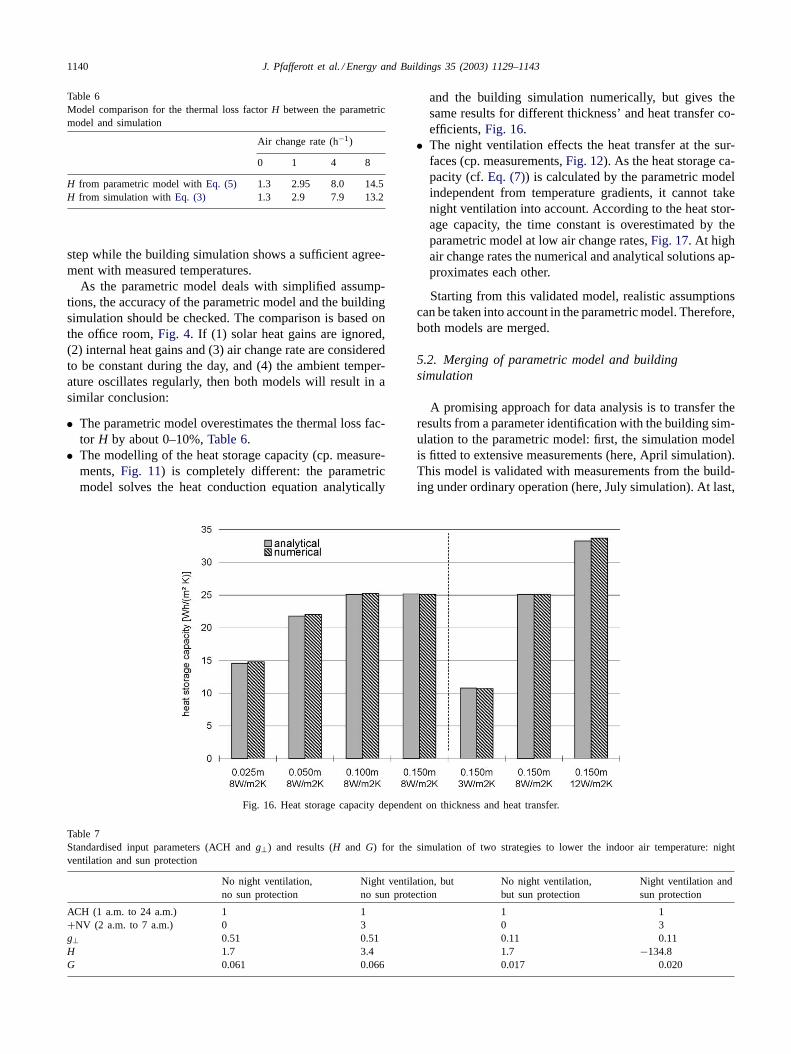
• The modelling of the heat storage capacity (cp. measure-ments,Fig. 11) is completely different: the parametricmodel solves the heat conduction equation analytically
Fig. 16. Heat storage capacity dependent on thickness and heat transfer.
Table 7Standardised input parameters (ACH andg⊥) and results (Hand G) for the simulation of two strategies to lower the indoor air temperature: nightventilation and sun protection
No night ventilation,no sun protection
Night ventilation, butno sun protection
No night ventilation,but sun protection
Night ventilation andsun protection
ACH (1 a.m. to 24 a.m.) 1 1 1 1+NV (2 a.m. to 7 a.m.) 0 3 0 3g⊥ 0.51 0.51 0.11 0.11H 1.7 3.4 1.7 −134.8G 0.061 0.066 0.017 0.020
and the building simulation numerically, but gives thesame results for different thickness’ and heat transfer co-efficients,Fig. 16.
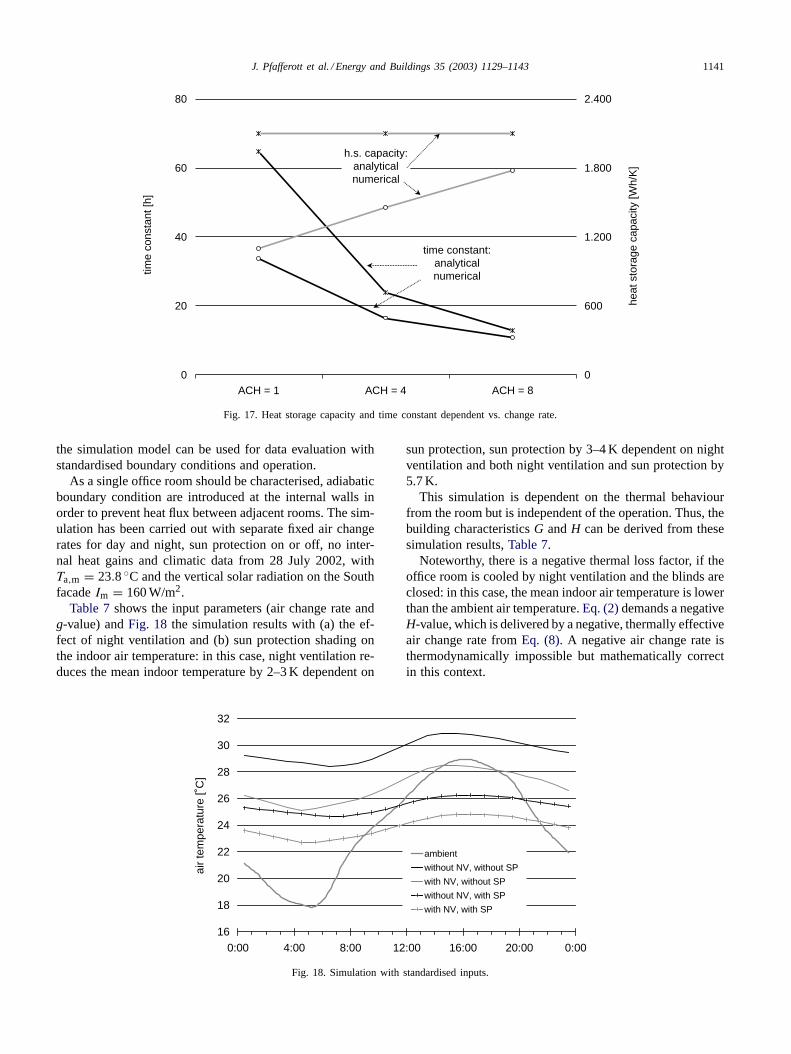
• The night ventilation effects the heat transfer at the sur-faces (cp. measurements,Fig. 12). As the heat storage ca-pacity (cf.Eq. (7)) is calculated by the parametric modelindependent from temperature gradients, it cannot takenight ventilation into account. According to the heat stor-age capacity, the time constant is overestimated by theparametric model at low air change rates,Fig. 17. At highair change rates the numerical and analytical solutions ap-proximates each other.
Starting from this validated model, realistic assumptionscan be taken into account in the parametric model. Therefore,both models are merged.
5.2. Merging of parametric model and buildingsimulation
A promising approach for data analysis is to transfer theresults from a parameter identification with the building sim-ulation to the parametric model: first, the simulation modelis fitted to extensive measurements (here, April simulation).This model is validated with measurements from the build-ing under ordinary operation (here, July simulation). At last,
J. Pfafferott et al. / Energy and Buildings 35 (2003) 1129–1143 1141
0
20
40
60
80
ACH = 1 ACH = 4 ACH = 8
time
cons
tant
[h]
0
600
1.200
1.800
2.400
heat
sto
rage
cap
acity
[Wh/
K]
time constant:analyticalnumerical
h.s. capacity:analyticalnumerical
Fig. 17. Heat storage capacity and time constant dependent vs. change rate.
the simulation model can be used for data evaluation withstandardised boundary conditions and operation.
As a single office room should be characterised, adiabaticboundary condition are introduced at the internal walls inorder to prevent heat flux between adjacent rooms. The sim-ulation has been carried out with separate fixed air changerates for day and night, sun protection on or off, no inter-nal heat gains and climatic data from 28 July 2002, withTa,m = 23.8◦C and the vertical solar radiation on the SouthfacadeIm = 160 W/m2.
Table 7shows the input parameters (air change rate andg-value) andFig. 18 the simulation results with (a) the ef-fect of night ventilation and (b) sun protection shading onthe indoor air temperature: in this case, night ventilation re-duces the mean indoor temperature by 2–3 K dependent on
16
18
20
22
24
26
28
30
32
0:00 4:00 8:00 12:00 16:00 20:00 0:00
air
tem
pera
ture
[˚C
]
ambient
without NV, without SP
with NV, without SP
without NV, with SP
with NV, with SP
Fig. 18. Simulation with standardised inputs.
sun protection, sun protection by 3–4 K dependent on nightventilation and both night ventilation and sun protection by5.7 K.
This simulation is dependent on the thermal behaviourfrom the room but is independent of the operation. Thus, thebuilding characteristicsG andH can be derived from thesesimulation results,Table 7.
Noteworthy, there is a negative thermal loss factor, if theoffice room is cooled by night ventilation and the blinds areclosed: in this case, the mean indoor air temperature is lowerthan the ambient air temperature.Eq. (2)demands a negativeH-value, which is delivered by a negative, thermally effectiveair change rate fromEq. (8). A negative air change rate isthermodynamically impossible but mathematically correctin this context.
1142 J. Pfafferott et al. / Energy and Buildings 35 (2003) 1129–1143
6. Conclusions
The building simulation provides accurate results, if theinput parameters and boundary conditions are well known.However, user behaviour results in energy and temperaturevariations which are of the same order of magnitude as theeffect of different design decisions and operation strategies,respectively. There are two ways to manage these variationswith a probabilistic approach and uncertainty analysis:
• Macdonald and Strachan[29] provides an algorithm forboth differential sensitivity analysis and Monte Carlo anal-ysis: if an extensive building simulation is performed theeffect of each varied parameter on the energy balance andthe thermal behaviour can be deduced during the designphase.
• Herkel and Pfafferott[21] carried out a data evaluationusing a Monte Carlo simulation.
Statistically distributed events (i.e. user behaviour) andtransient phenomena affects the energy balance and the in-door temperatures in buildings. Thus, the data evaluation ofmeasurements in buildings under ordinary operation is diffi-cult. The presented parametric model focuses on main build-ing characteristics and provides a simplified thermal modelwhich can be used advantageously for data evaluation.
With this model, the thermal behaviour of a building andits energy demand can be characterised independently ofuser behaviour but dependent on day and night ventilationor operation (e.g. blind control).
An accurate parametric model can be deduced from aprocedure in three steps:
1. Short-term measurements (weather, indoor air, surfaceand operative room temperatures, air change rate, sunprotection, internal gains, occupancy).
2. The thermal behaviour is simulated by a sophisticatedbuilding simulation with the short-term measurementsas input data and known material properties (g-value,U-value, thermal properties).
3. The main building characteristics are derived from thevalidated simulation model with standardised weatherdata, operation and user behaviour.
In the context of quality assurance, the presented method(measurement–simulation–building characteristics) can beused in order to check
• whether the original design ideas were realised or not,• whether control strategies (i.e. night ventilation and/or sun
protection) are realised properly.
Moreover, the simplified parametric model can be inte-grated into (predictive) controller for time and temperaturecontrolled ventilation strategies.
During the design phase, different design decisions froma building simulation can be evaluated by these buildingcharacteristics in order to compare different techniques foravoiding over-heating in passively cooled buildings.
Acknowledgements
The research has been funded by the German Min-istry of Economy and Technology under the referenceO335006O. The building has been designed and realisedand is monitored for a long period in the framework of theGerman research programme on solar optimised buildings,“SolarBau”.
SolarBau:Monitor[1] as the related accompanying projectdocuments and analyses all SolarBau-projects. This dataevaluation has been done in the sub-project MessISE underthe reference O335006X.
References
[1] http://www.solarbau.de/englishversion/doku/proj04/index.htm.[2] F. Alamdari, G. Hammond, Improved data correlations for buoyancy-
driven convection in rooms, Building Service and Engineering Re-search Technology 4 (1983).
[3] F. Allard, Y. Utsumi, Airflow through large openings, Energy andBuildings 18 (1992).
[4] R. Aynsley, A resistance approach to analysis of natural ventilationairflow networks, Journal of Wind Engineering and Industrial Aero-dynamics 67 (1997).
[5] H. Awbi, Air movement in naturally-ventilated buildings, RenewableEnergy 8 (1996).
[6] P. Blondeau, M. Sperandio, F. Allard, Night ventilation for buildingcooling in summer, Soar Energy 61 (5) 1997.
[7] H. Carslaw, J. Jaeger, Conduction of Heat in Solids, Oxford Univer-sity Press, Oxford, 1988.
[8] J. Clarke, Energy Simulation in Building Design, second ed.,Butterworth-Heinemann, London, 2001.
[9] E. Dascalaki, M. Santamouris, C. Balaras, D. Asimakopoulos, Naturalconvection heat transfer coefficients from vertical and horizontalsurfaces for building applications, Energy and Buildings 20 (1994).
[10] P. Deutscher, M. Elsberger, L. Rouvel, Sommerlicher Wärmeschutz:Eine einheitliche Methodik für die Anforderungen an den winter-lichen und sommerlichen Wärmeschutz, Bauphysik Heft 2+ 3, 2000(in German).
[11] DIN 1946: Raumlufttechnik (Teil 2: GesundheitstechnischeAnforderungen), Deutsches Institut für Normung e.V., 1994(in German).
[12] M. Eftekhari, D. Pinnock, Natural ventilation: airflow measurementsin a lightweight test room, Building Service and Engineering Re-search Technology 19 (1998).
[13] EN ISO 13786: Thermal Performance of Building Components—Dynamic Thermal Characteristics—Calculation Method, EuropeanCommittee for Standardization, 1999.
[14] H. Feustel, J. Dieris, A survey of airflow models for multizonestructures, Energy and Buildings 18 (1992).
[15] F. Flourentzou, J. van der Maas, C. Roulet, Natural ventilation forpassive cooling: measurement of discharge coefficients, Energy andBuildings 27 (1998).
[16] Fraunhofer ISE, User Acceptance in Office Buildings—A Sur-vey in the Framework of the German Support Programme Solar-Bau:Monitor, 2003, unpublished.
[17] V. Geros, M. Santamouris, A. Tsangrasoulis, G. Guarracino, Ex-perimental evaluation of night ventilation phenomena, Energy andBuildings 29 (1999).
[18] B. Givoni, Effectiveness of mass and night ventilation in loweringthe indoor daytime temperatures, Energy and Buildings 28 (1998).
[19] G. Hauser, F. Otto, Gewinne und Verluste, db 4/2000 (in German).
J. Pfafferott et al. / Energy and Buildings 35 (2003) 1129–1143 1143
[20] P. Heiselberg (Ed.), Principles of hybrid ventilation, IEA-ECBCSAnnex 35, Hybrid Ventilation in New and Retrofitted Office Build-ings, Aalborg University, Denmark, 2002.
[21] S. Herkel, J. Pfafferott, M. Wambsganß, Design, monitoring andevaluation of a low energy office building with passive cool-ing by night ventilation, Proc. EPIC and AIVC Conference 2002,Lyon.
[22] B. Keller, Klimagerechtes Bauen, Teubner, Stuttgart, 1997(in German).
[23] W. Kempton, D. Feuermann, A. McGarity, I always turn it on super:user decisions about when and how to operate room air conditioners,Energy and Buildings 18 (1992).
[24] A. Khalifa, R. Marshall, Validation of heat transfer coefficients oninterior building surfaces using a real-sized indoor test cell, Interna-tional Journal of Heat and Mass Transfer 33 (10) (1990).
[25] M. Kolokotroni, B. Webb, S. Hayes, Summer cooling with nightventilation for office buildings in moderate climates, Energy andBuildings 27 (1998).
[26] M. Kolokotroni, A. Aronis, Cooling-energy reduction in air-conditioned offices by using night ventilation, Applied Energy 63(1999).
[27] M. Kolokotroni, R. Watkins, M. Santamouris, K. Niachou, F. Al-lard, R. Belarbi, C. Ghiaus, S. Alvarez, J. Salmeron-Lissen, Passiveventilation cooling in urban buildings: an estimation of potential en-vironmental impact benefits, in: Proceedings of the EPIC and AIVCConference 2002.
[28] M. Koschenz, V. Dorer, Interaction of an air system with concretecore conditioning, Energy and Buildings 30 (1999).
[29] I. Macdonald, P. Strachan, Practical application of uncertainty anal-ysis, Energy and Buildings 33 (2001).
[30] NatVent, The NatVent programme 1.0, J&W Consulting Engineers,Sweden, 1998.
[31] F. Nicol, Editorial: Special issue on thermal comfort standards, En-ergy and Building 34 (2002).
[32] C. Roulet, J. van der Maas, F. Flourentzou, A planning tool for passivecooling of buildings, Solar energy and building physics laboratory,Swiss Federal Institute of Technology, Lausanne, Switzerland, 1994.
[33] P. Rousseau, E. Mathews, A new integrated design tool for naturallyventilated buildings, Energy and Buildings 23 (1996).
[34] M. Santamouris, G. Mihalakakou, A. Argiriou, D. Asimakopoulos,On the efficiency of night ventilation techniques for thermostaticallycontrolled buildings, Solar Energy 56 (6) (1996).
[35] M. Santamouris, G. Mihalakakou, D. Asimakopoulos, On the cou-pling of thermostatically controlled buildings with ground and nightventilation passive dissipation techniques, Solar Energy 60 (3–4)(1997).
[36] VDI 2078: Berechnung der Kühllast klimatisierter Räume, VereinDeutscher Ingenieure, 1994 (in German).
[37] K. Voss, Toward lean buildings—examples and experience froma German demonstration program for energy efficiency and solarenergy use in commercial buildings, in: Proceedings of EUROSUN2000, Copenhagen.
[38] J. Yam, Y. Li, Z. Zheng, Nonlinear coupling between mass andnatural ventilation in buildings, International Journal of Heat andMass Transfer 46 (2003).
[39] O. Zeidler, Grenzen der thermischen Last bei Fensterlüftung in Büro-gebäuden, Fortschrittsberichte VDI Reihe 19, Nr. 134, VDI-Verlag,2001 (in German).
[40] M. Zimmermann, Handbuch der passiven Raumkühlung, EMPA,Dübendorf, Switzerland, 1999 (in German).