Embed Size (px)
Citation preview
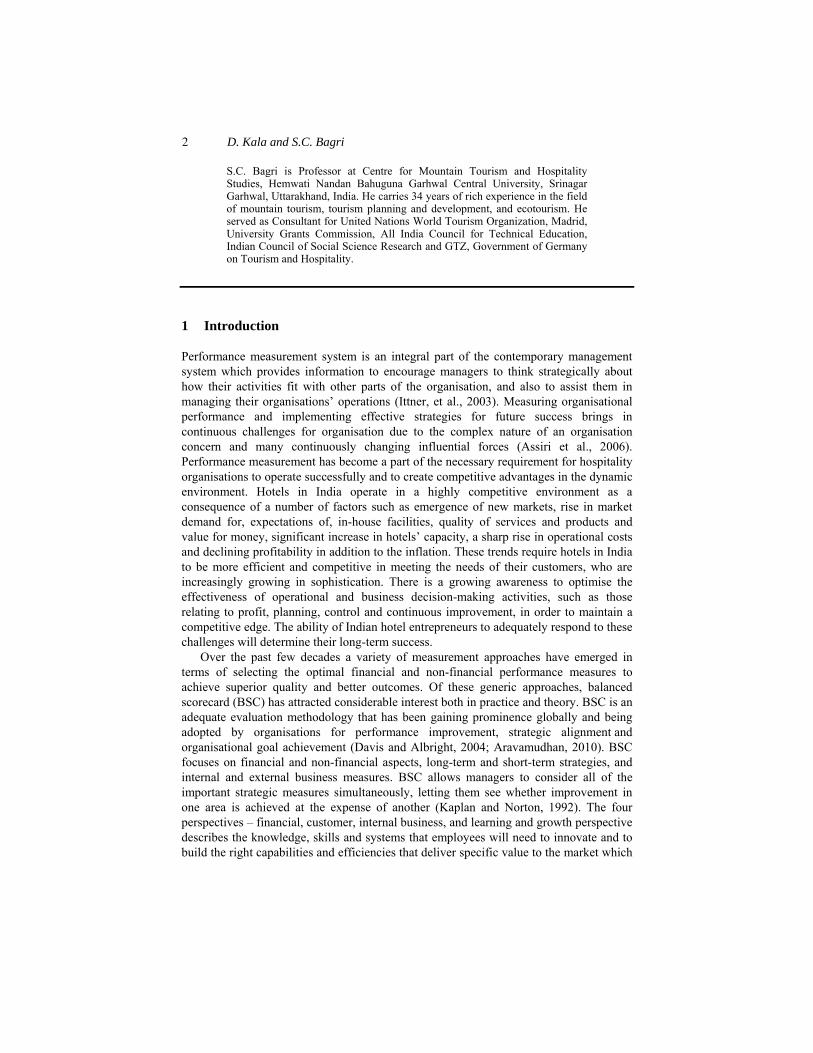
Int. J. Business Excellence, Vol. X, No. Y, xxxx 1
Copyright © 20XX Inderscience Enterprises Ltd.
Designing the strategy map for hotels with key performance indicators of balanced scorecard using DEMATEL technique
Devkant Kala* Department of Management, Himgiri Zee University, Dehradun, Uttarakhand, India Email: [email protected] *Corresponding author
S.C. Bagri Centre for Mountain Tourism and Hospitality Studies, HNB Garhwal Central University, Srinagar Garhwal, Uttarakhand, 246174, India Email: [email protected]
Abstract: Performance measurement has become a part of the necessary requirement for hotels to operate successfully and to create competitive advantages in the dynamic environment. Balanced scorecard (BSC), a system which enables organisations to measure and manage corporate performance, has attracted much attention by researchers and practitioners as a method of integrating financial and non-financial performance measures. The present study attempts to design the strategy map for hotels using key performance indicators from BSC perspective. The decision making trial and evaluation laboratory (DEMATEL) method is utilised to determine relationships between the performance indicators and to construct a strategy map with logical links to improve hotel performance. The constructed strategy map using DEMATEL technique would help hotel entrepreneurs and managers in investing valuable resources, prioritising performance indicators and making effective strategic initiatives to improve organisational performance. The present study also reveals that although financial indicators are important, the focus on non-financial indicators may offer greater opportunities for measuring the hotel effectiveness in the long term.
Keywords: strategy map; balanced scorecard; BSC; key performance indicators; KPIs; decision making trial and evaluation laboratory method; hotel.
Reference to this paper should be made as follows: Kala, D. and Bagri, S.C. (xxxx) ‘Designing the strategy map for hotels with key performance indicators of balanced scorecard using DEMATEL technique’, Int. J. Business Excellence, Vol. X, No. Y, pp.xxx–xxx.
Biographical notes: Devkant Kala is Assistant Professor of Department of Management, Himgiri Zee University, Dehradun. Currently, he is pursuing his PhD in Marketing from Uttarakhand Technical University, Dehradun, India. His research interests focus on performance measurement, marketing and general management.
2 D. Kala and S.C. Bagri
S.C. Bagri is Professor at Centre for Mountain Tourism and Hospitality Studies, Hemwati Nandan Bahuguna Garhwal Central University, Srinagar Garhwal, Uttarakhand, India. He carries 34 years of rich experience in the field of mountain tourism, tourism planning and development, and ecotourism. He served as Consultant for United Nations World Tourism Organization, Madrid, University Grants Commission, All India Council for Technical Education, Indian Council of Social Science Research and GTZ, Government of Germany on Tourism and Hospitality.
1 Introduction
Performance measurement system is an integral part of the contemporary management system which provides information to encourage managers to think strategically about how their activities fit with other parts of the organisation, and also to assist them in managing their organisations’ operations (Ittner, et al., 2003). Measuring organisational performance and implementing effective strategies for future success brings in continuous challenges for organisation due to the complex nature of an organisation concern and many continuously changing influential forces (Assiri et al., 2006). Performance measurement has become a part of the necessary requirement for hospitality organisations to operate successfully and to create competitive advantages in the dynamic environment. Hotels in India operate in a highly competitive environment as a consequence of a number of factors such as emergence of new markets, rise in market demand for, expectations of, in-house facilities, quality of services and products and value for money, significant increase in hotels’ capacity, a sharp rise in operational costs and declining profitability in addition to the inflation. These trends require hotels in India to be more efficient and competitive in meeting the needs of their customers, who are increasingly growing in sophistication. There is a growing awareness to optimise the effectiveness of operational and business decision-making activities, such as those relating to profit, planning, control and continuous improvement, in order to maintain a competitive edge. The ability of Indian hotel entrepreneurs to adequately respond to these challenges will determine their long-term success.
Over the past few decades a variety of measurement approaches have emerged in terms of selecting the optimal financial and non-financial performance measures to achieve superior quality and better outcomes. Of these generic approaches, balanced scorecard (BSC) has attracted considerable interest both in practice and theory. BSC is an adequate evaluation methodology that has been gaining prominence globally and being adopted by organisations for performance improvement, strategic alignment and organisational goal achievement (Davis and Albright, 2004; Aravamudhan, 2010). BSC focuses on financial and non-financial aspects, long-term and short-term strategies, and internal and external business measures. BSC allows managers to consider all of the important strategic measures simultaneously, letting them see whether improvement in one area is achieved at the expense of another (Kaplan and Norton, 1992). The four perspectives – financial, customer, internal business, and learning and growth perspective describes the knowledge, skills and systems that employees will need to innovate and to build the right capabilities and efficiencies that deliver specific value to the market which
Designing the strategy map for hotels with key performance indicators 3
will eventually lead to higher shareholder value (Kaplan and Norton, 1996b; Ittner and Larcker, 1998a).
The BSC approach has attracted much attention of performance management researchers as a method of integrating financial and non-financial performance measures. The results of empirical studies of Hoque and James (2000) in Australia, Rigby (2001) and Ittner et al. (2003) in the USA, Kald and Nilsson (2000) across all the Nordic countries (Denmark, Finland, Norway and Sweden), Speckbacher et al. (2003) in Germany, Austria and Switzerland, Cohen et al. (2008) in Germany, the UK and Italy, Malmi (2001) in Finland, Oliveras and Amat (2002) in Spain, Nielson and Sorenson (2003) in Denmark, Braam et al. (2004) in Netherlands, Anand et al. (2005), Aravamudhan (2010) and Farooq and Hussain (2011) in India, Xiong et al. (2008) in China, Jusoh et al. (2010) in Malaysia, Hendricks et al. (2012) in Canada and Salehi and Ghorbani (2011), Khani and Ahmadi (2012) and Keshavarz et al. (2014) in Iran reported the successful application of BSC for measuring and managing organisational performance. In context of hospitality industry, a number of studies (Huckestein and Duboff, 1999; Denton and White, 2000; Harris and Mongiello, 2001; Doran et al., 2002; Banker et al., 2005; Evans, 2005; Haktanir and Harris, 2005; Phillips and Louvieris, 2005; Bergin-Seers and Jago, 2007; Huang et al., 2007; Min et al., 2008; Chand, 2009; Kim and Lee, 2009; Pavlatos and Paggios, 2009; Ivankovič et al., 2010; Chen et al., 2011; El-Hindawy and Alamasi, 2014) have acknowledged the successful application of BSC as a performance measurement system. Incidentally, very few studies have been carried out in context of Indian hospitality industry.
Most of the BSC related studies have focused mainly on performance measures; only a few papers have examined the creation of a mechanism that shows causal relationships between key performance indicators (KPIs) for the purposes of strategy implementation. To enhance hotel performance, BSC should emphasise upon the incorporation of effective performance indicators and construction of optimal strategy map for initiating improvement in organisational performance through logical relationship among indicators. In the previous studies, almost none of the contributors proposed any methodology for the construction of strategy maps for hotels; rather, these studies mainly focus on the generic framework of four BSC perspectives for performance measurement. Strategy mapping is the most important concept in building BSC framework, since the strategy map establishes casual or logical linkage among performance measures of BSC perspectives.
2 Objectives of the study
The present study sets out to outline KPIs in hospitality industry and to propose a modus operandi to design BSC strategy map for hotels, showing the logical relationship among performance indicators. The decision making trial and evaluation laboratory (DEMATEL) method is used as a tool to examine the cause-and-effect relationships between hospitality performance indicators in order to establish strategy maps. The objectives of this research are:
4 D. Kala and S.C. Bagri
• to identify appropriate KPIs for the evaluation of performance of hospitality organisations based on the BSC perspectives
• to use DEMATEL technique to explore the logical relationships among KPIs and to design the effective and result-oriented strategy map for improving performance of hospitality organisations
• to provide constructive suggestions for measuring and improving performance of hospitality organisations for future.
3 Literature review
3.1 Performance measurement
Performance measurement is seen as an important way of keeping a company on track in achieving the organisation’s objectives and as a monitoring mechanism employed by the owners of organisation (Ittner and Larcker, 1998b). It is a process of assessing progress towards achieving pre-determined goals, including information on the efficiency by which resources are transformed into goods and services, the quality of those outputs and outcomes, and the effectiveness of organisational operations in terms of their specific contributions to organisational objectives (Amaratunga and Baldry, 2003). Most organisations rely exclusively on financial performance measures to assess organisational performance. Critics have argued that these measures are excessively profit-based (Brown and McDonnell, 1995), short-term (Denton and White, 2000), unbalanced (Harris and Mongiello, 2001), unsatisfactory for businesses seeking a competitive advantage (Evans, 2005; Phillips, 1999), past-oriented (Atkinson and Brown, 2001), little market-oriented (Phillips and Louvieris, 2005), inadequate for strategic decisions (Kaplan and Norton, 1992), unable to measure value created, unable to measure intangible assets (Norreklit, 2000) and non-holistic (Phillips, 1999) and therefore, over reliance on them is no longer appropriate for today’s managers.
In this information-age, non-financial performance measures are believed to be better indicators of managerial effort and valuable in evaluating organisational performance (Kaplan and Norton, 2001c). Non-financial measures of customer, internal processes and innovation and improvement activities are also believed to be better predictors of long-term performance and are used to help refocus managers on the future aspects of their actions (Kaplan et al., 1996b). These measures are more timely and precise than financial ones, meaningful for continuous improvement, consistent with company goals and strategies and vary over time as market needs change so tend to be more flexible. Reliance on non-financial measures does not mean that non-financial measures replace financial measures. Financial and non-financial measures are not substitutes, but that non-financial measures are used as additives to financial measures (Govindarajan and Gupta, 1985). Several research findings in performance management advocate the relevance of both financial and non-financial measures for balanced performance of hotel (Fitzgerald et al., 1991; Denton and White, 2000; Harris and Mongiello, 2001; Atkinson and Brander-Brown, 2001; Evans, 2005; Huang et al., 2007; Wadongo et al., 2010; Chen et al., 2011).
Designing the strategy map for hotels with key performance indicators 5
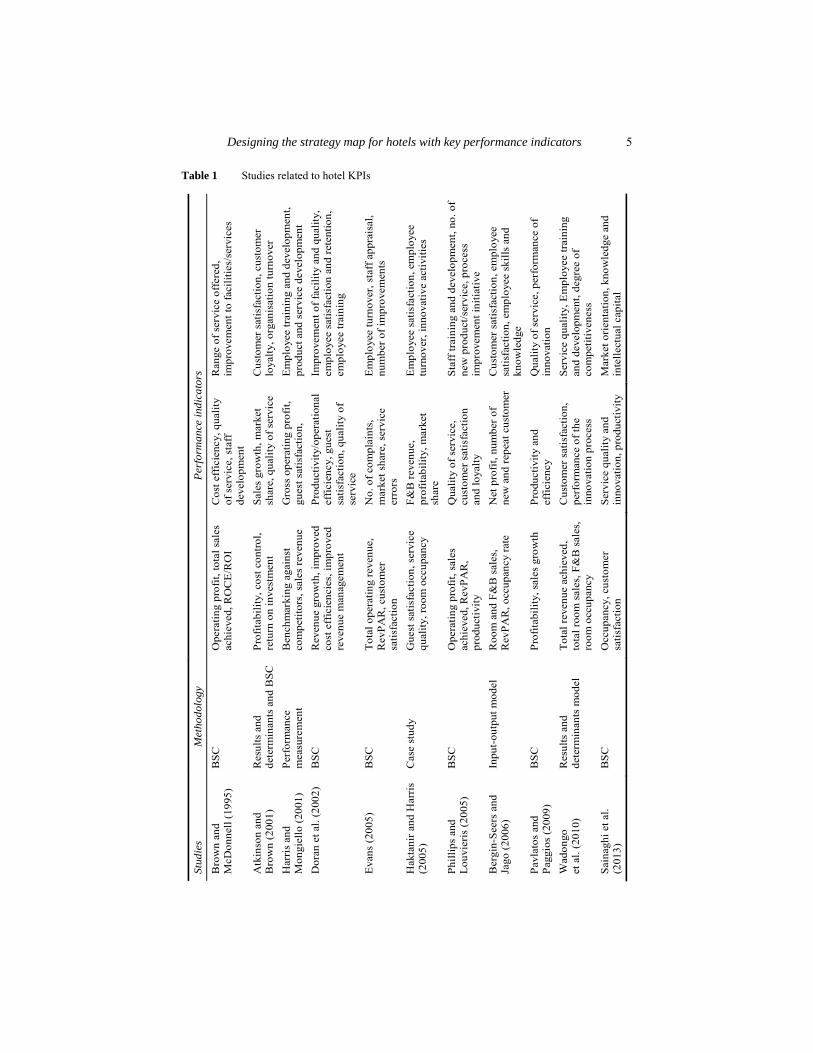
Table 1 Studies related to hotel KPIs
Stud
ies
Met
hodo
logy
P
erfo
rman
ce in
dica
tors
Bro
wn
and
McD
onne
ll (1
995)
B
SC
Ope
ratin
g pr
ofit,
tota
l sal
es
achi
eved
, RO
CE
/RO
I C
ost e
ffic
ienc
y, q
ualit
y of
ser
vice
, sta
ff
deve
lopm
ent
Ran
ge o
f ser
vice
off
ered
, im
prov
emen
t to
faci
litie
s/se
rvic
es
Atk
inso
n an
d B
row
n (2
001)
R
esul
ts a
nd
dete
rmin
ants
and
BSC
Pr
ofita
bilit
y, c
ost c
ontro
l, re
turn
on
inve
stm
ent
Sale
s gr
owth
, mar
ket
shar
e, q
ualit
y of
ser
vice
C
usto
mer
sat
isfa
ctio
n, c
usto
mer
lo
yalty
, org
anis
atio
n tu
rnov
er
Har
ris
and
Mon
giel
lo (2
001)
Pe
rfor
man
ce
mea
sure
men
t B
ench
mar
king
aga
inst
co
mpe
titor
s, s
ales
reve
nue
Gro
ss o
pera
ting
prof
it,
gues
t sat
isfa
ctio
n,
Em
ploy
ee tr
aini
ng a
nd d
evel
opm
ent,
prod
uct a
nd s
ervi
ce d
evel
opm
ent
Dor
an e
t al.
(200
2)
BSC
R
even
ue g
row
th, i
mpr
oved
co
st e
ffic
ienc
ies,
impr
oved
re
venu
e m
anag
emen
t
Prod
uctiv
ity/o
pera
tiona
l ef
ficie
ncy,
gue
st
satis
fact
ion,
qua
lity
of
serv
ice
Impr
ovem
ent o
f fac
ility
and
qua
lity,
em
ploy
ee s
atis
fact
ion
and
rete
ntio
n,
empl
oyee
trai
ning
Eva
ns (2
005)
B
SC
Tota
l ope
ratin
g re
venu
e,
Rev
PAR
, cus
tom
er
satis
fact
ion
No.
of c
ompl
aint
s,
mar
ket s
hare
, ser
vice
er
rors
Em
ploy
ee tu
rnov
er, s
taff
app
rais
al,
num
ber o
f im
prov
emen
ts
Hak
tani
r and
Har
ris
(200
5)
Cas
e st
udy
Gue
st s
atis
fact
ion,
ser
vice
qu
ality
, roo
m o
ccup
ancy
F&
B re
venu
e,
prof
itabi
lity,
mar
ket
shar
e
Em
ploy
ee s
atis
fact
ion,
em
ploy
ee
turn
over
, inn
ovat
ive
activ
ities
Phill
ips
and
Louv
ieri
s (2
005)
B
SC
Ope
ratin
g pr
ofit,
sal
es
achi
eved
, Rev
PAR
, pr
oduc
tivity
Qua
lity
of s
ervi
ce,
cust
omer
sat
isfa
ctio
n an
d lo
yalty
Staf
f tra
inin
g an
d de
velo
pmen
t, no
. of
new
pro
duct
/ser
vice
, pro
cess
im
prov
emen
t ini
tiativ
e B
ergi
n-Se
ers
and
Jago
(200
6)
Inpu
t-ou
tput
mod
el
Roo
m a
nd F
&B
sal
es,
Rev
PAR
, occ
upan
cy ra
te
Net
pro
fit, n
umbe
r of
new
and
repe
at c
usto
mer
C
usto
mer
sat
isfa
ctio
n, e
mpl
oyee
sa
tisfa
ctio
n, e
mpl
oyee
ski
lls a
nd
know
ledg
e Pa
vlat
os a
nd
Pagg
ios
(200
9)
BSC
Pr
ofita
bilit
y, s
ales
gro
wth
Pr
oduc
tivity
and
ef
ficie
ncy
Qua
lity
of s
ervi
ce, p
erfo
rman
ce o
f in
nova
tion
Wad
ongo
et
al.
(201
0)
Res
ults
and
de
term
inan
ts m
odel
To
tal r
even
ue a
chie
ved,
to
tal r
oom
sal
es, F
&B
sal
es,
room
occ
upan
cy
Cus
tom
er s
atis
fact
ion,
pe
rfor
man
ce o
f the
in
nova
tion
proc
ess
Serv
ice
qual
ity, E
mpl
oyee
trai
ning
an
d de
velo
pmen
t, de
gree
of
com
petit
iven
ess
Sain
aghi
et a
l. (2
013)
B
SC
Occ
upan
cy, c
usto
mer
sa
tisfa
ctio
n Se
rvic
e qu
ality
and
in
nova
tion,
pro
duct
ivity
M
arke
t ori
enta
tion,
kno
wle
dge
and
inte
llect
ual c
apita
l
6 D. Kala and S.C. Bagri
3.2 Key performance indicators
KPIs are selected indicators for monitoring the qualitative or quantitative performance of strategic objectives, outcomes, or key result area absolutely critical and important to success and growth of the organisation. The purpose of performance indicators is to provide to decision makers measurable indicators for measuring organisational performance, optimum utilisation of resources and achieve main objective of any organisation – profit maximisation through stakeholders’ satisfaction. The development and use of KPIs form the basis for the analysis of organisation’s current performance, its future requirements and improving strategies required for ongoing success. For the present study, critical and measurable KPIs for hotel performance were identified through reviewing studies of prominent researchers. Table 1 summarises the indicators of hospitality performance that have been investigated in several important studies, along with their main research methodology. These indicators consist of financial and non-financial measures to have the balanced and comprehensive focus on performance.
The above studies make no attempt in designing strategy map. The map is the essential part in designing BSC that can assist management in identifying causal relationships between performance indicators (Kaplan and Norton, 2006). As a result, there is a need to accurately identify effective financial and non-financial measures for measuring performance of hospitality organisations and also properly design effective strategy map to screen logical links between performance measures for making strategic improvements.
3.3 Strategy map
The cause-and-effect relationship is argued to be the feature that distinguishes BSC from other kinds of performance measurement frameworks (Kaplan and Norton, 1996b). The chains of cause-and-effect connect all the performance indicators through four perspectives of BSC, which reflect dynamically the change of strategies and indicate how organisation creates its value (Kaplan and Norton, 2006). In particular, the relationship builds on the assumption that learning and growth measures are the drivers of internal business process measures. The measures of internal process are in turn the drivers of the measures of customer perspective, while these measures are the drivers of financial perspectives. Strategy maps express causal relationships in this sequence. Strategy mapping is the process of visually making cause and effect relationships between all possible strategic objectives in organisation. Strategy map is a tool for constructing linkages between strategic objectives among perspectives of BSC and depicts objectives in multiple perspectives with their corresponding cause-effect relationship(s). Strategy maps provide a visual framework and a concise description of organisation’s strategy, and they can convert intangible assets into tangible outcomes (Banker et al., 2011). Designing of strategy maps with clearly established logical links, leads to cascade down the understanding of strategy through the organisation. To construct strategy maps suitable for the strategy implementation of different institutions, proper performance indicators must be selected.
Designing the strategy map for hotels with key performance indicators 7
As discussed in the review of relevant literature above, most of the past researches emphasised on more comprehensive performance measurement consisting of four BSC perspectives with both financial and non-financial indicators for evaluating hotel performance, but these studies do not consider the construction of strategy maps that makes up such a crucial part of BSC framework. Therefore, in order to fill the gap of the existing body of knowledge concerning the hotel performance evaluation, the present study proposes a systematic approach using DEMATEL method to systemically incorporate experts’ knowledge in order to identify logical relationships among performance indicators for a strategy map. It attempts to help management investigate the complicated cause-effect relationships of performance indicators for building up the strategy map based on the basic BSC framework in a visual diagram.
4 DEMATEL method
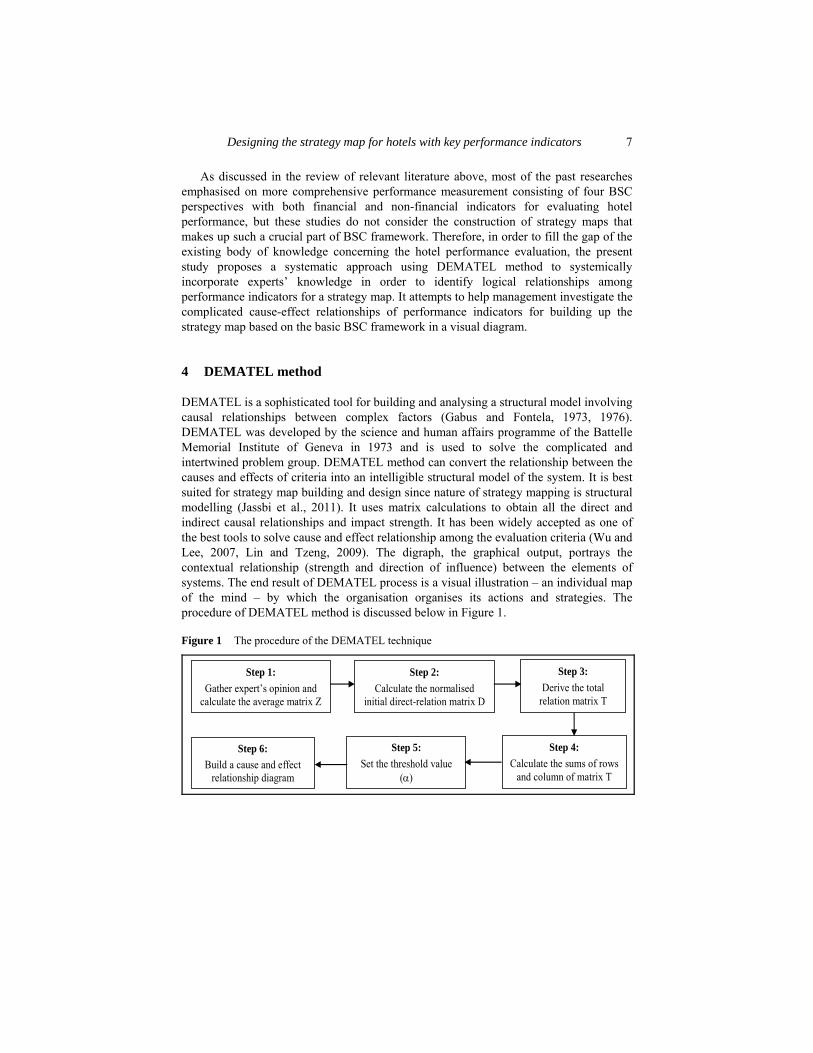
DEMATEL is a sophisticated tool for building and analysing a structural model involving causal relationships between complex factors (Gabus and Fontela, 1973, 1976). DEMATEL was developed by the science and human affairs programme of the Battelle Memorial Institute of Geneva in 1973 and is used to solve the complicated and intertwined problem group. DEMATEL method can convert the relationship between the causes and effects of criteria into an intelligible structural model of the system. It is best suited for strategy map building and design since nature of strategy mapping is structural modelling (Jassbi et al., 2011). It uses matrix calculations to obtain all the direct and indirect causal relationships and impact strength. It has been widely accepted as one of the best tools to solve cause and effect relationship among the evaluation criteria (Wu and Lee, 2007, Lin and Tzeng, 2009). The digraph, the graphical output, portrays the contextual relationship (strength and direction of influence) between the elements of systems. The end result of DEMATEL process is a visual illustration – an individual map of the mind – by which the organisation organises its actions and strategies. The procedure of DEMATEL method is discussed below in Figure 1.
Figure 1 The procedure of the DEMATEL technique
Step 1: Gather expert’s opinion and
calculate the average matrix Z
Step 2: Calculate the normalised
initial direct-relation matrix D
Step 3: Derive the total
relation matrix T
Step 4: Calculate the sums of rows
and column of matrix T
Step 5: Set the threshold value
(α)
Step 6: Build a cause and effect
relationship diagram
8 D. Kala and S.C. Bagri
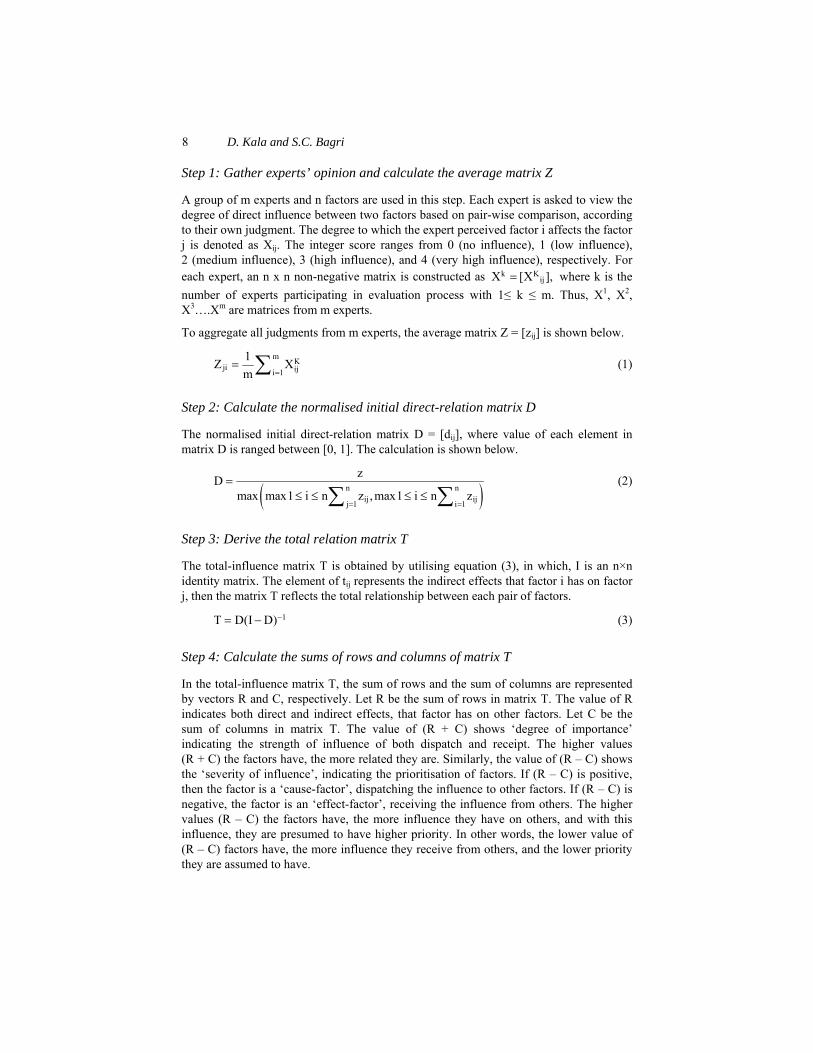
Step 1: Gather experts’ opinion and calculate the average matrix Z
A group of m experts and n factors are used in this step. Each expert is asked to view the degree of direct influence between two factors based on pair-wise comparison, according to their own judgment. The degree to which the expert perceived factor i affects the factor j is denoted as Xij. The integer score ranges from 0 (no influence), 1 (low influence), 2 (medium influence), 3 (high influence), and 4 (very high influence), respectively. For each expert, an n x n non-negative matrix is constructed as k K
ijX [X ],= where k is the number of experts participating in evaluation process with 1≤ k ≤ m. Thus, X1, X2, X3….Xm are matrices from m experts.
To aggregate all judgments from m experts, the average matrix Z = [zij] is shown below.
m Kji iji 1
1Z Xm =
= ∑ (1)
Step 2: Calculate the normalised initial direct-relation matrix D
The normalised initial direct-relation matrix D = [dij], where value of each element in matrix D is ranged between [0, 1]. The calculation is shown below.
( )n nij ijj 1 i 1
zDmax max1 i n z ,max1 i n z
= =
=≤ ≤ ≤ ≤∑ ∑
(2)
Step 3: Derive the total relation matrix T
The total-influence matrix T is obtained by utilising equation (3), in which, I is an n×n identity matrix. The element of tij represents the indirect effects that factor i has on factor j, then the matrix T reflects the total relationship between each pair of factors.
1T D(I D)−= − (3)
Step 4: Calculate the sums of rows and columns of matrix T
In the total-influence matrix T, the sum of rows and the sum of columns are represented by vectors R and C, respectively. Let R be the sum of rows in matrix T. The value of R indicates both direct and indirect effects, that factor has on other factors. Let C be the sum of columns in matrix T. The value of (R + C) shows ‘degree of importance’ indicating the strength of influence of both dispatch and receipt. The higher values (R + C) the factors have, the more related they are. Similarly, the value of (R – C) shows the ‘severity of influence’, indicating the prioritisation of factors. If (R – C) is positive, then the factor is a ‘cause-factor’, dispatching the influence to other factors. If (R – C) is negative, the factor is an ‘effect-factor’, receiving the influence from others. The higher values (R – C) the factors have, the more influence they have on others, and with this influence, they are presumed to have higher priority. In other words, the lower value of (R – C) factors have, the more influence they receive from others, and the lower priority they are assumed to have.
Designing the strategy map for hotels with key performance indicators 9
( )n
i ijn 1 j 1 n 1 R R t× = ×
⎡ ⎤= = ⎢ ⎥⎣ ⎦∑ (4)
( ) nj ij1 n i 1 1 n
C C t× = ×
⎡ ⎤= = ⎢ ⎥⎣ ⎦∑ (5)
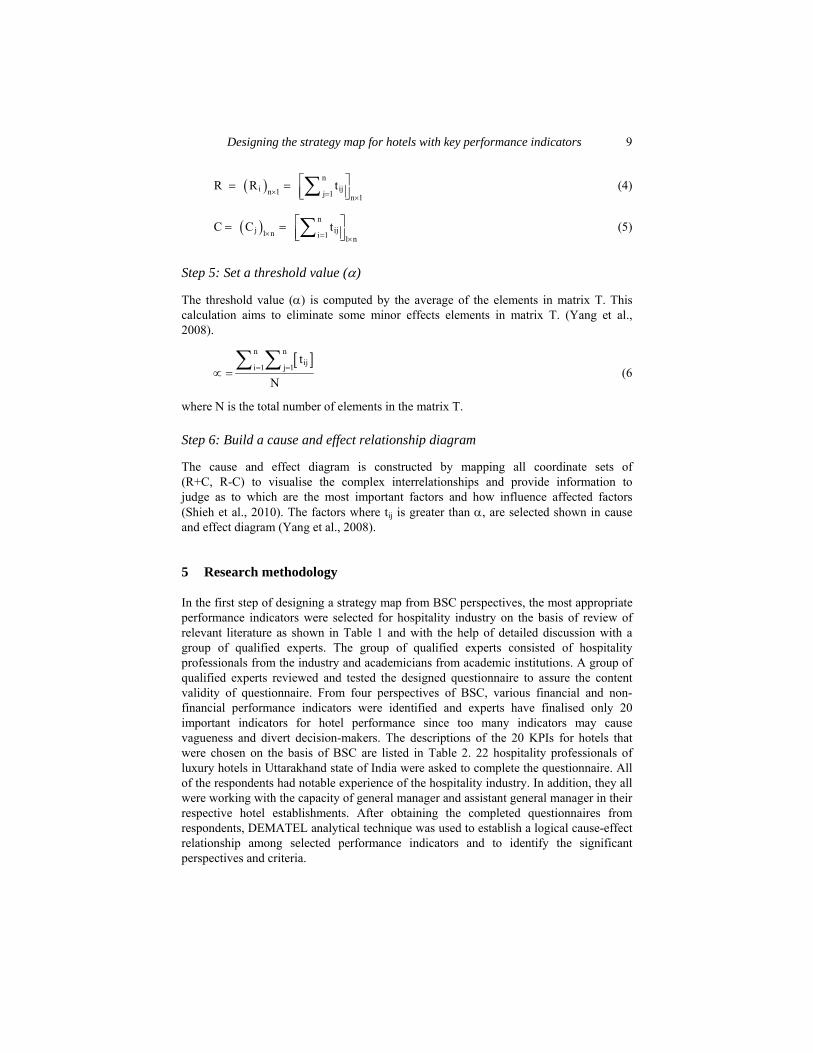
Step 5: Set a threshold value (α)
The threshold value (α) is computed by the average of the elements in matrix T. This calculation aims to eliminate some minor effects elements in matrix T. (Yang et al., 2008).
[ ]n niji 1 j 1
t
N= =∝ =
∑ ∑ (6
where N is the total number of elements in the matrix T.
Step 6: Build a cause and effect relationship diagram
The cause and effect diagram is constructed by mapping all coordinate sets of (R+C, R-C) to visualise the complex interrelationships and provide information to judge as to which are the most important factors and how influence affected factors (Shieh et al., 2010). The factors where tij is greater than α, are selected shown in cause and effect diagram (Yang et al., 2008).
5 Research methodology
In the first step of designing a strategy map from BSC perspectives, the most appropriate performance indicators were selected for hospitality industry on the basis of review of relevant literature as shown in Table 1 and with the help of detailed discussion with a group of qualified experts. The group of qualified experts consisted of hospitality professionals from the industry and academicians from academic institutions. A group of qualified experts reviewed and tested the designed questionnaire to assure the content validity of questionnaire. From four perspectives of BSC, various financial and non-financial performance indicators were identified and experts have finalised only 20 important indicators for hotel performance since too many indicators may cause vagueness and divert decision-makers. The descriptions of the 20 KPIs for hotels that were chosen on the basis of BSC are listed in Table 2. 22 hospitality professionals of luxury hotels in Uttarakhand state of India were asked to complete the questionnaire. All of the respondents had notable experience of the hospitality industry. In addition, they all were working with the capacity of general manager and assistant general manager in their respective hotel establishments. After obtaining the completed questionnaires from respondents, DEMATEL analytical technique was used to establish a logical cause-effect relationship among selected performance indicators and to identify the significant perspectives and criteria.
10 D. Kala and S.C. Bagri
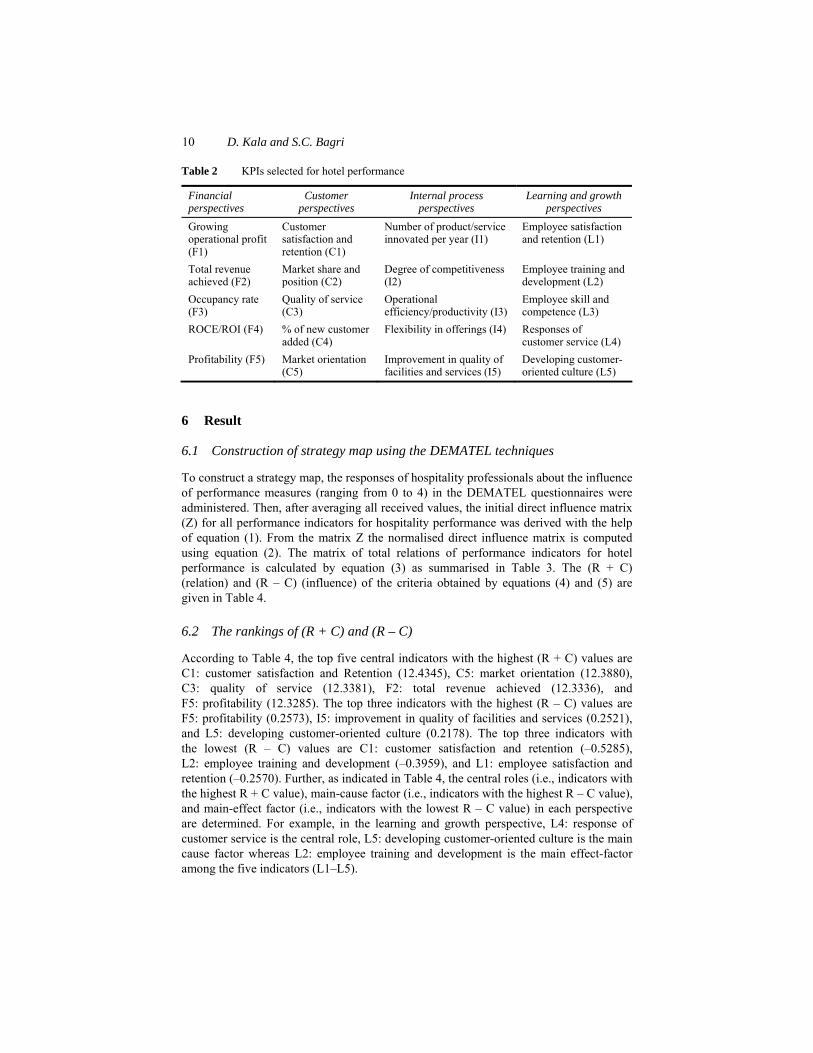
Table 2 KPIs selected for hotel performance
Financial perspectives
Customer perspectives
Internal process perspectives
Learning and growth perspectives
Growing operational profit (F1)
Customer satisfaction and retention (C1)
Number of product/service innovated per year (I1)
Employee satisfaction and retention (L1)
Total revenue achieved (F2)
Market share and position (C2)
Degree of competitiveness (I2)
Employee training and development (L2)
Occupancy rate (F3)
Quality of service (C3)
Operational efficiency/productivity (I3)
Employee skill and competence (L3)
ROCE/ROI (F4) % of new customer added (C4)
Flexibility in offerings (I4) Responses of customer service (L4)
Profitability (F5) Market orientation (C5)
Improvement in quality of facilities and services (I5)
Developing customer-oriented culture (L5)
6 Result
6.1 Construction of strategy map using the DEMATEL techniques
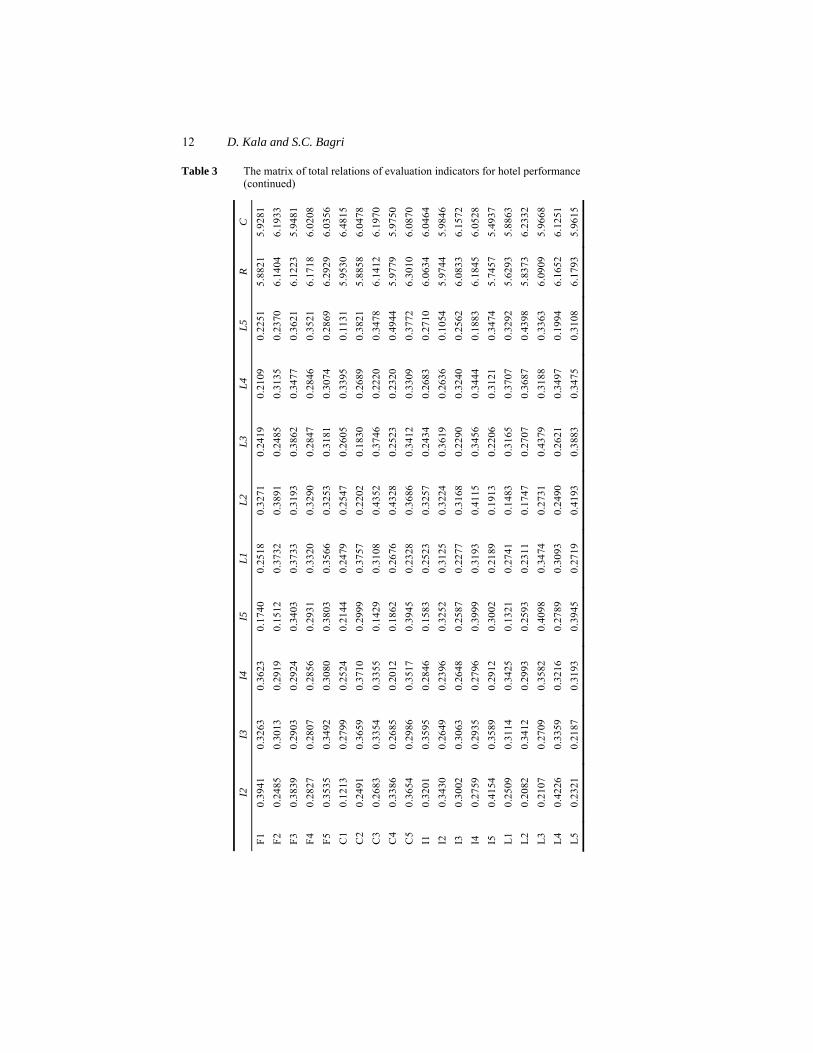
To construct a strategy map, the responses of hospitality professionals about the influence of performance measures (ranging from 0 to 4) in the DEMATEL questionnaires were administered. Then, after averaging all received values, the initial direct influence matrix (Z) for all performance indicators for hospitality performance was derived with the help of equation (1). From the matrix Z the normalised direct influence matrix is computed using equation (2). The matrix of total relations of performance indicators for hotel performance is calculated by equation (3) as summarised in Table 3. The (R + C) (relation) and (R – C) (influence) of the criteria obtained by equations (4) and (5) are given in Table 4.
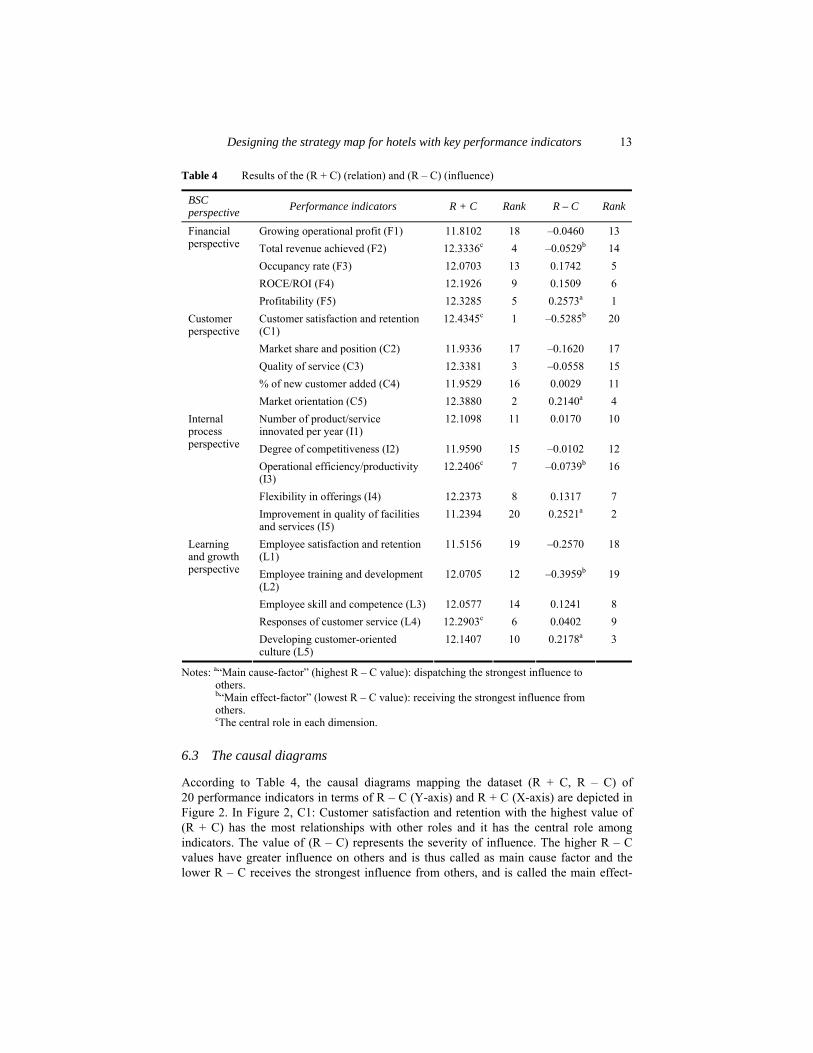
6.2 The rankings of (R + C) and (R – C)
According to Table 4, the top five central indicators with the highest (R + C) values are C1: customer satisfaction and Retention (12.4345), C5: market orientation (12.3880), C3: quality of service (12.3381), F2: total revenue achieved (12.3336), and F5: profitability (12.3285). The top three indicators with the highest (R – C) values are F5: profitability (0.2573), I5: improvement in quality of facilities and services (0.2521), and L5: developing customer-oriented culture (0.2178). The top three indicators with the lowest (R – C) values are C1: customer satisfaction and retention (–0.5285), L2: employee training and development (–0.3959), and L1: employee satisfaction and retention (–0.2570). Further, as indicated in Table 4, the central roles (i.e., indicators with the highest R + C value), main-cause factor (i.e., indicators with the highest R – C value), and main-effect factor (i.e., indicators with the lowest R – C value) in each perspective are determined. For example, in the learning and growth perspective, L4: response of customer service is the central role, L5: developing customer-oriented culture is the main cause factor whereas L2: employee training and development is the main effect-factor among the five indicators (L1–L5).
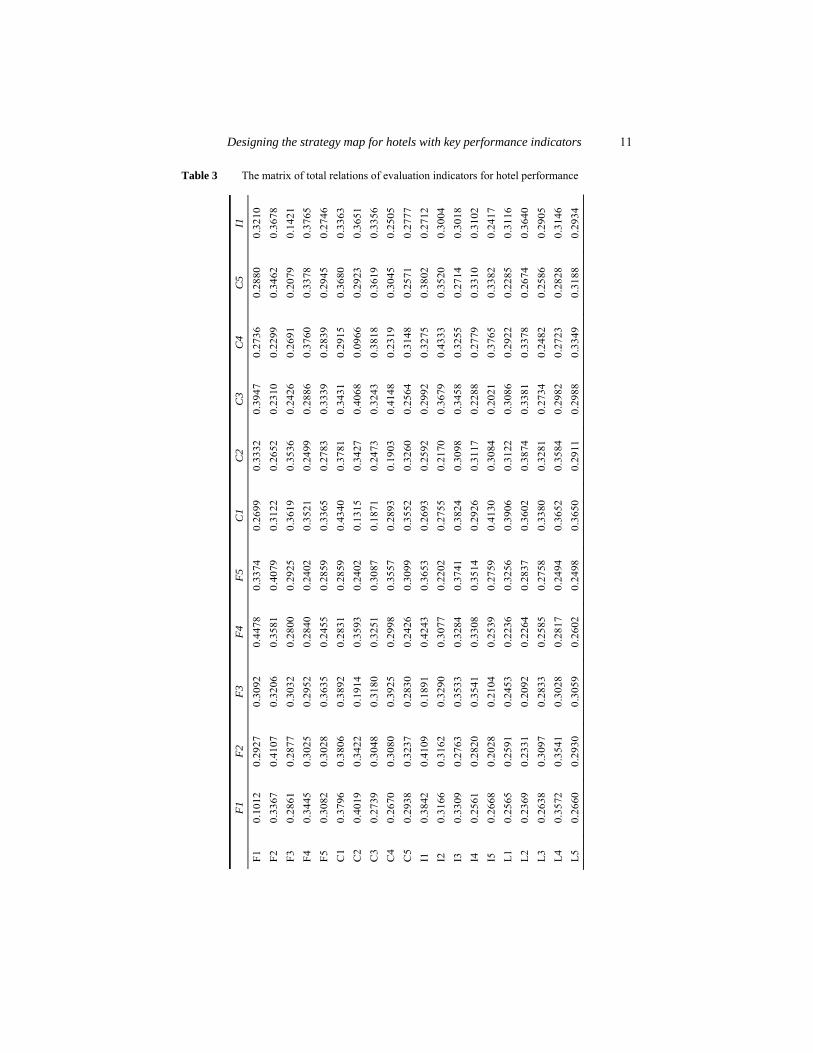
Designing the strategy map for hotels with key performance indicators 11
Table 3 The matrix of total relations of evaluation indicators for hotel performance
F1
F2
F3
F
4 F
5 C
1 C
2 C
3 C
4 C
5 I1
F1
0.10
12
0.29
27
0.30
92
0.44
78
0.33
74
0.26
99
0.33
32
0.39
47
0.27
36
0.28
80
0.32
10
F2
0.33
67
0.41
07
0.32
06
0.35
81
0.40
79
0.31
22
0.26
52
0.23
10
0.22
99
0.34
62
0.36
78
F3
0.28
61
0.28
77
0.30
32
0.28
00
0.29
25
0.36
19
0.35
36
0.24
26
0.26
91
0.20
79
0.14
21
F4
0.34
45
0.30
25
0.29
52
0.28
40
0.24
02
0.35
21
0.24
99
0.28
86
0.37
60
0.33
78
0.37
65
F5
0.30
82
0.30
28
0.36
35
0.24
55
0.28
59
0.33
65
0.27
83
0.33
39
0.28
39
0.29
45
0.27
46
C1
0.37
96
0.38
06
0.38
92
0.28
31
0.28
59
0.43
40
0.37
81
0.34
31
0.29
15
0.36
80
0.33
63
C2
0.40
19
0.34
22
0.19
14
0.35
93
0.24
02
0.13
15
0.34
27
0.40
68
0.09
66
0.29
23
0.36
51
C3
0.27
39
0.30
48
0.31
80
0.32
51
0.30
87
0.18
71
0.24
73
0.32
43
0.38
18
0.36
19
0.33
56
C4
0.26
70
0.30
80
0.39
25
0.29
98
0.35
57
0.28
93
0.19
03
0.41
48
0.23
19
0.30
45
0.25
05
C5
0.29
38
0.32
37
0.28
30
0.24
26
0.30
99
0.35
52
0.32
60
0.25
64
0.31
48
0.25
71
0.27
77
I1
0.38
42
0.41
09
0.18
91
0.42
43
0.36
53
0.26
93
0.25
92
0.29
92
0.32
75
0.38
02
0.27
12
I2
0.31
66
0.31
62
0.32
90
0.30
77
0.22
02
0.27
55
0.21
70
0.36
79
0.43
33
0.35
20
0.30
04
I3
0.33
09
0.27
63
0.35
33
0.32
84
0.37
41
0.38
24
0.30
98
0.34
58
0.32
55
0.27
14
0.30
18
I4
0.25
61
0.28
20
0.35
41
0.33
08
0.35
14
0.29
26
0.31
17
0.22
88
0.27
79
0.33
10
0.31
02
I5
0.26
68
0.20
28
0.21
04
0.25
39
0.27
59
0.41
30
0.30
84
0.20
21
0.37
65
0.33
82
0.24
17
L1
0.25
65
0.25
91
0.24
53
0.22
36
0.32
56
0.39
06
0.31
22
0.30
86
0.29
22
0.22
85
0.31
16
L2
0.23
69
0.23
31
0.20
92
0.22
64
0.28
37
0.36
02
0.38
74
0.33
81
0.33
78
0.26
74
0.36
40
L3
0.26
38
0.30
97
0.28
33
0.25
85
0.27
58
0.33
80
0.32
81
0.27
34
0.24
82
0.25
86
0.29
05
L4
0.35
72
0.35
41
0.30
28
0.28
17
0.24
94
0.36
52
0.35
84
0.29
82
0.27
23
0.28
28
0.31
46
L5
0.26
60
0.29
30
0.30
59
0.26
02
0.24
98
0.36
50
0.29
11
0.29
88
0.33
49
0.31
88
0.29
34
12 D. Kala and S.C. Bagri
Table 3 The matrix of total relations of evaluation indicators for hotel performance (continued)
I2
I3
I4
I5
L1
L2
L3
L4
L5
R
C
F1
0.39
41
0.32
63
0.36
23
0.17
40
0.25
18
0.32
71
0.24
19
0.21
09
0.22
51
5.88
21
5.92
81
F2
0.24
85
0.30
13
0.29
19
0.15
12
0.37
32
0.38
91
0.24
85
0.31
35
0.23
70
6.14
04
6.19
33
F3
0.38
39
0.29
03
0.29
24
0.34
03
0.37
33
0.31
93
0.38
62
0.34
77
0.36
21
6.12
23
5.94
81
F4
0.28
27
0.28
07
0.28
56
0.29
31
0.33
20
0.32
90
0.28
47
0.28
46
0.35
21
6.17
18
6.02
08
F5
0.35
35
0.34
92
0.30
80
0.38
03
0.35
66
0.32
53
0.31
81
0.30
74
0.28
69
6.29
29
6.03
56
C1
0.12
13
0.27
99
0.25
24
0.21
44
0.24
79
0.25
47
0.26
05
0.33
95
0.11
31
5.95
30
6.48
15
C2
0.24
91
0.36
59
0.37
10
0.29
99
0.37
57
0.22
02
0.18
30
0.26
89
0.38
21
5.88
58
6.04
78
C3
0.26
83
0.33
54
0.33
55
0.14
29
0.31
08
0.43
52
0.37
46
0.22
20
0.34
78
6.14
12
6.19
70
C4
0.33
86
0.26
85
0.20
12
0.18
62
0.26
76
0.43
28
0.25
23
0.23
20
0.49
44
5.97
79
5.97
50
C5
0.36
54
0.29
86
0.35
17
0.39
45
0.23
28
0.36
86
0.34
12
0.33
09
0.37
72
6.30
10
6.08
70
I1
0.32
01
0.35
95
0.28
46
0.15
83
0.25
23
0.32
57
0.24
34
0.26
83
0.27
10
6.06
34
6.04
64
I2
0.34
30
0.26
49
0.23
96
0.32
52
0.31
25
0.32
24
0.36
19
0.26
36
0.10
54
5.97
44
5.98
46
I3
0.30
02
0.30
63
0.26
48
0.25
87
0.22
77
0.31
68
0.22
90
0.32
40
0.25
62
6.08
33
6.15
72
I4
0.27
59
0.29
35
0.27
96
0.39
99
0.31
93
0.41
15
0.34
56
0.34
44
0.18
83
6.18
45
6.05
28
I5
0.41
54
0.35
89
0.29
12
0.30
02
0.21
89
0.19
13
0.22
06
0.31
21
0.34
74
5.74
57
5.49
37
L1
0.25
09
0.31
14
0.34
25
0.13
21
0.27
41
0.14
83
0.31
65
0.37
07
0.32
92
5.62
93
5.88
63
L2
0.20
82
0.34
12
0.29
93
0.25
93
0.23
11
0.17
47
0.27
07
0.36
87
0.43
98
5.83
73
6.23
32
L3
0.21
07
0.27
09
0.35
82
0.40
98
0.34
74
0.27
31
0.43
79
0.31
88
0.33
63
6.09
09
5.96
68
L4
0.42
26
0.33
59
0.32
16
0.27
89
0.30
93
0.24
90
0.26
21
0.34
97
0.19
94
6.16
52
6.12
51
L5
0.23
21
0.21
87
0.31
93
0.39
45
0.27
19
0.41
93
0.38
83
0.34
75
0.31
08
6.17
93
5.96
15
Designing the strategy map for hotels with key performance indicators 13
Table 4 Results of the (R + C) (relation) and (R – C) (influence)
BSC perspective Performance indicators R + C Rank R – C Rank
Growing operational profit (F1) 11.8102 18 –0.0460 13 Total revenue achieved (F2) 12.3336c 4 –0.0529b 14 Occupancy rate (F3) 12.0703 13 0.1742 5 ROCE/ROI (F4) 12.1926 9 0.1509 6
Financial perspective
Profitability (F5) 12.3285 5 0.2573a 1 Customer satisfaction and retention (C1)
12.4345c 1 –0.5285b 20
Market share and position (C2) 11.9336 17 –0.1620 17 Quality of service (C3) 12.3381 3 –0.0558 15 % of new customer added (C4) 11.9529 16 0.0029 11
Customer perspective
Market orientation (C5) 12.3880 2 0.2140a 4 Number of product/service innovated per year (I1)
12.1098 11 0.0170 10
Degree of competitiveness (I2) 11.9590 15 –0.0102 12 Operational efficiency/productivity (I3)
12.2406c 7 –0.0739b 16
Flexibility in offerings (I4) 12.2373 8 0.1317 7
Internal process perspective
Improvement in quality of facilities and services (I5)
11.2394 20 0.2521a 2
Employee satisfaction and retention (L1)
11.5156 19 –0.2570 18
Employee training and development (L2)
12.0705 12 –0.3959b 19
Employee skill and competence (L3) 12.0577 14 0.1241 8 Responses of customer service (L4) 12.2903c 6 0.0402 9
Learning and growth perspective
Developing customer-oriented culture (L5)
12.1407 10 0.2178a 3
Notes: a“Main cause-factor” (highest R – C value): dispatching the strongest influence to others. b“Main effect-factor” (lowest R – C value): receiving the strongest influence from others. cThe central role in each dimension.
6.3 The causal diagrams
According to Table 4, the causal diagrams mapping the dataset (R + C, R – C) of 20 performance indicators in terms of R – C (Y-axis) and R + C (X-axis) are depicted in Figure 2. In Figure 2, C1: Customer satisfaction and retention with the highest value of (R + C) has the most relationships with other roles and it has the central role among indicators. The value of (R – C) represents the severity of influence. The higher R – C values have greater influence on others and is thus called as main cause factor and the lower R – C receives the strongest influence from others, and is called the main effect-
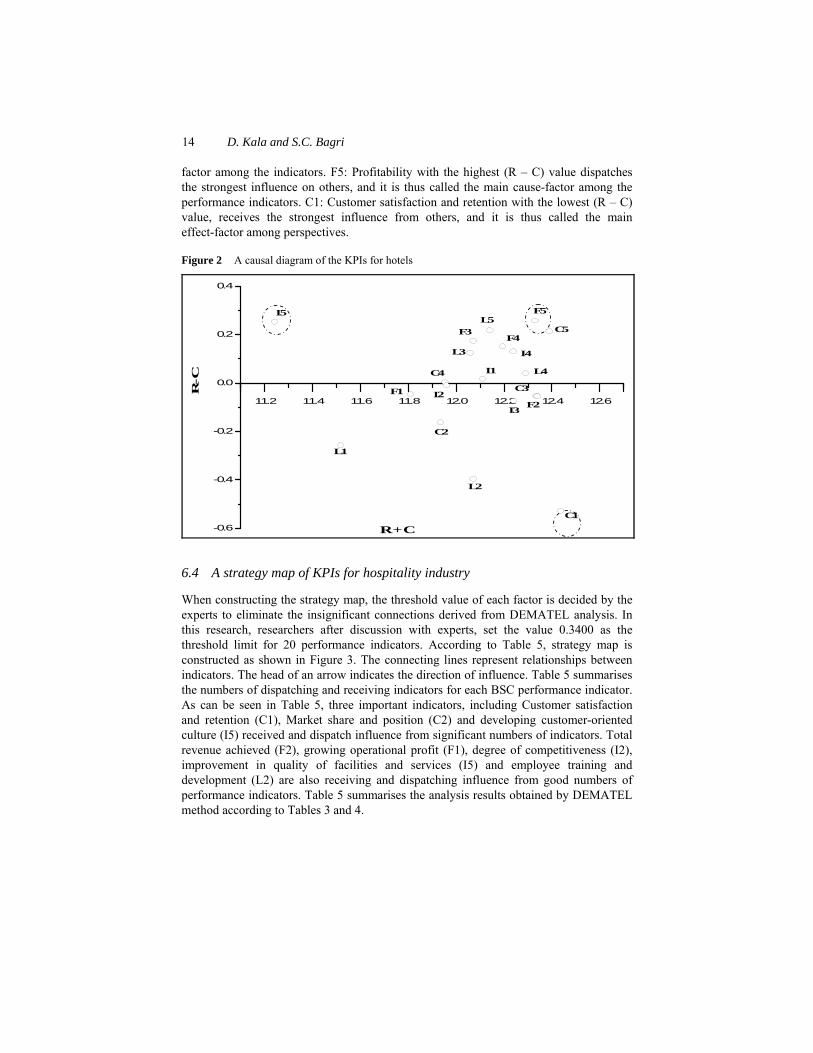
14 D. Kala and S.C. Bagri
factor among the indicators. F5: Profitability with the highest (R – C) value dispatches the strongest influence on others, and it is thus called the main cause-factor among the performance indicators. C1: Customer satisfaction and retention with the lowest (R – C) value, receives the strongest influence from others, and it is thus called the main effect-factor among perspectives.
Figure 2 A causal diagram of the KPIs for hotels
11.2 11.4 11.6 11.8 12.0 12.2 12.4 12.6
-0.6
-0.4
-0.2
0.0
0.2
0.4
I2
C4 I1 L4
I4
F4
F1 C3
F2I3
L3
F3L5
C5
F5
C2
L1
L2
C1
I5
R + C
R - C
6.4 A strategy map of KPIs for hospitality industry
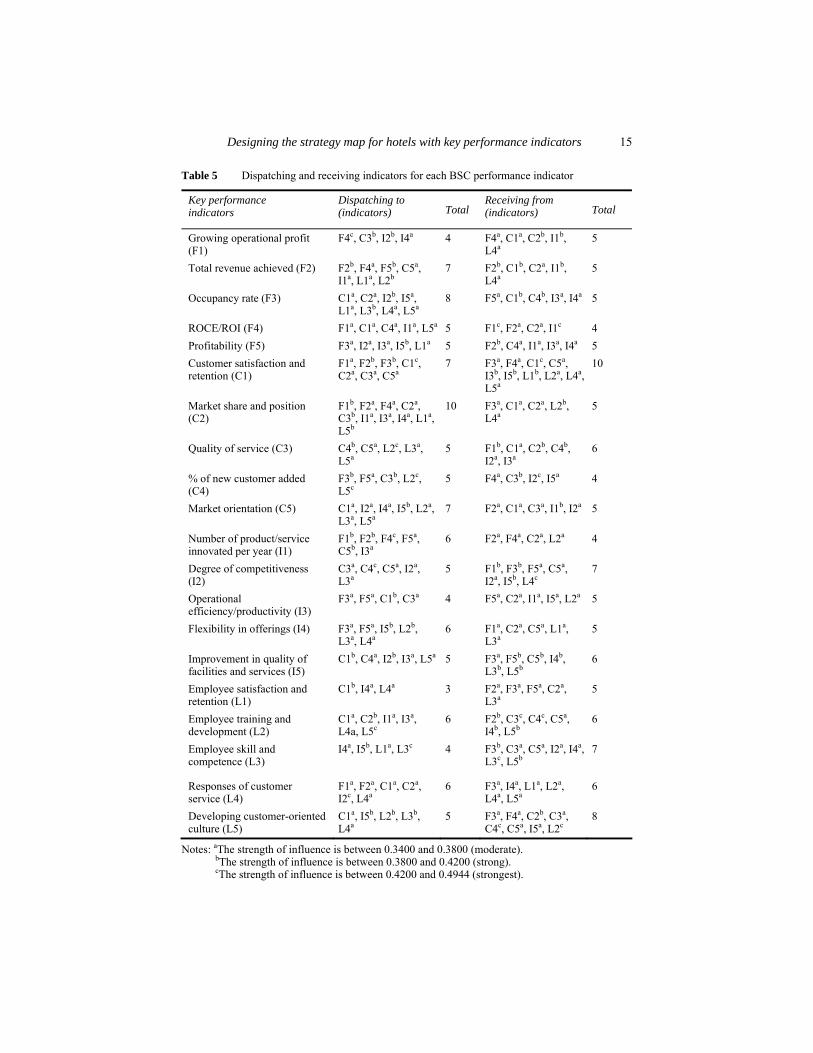
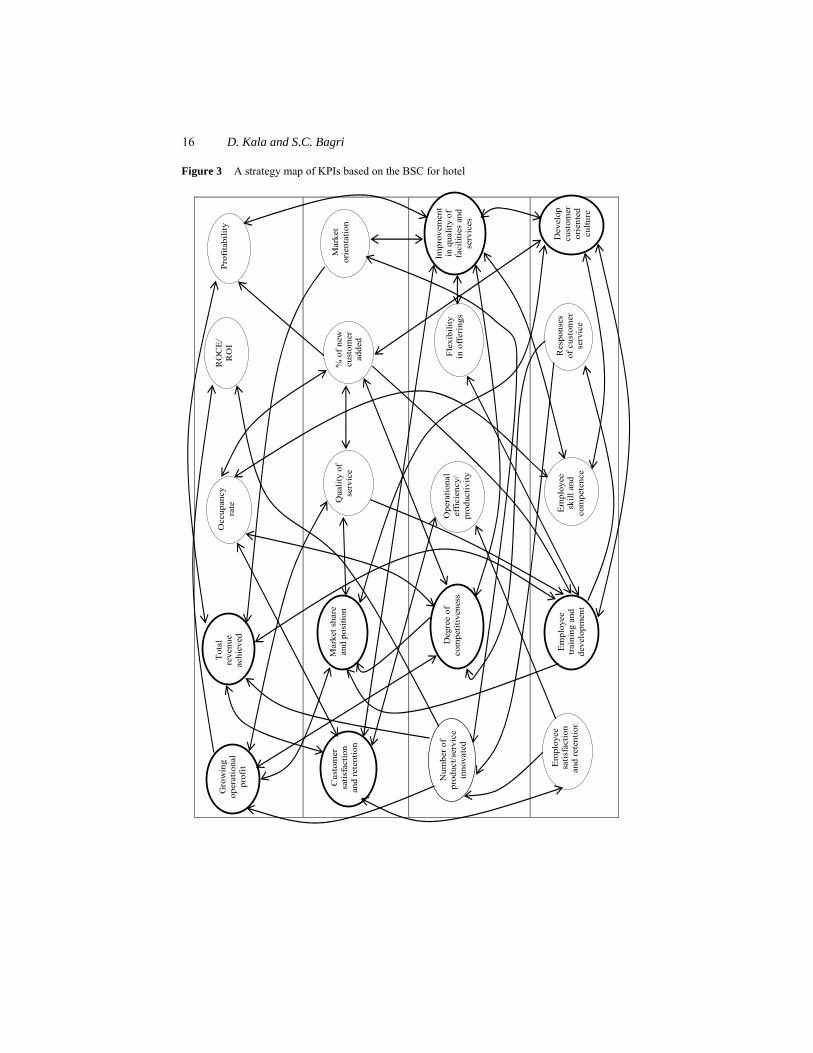
When constructing the strategy map, the threshold value of each factor is decided by the experts to eliminate the insignificant connections derived from DEMATEL analysis. In this research, researchers after discussion with experts, set the value 0.3400 as the threshold limit for 20 performance indicators. According to Table 5, strategy map is constructed as shown in Figure 3. The connecting lines represent relationships between indicators. The head of an arrow indicates the direction of influence. Table 5 summarises the numbers of dispatching and receiving indicators for each BSC performance indicator. As can be seen in Table 5, three important indicators, including Customer satisfaction and retention (C1), Market share and position (C2) and developing customer-oriented culture (I5) received and dispatch influence from significant numbers of indicators. Total revenue achieved (F2), growing operational profit (F1), degree of competitiveness (I2), improvement in quality of facilities and services (I5) and employee training and development (L2) are also receiving and dispatching influence from good numbers of performance indicators. Table 5 summarises the analysis results obtained by DEMATEL method according to Tables 3 and 4.
Designing the strategy map for hotels with key performance indicators 15
Table 5 Dispatching and receiving indicators for each BSC performance indicator
Key performance indicators
Dispatching to (indicators) Total
Receiving from (indicators) Total
Growing operational profit (F1)
F4c, C3b, I2b, I4a 4 F4a, C1a, C2b, I1b, L4a
5
Total revenue achieved (F2) F2b, F4a, F5b, C5a, I1a, L1a, L2b
7 F2b, C1b, C2a, I1b, L4a
5
Occupancy rate (F3) C1a, C2a, I2b, I5a, L1a, L3b, L4a, L5a
8 F5a, C1b, C4b, I3a, I4a 5
ROCE/ROI (F4) F1a, C1a, C4a, I1a, L5a 5 F1c, F2a, C2a, I1c 4 Profitability (F5) F3a, I2a, I3a, I5b, L1a 5 F2b, C4a, I1a, I3a, I4a 5 Customer satisfaction and retention (C1)
F1a, F2b, F3b, C1c, C2a, C3a, C5a
7 F3a, F4a, C1c, C5a, I3b, I5b, L1b, L2a, L4a, L5a
10
Market share and position (C2)
F1b, F2a, F4a, C2a, C3b, I1a, I3a, I4a, L1a, L5b
10 F3a, C1a, C2a, L2b, L4a
5
Quality of service (C3) C4b, C5a, L2c, L3a, L5a
5 F1b, C1a, C2b, C4b, I2a, I3a
6
% of new customer added (C4)
F3b, F5a, C3b, L2c, L5c
5 F4a, C3b, I2c, I5a 4
Market orientation (C5) C1a, I2a, I4a, I5b, L2a, L3a, L5a
7 F2a, C1a, C3a, I1b, I2a 5
Number of product/service innovated per year (I1)
F1b, F2b, F4c, F5a, C5b, I3a
6 F2a, F4a, C2a, L2a 4
Degree of competitiveness (I2)
C3a, C4c, C5a, I2a, L3a
5 F1b, F3b, F5a, C5a, I2a, I5b, L4c
7
Operational efficiency/productivity (I3)
F3a, F5a, C1b, C3a 4 F5a, C2a, I1a, I5a, L2a 5
Flexibility in offerings (I4) F3a, F5a, I5b, L2b, L3a, L4a
6 F1a, C2a, C5a, L1a, L3a
5
Improvement in quality of facilities and services (I5)
C1b, C4a, I2b, I3a, L5a 5 F3a, F5b, C5b, I4b, L3b, L5b
6
Employee satisfaction and retention (L1)
C1b, I4a, L4a 3 F2a, F3a, F5a, C2a, L3a
5
Employee training and development (L2)
C1a, C2b, I1a, I3a, L4a, L5c
6 F2b, C3c, C4c, C5a, I4b, L5b
6
Employee skill and competence (L3)
I4a, I5b, L1a, L3c 4 F3b, C3a, C5a, I2a, I4a, L3c, L5b
7
Responses of customer service (L4)
F1a, F2a, C1a, C2a, I2c, L4a
6 F3a, I4a, L1a, L2a, L4a, L5a
6
Developing customer-oriented culture (L5)
C1a, I5b, L2b, L3b, L4a
5 F3a, F4a, C2b, C3a, C4c, C5a, I5a, L2c
8
Notes: aThe strength of influence is between 0.3400 and 0.3800 (moderate). bThe strength of influence is between 0.3800 and 0.4200 (strong). cThe strength of influence is between 0.4200 and 0.4944 (strongest).
16 D. Kala and S.C. Bagri
Figure 3 A strategy map of KPIs based on the BSC for hotel
Tot
al
reve
nue
achi
eved
Mar
ket s
hare
an
d po
sitio
n C
usto
mer
sa
tisfa
ctio
n an
d re
tent
ion
% o
f new
cu
stom
er
adde
d
Mar
ket
orie
ntat
ion
Impr
ovem
ent
in q
ualit
y of
fa
cilit
ies
and
serv
ices
Ope
ratio
nal
effi
cien
cy/
prod
uctiv
ity
Deg
ree
of
co
mpe
titiv
enes
sN
umbe
r of
prod
uct/s
ervi
ce
inno
vate
d
Dev
elop
cu
stom
er
orie
nted
cu
lture
Res
pons
es
of c
usto
mer
se
rvic
e
Em
ploy
ee
skill
and
co
mpe
tenc
e
Em
ploy
ee
trai
ning
and
de
velo
pmen
t
Em
ploy
ee
satis
fact
ion
and
rete
ntio
n
Pro
fita
bilit
y O
ccup
ancy
ra
te
Gro
win
g op
erat
iona
l pr
ofit
RO
CE
/ R
OI
Qua
lity
of
serv
ice
Flex
ibili
ty
in o
ffer
ings
Designing the strategy map for hotels with key performance indicators 17
7 Analysis and discussion
An attempt was made to strategically analyse performance measurement practices of hospitality industry of Uttarakhand state of India using key performance of BSC and DEMATEL. Strategy map – a technique for constructing a strategic cause and effect relationship among different performance indicators – is applied to depict strategic linkage among perspectives of BSC. The present work utilises DEMATEL technique to analyse casual and ‘logical’ relationships among KPIs in order to establish a strategy map. DEMATEL technique has advantage over other methods such as SEM, since DEMATEL uses the knowledge of experts to design the model of performance measurement system in order to determine valid relationships among performance indicators and requires no pre-hypotheses and large-data verifications (Wu, 2012). The proposition of strategy in this map is expressed in terms of the critical performance measures that are rationally related to each other. Strategy mapping proposes several casual and significant linkages or ‘strategic steps’ in order to guide managers to direct their efforts to ensure strategic improvement in all key areas.
As shown in Figure 3, the study revealed eight most critical and influential performance indicators from four strategic perspectives of BSC. These are growing operational profit (F1) and total revenue achieved (F2) from financial perspective, customer satisfaction and retention (C1) and market share and position (C2) from customer perspective, degree of competitiveness (I2) and improvement in quality of facilities and services (I5) from internal process perspective and employee training and development (L2) and developing customer-oriented culture (L5) from learning and growth perspective. Results indicate that ‘Customer satisfaction and retention (C1)’ is the most critical lagging (result) indicator used to measure hotel performance, because ‘Customer satisfaction and retention (C1)’ is the main effect factor with lowest (R – C) value and is affected by 10 indicators. In internal process perspective, improvement in quality of facilities and services (I5) is the critical indicator with strong influence on customer satisfaction and retention (C1) and moderate influence on percent of new customer added (C4) and operational efficiency/productivity (I3). Employee training and development (L2) is the important indicator in learning and growth perspective. This indicator has strongest influence on developing customer-oriented culture (L5); strong influence on market share and position (C2) and moderate influence on customer satisfaction and retention (C1), number of product/service innovated per year (I1), operational efficiency/productivity (I3) and Responses of customer service (L4). Total revenue achieved (F2) is the important decisive indicator in financial perspective. This indicator is having strong influence on profitability (F5), employee training and development (L2) and moderate influence on number of product/service innovated per year (I1), and employee satisfaction and retention (L1).
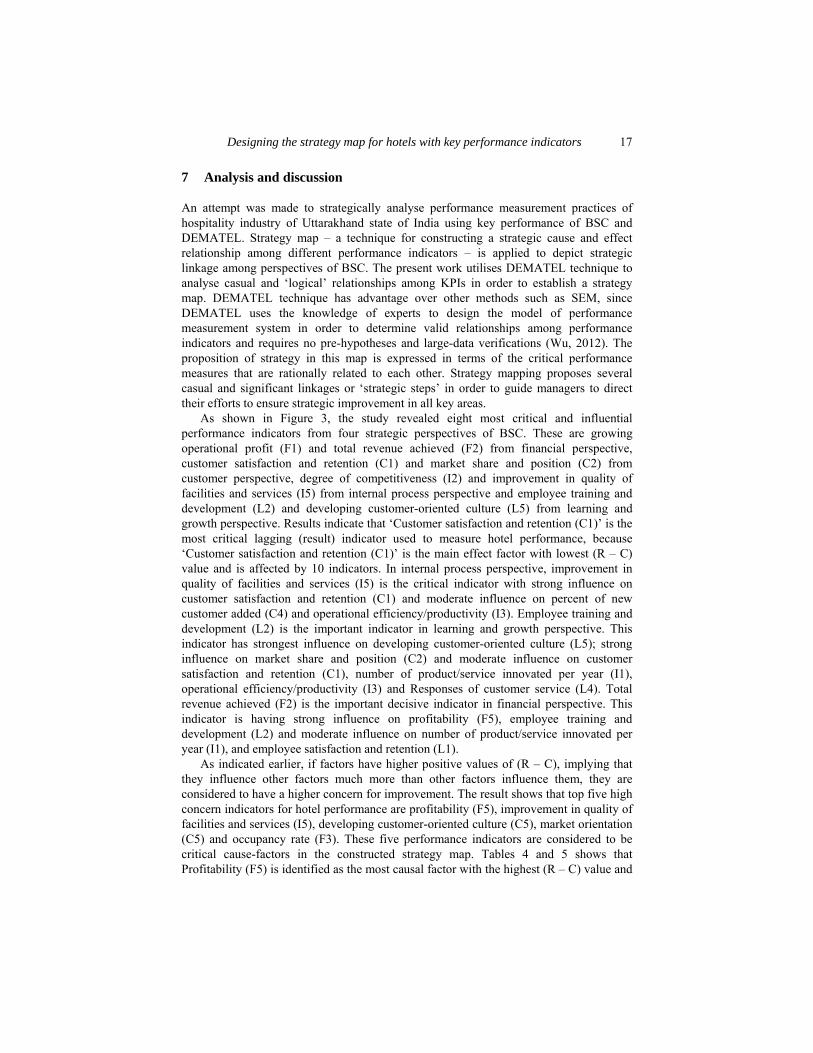
As indicated earlier, if factors have higher positive values of (R – C), implying that they influence other factors much more than other factors influence them, they are considered to have a higher concern for improvement. The result shows that top five high concern indicators for hotel performance are profitability (F5), improvement in quality of facilities and services (I5), developing customer-oriented culture (C5), market orientation (C5) and occupancy rate (F3). These five performance indicators are considered to be critical cause-factors in the constructed strategy map. Tables 4 and 5 shows that Profitability (F5) is identified as the most causal factor with the highest (R – C) value and
18 D. Kala and S.C. Bagri
influences five indicators, especially improvement in quality of facilities and services (I5), degree of competitiveness (I2), operational efficiency/productivity (I3) and employee satisfaction and retention (L1). All indicators have strongest to moderate influence on customer satisfaction and retention (C1) which is considered as the most critical indicator in hotel performance. Improvement in quality of facilities and services (I5) also influences five indicators, namely customer satisfaction and retention (strong influence), percent of new customer added (moderate influence), degree of competitiveness (strong influence), operational efficiency/productivity (moderate influence) and developing customer-oriented culture (moderate influence). Developing customer-oriented culture (L5) indicator strongly influence improvement in quality of facilities and services (I5), employee training and development (L2) and employee skill and competence (L3). In this study, researchers examined the significant influence of all these cause factors on the performance of hotel establishments.
The present work also advocates the feedback relationship among several financial and non-financial performance indicators. These relationships indicate that managers should be aware of logical linkages among KPIs and significance of their effective management in order to take the advantage of their synergistic relationships. For instance, among top five high concern performance indicators, profitability (F5), market orientation (C5), and developing customer-oriented culture (L5) have strong mutual relationship with improvement in quality of facilities and services (I5). The moderate influence exists between developing customer-oriented culture (L5) indicator and occupancy rate (F3), market orientation (C5), improvement in quality of facilities and services (I5). Form this finding, it can be concluded that development of customer centric organisational culture can help the hotel to develop effective strategies to meet needs and requirements of market/customers. This certainly improves quality of existing facilities and services provided by hoteliers to present and prospective customers. These market-oriented outlook will thus further enhance the occupancy of hotel units. Keeping all these logical feedback relationships into considerations, the recommended improvement path of KPIs in the constructed strategic map can be visualised as follows: Development of customer-oriented organisational culture and proper training and development initiatives for employees should be the first step of hotel mangers/entrepreneurs. These two indicators will improve quality of hotel operations and services and provide competitive advantage to hotel units. Improvement in the quality of facilities, operations and services will enhance customer satisfaction and consequently lead to retention of existing customers. Degree of competitiveness will improve the market share of hotel establishment and create a superior position of hotel in the mind of target market customers. Customer satisfaction and retention, growing market share and favourable positioning will eventually enhance total revenue achieved and operational profit of the hotel.
The fundamental purpose of DEMATEL analysis is to decide causal relationships among variables in a complex system. The present study used DEMATEL method to design a strategy map of hotel performance by extensively reviewing the relevant literature and by objectively evaluating expert opinions, a method different from the conventional approach of building strategy maps from four BSC perspectives only by experts’ rules of thumb (Davis and Albright, 2004; Wu, 2012). The qualitative and quantitative analysis results obtained by DEMATEL in the present study can determine not only the direction of influence (quality) but also the strength of relationships (quantity) between KPIs. Compared with the traditional method of constructing strategy
Designing the strategy map for hotels with key performance indicators 19
maps, DEMATEL is a more rational approach to understand casual relationships among performance indicators. The complex cause-and-effect relationships among KPIs displayed by DEMATEL are more balanced and provide a clear road map to help management choose the high priority cause and effect indicators and focus on performance improvement-related activities. The construction of the logical interrelationships among four perspectives of BSC proposed by the present study will help hotel managers/entrepreneurs to make effective strategic initiatives to improve organisational performance through outcome measures and drivers of performance. The results of strategic improvement in performance indicators indicate an efficient way for organisation to ensure the proper focus on those critical areas which requires improvement the most. The present study also reveals that although financial performance indicators are important, the focus on non-financial performance indicators may offer greater opportunities for measuring organisational effectiveness of service sector in the longer run. In hospitality industry, setting up strategic objectives of strategy maps must be driven by a customer-orientation and should take customer-related indicators as final outcome measures. This study also recommends that hotel managers desiring to develop effective performance measurement systems should view performance measurement holistically. Financial, customer, internal business process, and learning and growth should not be measured in isolation but must be viewed as part of a whole.
8 Conclusions
KPIs provide vital information to organisation for tracking and predicting business performance against strategic objectives in a way that complements financial measures. There is a concern that in using inappropriate measures, hotel managers may be ignoring issues, which really matter, potentially to the serious detriment of their organisation’s performance. In this attempt, there are some critical success factors highlighted for hospitality industry. These factors are critical because if they are executed properly, hotel will achieve excellence in its chosen field. Hotels can take the advantage of BSC methodology to focus on critical areas and design appropriate strategies to improve organisational performance. Researchers and practitioners utilise a comprehensive performance measurement consisting of four BSC perspectives with both financial and non financial indicators for evaluating performance of hotel properties, but they do not consider the construction of strategy maps that makes up such a crucial part of BSC system. Therefore, in order to fill the gap of the existing body of knowledge regarding the evaluation of hotel performance and strategy development, the present study proposed the strategy map using DEMATEL method to systemically identify causal relationships among performance indicators. In the present study, logical links between the most suitable performance indicators of hotel performance based on the content of BSC is recognised.
By combining the opinions of hospitality experts, DEMATEL technique was employed to determine rational relationships and strengths of influence among performance indicators to establish a strategy map. The multidimensional cause-and-effect relationships between the performance indicators displayed by DEMATEL are more logical and provide a clear road map to help manager choose
20 D. Kala and S.C. Bagri
critical indicators and focus on the strategy-related activities. The use of cause and effect analysis helps managers to identify the mix of feasible improvement paths for hotels in all of four BSC perspectives. Referring to the strategy map designed systematically in the study, DEMATEL method can provide workable references for the prioritisation of strategic steps in practice since valid links between all performance indicators are logically exposed. These considerable strategic steps indicate a path for hoteliers and managers to better invest organisational resources in those aspects which warrant the most improvement.
Management should also pay more attention to feedback relationships among performance indicators, since the influence of interdependence can produce positive reinforcement among performance indicators. The knowledge, skills and professional behaviour of employees will innovate and build the right strategic capabilities and efficiencies that deliver specific value to the customer which will eventually lead to higher shareholder value. Results also reveal that customer satisfaction and retention, market orientation and quality of service are the three most important evaluation indicators of hotel performance. Interestingly, these all critical indictors belong to the customer perspective of BSC. Thus, it can be concluded that customer perspective of BSC should be emphasised by hotels as final outcome measure. The present study also provide valuable suggestion to hotel managers to focus on profitability, improvement in quality of facilities and services, developing customer-oriented culture, market orientation and hotel occupancy rate. These factors dispatch the strongest influence on other indicators of hotel performance and therefore, managers are advised to pay adequate attention to them. Moreover, there are certain indicators which are extremely important for successful functioning of hotels but quite susceptible in nature such as customer satisfaction and retention, employee training and development, employee satisfaction and retention, market share and position and operational efficiency/productivity. These indicators, capable of generating competitive advantage, receive the significant influence from all other performance indicators and consequently should be monitored by hoteliers regularly. In short, strategy mapping is an effective and powerful approach that can help to keep a hotel at its competitive peak. The steps provided in the map enable hotels to successfully implement strategy in a manner never before experienced. Hotel units struggling with strategy execution will find this map a convincing way to think about, agree upon, and communicate their strategic initiatives to various stakeholders.
However, there exist some limitations of the current research that warrant discussion. First, the industry population surveyed represents hospitality managers of some selected hotels of India; therefore it is not appropriate for this study to make the claim that findings are applicable to entire hospitality industry, especially in developed countries where hotel industry has flourished marvelously. Though, these implications can be valuable to hotels of developing countries, like India, where hotel industry is in growing stage. It is hoped that the study can be reproduced to test the extent of the applicability of findings. Second, in DEMATEL questionnaire, like all the other questionnaires, responses are necessarily restricted to individual subjectivity. Third, the subjective judgments of hospitality experts about four perspectives of BSC may vary from each other. Fourth, selected performance indicators that were adopted for hotels with respect to BSC may not be suitable to other establishments because of unique nature of organisations and their strategic objectives. Therefore, necessary precautions should be taken about the applicability of the results to other industries. Precisely, the present study
Designing the strategy map for hotels with key performance indicators 21
established logical links among KPIs, which provides important insight into the managerial implications of strategic steps for hotel performance improvements. Authors suggest that hotel establishments should take into account the results of the study and develop adequate strategies that address the necessity of performance measurement system. By having this provision of assessing the performance of hotels, there are all possibilities of having bulk business from the existing customers making the hoteliers more prosperous.
References Amaratunga, D. and Baldry, D. (2003) ‘A conceptual framework to measure facilities management
performance’, Property Management, Vol. 21, No. 2, pp.171–189. Anand, M., Sahay, S. and Saba, S. (2005) ‘Balanced scorecard in Indian companies’, Vikalpa,
Vol. 30, No. 2, pp.11–25. . Aravamudhan, S. (2010) ‘An empirical study on the critical factors for balanced scorecard
implementation in the Indian context’, International Journal of Business Excellence, Vol. 3, No. 4, pp.397–414.
Assiri, A., Zairi, M. and Eid, R. (2006) ‘How to profit from the balanced scorecard: an implementation roadmap’, Industrial Management and Data Systems, Vol. 106, No. 7, pp.937–952.
Atkinson, H. and Brander-Brown, J. (2001) ‘Rethinking performance measures: assessing progress in UK hotels’, International Journal of Contemporary Hospitality Management, Vol. 13, No. 3, pp.128–136.
Banker, R.D., Chang, H. and Pizzini, M. (2011) ‘The judgmental effects of strategy maps in balanced scorecard performance evaluations’, International Journal of Accounting Information Systems, Vol. 12, No. 4, pp.259–279.
Banker, R.D., Potter, G. and Srinivasan, D. (2005) ‘Association of nonfinancial performance measures with the financial performance of a lodging chain’, Cornell Hotel and Restaurant Administration Quarterly, Vol. 46, No. 4, pp.394–412.
Bergin-Seers, S. and Jago, L. (2007) ‘Performance measurement in small motels in Australia’, Tourism and Hospitality Research, Vol. 7, No. 2, pp.144–155.
Braam, G.J.M. and Nijssen, E.J. (2004) ‘Performance effects of using the balanced scorecard: a note on the Dutch experience’, Long Range Planning, Vol. 37, No. 4, pp.335–349.
Brander-Brown, J. and McDonnell, B. (1995) ‘The balanced scorecard: short term guest or long term resident?’, International Journal of Contemporary Hospitality Management, Vol. 7, Nos. 2/3, pp.7–11.
Chand, M. (2009) ‘Performance measurement practices and organisational strategy: a study of Indian leisure enterprises’, International Journal of Leisure and Tourism Marketing, Vol. l, No. 1, pp.12–28.
Chen, F., Hsua, T. and Tzengb, G. (2011) ‘A balanced scorecard approach to establish a performance evaluation and relationship model for hot spring hotels based on a hybrid MCDM model combining DEMATEL and ANP’, International Journal of Hospitality Management, Vol. 30, No. 4, pp.908–932.
Cohen, S., Thiraios, D. and Kandilorou, M. (2008) ‘Performance parameters interrelations from a balanced scorecard perspective: an analysis of Greek companies’, Managerial Auditing Journal, Vol. 23, No. 5, pp.485–503.
Davis, S. and Albright, T. (2004) ‘An investigation of the effect of balanced scorecard implementation on financial performance’, Management Accounting Research, Vol. 15, No. 2, pp.135–153.
22 D. Kala and S.C. Bagri
Denton, G.A. and White, B. (2000) ‘Implementing a balanced scorecard approach to managing hotel operations’, Cornell Hotel and Restaurant Administration Quarterly, Vol. 41, No. 1, pp.94–107.
Doran, M.S., Haddad, K. and Chow, C.W. (2002) ‘Maximizing the success of balanced scorecard implementation in the hospitality industry’, International Journal of Hospitality and Tourism Administration, Vol. 3, No. 3, pp.33–58.
El-Hindawy, M. and Alamasi, A. (2014) ‘Measurement of the strategic performance of hospitality in the Kingdom of Saudi Arabia: a balanced scorecard approach’, Arab Economic and Business Journal, Vol. 9, No. 1, pp.12–26.
Evans, N. (2005) ‘Assessing the balanced scorecard as a management tool for hotels’, International Journal of Contemporary Hospitality Management, Vol. 17, No. 5, pp.376–390.
Farooq A. and Hussain Z., (2011) ‘Balanced scorecard perspective on change and performance: a study of selected Indian companies’, Journal of Global Strategic Management, June, Vol. 9, pp.168–179.
Fitzgerald, L., Johnston, R., Brignall, S., Silvestro, R. and Voss, C. (1991) Performance Measurement in Service Businesses, LIMA, London.
Gabus, A. and Fontela, E. (1973) Perceptions of the World Problematique: Communication Procedure, Communicating with those Bearing Collective Responsibility, DEMATEL Report No. 1, Battelle Geneva Research Center, Geneva, Switzerland.
Gabus, A. and Fontela, E. (1976) The DEMATEL Observer, DEMATEL 1976 Report. Switzerland, Geneva, Battelle Geneva Research Center.
Govindarajan, V. and Gupta, A. (1985) ‘Linking control systems to business unit strategy: impact on performance’, Accounting, Organizations and Society, Vol. 10, No. 1, pp.51–66.
Haktanir, M. and Harris, P. (2005) ‘Performance measurement practice in an independent hotel context – a case study approach’, International Journal of Contemporary Hospitality Management, Vol. 17, No. 1, pp.39–50.
Harris, P.J. and Mongiello, M. (2001) ‘Key performance indicators in European hotel properties: general managers’ choices and company profiles’, International Journal of Contemporary Hospitality Management, Vol. 13, No. 3, pp.120–127.
Hendricks, K., Hora, M., Menor, L. and Wiedman, C. (2012) ‘Adoption of the balanced scorecard: a contingency variables analysis’, Canadian Journal of Administrative Sciences, Vol. 29, No. 2, pp.124–138.
Hoque, Z. and James, W. (2000) ‘Linking balanced scorecard measures to size and market factors: impact on organizational performance’, Journal of Management Accounting Research, Vol. 12, No. 1, pp.1–17.
Huang, H., Chu, W. and Wang W. (2007) ‘Strategic performance measurement and value drivers: evidence from international tourist hotels in an emerging economy’, Service Industries Journal, December, Vol. 27, No. 8, pp.1111–1128.
Huckestein, D. and Duboff, R. (1999) ‘Hilton hotels: a comprehensive approach to delivering value for all stakeholders’, Cornell Hotel and Restaurant Administration Quarterly, August, pp.28–38.
Ittner, C.D. and Larcker, D.F. (1998a) ‘Are non-financial measures leading indicators of financial performance?: An analysis of customer satisfaction’, Journal of Accounting Research, Supplement, Vol. 36, pp.1–35.
Ittner, C.D. and Larcker, D.F. (1998b) ‘Innovations in performance measurement: trends and research implications’, Journal of Management Accounting Research, Vol. 10, pp.205–238.
Ittner, C.D., Larcker, D.F. and Randall, T. (2003) ‘Performance implications of strategic performance measurement in financial services firms’, Accounting, Organizations and Society, Vol. 28, Nos. 7–8, pp.715–741.
Ivankovic, G., Jankovic, S. and Persic, M. (2010) ‘Framework for performance measurement in hospitality industry – case study Slovenia’, Ekonomska Istrazivanja, Vol. 23, No. 3, pp.12–23.
Designing the strategy map for hotels with key performance indicators 23
Jassbi, J., Mohamadnejad, F. and Nasrollahzadeh, H. (2011) ‘A fuzzy DEMATEL framework for modeling cause and effect relationships of strategy map’, Expert Systems with Applications, Vol. 38, No. 5, pp.5967–5973.
Jusoh, R. (2010) ‘The influence of perceived environmental uncertainty, firm size, and strategy on multiple performance measures usage’, African Journal of Business Management, Vol. 4, No. 10, pp.1972–1984.
Kald, M. and Nilsson, F. (2000) ‘Performance measurement at Nordic companies’, European Management Journal, Vol. 18, No. 1, pp.113–127.
Kaplan, R.S. and Norton, D.P. (1992) ‘The balanced scorecard – measures that drive performance’, Harvard Business Review, Vol. 70, No. 1, pp.71–79.
Kaplan, R.S. and Norton, D.P. (1996b) ‘Using the balanced scorecard as a strategic management system’, Harvard Business Review, Vol. 74, No. 1, pp.75–85.
Kaplan, R.S. and Norton, D.P. (2001c) ‘Transforming the balanced scorecard from performance measurement to strategic management: Part II’, Accounting Horizons, Vol. 15, No. 2, pp.147–160.
Kaplan, R.S. and Norton, D.P. (2006) Alignment: Using the Balanced Scorecard to Create Corporate Synergies, Harvard Business School Press, Boston, Mass.
Keshavarz, E., Ftahikenari, M., Rohani, A. and Bagheri, S.M. (2014) ‘Performance evaluation of banks using balanced scorecard’, International Journal of Business Excellence, Vol. 7, No. 3, pp.371–393.
Khani, A. and Ahmadi, M. (2012) ‘Performance measurement using balanced scorecard measures and strategy based on Miles and Snow’s typology in Iran’, African Journal of Business Management, Vol. 6, No. 46, pp.11391–11400.
Kim, W.G. and Lee, S. (2009) ‘Developing a new performance measurement metric in the hotel industry: application of the balanced scorecard and the fuzzy-analytic hierarchy process model’, Paper presented at International CHRIE Conference, San Francisco, CA.
Lin, C.L. and Tzeng, G.H. (2009) ‘A value-created system of science (technology) park by using DEMETEL’, Expert Systems with Applications, Vol. 36, No. 6, pp.9683–9697.
Malmi, T. (2001) ‘Balanced scorecards in Finnish companies: a research note’, Management Accounting Research, Vol. 12, No. 2, pp.207–220.
Min, H., Min, H. and Joo, J. (2008) ‘A data envelopment analysis-based balanced scorecard for measuring the comparative efficiency of Korean luxury hotels’, International Journal of Quality and Reliability Management, Vol. 25, No. 4, pp.349–365.
Nielson, S. and Sorensen, R. (2003) ‘Motives, diffusion and utilisation of the balanced scorecard in Denmark’, The 26th Annual Congress of the European Accounting Association, Seville (Spain).
Norreklit, H. (2000) ‘The balance on the balanced scorecard-a critical analysis of some of its assumptions’, Management Accounting Research, Vol. 11, No. 1, pp.65–88.
Oliveras, E. and Amat, O. (2002) ‘The balanced scorecard assumptions and drivers of business growth’, The 25th Annual Congress of the European Accounting Association, Copenhagen, Denmark.
Pavlatos, O. and Paggios, I. (2009) ‘Management accounting practices in the Greek hospitality industry’, Managerial Auditing Journal, Vol. 24, No. 1, pp.81–98.
Phillips, P. and Louvieris, P. (2005) ‘Performance measurement systems in tourism, hospitality, and leisure small medium-sized enterprises: a balanced scorecard perspective’, Journal of Travel Research, Vol. 44, No. 2, pp.201–211.
Phillips, P.A. (1999) ‘Hotel performance and competitive advantage: a contingency approach’, International Journal of Contemporary Hospitality Management, Vol. 11, No. 7, pp.359–365.
Rigby, D. (2001) ‘Management tools and techniques: a survey’, California Management Review, Winter, Vol. 43, No. 2, pp.139–160.
24 D. Kala and S.C. Bagri
Ruzita, J., Nasir, I.D. and Yuserrie, Z. (2008) ‘The performance consequence of multiple performance measures usage: evidence from the Malaysian manufacturers’, International Journal of Productivity and Performance Management, Vol. 57, No. 2, pp.119–136.
Sainaghi, R., Phillips, P. and Corti, V. (2013) ‘Measuring hotel performance: using a balanced scorecard perspectives’ approach’, International Journal of Hospitality Management, September, Vol. 34, pp.150–159.
Salehi, M. and Ghorbani, B. (2011) ‘A study of using financial and non – financial criteria in evaluating performance: some evidence of Iran’, Serbian Journal of Management, Vol. 6, No. 1, pp.97–108.
Shieh, J.I., Wu, H.H. and Huang, K.K. (2010) ‘A DEMATEL method in identifying key success factors of hospital service quality’, Knowledge-Based Systems, Vol. 23, No. 3, pp.277–282.
Speckbacher, G., Bischof, J. and Pfeiffer, T. (2003) ‘A descriptive analysis on the implementation of balanced scorecards in German-speaking countries’, Management Accounting Research, Vol. 14, No. 4, pp.361–389.
Wadongo, B., Odhuno, E., Kambona, E. and Othuon, L. (2010) ‘Key performance indicators in the Kenyan hospitality industry: a managerial perspective’, Benchmarking: An International Journal, Vol. 17, No. 6, pp.858–875.
Wu, H.Y. (2012) ‘Constructing a strategy map for banking institutions with key performance indicators of the balanced scorecard’, Evaluation and Program Planning, Vol. 35, No. 3, pp.303–320.
Wu, W.W. and Lee, Y.T. (2007) ‘Developing global managers’ competencies using the fuzzy DEMATEL method’, Expert Systems with Applications, Vol. 32, No. 2, pp.499–507.
Xiong, Y., Su, W. and Lin, T.W. (2008) ‘The use of financial and nonfinancial performance measures in Chinese firms’, Cost Management, Vol. 22, No. 5, pp.37–46.
Yang, Y.P., Shieh, H.M., Leu, J.D. and Tzeng, G.H. (2008) ‘A novel hybrid MCDM model combined with DEMATEL and ANP with applications’, International Journal Operational Research, Vol. 5, No. 3, pp.160–168.