Embed Size (px)
Citation preview
1
Determinants of labour demand in the manufacturing sector: does
firm ownership matter?
Kien Trung Nguyen∗
This paper examines the effect of firm ownership on labour demand in Vietnamese
manufacturing over the period 2000-09. The core focus of the paper is an econometric
analysis of the determinants of labour demand in a manufacturing firm using firm-level data.
The results show that the labour demand of domestic private firms and FIEs has responded
slowly to wage changes while wholly owned FIEs and joint ventures are found to have higher
employment elasticity with respect to output, compared to domestic firms, in particular in the
export-oriented industries. Interestingly, the impact of firm ownership on labour demand has
been missing after further outward-oriented reforms since 2006.
Keywords: labour demand, firm ownership, manufacturing, export-orientation, panel
estimators
JEL Classification: J23, L32, C23
March, 2013
∗ PhD Scholar, Arndt-Corden Deparment of Economics, Crawford School of Public Policy, ANU,
[email protected]. I thank Eric D.Ramstetter, Hal Hill and Prema-chandra Athukorala for their valuable
comments and suggestions. However, I am solely responsible for any remaining errors in the paper.
2
Determinants of labour demand in the manufacturing sector: does
firm ownership matter?
1. Introduction
Much of the interest in the effects of economic reforms in a labour-abundant developing
economy concerns the effects on manufacturing employment. In fact, there is a vast literature
examining the impact of international trade and foreign investment on employment generation
in manufacturing in developing countries.1So far few research attempts have been undertaken
to examine manufacturing employment in Vietnam following outward-oriented economic
policy reforms. Several studies, however, investigate the issue of firm-ownership types in
association with labour productivity, export propensity and wages in the Vietnamese
manufacturing sector (Athukorala & Tran 2012; Phan & Ramstetter 2004b, 2004a, 2009). In
addition, the overall trends and patterns of manufacturing employment resulting from trade
and investment liberalization have been examined in a further few empirical studies (Fukase
2012; Jenkins 2004; Jenkins 2006; Kien & Heo 2009; McCaig 2011). Out of this literature, an
assertion that developing labour-intensive manufacturing for exports is an important premise
for job generation and poverty alleviation is one of the key concerns in the theoretical
framework of the Lewis-Fei-Ranis growth model in a labour-abundant economy such as
Vietnam. However, the important issue of how firm ownership affect labour demand for a
manufacturing firm in a context of export-oriented industrialization (EOI) in Vietnam is yet to
be explored and we also need to examine how it can inform current debate about job creation
following EOI.
On these grounds, there is a key rationale for expecting varied impacts of firm ownership on
labour demand in a manufacturing sector following economic reforms in a developing
economy. One possible explanation for this is that foreign investment enterprises normally
show more efficiency in business performance than domestic firms due to acquisition of firm-
specific assets (Bellak 2004; Lipsey 2004; Ramstetter 1999; Ramstetter & Sjoholm 2006). In
addition, the development of private firms can also contribute to labour expansion in the
manufacturing sector because these firms tend to be involved in labour-intensive industries as
has been the case in labour-abundant economies in East Asia (Hill 1990a, 1990b; Ranis 1979;
Riedel 1997; Song 1990). By contrast, in a typical transition economy, state owned
1For useful surveys of this literature, see Currie & Harrison 1997; Feenstra & Hanson 1996; Feenstra & Hanson
1997; Greenaway, Hine & Wright 1999; Hanson & Harrison 1999; Harrison & Hanson 1999; Hasan & Chen
2004; Lipsey 2004; Sjöholm & Lipsey 2006; Suryahadi, Chen & Tyers 2001.
3
enterprises which were assigned a significant position for economic development are mainly
involved in capital-intensive industries with low job creation (Djankov & Murrell 2002;
Megginson & Netter 2001).
This paper examines this and related issues through an analysis of determinants of labour
demand in Vietnamese manufacturing in relation to outward-oriented economic policy
reforms over the period 2000-09. Thus, my proposition, derived from the association between
firm ownership and manufacturing performance, is that changes in firm ownership types
following the outward-oriented reforms can lead to a significant variation on labour demand
through its impact on output and wages. These variations in ownership have emanated
through reforming public enterprises, developing domestic private firms as well as attracting
foreign invested enterprises during the reform process.
In this paper, I am specifically interested in the performance of manufacturing employment,
because the dynamism of employment expansion in a labour abundant economy relies heavily
on this sector. The empirical core of this paper provides an econometric analysis of
determinants of labour demand, using a firm-level panel data set, paying attention to the
implications of firm-ownership types. The panel dataset used in the study is derived from the
unpublished returns to the annual Enterprise Survey, undertaken by the General Statistical
Office of Vietnam (GSO) in the period 2000-09.
The structure of this paper is as follows. Section 2 provides an overview of the trends and
patterns of manufacturing employment, to set the stage for the ensuing empirical analysis.
Section 3 examines the firm ownership impact on labour demand in manufacturing firms to
show variation in labour demand elasticities with respect to output and wages, respectively.
The final section provides some concluding remarks for implications of outward-oriented
reforms on labour demand in Vietnamese manufacturing.
2. Outward-oriented reforms and manufacturing employment: An
overview
Outward-oriented economic policy reforms since the early 2000s have generated special
interest in how effective the role of manufacturing has been in job generation in Vietnam.
This section begins with an examination of employment growth and its patterns in particular
manufacturing industries, with reference to five firm ownership groups. Following from this,
4
it presents a statistical description of the industrial composition of manufacturing with respect
to ownership category and firm size.
There has been a significant increase in employment in the manufacturing sector in Vietnam
following the economic reforms.2 This growth has mainly been driven by the dynamism of a
private firm group, which has played a pivotal role in notable changes in employment
composition over the period 2000-09. Domestic private enterprises and wholly owned
foreign-invested enterprises (FIEs) dominated this impressive employment generation, while
an SOE group recorded a downturn in job creation throughout this period. At the same time,
employment in a group of joint venture FIEs has been minor and stable. The data on
employment growth and its patterns, presented by firm ownership group for every particular
industry, are summarized in Tables 1 and 2. The data reveal several interesting features.
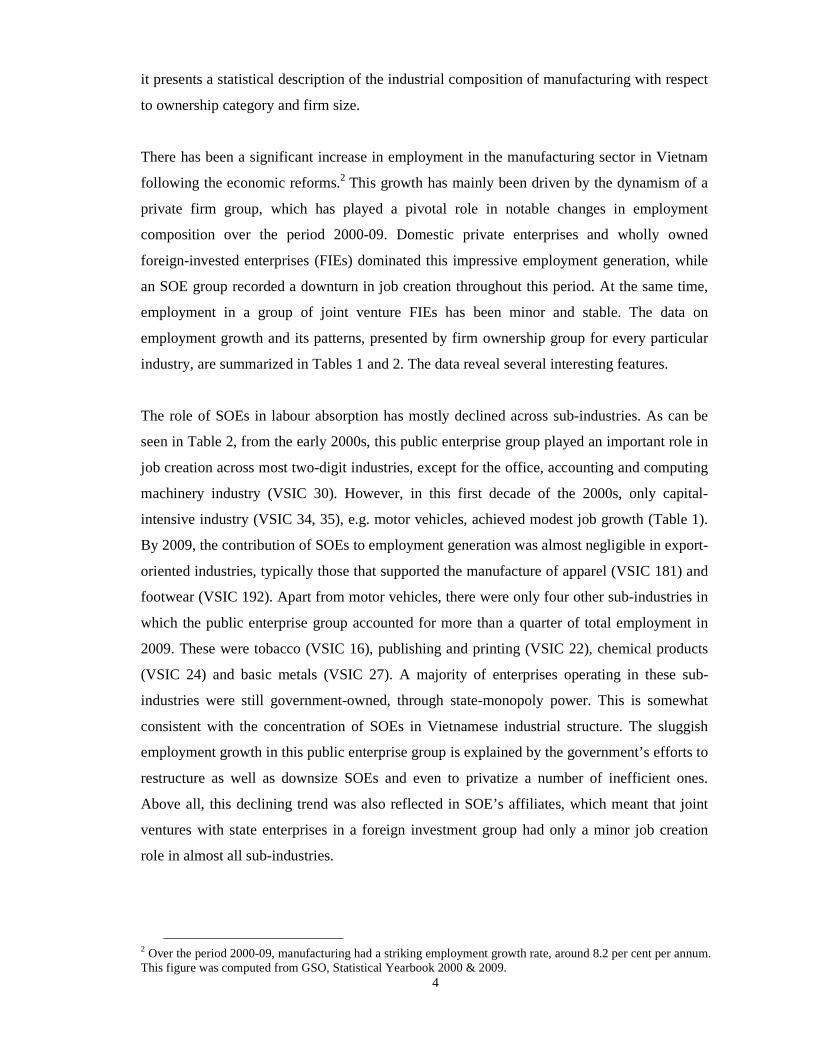
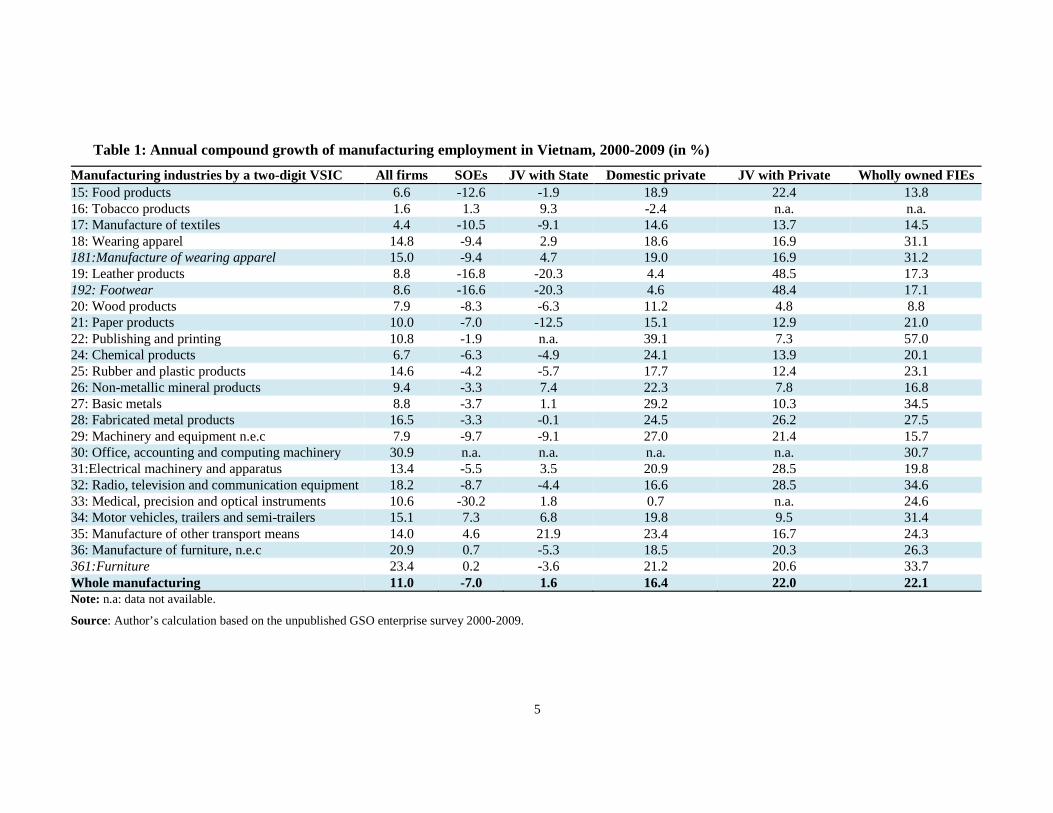
The role of SOEs in labour absorption has mostly declined across sub-industries. As can be
seen in Table 2, from the early 2000s, this public enterprise group played an important role in
job creation across most two-digit industries, except for the office, accounting and computing
machinery industry (VSIC 30). However, in this first decade of the 2000s, only capital-
intensive industry (VSIC 34, 35), e.g. motor vehicles, achieved modest job growth (Table 1).
By 2009, the contribution of SOEs to employment generation was almost negligible in export-
oriented industries, typically those that supported the manufacture of apparel (VSIC 181) and
footwear (VSIC 192). Apart from motor vehicles, there were only four other sub-industries in
which the public enterprise group accounted for more than a quarter of total employment in
2009. These were tobacco (VSIC 16), publishing and printing (VSIC 22), chemical products
(VSIC 24) and basic metals (VSIC 27). A majority of enterprises operating in these sub-
industries were still government-owned, through state-monopoly power. This is somewhat
consistent with the concentration of SOEs in Vietnamese industrial structure. The sluggish
employment growth in this public enterprise group is explained by the government’s efforts to
restructure as well as downsize SOEs and even to privatize a number of inefficient ones.
Above all, this declining trend was also reflected in SOE’s affiliates, which meant that joint
ventures with state enterprises in a foreign investment group had only a minor job creation
role in almost all sub-industries.
2 Over the period 2000-09, manufacturing had a striking employment growth rate, around 8.2 per cent per annum. This figure was computed from GSO, Statistical Yearbook 2000 & 2009.
5
Table 1: Annual compound growth of manufacturing employment in Vietnam, 2000-2009 (in %)
Manufacturing industries by a two-digit VSIC All fi rms SOEs JV with State Domestic private JV with Private Wholly owned FIEs 15: Food products 6.6 -12.6 -1.9 18.9 22.4 13.8 16: Tobacco products 1.6 1.3 9.3 -2.4 n.a. n.a. 17: Manufacture of textiles 4.4 -10.5 -9.1 14.6 13.7 14.5 18: Wearing apparel 14.8 -9.4 2.9 18.6 16.9 31.1 181:Manufacture of wearing apparel 15.0 -9.4 4.7 19.0 16.9 31.2 19: Leather products 8.8 -16.8 -20.3 4.4 48.5 17.3 192: Footwear 8.6 -16.6 -20.3 4.6 48.4 17.1 20: Wood products 7.9 -8.3 -6.3 11.2 4.8 8.8 21: Paper products 10.0 -7.0 -12.5 15.1 12.9 21.0 22: Publishing and printing 10.8 -1.9 n.a. 39.1 7.3 57.0 24: Chemical products 6.7 -6.3 -4.9 24.1 13.9 20.1 25: Rubber and plastic products 14.6 -4.2 -5.7 17.7 12.4 23.1 26: Non-metallic mineral products 9.4 -3.3 7.4 22.3 7.8 16.8 27: Basic metals 8.8 -3.7 1.1 29.2 10.3 34.5 28: Fabricated metal products 16.5 -3.3 -0.1 24.5 26.2 27.5 29: Machinery and equipment n.e.c 7.9 -9.7 -9.1 27.0 21.4 15.7 30: Office, accounting and computing machinery 30.9 n.a. n.a. n.a. n.a. 30.7 31:Electrical machinery and apparatus 13.4 -5.5 3.5 20.9 28.5 19.8 32: Radio, television and communication equipment 18.2 -8.7 -4.4 16.6 28.5 34.6 33: Medical, precision and optical instruments 10.6 -30.2 1.8 0.7 n.a. 24.6 34: Motor vehicles, trailers and semi-trailers 15.1 7.3 6.8 19.8 9.5 31.4 35: Manufacture of other transport means 14.0 4.6 21.9 23.4 16.7 24.3 36: Manufacture of furniture, n.e.c 20.9 0.7 -5.3 18.5 20.3 26.3 361:Furniture 23.4 0.2 -3.6 21.2 20.6 33.7 Whole manufacturing 11.0 -7.0 1.6 16.4 22.0 22.1 Note: n.a: data not available.
Source: Author’s calculation based on the unpublished GSO enterprise survey 2000-2009.
6
Table 2: Manufacturing employment by ownership in Vietnam, 2000 and 2009 (in %)
Manufacturing industries by a two-digit VSIC Total employment (‘000 people)
Percentage shares SOEs JVs with State Domestic private JVs with Private Wholly owned
FIEs 2000 2009 2000 2009 2000 2009 2000 2009 2000 2009 2000 2009 15: Food products 254 453 54.7 9.1 5.5 2.6 24.8 65.8 0.8 2.9 6.9 12.4 16: Tobacco products 12 14 95.6 93.0 3.0 5.9 1.1 0.7 0.0 0.0 0.0 0.0 17: Manufacture of textiles 121 178 61.4 15.4 3.3 1.0 18.6 42.9 0.5 1.0 15.5 35.6 18: Wearing apparel 217 753 52.3 6.2 1.8 0.7 28.0 37.5 1.7 2.0 15.9 52.1 181:Manufacture of wearing apparel 214 752 52.9 6.2 1.6 0.7 27.6 37.5 1.8 2.0 15.9 52.2 19: Leather products 282 600 25.6 2.3 3.0 0.2 37.1 25.7 0.3 4.3 34.0 67.1 192: Footwear 259 543 26.3 2.4 3.3 0.2 36.8 26.4 0.3 4.8 33.3 66.0 20: Wood products 60 119 29.6 6.9 2.8 0.8 50.7 66.4 1.4 1.1 10.0 10.8 21: Paper products 35 82 46.7 10.3 1.5 0.2 39.4 59.5 0.3 0.3 8.8 20.9 22: Publishing and printing 22 57 91.8 30.7 0.0 0.0 4.0 31.0 0.7 0.5 0.5 11.5 24: Chemical products 64 114 72.9 22.5 5.5 2.0 12.1 47.1 0.8 1.4 6.9 20.0 25: Rubber and plastic products 47 162 35.6 7.1 5.0 0.9 31.8 40.3 1.8 1.5 22.6 42.9 26: Non-metallic mineral products 123 278 63.6 20.9 4.4 3.7 24.2 65.7 0.5 0.4 3.3 5.8 27: Basic metals 29 62 80.9 26.9 3.9 2.0 11.4 53.7 1.1 1.2 1.6 10.7 28: Fabricated metal products 48 190 50.5 9.5 7.3 1.8 23.2 42.3 0.5 1.1 13.0 29.4 29: Machinery and equipment n.e.c 30 59 70.7 14.2 2.0 0.4 11.6 50.0 0.4 1.2 13.0 24.4 30: Office, accounting & computing machinery 3 34 0.0 0.0 0.0 0.0 0.0 1.0 0.0 0.0 99.5 98.0 31:Electrical machinery and apparatus 36 113 38.4 7.4 8.8 3.9 9.7 17.3 0.3 0.8 41.8 68.3 32: Radio, television & communication equipment
16 71 44.6 4.4 20.5 3.1 7.7 6.8 1.1 2.3 25.3 81.4
33: Medical, precision and optical instruments 7 16 31.4 0.5 8.0 3.8 33.7 14.5 0.0 0.3 25.8 75.7 34: Motor vehicles, trailers and semi-trailers 15 52 50.9 27.3 18.3 9.4 13.6 19.6 0.2 0.1 12.3 40.9 35: Manufacture of other transport means 38 125 63.3 29.1 8.8 16.1 13.2 27.0 2.9 3.6 10.1 22.0 36: Manufacture of furniture, n.e.c 63 346 9.6 1.8 2.1 0.2 49.5 41.3 1.5 1.4 34.2 50.4 361:Furniture 39 258 12.0 1.8 2.7 0.3 58.3 49.4 2.4 1.9 20.8 42.6 Whole manufacturing 1,522 3,882 48.4 9.9 4.2 1.9 27.0 41.7 0.9 2.0 16.8 39.7 Source: Author’s calculation based on the unpublished GSO enterprise survey 2000-2009
7
Table 3: Industrial composition of manufacturing employment by three main specific ownership in Vietnam, 2000 & 2009(in %)
Manufacturing industries by a two-digit VSIC Total employment SOEs Domestic private Wholly owned FIEs 2000 2009 2000 2009 2000 2009 2000 2009
(1) Labour intensive sector 50.4 55.9 42.0 32.1 55.1 43.4 75.8 79.2 Traditional labour intensive 46.3 49.8 38.9 29.0 53.4 41.7 66.5 67.5 17: Manufacture of textiles 7.9 4.6 10.1 7.1 5.5 4.7 7.3 4.1 18: Wearing apparel 14.3 19.4 15.4 12.1 14.8 17.5 13.4 25.5 19: Leather products 18.5 15.5 9.8 3.6 25.4 9.6 37.4 26.1 36: Manufacture of furniture, n.e.c 4.1 8.9 0.8 1.7 7.5 8.8 8.3 11.3 22: Publishing and printing 1.5 1.5 2.8 4.5 0.2 1.1 0.0 0.4 Electronics 4.1 6.0 3.1 3.0 1.7 1.7 9.3 11.7 30: Office, accounting and computing machinery 0.2 0.9 0.0 0.0 0.0 0.0 1.2 2.2 31:Electrical machinery and apparatus 2.4 2.9 1.9 2.2 0.9 1.2 5.9 5.0 32: Radio, television and communication equipment 1.0 1.8 1.0 0.8 0.3 0.3 1.6 3.8 33: Medical, precision and optical instruments 0.4 0.4 0.3 0.0 0.5 0.1 0.7 0.8 (2) Resource based, labour-intensive sector 21.4 15.1 22.8 16.2 22.7 23.3 9.1 4.5 15: Food products 16.7 11.7 18.9 10.8 15.3 18.4 6.8 3.6 16: Tobacco products 0.8 0.3 1.5 3.3 0.0 0.0 0.0 0.0 20: Wood products 3.9 3.1 2.4 2.1 7.4 4.9 2.3 0.8 (3) Resource based, capital-intensive sector 19.6 18.0 24.6 31.3 16.9 23.7 8.8 8.6 21: Paper products 2.3 2.1 2.2 2.2 3.3 3.0 1.2 1.1 24: Chemical products 4.2 2.9 6.3 6.7 1.9 3.3 1.7 1.5 25: Rubber and plastic products 3.1 4.2 2.3 3.0 3.7 4.0 4.2 4.5 26: Non-metallic mineral products 8.1 7.2 10.7 15.1 7.3 11.3 1.6 1.1 27: Basic metals 1.9 1.6 3.2 4.3 0.8 2.0 0.2 0.4 (4) Capital intensive sector 8.6 11.0 10.5 20.1 5.3 9.5 6.2 7.7 28: Fabricated metal products 3.2 4.9 3.3 4.7 2.7 5.0 2.5 3.6 29: Machinery and equipment n.e.c 2.0 1.5 2.9 2.2 0.8 1.8 1.5 0.9 34: Motor vehicles, trailers and semi-trailers 1.0 1.3 1.0 3.7 0.5 0.6 0.7 1.4 35: Manufacture of other transport means 2.5 3.2 3.3 9.5 1.2 2.1 1.5 1.8 Total employment (‘000 people) 1,522 3,882 736 384 412 1,617 256 1,541
Source: Author’s calculation based on the unpublished GSO enterprise survey 2000-2009
8
Since 2000, growth in employment is observable in both firm ownership groups (domestic
private enterprises and wholly owned FIEs) although at varying speeds as noted in Table 1.
The employment expansion in these two firm groups has compensated for the contraction in
SOE employment in most industries. For instance, between 2000 and 2009 the number of
workers employed in the apparel industry (VSIC 181) expanded at an impressive rate of 15
per cent. This was driven primarily by the growing importance of both firm ownership groups
(domestic private and wholly owned FIE) in labour absorption, despite a notable decline
(minus nine per cent) in SOE employment over that period. Equally important is that the
industries with the fastest employment growth over the examined period were those with the
greatest participation of domestic private firms or wholly owned FIEs. This feature is of
relevance in manufacturing industries such as food products (VSIC 15), apparel (VSIC 181),
footwear (VSIC 192) and furniture (VSIC 361), in which private firms have the most
impressive job growth. This pronounced shift in employment pattern away from state toward
private ownership is prominent among East Asian economies (Ranis 1979; Song 1990).
The increasing importance of the private firm ownership group in job generation across
particular industries in Vietnamese manufacturing has been underpinned by the expansion of
industries with high export-orientation. The period 2000-09 has witnessed a marked
employment expansion by domestic private firms and wholly owned FIEs, possibly
influenced by the rise in exports. However, there have been contrasting trends among these
firm ownership groups. By 2009, the employment share of the domestic private firm group
across export industries was particularly high in food processing, wood products and furniture
industries. These industries largely depend on the supply of domestic resources for
production. At the same time, the group of wholly owned FIEs dominates conventional
labour-intensive industries, such as garments and footwear. A corollary to this dominance in
the traditional labour-intensive sector is the contribution of this firm group to employment
generation in the newly emerging export industry of electronics (VSIC30-33).
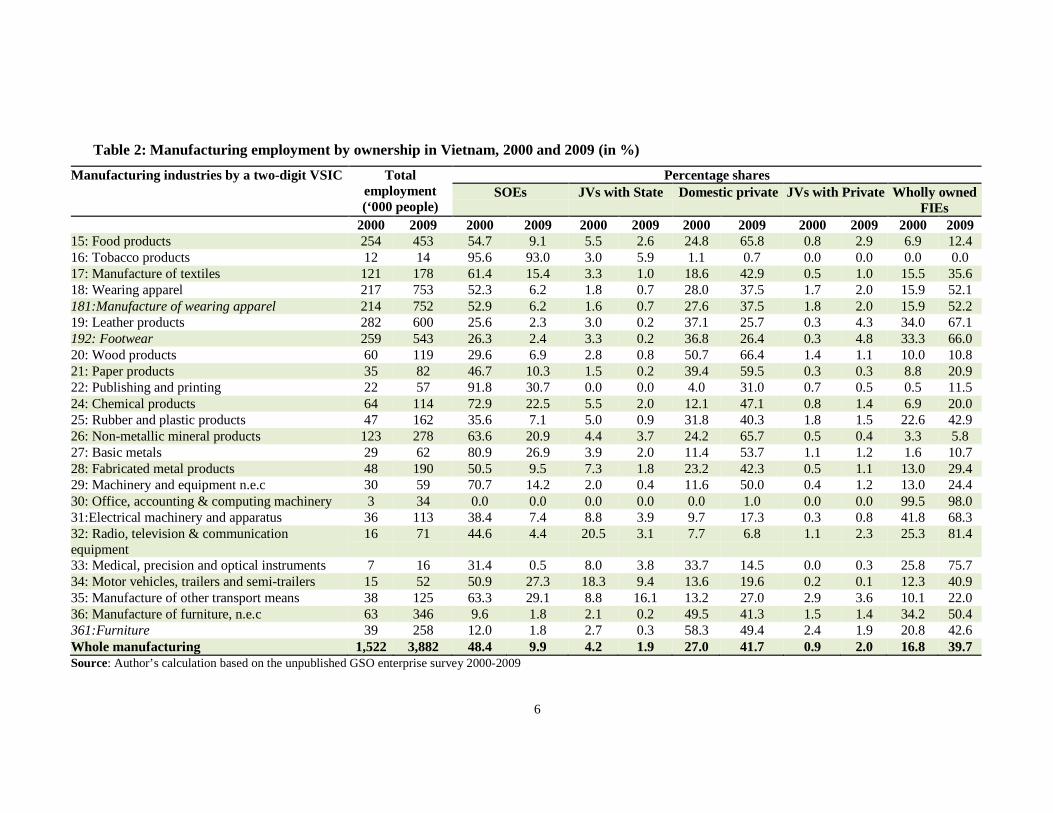
In another perspective, Table 3 shows the industrial composition of employment
disaggregated into three main firm ownership groups. 3 Manufacturing sub-industries are
classified into four main sectors in order to facilitate analysis. This classification is broadly in
line with an examination of factor intensity in manufacturing trade and production (Krause
3 Two corporate forms of joint-venture FIEs played unimportant roles in employment generation over the period 2000-09 due to their minor shares in total employment.
9
1982; Lary 1968).4 These are labour-intensive, resource-based (labour-and capital-intensive)
and capital-intensive sectors. The former includes traditional labour-intensive industries and
electronics. It is particularly interesting to note that a factor intensity ranking for the
electronics industry is shown to unambiguously change between industrialized economies and
developing ones (Lall 2000), so it is quite logical to treat this industry as a labour-intensive
sector in the context of a labour-abundant developing economy. This treatment is relevant to
this empirical analysis due to the rise of global production networks, which expand trade
through the fragmentation-based division of labour (Athukorala & Hill 2010). Consequently,
this composition shows three notable remarks.
First, there has been a growing concentration of a wholly owned FIE group in the labour-
intensive sector over the period 2000-09. During this time, above three-quarters of workers
employed in this group came from this sector. The high export-orientation of the manufacture
of apparel and footwear has been the dominant factor behind this structural shift. In 2009,
each of these two industries accounted for about a quarter of total employment created within
this firm group. Within this wholly owned FIE group, the electronics industry contributed
another 10 per cent of total employment. This suggests that export-oriented FIEs have become
a dynamic driver of employment generation in the manufacturing sector. Regarding the
domestic private firm group, the number of workers recruited within this group is more
equally distributed across all sub-industries. Of particular interest is that the employment
share of this group has significantly reduced in both areas of labour-intensive sectors
(traditional and resource-based) during 2000-09. This group is less heavily concentrated on
the traditional labour-intensive sector (accounting for about 40 per cent of the total
employment generated within this firm ownership group) compared to the wholly owned FIE
group in 2009. However, the domestic private firms recorded a noticeable increase in their
share of total employment for the resource-based, labour-intensive sector. By contrast, SOEs
have become less labour-intensive over the years. Within this public ownership group, the
employment share of the traditional labour-intensive sector declined from 38.9 per cent to 29
per cent between 2000 and 2009. It appears that state enterprises relied heavily on resource-
or capital-intensive industries, which normally require advanced technology and large-scale
capital investment.
4These capital intensity ratios have been computed from the data compiled from the Enterprise Survey of 2000-09 at the 4-digit level of disaggregation.
10
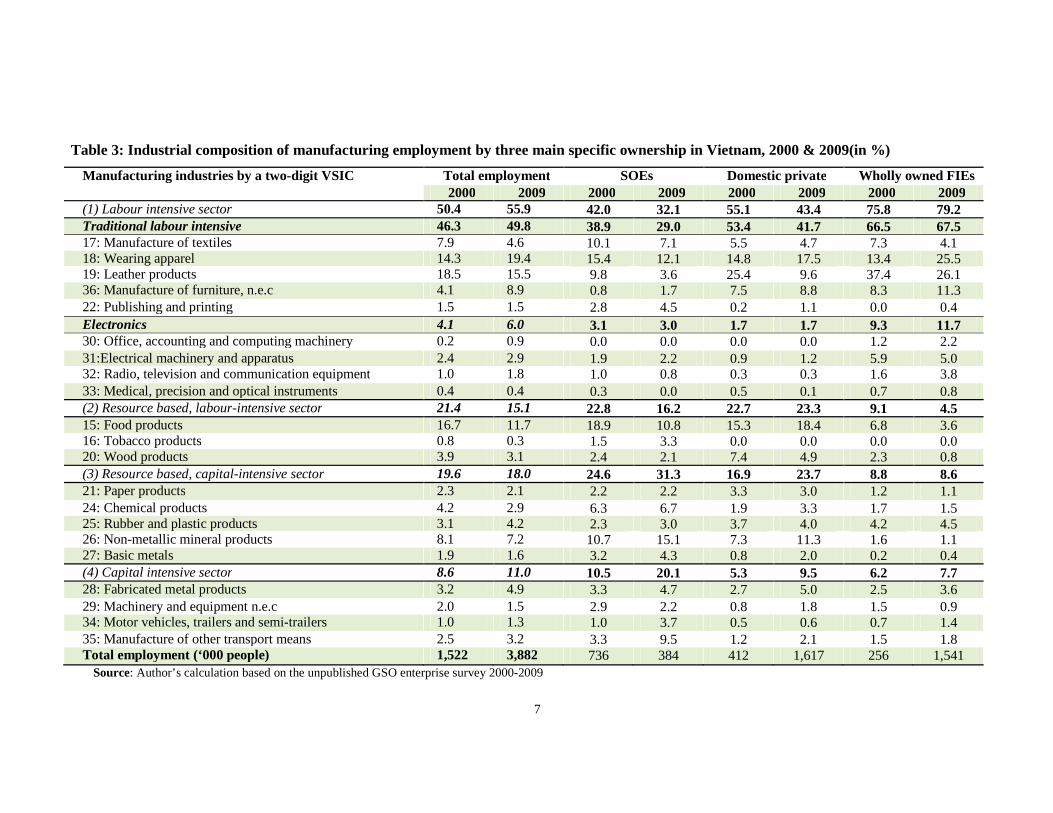
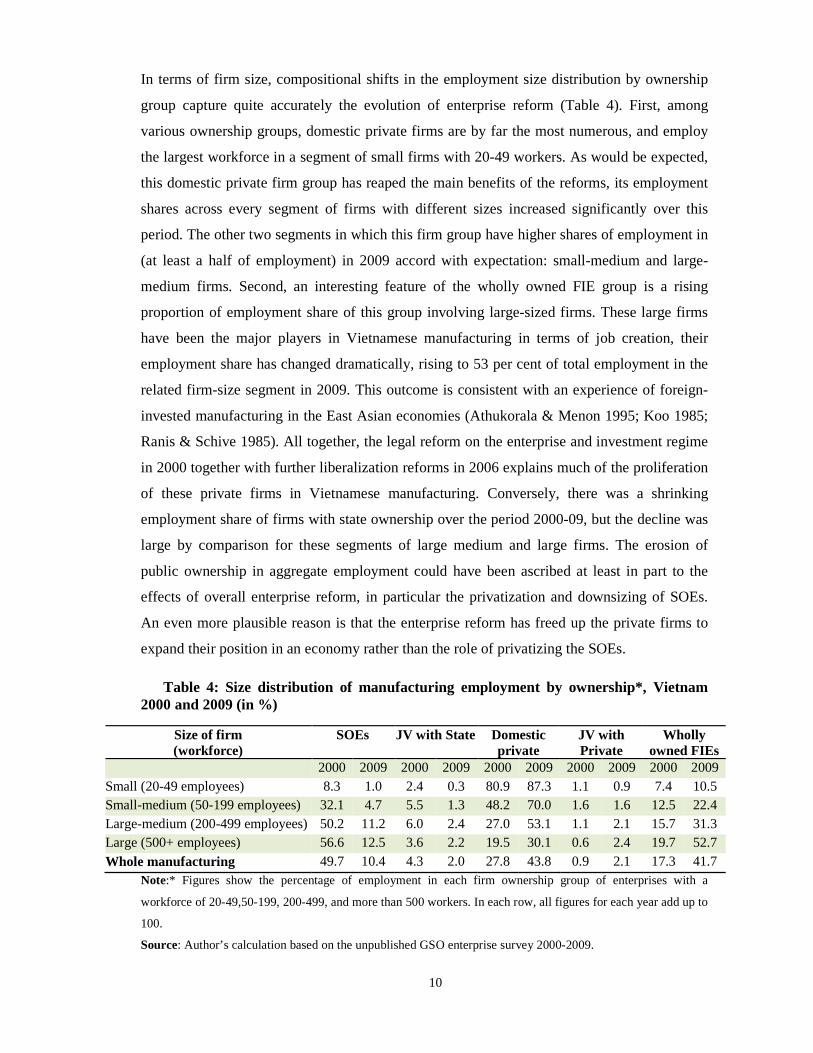
In terms of firm size, compositional shifts in the employment size distribution by ownership
group capture quite accurately the evolution of enterprise reform (Table 4). First, among
various ownership groups, domestic private firms are by far the most numerous, and employ
the largest workforce in a segment of small firms with 20-49 workers. As would be expected,
this domestic private firm group has reaped the main benefits of the reforms, its employment
shares across every segment of firms with different sizes increased significantly over this
period. The other two segments in which this firm group have higher shares of employment in
(at least a half of employment) in 2009 accord with expectation: small-medium and large-
medium firms. Second, an interesting feature of the wholly owned FIE group is a rising
proportion of employment share of this group involving large-sized firms. These large firms
have been the major players in Vietnamese manufacturing in terms of job creation, their
employment share has changed dramatically, rising to 53 per cent of total employment in the
related firm-size segment in 2009. This outcome is consistent with an experience of foreign-
invested manufacturing in the East Asian economies (Athukorala & Menon 1995; Koo 1985;
Ranis & Schive 1985). All together, the legal reform on the enterprise and investment regime
in 2000 together with further liberalization reforms in 2006 explains much of the proliferation
of these private firms in Vietnamese manufacturing. Conversely, there was a shrinking
employment share of firms with state ownership over the period 2000-09, but the decline was
large by comparison for these segments of large medium and large firms. The erosion of
public ownership in aggregate employment could have been ascribed at least in part to the
effects of overall enterprise reform, in particular the privatization and downsizing of SOEs.
An even more plausible reason is that the enterprise reform has freed up the private firms to
expand their position in an economy rather than the role of privatizing the SOEs.
Table 4: Size distribution of manufacturing employment by ownership*, Vietnam 2000 and 2009 (in %)
Size of firm (workforce)
SOEs JV with State Domestic private
JV with Private
Wholly owned FIEs
2000 2009 2000 2009 2000 2009 2000 2009 2000 2009 Small (20-49 employees) 8.3 1.0 2.4 0.3 80.9 87.3 1.1 0.9 7.4 10.5 Small-medium (50-199 employees) 32.1 4.7 5.5 1.3 48.2 70.0 1.6 1.6 12.5 22.4 Large-medium (200-499 employees) 50.2 11.2 6.0 2.4 27.0 53.1 1.1 2.1 15.7 31.3 Large (500+ employees) 56.6 12.5 3.6 2.2 19.5 30.1 0.6 2.4 19.7 52.7 Whole manufacturing 49.7 10.4 4.3 2.0 27.8 43.8 0.9 2.1 17.3 41.7
Note:* Figures show the percentage of employment in each firm ownership group of enterprises with a
workforce of 20-49,50-199, 200-499, and more than 500 workers. In each row, all figures for each year add up to
100.
Source: Author’s calculation based on the unpublished GSO enterprise survey 2000-2009.
11
In sum, these data support the hypothesis that when aggregate manufacturing employment is
expanding rapidly, the changing ownership type across different enterprises can generate a
high rate of job creation, depending on the progress of the liberalization process in trade,
investment and enterprise structure during the period 2000-09.
3. Firm ownership and labour demand in manufacturing
This section first develops the model specification for the analysis of determinants of
labour demand at a firm level in Vietnamese manufacturing over the period 2000-09. A next
part discusses estimation methodology, data sources and methods of data compilation. The
final presents estimation results for the effects of economic reforms on labour demand in
manufacturing, taking account of firm ownership features and industry characteristics.
3.1 The model
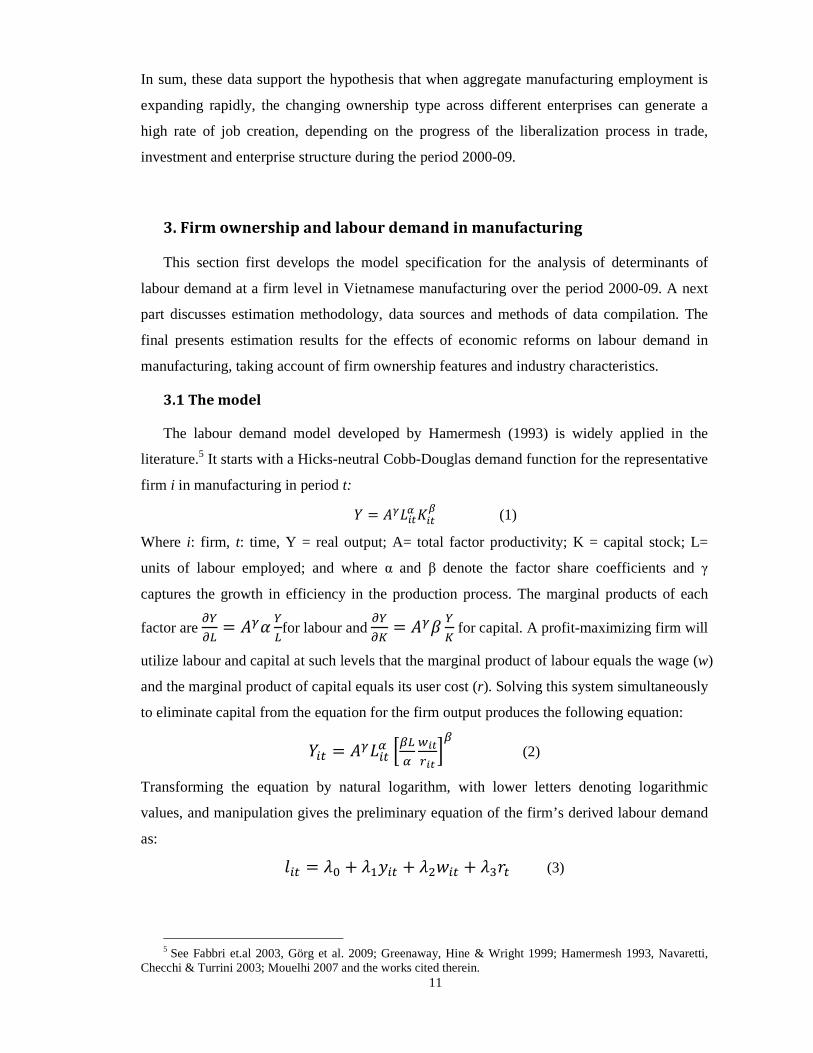
The labour demand model developed by Hamermesh (1993) is widely applied in the
literature.5 It starts with a Hicks-neutral Cobb-Douglas demand function for the representative
firm i in manufacturing in period t:
� � ������ �� (1)
Where i: firm, t: time, Y = real output; A= total factor productivity; K = capital stock; L=
units of labour employed; and where α and β denote the factor share coefficients and γ
captures the growth in efficiency in the production process. The marginal products of each
factor are � �� � ���
�for labour and � �� � ���
� for capital. A profit-maximizing firm will
utilize labour and capital at such levels that the marginal product of labour equals the wage (w)
and the marginal product of capital equals its user cost (r). Solving this system simultaneously
to eliminate capital from the equation for the firm output produces the following equation:
��� � ������ ���
������
� (2)
Transforming the equation by natural logarithm, with lower letters denoting logarithmic
values, and manipulation gives the preliminary equation of the firm’s derived labour demand
as:
��� � �� � ����� � ����� � � !� (3)
5 See Fabbri et.al 2003, Görg et al. 2009; Greenaway, Hine & Wright 1999; Hamermesh 1993, Navaretti,
Checchi & Turrini 2003; Mouelhi 2007 and the works cited therein.
12
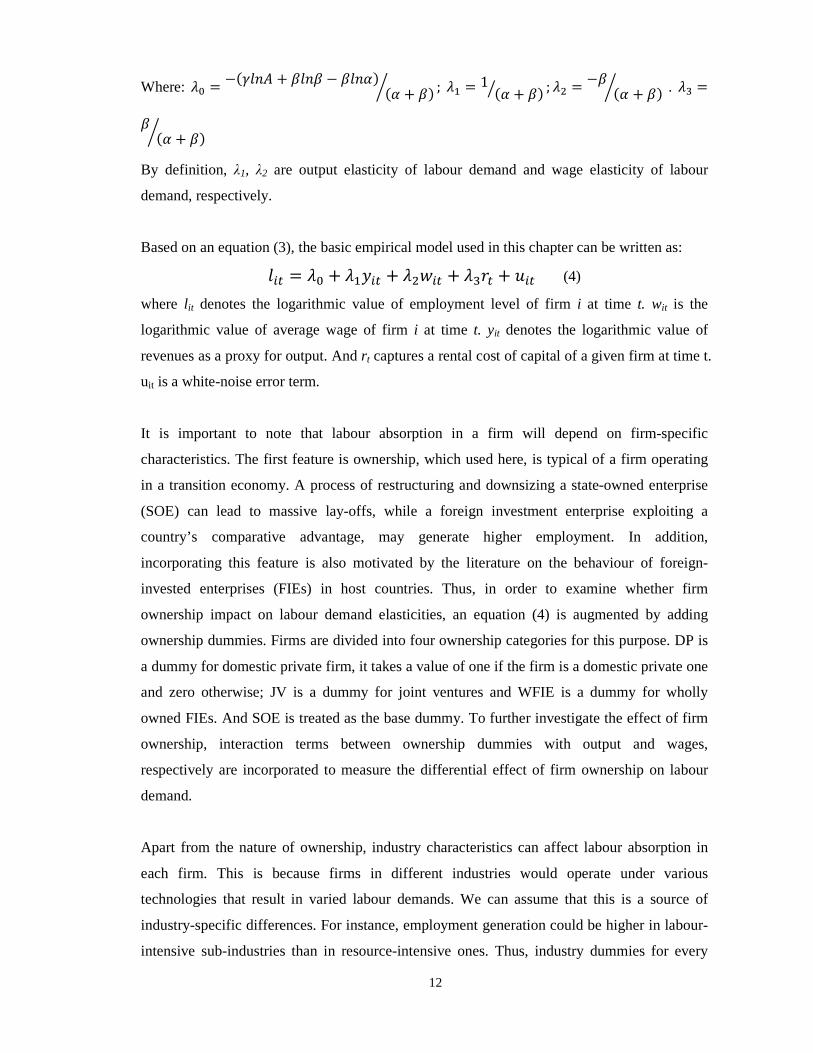
Where:�� � "#$�%� � ��%� " ��%�&#� � �&' ; �� � 1 #� � �&* ; �� � "�
#� � �&' . � �
�#� � �&'
By definition, λ1, λ2 are output elasticity of labour demand and wage elasticity of labour
demand, respectively.
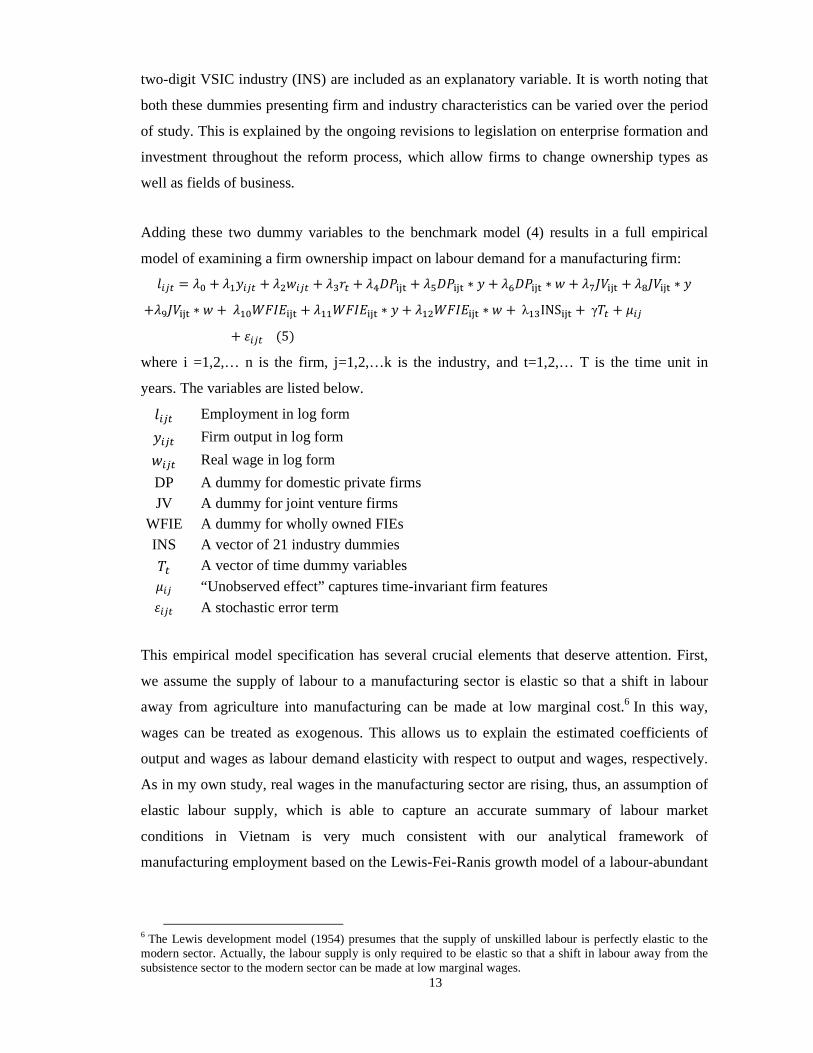
Based on an equation (3), the basic empirical model used in this chapter can be written as:
��� � �� � ����� � ����� � � !� � +�� (4)
where l it denotes the logarithmic value of employment level of firm i at time t. wit is the
logarithmic value of average wage of firm i at time t. yit denotes the logarithmic value of
revenues as a proxy for output. And rt captures a rental cost of capital of a given firm at time t.
uit is a white-noise error term.
It is important to note that labour absorption in a firm will depend on firm-specific
characteristics. The first feature is ownership, which used here, is typical of a firm operating
in a transition economy. A process of restructuring and downsizing a state-owned enterprise
(SOE) can lead to massive lay-offs, while a foreign investment enterprise exploiting a
country’s comparative advantage, may generate higher employment. In addition,
incorporating this feature is also motivated by the literature on the behaviour of foreign-
invested enterprises (FIEs) in host countries. Thus, in order to examine whether firm
ownership impact on labour demand elasticities, an equation (4) is augmented by adding
ownership dummies. Firms are divided into four ownership categories for this purpose. DP is
a dummy for domestic private firm, it takes a value of one if the firm is a domestic private one
and zero otherwise; JV is a dummy for joint ventures and WFIE is a dummy for wholly
owned FIEs. And SOE is treated as the base dummy. To further investigate the effect of firm
ownership, interaction terms between ownership dummies with output and wages,
respectively are incorporated to measure the differential effect of firm ownership on labour
demand.
Apart from the nature of ownership, industry characteristics can affect labour absorption in
each firm. This is because firms in different industries would operate under various
technologies that result in varied labour demands. We can assume that this is a source of
industry-specific differences. For instance, employment generation could be higher in labour-
intensive sub-industries than in resource-intensive ones. Thus, industry dummies for every
13
two-digit VSIC industry (INS) are included as an explanatory variable. It is worth noting that
both these dummies presenting firm and industry characteristics can be varied over the period
of study. This is explained by the ongoing revisions to legislation on enterprise formation and
investment throughout the reform process, which allow firms to change ownership types as
well as fields of business.
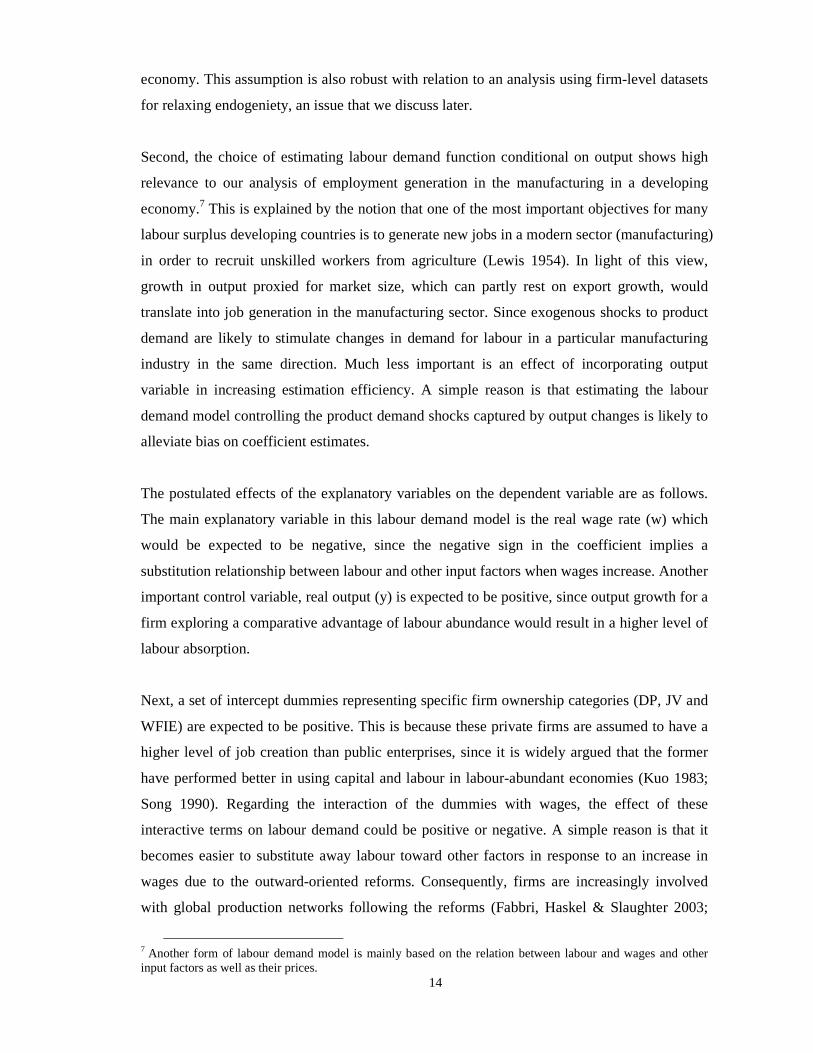
Adding these two dummy variables to the benchmark model (4) results in a full empirical
model of examining a firm ownership impact on labour demand for a manufacturing firm:
��,� � �� � ����,� � ����,� � � !� � �-./012 � �3./012 4 � � �5./012 4 � � �678012 � �978012 4 �
��:78012 4 � � ���;<=>012 � ���;<=>012 4 � � ���;<=>012 4 � � λ� INS012 � γB� � C�, � D�,� #5&
where i =1,2,… n is the firm, j=1,2,…k is the industry, and t=1,2,… T is the time unit in
years. The variables are listed below.
��,� Employment in log form
��,� Firm output in log form
��,� Real wage in log form
DP A dummy for domestic private firms JV A dummy for joint venture firms
WFIE A dummy for wholly owned FIEs INS A vector of 21 industry dummies
B� A vector of time dummy variables C�, “Unobserved effect” captures time-invariant firm features D�,� A stochastic error term
This empirical model specification has several crucial elements that deserve attention. First,
we assume the supply of labour to a manufacturing sector is elastic so that a shift in labour
away from agriculture into manufacturing can be made at low marginal cost.6 In this way,
wages can be treated as exogenous. This allows us to explain the estimated coefficients of
output and wages as labour demand elasticity with respect to output and wages, respectively.
As in my own study, real wages in the manufacturing sector are rising, thus, an assumption of
elastic labour supply, which is able to capture an accurate summary of labour market
conditions in Vietnam is very much consistent with our analytical framework of
manufacturing employment based on the Lewis-Fei-Ranis growth model of a labour-abundant
6 The Lewis development model (1954) presumes that the supply of unskilled labour is perfectly elastic to the modern sector. Actually, the labour supply is only required to be elastic so that a shift in labour away from the subsistence sector to the modern sector can be made at low marginal wages.
14
economy. This assumption is also robust with relation to an analysis using firm-level datasets
for relaxing endogeniety, an issue that we discuss later.
Second, the choice of estimating labour demand function conditional on output shows high
relevance to our analysis of employment generation in the manufacturing in a developing
economy.7 This is explained by the notion that one of the most important objectives for many
labour surplus developing countries is to generate new jobs in a modern sector (manufacturing)
in order to recruit unskilled workers from agriculture (Lewis 1954). In light of this view,
growth in output proxied for market size, which can partly rest on export growth, would
translate into job generation in the manufacturing sector. Since exogenous shocks to product
demand are likely to stimulate changes in demand for labour in a particular manufacturing
industry in the same direction. Much less important is an effect of incorporating output
variable in increasing estimation efficiency. A simple reason is that estimating the labour
demand model controlling the product demand shocks captured by output changes is likely to
alleviate bias on coefficient estimates.
The postulated effects of the explanatory variables on the dependent variable are as follows.
The main explanatory variable in this labour demand model is the real wage rate (w) which
would be expected to be negative, since the negative sign in the coefficient implies a
substitution relationship between labour and other input factors when wages increase. Another
important control variable, real output (y) is expected to be positive, since output growth for a
firm exploring a comparative advantage of labour abundance would result in a higher level of
labour absorption.
Next, a set of intercept dummies representing specific firm ownership categories (DP, JV and
WFIE) are expected to be positive. This is because these private firms are assumed to have a
higher level of job creation than public enterprises, since it is widely argued that the former
have performed better in using capital and labour in labour-abundant economies (Kuo 1983;
Song 1990). Regarding the interaction of the dummies with wages, the effect of these
interactive terms on labour demand could be positive or negative. A simple reason is that it
becomes easier to substitute away labour toward other factors in response to an increase in
wages due to the outward-oriented reforms. Consequently, firms are increasingly involved
with global production networks following the reforms (Fabbri, Haskel & Slaughter 2003;
7 Another form of labour demand model is mainly based on the relation between labour and wages and other input factors as well as their prices.
15
Görg & Strobl 2002; Navaretti, Checchi & Turrini 2003). In this case, a negative sign would
be justified. In contrast, these firms could have a less elastic labour demand because of
increasing proportions of skilled workers in the job structure or rigidity in labour market
(Feenstra & Hanson 1997). Then, the expected sign of this coefficient would be positive.
Similarly, the interactive variable with output is postulated to be positive since the outward-
oriented reforms are predicted to bring about an output expansion, mainly due to increasing
access to international markets for exports. This expansion would result in a proportional
increase in labour absorption in each firm. Of particular interest is the close association
between firm ownership feature and employment generation during the EOI, derived from the
previous examination of employment growth and its pattern. My proposition rests on the idea
that the most part of job creation in a manufacturing sector would be attributed to increasing
participation of private enterprises. This is because these firms in a labour-abundant economy
tend to be more significantly involved in export-oriented industries that are closely associated
with a highly intensive usage of the comparative advantage offered by that abundant factor.
3.2 Data
In this analysis, the manufacturing sector covers all 21 particular industries, except the
manufacture of refined petroleum and gas (VSIC 23) due to the unavailability of data and the
distortion caused by price fluctuation in this industry. The data for the empirical analysis are
compiled from unpublished returns to the Enterprise Survey conducted by the General
Statistical Office of Vietnam (GSO). The survey covers all large and medium-sized
enterprises and a representative sample of small firms with less than 10 employees. The
survey provides all key information on enterprise performance, inter alia, output, employment,
wages, capital stock, intermediate inputs and ownership types. Data on each firm are coded
and stored individually in a unique identification unit by tax code and the Vietnamese
standard industrial classification (VSIC) at the four-digit level. This empirical study data for
manufacturing firms provides data for the ten years from 2000 to 2009.
The raw data from the survey are extracted and cleaned to build a firm-level panel data for
estimating purposes. In the first stage, all observations with non-positive values on
employment, capital and output are excluded. Any erroneous observations or outliers are also
eliminated in the dataset. Then, any missing values in the years after 2000 are extrapolated by
using the average values for the years immediately before and after that year. In addition, the
survey classifies 14 different ownership categories, in which there are 11 various types of
16
domestic companies and three forms of foreign investment enterprises. For simplicity, and to
illuminate significant differences in labour demand at a firm level by ownership group, the
data used for an estimation purpose are aggregated firms into four specific ownership types:
State-owned enterprise (SOE), domestic private firm (DP), joint venture (JV) and wholly
owned FIE (WFIE).8 As noted previously, a presence of firm identification codes provides a
convenient way to construct a panel and trace the firms over time. The final data set is an
unbalanced panel, covering more than ten thousand firms for each year in the period 2000-09.
Apart from labour, which is measured by the number of workers employed, all other variables
are in nominal values, which are then converted into real value series using appropriate
deflators. The deflators for the output series are taken from the current and constant price
series of manufacturing outputs at the two-digit VSIC level from GSO. The capital deflators
are computed from the current and constant values of fixed-capital formation from the
national accounts category. The consumer price index (CPI) is used as a deflator to calculate
real wage rates. In addition, the deflator for the intermediate input series for each
manufacturing industry was computed as the weighted shares of the price indices of products
used as inputs in that industry. The weights for the measurement of input shares are calculated
using the 2000 Input-Output table (I-O table). To obtain these weights, the 112 sectors in the
I-O table are firstly aggregated at the two-digit VSIC level, using the concordance table of
GSO. Consequently, input price indices are derived after the input shares for every two-digit
sector are calculated. As a result, the difference between output and intermediate inputs at
constant prices indicate real value added. Finally, data for the user cost of capital is not
available in our dataset. Assuming that the capital market is nation-wide and under perfect
conditions, following previous studies (Görg et al. 2009; Greenaway, Hine & Wright 1999;
Milner & Wright 1998), it is quite relevant that rental costs of capital is captured by time
dummies in our estimation.
As the four-digit VSIC dataset of firm-level manufacturing industries provided by GSO does
not provide a strong, convincing indicator of firms involved in merchandise exports, I refer to
trade orientation in the manufacturing industry in order to capture this firm characteristic. The
trade orientation of an industry is determined by the export-output ratios and import-output
ratios in the related industry at the four-digit VSIC level over the period 2000-09. Then,
whole manufacturing firms are grouped into three industrial sectors based on a threshold of 15
8 A firm ownership type of joint venture FIEs includes both two forms of joint ventures between FIEs and SOEs or domestic private firms. As noted earlier, an employment share of each kind of joint venture in total is minor.
17
per cent that follows the work of Pavcnik (2002). The export-oriented sector includes
particular industries at a four-digit VSIC level, that have export-output ratios greater than 15
per cent. The import-oriented sector comprises four-digit VSIC industries whose import-
output ratios are more than 15 per cent. The remaining industries are classified as the less-
traded goods sector. By this classification, the export-oriented sector in Vietnamese economy
mainly covers traditional labour-intensive, resource-based, labour-intensive industries and the
emerging industry of electronics, which is very much in line with the Vietnamese
government’s priorities in following the strategy of EOI.9
3.3 Estimation method
The labour demand model is estimated by standard panel data estimation techniques,
exploring the firm-level data set. Pooled OLS, fixed effects (FE) and random effects (RE)
estimations are the mostly widely used alternative techniques (Baltagi 2006; Wooldridge
2002). Of greater concern is to include the unobservable individual effects into this estimation
model. However, over the examined period, the variable of interest-firm ownership dummy is
time-invariant in most firms while it is varied over time in some other firms. This feature can
be ignored by employing an estimation method that taking into consideration of the firm-
individual effect. For instance, under the FE estimation, variables that do not change over
time will be fully absorbed by the ubobserved firm-specific effect including the ownership
effect on labour demand in most firms. In that case, the choice of the pooled OLS estimator is
preferred over FE one in order to capture how do firm ownership, per se, influence on labour
demand.
Estimators which take into account unobserved firm-specific and time-specific effects are
particularly relevant to explore the effects of changing ownership on labour demand over time.
The difference between FE and RE is that the former also takes into account the firm-specific
effects that control for omitted variables that are constant over time. The use of FE estimator
is reliant on an assumption on whether a possible correlation exists between the unobserved
fixed effects and the explanatory variables. Conventionally, the Hausman test is used to
examine whether the coefficient estimates of FE specification are different from those of the
RE one (Greene 2008). If they are found to be significantly different, then the FE
methodology will give efficient and unbiased linear estimators. Additionally, since there was
strong evidence of heteroskedasticity in this estimation, we derived consistent variance-
9 The lists of 4-digit VSIC manufacturing industries in each classified sector are not shown in the paper. They are available on request from the author.
18
covariance standard errors of the estimation coefficients, using the Huber-White ‘sandwich’
estimator.
The panel estimators would be biased and inconsistent in the presence of possible
simultaneity and endogeneity in the labour demand equation. The endogeneity of wage
variable can exist since labour demand and labour supply rely on wage rates that are
interacted by labour demand and labour supply at the equilibrium. Consequently, exogenous
shocks to labour demand will lead to shocks to wage rates. In other words, aggregate demand
or technological shocks can lead to a simultaneous change of demand for labour and wages.
When these shocks cannot be captured by the model, the simultaneity occurs due to a possible
correlation between the error term and wage rates. However, the simultaneity should not be a
major concern due to the labour supply assumption. This study assumes that the labour supply
conditions facing each manufacturing firm are elastic. As noted earlier, this assumption is
strongly relevant to an examination of labour demand at a manufacturing firm in a labour
abundant economy. Any shifts in the labour supply curve would then result in changes in
wages, which would trace out in the labour demand schedule. Conversely, any exogenous
shocks to the demand for labour do not affect wages. Another important point is that the
inclusion of time dummies in the model that capture exogenous shocks to labour demand
would also alleviate endogeneity. Additionally, this study uses a firm-level data set at a highly
disaggregated data, thus relieving the seriousness of endogeneity effect. This caveat is rooted
on the view that demand or technological shocks to the labour demand at a firm level do not
influence wage rate simultaneously as long as there is little possibility that one individual firm
could acquire monopolistic position in the related labour market (Hamermesh 1993).
Therefore, this should not be a serious issue. Given these caveats, our panel data technique
estimators in this analysis should be reliable.
In addition, as in a labour abundant economy, a majority of employment opportunities in the
manufacturing sector are closely associated with an export expansion of labour-intensive
manufacturing goods. Thus this analysis is also interested in evaluating how much the labour
demand is different among firm ownership group following the export-oriented
industrialization. Therefore, estimations of the sub-samples of firms in the export-oriented
sector and import-competing one as classified in the data section are also undertaken. Firms in
the export-oriented sector, which generate about 70 per cent of the aggregate employment
manufacturing, are more exposed to liberalizations of trade, investment and enterprise regime
than other firms are.
19
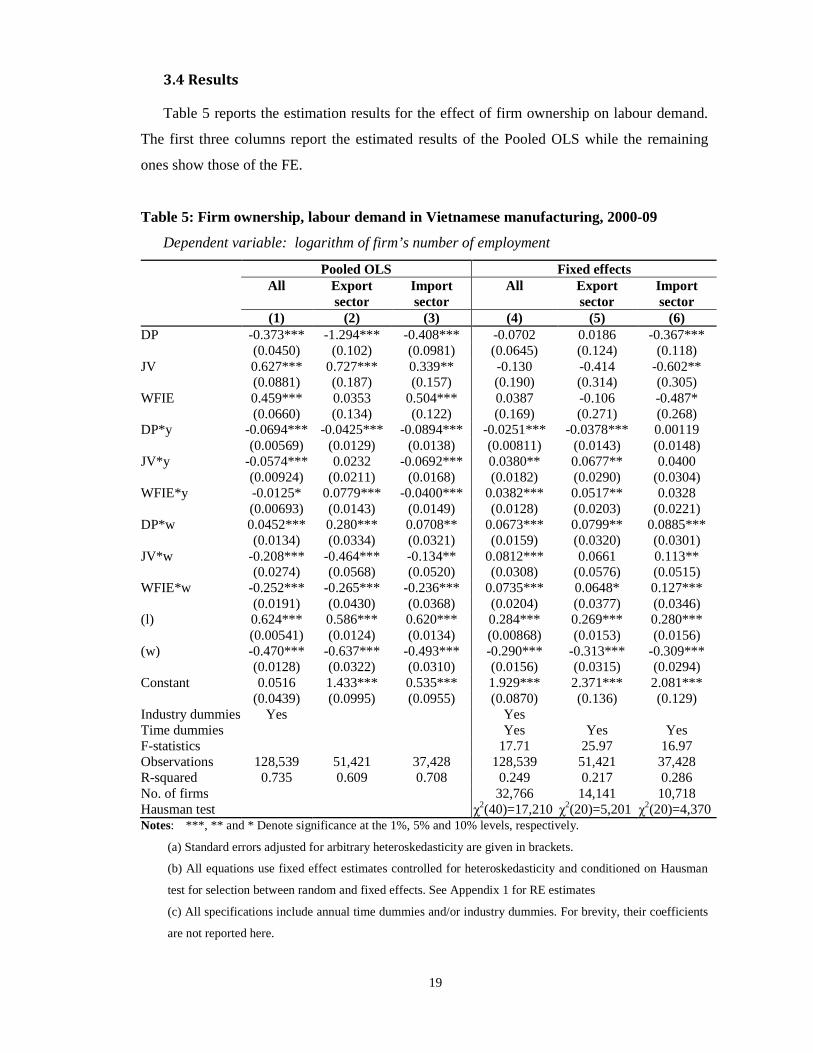
3.4 Results
Table 5 reports the estimation results for the effect of firm ownership on labour demand.
The first three columns report the estimated results of the Pooled OLS while the remaining
ones show those of the FE.
Table 5: Firm ownership, labour demand in Vietnamese manufacturing, 2000-09
Dependent variable: logarithm of firm’s number of employment
Pooled OLS Fixed effects All Export
sector Import sector
All Export sector
Import sector
(1) (2) (3) (4) (5) (6) DP -0.373*** -1.294*** -0.408*** -0.0702 0.0186 -0.367*** (0.0450) (0.102) (0.0981) (0.0645) (0.124) (0.118) JV 0.627*** 0.727*** 0.339** -0.130 -0.414 -0.602** (0.0881) (0.187) (0.157) (0.190) (0.314) (0.305) WFIE 0.459*** 0.0353 0.504*** 0.0387 -0.106 -0.487* (0.0660) (0.134) (0.122) (0.169) (0.271) (0.268) DP*y -0.0694*** -0.0425*** -0.0894*** -0.0251*** -0.0378*** 0.00119 (0.00569) (0.0129) (0.0138) (0.00811) (0.0143) (0.0148) JV*y -0.0574*** 0.0232 -0.0692*** 0.0380** 0.0677** 0.0400 (0.00924) (0.0211) (0.0168) (0.0182) (0.0290) (0.0304) WFIE*y -0.0125* 0.0779*** -0.0400*** 0.0382*** 0.0517** 0.0328 (0.00693) (0.0143) (0.0149) (0.0128) (0.0203) (0.0221) DP*w 0.0452*** 0.280*** 0.0708** 0.0673*** 0.0799** 0.0885*** (0.0134) (0.0334) (0.0321) (0.0159) (0.0320) (0.0301) JV*w -0.208*** -0.464*** -0.134** 0.0812*** 0.0661 0.113** (0.0274) (0.0568) (0.0520) (0.0308) (0.0576) (0.0515) WFIE*w -0.252*** -0.265*** -0.236*** 0.0735*** 0.0648* 0.127*** (0.0191) (0.0430) (0.0368) (0.0204) (0.0377) (0.0346) (l) 0.624*** 0.586*** 0.620*** 0.284*** 0.269*** 0. 280*** (0.00541) (0.0124) (0.0134) (0.00868) (0.0153) (0.0156) (w) -0.470*** -0.637*** -0.493*** -0.290*** -0.313*** -0.309*** (0.0128) (0.0322) (0.0310) (0.0156) (0.0315) (0.0294) Constant 0.0516 1.433*** 0.535*** 1.929*** 2.371*** 2.081*** (0.0439) (0.0995) (0.0955) (0.0870) (0.136) (0.129) Industry dummies Yes Yes Time dummies Yes Yes Yes F-statistics 17.71 25.97 16.97 Observations 128,539 51,421 37,428 128,539 51,421 37,428 R-squared 0.735 0.609 0.708 0.249 0.217 0.286 No. of firms 32,766 14,141 10,718 Hausman test χ
2(40)=17,210 χ2(20)=5,201 χ2(20)=4,370 Notes: ***, ** and * Denote significance at the 1%, 5% and 10% levels, respectively.
(a) Standard errors adjusted for arbitrary heteroskedasticity are given in brackets.
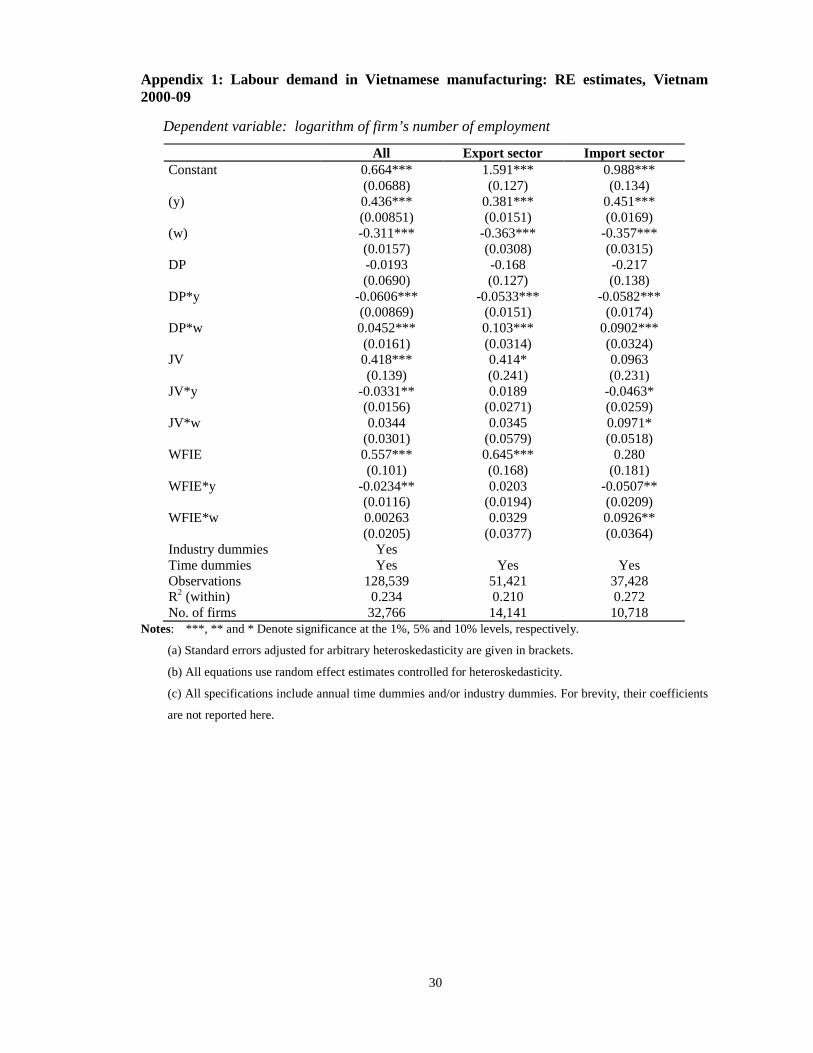
(b) All equations use fixed effect estimates controlled for heteroskedasticity and conditioned on Hausman
test for selection between random and fixed effects. See Appendix 1 for RE estimates
(c) All specifications include annual time dummies and/or industry dummies. For brevity, their coefficients
are not reported here.
20
The OLS estimated results of firm ownership dummies (intercept and interactive term) are
statistically significant in most equations. With the exception of WFIE*y in the sub-sample of
firms in the export-oriented sectors, the coefficients of the interactive terms with output are
negative. This implies that within the same two-digit industries, the labour demand of private
firms, both domestic and foreign is less elastic to output growth than SOEs in general.
However, on average wholly owned FIEs have higher output elasticity of labour demand than
SOEs in the export-oriented sector. This infers that given one percentage growth of output,
the labour demand of wholly owned FIEs can increase more than that of SOEs by 0.08 per
cent in this sector, all other factors being held constant.
The coefficients of the interaction variables between wage and foreign ownership (JV*w and
WFIE*w) are negative and statistically significant in all equations while its interactive term
for domestic private ownership (DP*w) has an opposite sign. The implication of this is that
foreign invested enterprises in general have higher (more negative) wage elasticity of labour
demand than SOEs, given being other factors constant. On the contrary, a domestic private
firm in all samples has lower (less negative) wage elasticity of labour demand than SOEs.
Then, the coefficients of all intercept dummies but domestic private firms (DP) are
statistically significant with a positive sign. This suggests that labour demand of foreign
invested firms is generally higher than that of SOEs while private domestic firms have a lower
demand for labour than the latter, holding other factors constant. Having uncontrolled for
individual effects (firm-and time-specific effects), these findings address difference in labour
demand elasticity by firm ownership.
As shown in Table 5, the FE estimated results of firm ownership dummies are rather mixed.
The coefficients on the interaction terms with wages are highly significant with the positive
sign in the entire manufacturing sample. This result shows there is a significant difference in
the wage elasticity across every firm-ownership types. For instance, ceteris paribus, a one per
cent increase in labour costs reduces demand for labour by 0.284 per cent in SOEs, while a
one per cent rise in the wage results in a 0.217 per cent decrease (computed as -0.284 + 0.067)
in the number of workers demanded in domestic private firms. Similarly, this wage rise also
induces a 0.210 per cent reduction in labour demand for wholly owned FIEs and a 0.203 per
cent decline for joint ventures. On average, all three forms of private firms have lower wage
elasticity than SOEs. A possible explanation for this is differences in recruitment policy
among firm ownership groups. SOEs have various hiring policies, which are mostly relied on
non-market considerations, thus leading to a less sensitive to wages. Additionally, another
21
plausible reason for the various impact of firm ownership through wage changes relies on the
nation-wide application of different minimum wages for all kinds of firm ownership.
Looking at the export perspective, the positive sign and significance of this interaction term
for domestic private firms and wholly owned FIEs imply that these firms have adjusted labour
demand slowly in response to wages changes compared to public firms. Apart from the
reasons already discussed, this slow adjustment may be caused by wage rigidity from keeping
low labour costs in labour-intensive manufacturing export industries in order to maintain their
competitiveness in the overseas market. In addition, the coefficient of JV*w turns out to be
significant with a positive sign in a sample of import-competing sector. This suggests
evidence of the lower magnitude of wage elasticity in private firms than that of SOEs which
are so robust in this sector.
With the exception of an import-competing sample, these coefficients of the interactive
dummy with output are significant at the 5% level or even better. As expected, the
coefficients of JV*y and WFIE*y are positive, suggesting a higher employment elasticity in
relation to output changes. All else being equal, the two corporate forms of foreign investment
adjust labour demand more rapidly than do domestic firms, public and domestic, in response
to output shocks. It is particularly interesting to note that the output elasticity of labour
demand for FIEs becomes more elastic in the export-oriented sector. This finding is very
much consistent with the commonly held perception that foreign investors are normally
interested in labour-intensive investment projects that use a large amount of unskilled labour
for export production. The practice of using labour-intensive technology in export-oriented
foreign investment projects since 2000 has added impetus to generate more employment
opportunities in the process of EOI.
However, the sign of DP*y is negative and significant in both the entire sample and that of the
export sector, suggesting domestic private firms have lower output elasticity of labour
demand than SOEs. This finding runs counters to a priori expectations that domestic private
firms would contribute to employment expansion through output growth as well as that of
exports as has been the experience of East Asian labor-abundant economies. This result
notwithstanding, may not be surprising in a transitional economy such as Vietnam’s, where
the domestic private firms still faced unequal treatment in terms of market access, access to
investment incentives and capital. For example, even though the import tariffs have been
lower in the final product sectors over the period 2000-05, its tariffs on these input-supplying
sectors where still remain high. This tariff improvement only provides favourable conditions
22
for SOEs and FIEs to access in the upstream industries rather than domestic private firms
(Athukorala 2006). Over that period, many domestic private firms also experience difficult
obstacles to obtain bank credit because commercial bank lending practices in Vietnam were
heavily relied on institutional procedures, personal connections and creditability and collateral
that are in favour of SOEs and FIEs (Malesky & Taussig 2009) .
As for the import-competing sector, ownership feature is found to have no significant impact
on labour demand of a manufacturing firm through its output. The reason is quite
straightforward since import-competing industries normally involve highly capital-intensive
technology. As in the case of the Vietnamese economy, many public enterprises that have
concentrated on these sheltered industries in favour of import-substitution strategies are
evidently inefficient and have a lower employment outcome of output expansion.
It is likely that the intercept ownership dummy failed to yield a statistically significant
coefficient in all but the import-competing sample. It seems that there is no evidence that
changing firm ownership could matter to the labour demand at a typical firm by a possible
change in its intercept. As for the import sample, its estimated intercept dummies are negative
and statistically significant at 10 per cent or even better. Thus, by and large, compared with all
kinds of private firms, labour demand in the import-competing sector is higher in public
firms. This finding is plausible given that most state enterprises in these import-substituting
industries are highly protected, received concessional treatment from the government and
commercial banks, and most are biased towards capital intensity.
In both OLS and FE estimations, the coefficients of the two basic variables of labour demand,
output and wages, have the expected signs (positive and negative, respectively) at a high
level of significance. First, the estimates of wage elasticity of labour demand are highly
consistent with the plausible range of those generally identified in the literature (Görg et al.
2009; Hamermesh 1993; Mouelhi 2007). It is important to note that its magnitude for firms
operating in the export-oriented sector is larger compared to typical manufacturing firms as
well as those in the import-competing ones, providing statistical evidence that wage elasticity
for firms belonging to the export sector is relatively high. In other words, given one
percentage decrease in wage rates, firms in the export sector can increase the number of
workers employed more than firms in the import sector can do by 0.14 per cent. Second, the
magnitude of the output coefficient is far from uniform across the three samples. In particular,
all other thing being equal, the degree of employment elasticity with respect to output for
23
firms in the import-competing sector is considerably larger compared to that for those firms in
the export-oriented sector.
The employment growth in Vietnamese manufacturing employment over the period 2000-09
has been underpinned by the increasing participation of domestic private firms and wholly
owned FIEs. The rising role of the private firm group is premised on the changes in business
environment that accumulated from the enterprise reform and its related consequences.
However, it is important to note that there has been a noticeable difference in the legal regime
regulating all firm-ownership types before and after 2006. This difference rests on the fact
that the most dramatic enterprise reform in 2006 was proposed to build a consistent business
climate for all firms onward. In this context, it raises the need to explore how the firm
ownership attribute is important to determine a firm’s labour demand in two sub-periods:
2000-05 and 2006-09.
Our main concern is whether there are any differences in the impact of changes in firm
ownership on labour demand before and after 2006. As shown in the first three columns of
Table 6, the estimated coefficients on the intercept ownership dummies and their interactive
terms for the period 2000-05 are generally in line with those for the overall period in several
respects. First, the coefficients attached to three explanatory variables DP*w, JV*w and
WFIE*w are positive and highly significant in many cases. Ceteris paribus, the wage
elasticity in private firms is found to be less elastic, as compared to that of public firms.
Second, the interaction terms with output are highly significant but their sign are mixed. The
coefficients attached to JV*y and WFIE*y are positive but that of DP*y is negative in the first
two columns. Hence, by and large, the period 2000-05 also indicates that a firm ownership
attribute has a different impact on the output elasticity of labor demand, in particular with
firms in the export-oriented industries.
Apart from these similarities, however, the intercept dummies distinguishing firm-ownership
types become significant and negative in most of the cases examined, as compared to the
corresponding estimations for the whole period. Implicitly, the labour demand of domestic
private firms and FIEs was found to be shifted down as compared to that of SOEs. One
plausible reason is that there were still several administrative and legal barriers that all
corporate forms of private enterprises were facing in their business activities throughout the
period 2000-05. This discriminatory business environment, which restricted access to
economic resources such as capital and land, to some extent hindered business performance of
24
these private firms. Moreover, government’s attitude to SOEs also was a contributing factor to
this environment due to its distorted incentive structure.
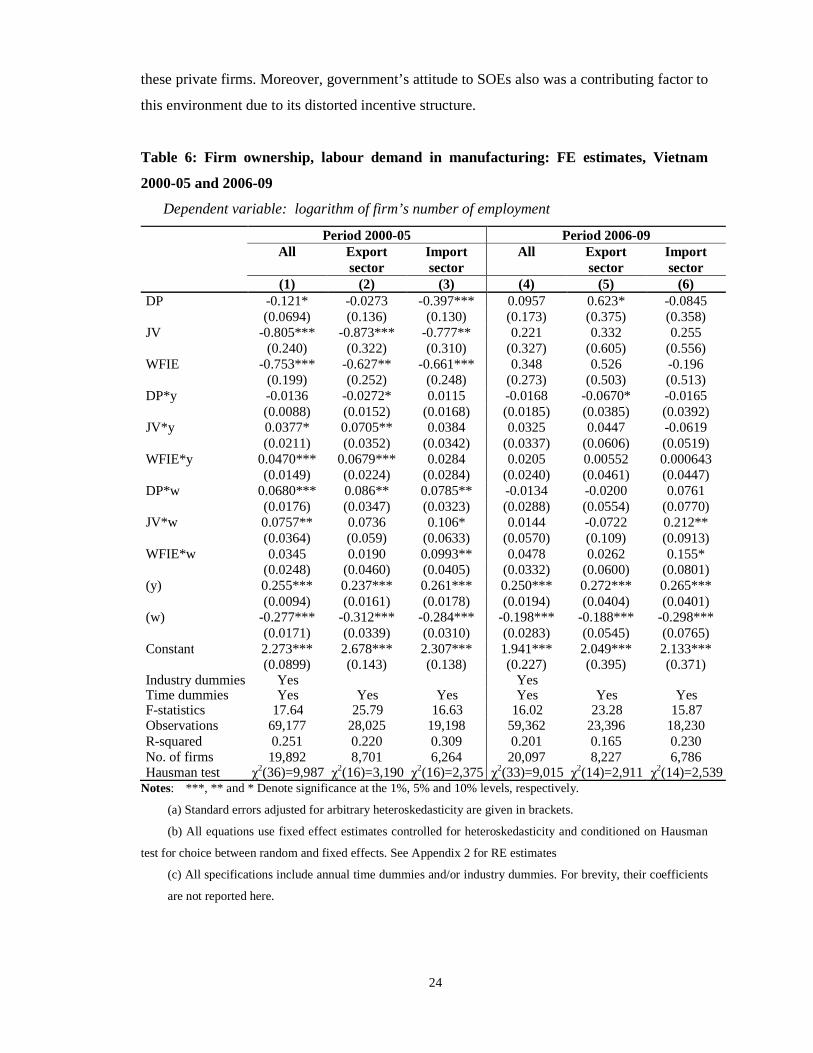
Table 6: Firm ownership, labour demand in manufacturing: FE estimates, Vietnam
2000-05 and 2006-09
Dependent variable: logarithm of firm’s number of employment
Period 2000-05 Period 2006-09
All Export sector
Import sector
All Export sector
Import sector
(1) (2) (3) (4) (5) (6) DP -0.121* -0.0273 -0.397*** 0.0957 0.623* -0.0845 (0.0694) (0.136) (0.130) (0.173) (0.375) (0.358) JV -0.805*** -0.873*** -0.777** 0.221 0.332 0.255 (0.240) (0.322) (0.310) (0.327) (0.605) (0.556) WFIE -0.753*** -0.627** -0.661*** 0.348 0.526 -0.196 (0.199) (0.252) (0.248) (0.273) (0.503) (0.513) DP*y -0.0136 -0.0272* 0.0115 -0.0168 -0.0670* -0.0165 (0.0088) (0.0152) (0.0168) (0.0185) (0.0385) (0.0392) JV*y 0.0377* 0.0705** 0.0384 0.0325 0.0447 -0.0619 (0.0211) (0.0352) (0.0342) (0.0337) (0.0606) (0.0519) WFIE*y 0.0470*** 0.0679*** 0.0284 0.0205 0.00552 0.000643 (0.0149) (0.0224) (0.0284) (0.0240) (0.0461) (0.0447) DP*w 0.0680*** 0.086** 0.0785** -0.0134 -0.0200 0.0761 (0.0176) (0.0347) (0.0323) (0.0288) (0.0554) (0.0770) JV*w 0.0757** 0.0736 0.106* 0.0144 -0.0722 0.212** (0.0364) (0.059) (0.0633) (0.0570) (0.109) (0.0913) WFIE*w 0.0345 0.0190 0.0993** 0.0478 0.0262 0.155* (0.0248) (0.0460) (0.0405) (0.0332) (0.0600) (0.0801) (y) 0.255*** 0.237*** 0.261*** 0.250*** 0.272*** 0. 265*** (0.0094) (0.0161) (0.0178) (0.0194) (0.0404) (0.0401) (w) -0.277*** -0.312*** -0.284*** -0.198*** -0.188*** -0.298*** (0.0171) (0.0339) (0.0310) (0.0283) (0.0545) (0.0765) Constant 2.273*** 2.678*** 2.307*** 1.941*** 2.049*** 2.133*** (0.0899) (0.143) (0.138) (0.227) (0.395) (0.371) Industry dummies Yes Yes Time dummies Yes Yes Yes Yes Yes Yes F-statistics 17.64 25.79 16.63 16.02 23.28 15.87 Observations 69,177 28,025 19,198 59,362 23,396 18,230 R-squared 0.251 0.220 0.309 0.201 0.165 0.230 No. of firms 19,892 8,701 6,264 20,097 8,227 6,786 Hausman test χ2(36)=9,987 χ2(16)=3,190 χ2(16)=2,375 χ2(33)=9,015 χ2(14)=2,911 χ2(14)=2,539
Notes: ***, ** and * Denote significance at the 1%, 5% and 10% levels, respectively.
(a) Standard errors adjusted for arbitrary heteroskedasticity are given in brackets.
(b) All equations use fixed effect estimates controlled for heteroskedasticity and conditioned on Hausman
test for choice between random and fixed effects. See Appendix 2 for RE estimates
(c) All specifications include annual time dummies and/or industry dummies. For brevity, their coefficients
are not reported here.
25
Next, we examine whether firm ownership matter to the labour demand over the period 2006-
09. The most conspicuous result emerging from the last three columns of Table 6 is that the
coefficients of ownership dummies and the respective interactive variables are remarkably
resilient to its inclusion in the model in most cases. All these insignificant coefficients reveal
that, on the whole, wage and output elasticities of labour demand do not differ across all firm-
ownership types. This result is also robust for firms in the export-oriented sector. This
provides statistical evidence that we cannot recognize any differences in wage elasticity
among all firms regardless of ownership status. Similarly, the significant impact of joint
ventures and wholly owned FIEs on output elasticity has disappeared in the export-oriented
sector although this elasticity is still found to be less elastic for domestic private firms. The
only exception in the export sector sample where the coefficient on a domestic private dummy
(DP) is positive and significant at a 10 per cent. Despite albeit weak evidence, this finding can
suggest the significant contribution of domestic private firms on job creation in the export
sector. Moreover, with regard to the import-competing sample, the coefficients of interactive
variables JV*w and WFIE*w are positive and significant at standard levels. Implicitly, these
firms have lower wage elasticity, compared to public enterprises. All in all, this result is
consistent with the widely expected views about the missing of ownership impact on labour
demand as the reform on enterprise policy in reducing numerous constraints to private firms.
This also stems from dramatic improvements on the general trade and investment climate,
which primarily captures the cumulative outcome of outward-oriented policy reforms. Hence,
this finding reflects what has been achieved in Vietnamese manufacturing as a result of
liberalization reforms.
All estimators of the labour demand model pass the F-test on the null hypothesis of no
unobserved individual effects statistically significant at the one per cent level. These fixed
effects estimators are amply supported by the Hausman test for correct specification of the RE
model. The test decisively rejected the null hypothesis that explanatory variables and
unobserved firm heterogeneity are uncorrelated, favouring the use of the FE estimator in this
analysis.
4. Conclusions
This paper has explored various aspects of labour demand in the Vietnamese
manufacturing under the outward-oriented reforms’ mirror. An analysis of employment
growth and its pattern across particular manufacturing industries was used as a backdrop for
26
the central theme involved the estimation of determinants of labour demand in manufacturing
with a special reference to the firm ownership feature.
The result strongly shows that private firm group has played an important role in employment
expansion in the Vietnamese manufacturing sector. Participation of domestic private firms is
observed across every two-digit VSIC manufacturing industry, but they are mostly involved
in the resource-based, labour-intensive sector, whereas the group of foreign invested
enterprises, in particular wholly invested FIEs, has increasingly expanded their crucial
position in labour-intensive sector, including both traditional industries and the emerging
export industry of electronics. This inference is basically consistent with the behaviour of
efficiency-seeking foreign investors entering Vietnam.
The firm ownership attribute has different impacts on firm’s labour demand in manufacturing
over the period 2000-09. First, we observed that on average all three corporate forms of
private firm group have lower wage elasticity of labour demand than SOEs, indicating these
private firms have adjusted labour demand slowly. Second, it was found that wholly owned
FIEs and joint ventures had higher employment elasticity with respect to output, compared to
domestic firms, public and private. This situation stems from the advantages of foreign
entrepreneurs in marketing and access to international markets, whereas domestic firms do not
seem to have much experience in world trade. More importantly, the foreign investment firm
group was observed to have a high magnitude of output elasticity in the export-oriented
industries, as postulated for the case of a labour-abundant economy. This implies the
significance of export-oriented industrialization on manufacturing employment in Vietnam. In
short, the finding supports the importance of export-oriented foreign direct investment during
the early stage of economic development.
However, the discernable difference of ownership impact on labour demand seems to have
vanished due to the changing investment and business climate in Vietnam after 2006. The
estimation results strongly lend support to the view that, on the whole, wage and output
elasticities of labour demand in manufacturing do not differ across all firm-ownership types
over the period 2006-09. Thus, this result is consistent with the widely expected perception
about the missing of ownership impact on labour demand as dramatic improvements in
liberalization of trade, investment and enterprise policy regime were adopted in 2006. In
other words, this reflects what has been achieved in Vietnamese manufacturing induced by
the outward-oriented reforms.
27
References
Athukorala, P 2006, 'Trade policy reforms and the structure of protection in Vietnam', World Economy, vol. 29, no. 2, pp. 161-87. Athukorala, P & Menon, J 1995, 'Foreign Investment and Industrialization in Malaysia: Exports, Employment and Spillovers*', Asian Economic Journal, vol. 9, no. 1, pp. 29-44. Athukorala, P & Hill, H 2010, 'Asian trade: long‐term patterns and key policy issues', Asian‐Pacific Economic Literature, vol. 24, no. 2, pp. 52-82. Athukorala, P & Tran, QT 2012, 'Foreign direct investment in industrial transition: the experience of Vietnam', Journal of the Asia Pacific Economy, vol. 17, no. 3, pp. 446-63. Baltagi, BH 2006, Panel data econometrics: Theoretical contributions and empirical applications, vol. 274, Emerald Group Publishing. Bellak, C 2004, 'How Domestic and Foreign Firms Differ and Why Does it Matter?', Journal of Economic Surveys, vol. 18, no. 4, pp. 483-514. Currie, J & Harrison, A 1997, 'Trade reform and labor market adjustment in Morocco', Journal of labor Economics, vol. 15, no. 3, pp. S44-S72. Djankov, S & Murrell, P 2002, 'Enterprise restructuring in transition: A quantitative survey', Journal of Economic Literature, vol. 40, no. 3, pp. 739-92. Fabbri, F, Haskel, JE & Slaughter, MJ 2003, 'Does nationality of ownership matter for labor demands?', Journal of the European Economic Association, vol. 1, no. 2 3, pp. 698-707. Feenstra, R & Hanson, G 1996, 'Foreign investment, outsourcing and relative wages', in RC Feenstra, et al. (eds), The political economy of trade policy : papers in honor of Jagdish Bhagwati MIT Press, Cambridge, Mass.; London, England pp. 89-127. Feenstra, RC & Hanson, GH 1997, 'Foreign direct investment and relative wages: Evidence from Mexico's maquiladoras', Journal of international economics, vol. 42, no. 3-4, pp. 371-93. Fukase, E 2012, 'Export Liberalization, Job Creation, and the Skill Premium: Evidence from the US–Vietnam Bilateral Trade Agreement (BTA)', World Development. Görg, H & Strobl, E 2002, Relative wages, openness and skill-biased technological change, IZA. Görg, H, Henry, M, Strobl, E & Walsh, F 2009, 'Multinational companies, backward linkages, and labour demand elasticities', Canadian Journal of Economics, vol. 42, no. 1, pp. 332-48. Greenaway, D, Hine, RC & Wright, P 1999, 'An empirical assessment of the impact of trade on employment in the United Kingdom', European journal of political economy, vol. 15, no. 3, pp. 485-500. Greene, WH 2008, Econometric analysis, vol. 6, Prentice Hall New York. Hamermesh, DS 1993, Labor demand, Princeton University Press, Chichester. Hanson, GH & Harrison, A 1999, 'Trade liberalization and wage inequality in Mexico', Industrial and Labor Relations Review, vol. 52, no. 2, pp. 271-88. Harrison, A & Hanson, G 1999, 'Who gains from trade reform? Some remaining puzzles', Journal of Development Economics, vol. 59, no. 1, pp. 125-54.
28
Hasan, R & Chen, L 2004, 'Trade and workers: Evidence from the Philippines', Asian Development Review, vol. 21, no. 2, pp. 28-56. Hill, H 1990a, 'Indonesia's Industrial Transformation Part I', Bulletin of Indonesian Economic Studies, vol. 26, no. 2, pp. 79-120. Hill, H 1990b, 'Indonesia's Industrial Transformation Part II', Bulletin of Indonesian Economic Studies, vol. 26, no. 3, pp. 75-109. Jenkins, R 2004, 'Vietnam in the global economy: trade, employment and poverty', Journal of International Development, vol. 16, no. 1, pp. 13-28. Jenkins, R 2006, 'Globalization, FDI and employment in Viet Nam', Transnational Corporations, vol. 15, no. 1, p. 115. Kien, TN & Heo, Y 2009, 'Impacts of Trade Liberalization on Employment in Vietnam: A System Generalized Method of Moments Estimation', The Developing Economies, vol. 47, no. 1, pp. 81-103. Koo, BY 1985, 'The role of direct foreign investment in Korea's recent economic growth', in W Galenson (ed.), Foreign trade and investment : economic development in the newly industrializing Asian countries / edited by Walter Galenson, University of Wisconsin Press, Madison, Wis, ch pp.141-75, pp. xi, 390 p. : ill ; 24 cm. Krause, L 1982, U.S. economic policy toward the Association of Southeast Asian Nations : meeting the Japanese challenge Brookings Institution, Washington, D.C Kuo, SWY 1983, The Taiwan economy in transition, Westview Press. Lall, S 2000, 'The Technological structure and performance of developing country manufactured exports, 1985‐98', Oxford Development Studies, vol. 28, no. 3, pp. 337-69. Lary, H 1968, Imports of manufactures from less developed countries National Bureau of Economic Research; distributed by Columbia University Press, New York. Lewis, WA 1954, Economic development with unlimited supplies of labour, Bobbs-Merrill Company, College Division. Lipsey, RE 2004, 'Home-and host-country effects of foreign direct investment', in RE Baldwin & LA Winters (eds), Challenges to globalization: Analyzing the economics, University of Chicago Press, Chicago, pp. 333-82. Malesky, EJ & Taussig, M 2009, 'Where Is Credit Due? Legal Institutions, Connections, and the Efficiency of Bank Lending in Vietnam', Journal of Law, Economics, and Organization, vol. 25, no. 2, pp. 535-78. McCaig, B 2011, 'Exporting out of poverty: Provincial poverty in Vietnam and U.S. market access', Journal of international economics, vol. 85, no. 1, pp. 102-13. Megginson, WL & Netter, JM 2001, 'From State to Market: A Survey of Empirical Studies on Privatization', Journal of Economic Literature, vol. 39, no. 2, pp. 321-89. Milner, C & Wright, P 1998, 'Modelling Labour Market Adjustment to Trade Liberalisation in an Industrialising Economy', The Economic Journal, vol. 108, no. 447, pp. 509-28. Mouelhi, RBA 2007, 'Impact of trade liberalization on firm's labour demand by skill: The case of Tunisian manufacturing', Labour Economics, vol. 14, no. 3, pp. 539-63.
29
Navaretti, GB, Checchi, D & Turrini, A 2003, 'Adjusting labor demand: Multinational versus national firms: A cross-European analysis', Journal of the European Economic Association, vol. 1, no. 2-3, pp. 708-19. Pavcnik, N 2002, 'Trade Liberalization, Exit, and Productivity Improvements: Evidence from Chilean Plants', The Review of Economic Studies, vol. 69, no. 1, pp. 245-76. Phan, MN & Ramstetter, ED 2004a, Foreign ownership shares and exports of multinational firms in Vietnamese manufacturing, Working Paper 2004–32, Kitakyushu: International Centre for the Study of East Asian Development. Phan, MN & Ramstetter, ED 2004b, 'Foreign Multinationals and Local Firms in Vietnam's Economic Transition*', Asian Economic Journal, vol. 18, no. 4, pp. 371-404. Phan, MN & Ramstetter, ED 2009, 'Foreign ownership and exports in Vietnamese manufacturing', The Singapore Economic Review, vol. 54, no. 04, pp. 569-88. Ramstetter, E 1999, 'Comparisons of Foreign Multinationals and Local Firms in Asian Manufacturing over Time', Asian Economic Journal, vol. 13, no. 2, pp. 163-203. Ramstetter, E & Sjoholm, F 2006, 'The Issues', in E Ramstetter & F Sjoholm (eds), Multinational Corporations in Indonesia and Thailand, Palgrave Macmillan, New York pp. 3-31. Ranis, G 1979, 'Industrial development', in W Galenson (ed.), Economic growth and structural change in Taiwan : the postwar experience of the Republic of China, Cornell University Press, Ithaca, N.J. , pp. 206-62. Ranis, G & Schive, C 1985, 'Direct Foreign Investment in Taiwan's Development', in W Galenson (ed.), Foreign trade and investment : economic development in the newly industrializing Asian countries / edited by Walter Galenson, University of Wisconsin Press, Madison, Wis, pp. pp.85-137. Riedel, J 1997, 'The Vietnamese economy in the 1990s', Asian‐Pacific Economic Literature, vol. 11, no. 2, pp. 58-65. Sjöholm, F & Lipsey, RE 2006, 'Foreign Firms and Indonesian Manufacturing Wages: An Analysis with Panel Data', Economic Development and Cultural Change, vol. 55, no. 1, pp. 201-21. Song, B-N 1990, The rise of the Korean economy, Hong Kong: Oxford University Press. Suryahadi, A, Chen, P & Tyers, R 2001, 'Openness, Technological Change and Labour Demand in Pre Crisis Indonesia', Asian Economic Journal, vol. 15, no. 3, pp. 239-74. Wooldridge, JM 2002, Econometric analysis of cross section and panel data, The MIT press, Cambrige.
30
Appendix 1: Labour demand in Vietnamese manufacturing: RE estimates, Vietnam 2000-09
Dependent variable: logarithm of firm’s number of employment
All Export sector Import sector Constant 0.664*** 1.591*** 0.988*** (0.0688) (0.127) (0.134) (y) 0.436*** 0.381*** 0.451*** (0.00851) (0.0151) (0.0169) (w) -0.311*** -0.363*** -0.357*** (0.0157) (0.0308) (0.0315) DP -0.0193 -0.168 -0.217 (0.0690) (0.127) (0.138) DP*y -0.0606*** -0.0533*** -0.0582*** (0.00869) (0.0151) (0.0174) DP*w 0.0452*** 0.103*** 0.0902*** (0.0161) (0.0314) (0.0324) JV 0.418*** 0.414* 0.0963 (0.139) (0.241) (0.231) JV*y -0.0331** 0.0189 -0.0463* (0.0156) (0.0271) (0.0259) JV*w 0.0344 0.0345 0.0971* (0.0301) (0.0579) (0.0518) WFIE 0.557*** 0.645*** 0.280 (0.101) (0.168) (0.181) WFIE*y -0.0234** 0.0203 -0.0507** (0.0116) (0.0194) (0.0209) WFIE*w 0.00263 0.0329 0.0926** (0.0205) (0.0377) (0.0364) Industry dummies Yes Time dummies Yes Yes Yes Observations 128,539 51,421 37,428 R2 (within) 0.234 0.210 0.272 No. of firms 32,766 14,141 10,718
Notes: ***, ** and * Denote significance at the 1%, 5% and 10% levels, respectively.
(a) Standard errors adjusted for arbitrary heteroskedasticity are given in brackets.
(b) All equations use random effect estimates controlled for heteroskedasticity.
(c) All specifications include annual time dummies and/or industry dummies. For brevity, their coefficients
are not reported here.
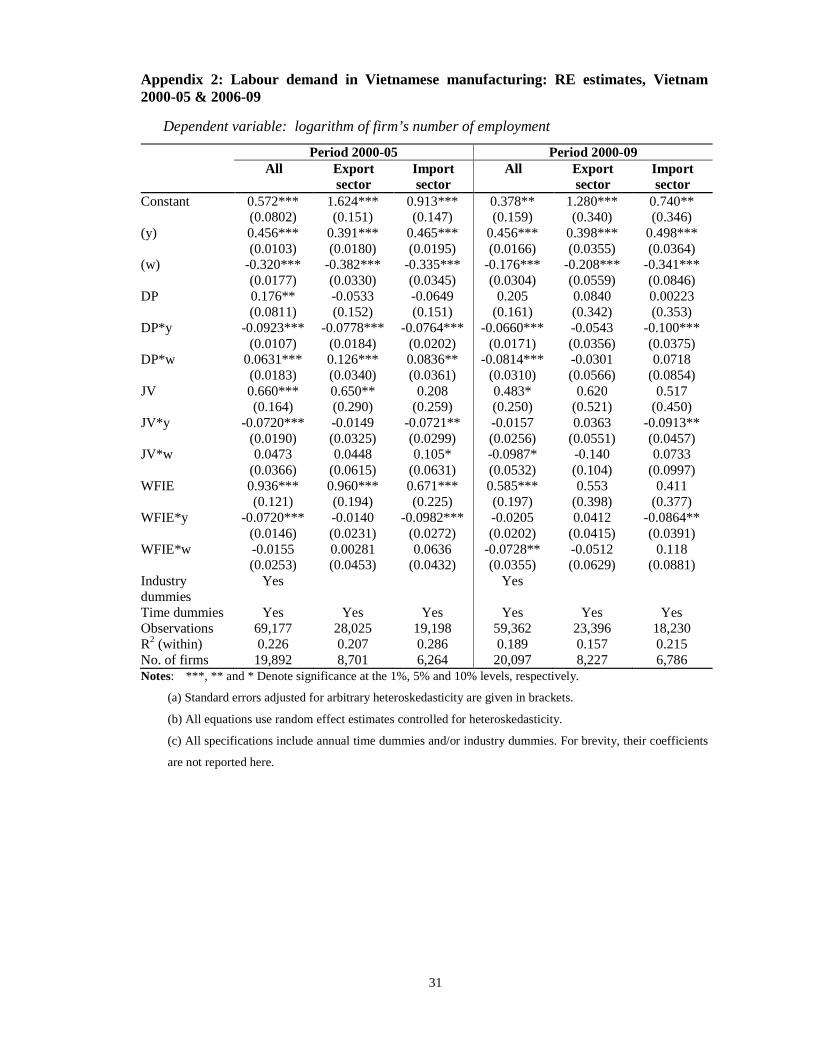
31
Appendix 2: Labour demand in Vietnamese manufacturing: RE estimates, Vietnam 2000-05 & 2006-09
Dependent variable: logarithm of firm’s number of employment
Period 2000-05 Period 2000-09 All Export
sector Import sector
All Export sector
Import sector
Constant 0.572*** 1.624*** 0.913*** 0.378** 1.280*** 0.740** (0.0802) (0.151) (0.147) (0.159) (0.340) (0.346) (y) 0.456*** 0.391*** 0.465*** 0.456*** 0.398*** 0. 498*** (0.0103) (0.0180) (0.0195) (0.0166) (0.0355) (0.0364) (w) -0.320*** -0.382*** -0.335*** -0.176*** -0.208*** -0.341*** (0.0177) (0.0330) (0.0345) (0.0304) (0.0559) (0.0846) DP 0.176** -0.0533 -0.0649 0.205 0.0840 0.00223 (0.0811) (0.152) (0.151) (0.161) (0.342) (0.353) DP*y -0.0923*** -0.0778*** -0.0764*** -0.0660*** -0.0543 -0.100*** (0.0107) (0.0184) (0.0202) (0.0171) (0.0356) (0.0375) DP*w 0.0631*** 0.126*** 0.0836** -0.0814*** -0.0301 0.0718 (0.0183) (0.0340) (0.0361) (0.0310) (0.0566) (0.0854) JV 0.660*** 0.650** 0.208 0.483* 0.620 0.517 (0.164) (0.290) (0.259) (0.250) (0.521) (0.450) JV*y -0.0720*** -0.0149 -0.0721** -0.0157 0.0363 -0.0913** (0.0190) (0.0325) (0.0299) (0.0256) (0.0551) (0.0457) JV*w 0.0473 0.0448 0.105* -0.0987* -0.140 0.0733 (0.0366) (0.0615) (0.0631) (0.0532) (0.104) (0.0997) WFIE 0.936*** 0.960*** 0.671*** 0.585*** 0.553 0.411 (0.121) (0.194) (0.225) (0.197) (0.398) (0.377) WFIE*y -0.0720*** -0.0140 -0.0982*** -0.0205 0.0412 -0.0864** (0.0146) (0.0231) (0.0272) (0.0202) (0.0415) (0.0391) WFIE*w -0.0155 0.00281 0.0636 -0.0728** -0.0512 0.118 (0.0253) (0.0453) (0.0432) (0.0355) (0.0629) (0.0881) Industry dummies
Yes Yes
Time dummies Yes Yes Yes Yes Yes Yes Observations 69,177 28,025 19,198 59,362 23,396 18,230 R2 (within) 0.226 0.207 0.286 0.189 0.157 0.215 No. of firms 19,892 8,701 6,264 20,097 8,227 6,786 Notes: ***, ** and * Denote significance at the 1%, 5% and 10% levels, respectively.
(a) Standard errors adjusted for arbitrary heteroskedasticity are given in brackets.
(b) All equations use random effect estimates controlled for heteroskedasticity.
(c) All specifications include annual time dummies and/or industry dummies. For brevity, their coefficients
are not reported here.