Embed Size (px)
Citation preview

AuthorsD. Benanou*, D. Ben Ali, V. Boireau and J. Cigana
Anjou Recherche- Veolia Water, Analytical Research Department
chemin de la Digue, 78600 Maisons-Laffitte, France
*(E-mail: [email protected])
Philip L. Wylie
Agilent Technologies, Inc.
2850 Centerville Road
Wilmington, DE 19808-1610
USA
Abstract
A routine method is described for quantitative determina-tion of 4-nonylphenol (NP), 4-nonylphenol monoethoxy-late (NP1EO) and 4-nonylphenol diethoxylate (NP2EO) insludge samples.
A Soxtec® extraction procedure was used to enrich target compounds from the solid matrix. Quantitativedeterminations were performed by high speed gas chromatography/mass spectrometry using a short apolarfused silica column. Derivitization allows NP1EO andNP2EO to be analyzed by gas chromatography.
The relative standard deviation was close to 5% for theanalysis of 10 different sludges analyzed seven timeseach. Recoveries were determined for a sludge referencematerial and were higher than 90%. The experimentallimits of quantification were 2, 5, and 5 µg/g of dry matter(µg/g DM), respectively, for NP, NP1EO, and NP2EO.
Determination of Alkylphenols andAlkylphenol Mono- and Diethoxylates inSewage Sludge by High Speed Gas Chromatography/Mass Spectrometry
Application
Good agreement was observed between results obtainedwith this method and those obtained by our previousmethod, which used normal-phase liquid chromatogra-phy with an aminosilica column. This method wasapplied to different kinds of sludge collected in Franceand showed the persistence of these contaminants.
Introduction
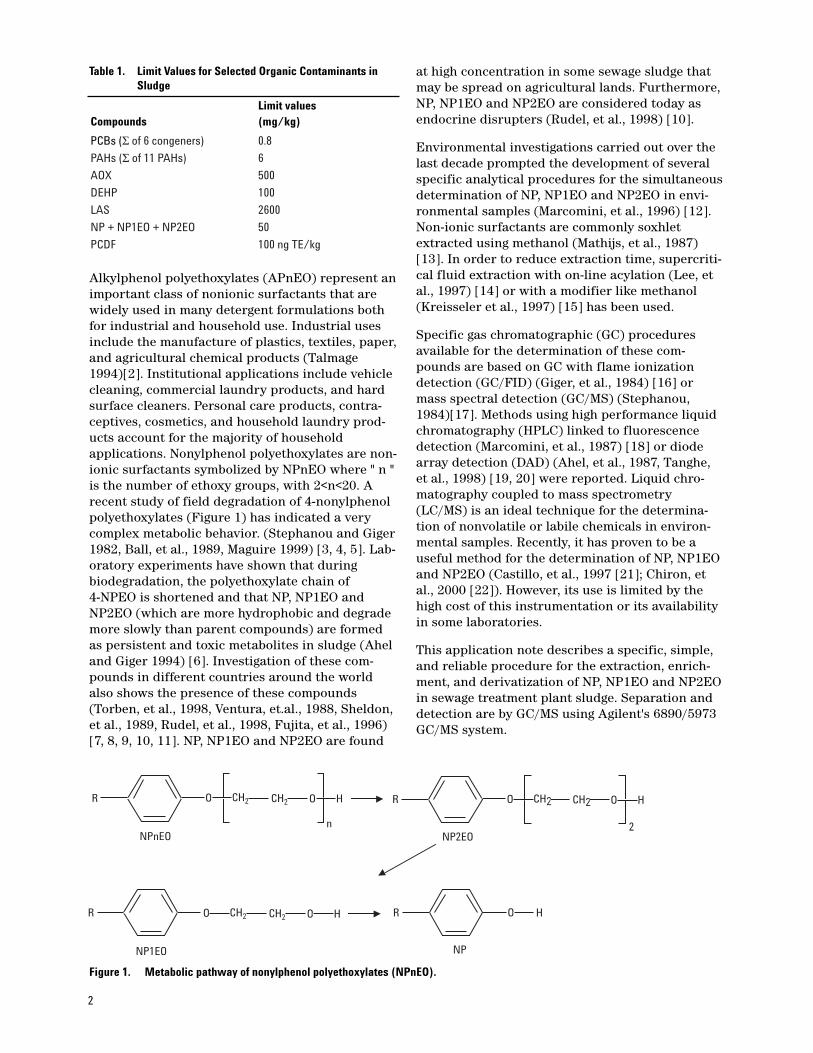
Sewage sludge has been used in agriculture for along time. Since 1986, the use of sewage sludge hasbeen subject to provisions stipulated in EU Direc-tive (86/278/EWG) [1]. Presently under revision,this Directive specifies requirements regardingsludge and soil quality. In contrast to Directive86/278/EWG now in force, the revised version willcover specific methods for the analysis of sludgeand soil. Organic micro-pollutants have beenattributed even greater importance in the environ-ment since the toxicity knowledge of refractoryorganic compounds has grown. Thus, there is atendency for the European Commission to set uplimit values for substances that Europeans gener-ally find undesirable in the environment. Specificcompound groups are mentioned in the currentversion of the revised sludge directive along withlimit values (Table 1). Limits are set for: halo-genated organic compounds (AOX), linear alkyl-benzene sulfonates (LAS), di(2-ethylhexyl)-phthalate (DEHP), nonylphenol and nonylphenolethoxylates (NPE), polyaromatic hydrocarbons(PAH), polychlorinated biphenyls (PCB) and poly-chlorinated dibenzodioxins/dibenzofurans(PCDD/F). From these compound groups, onlyPAHs and PCBs are included in the current EUDirective (86/278/EWG).
Environmental analysis, Sludge analysis
2
Limit valuesCompounds (mg/kg)
PCBs (Σ of 6 congeners) 0.8
PAHs (Σ of 11 PAHs) 6
AOX 500
DEHP 100
LAS 2600
NP + NP1EO + NP2EO 50
PCDF 100 ng TE/kg
Table 1. Limit Values for Selected Organic Contaminants inSludge
Alkylphenol polyethoxylates (APnEO) represent animportant class of nonionic surfactants that arewidely used in many detergent formulations bothfor industrial and household use. Industrial usesinclude the manufacture of plastics, textiles, paper,and agricultural chemical products (Talmage1994)[2]. Institutional applications include vehiclecleaning, commercial laundry products, and hardsurface cleaners. Personal care products, contra-ceptives, cosmetics, and household laundry prod-ucts account for the majority of householdapplications. Nonylphenol polyethoxylates are non-ionic surfactants symbolized by NPnEO where " n "is the number of ethoxy groups, with 2<n<20. Arecent study of field degradation of 4-nonylphenolpolyethoxylates (Figure 1) has indicated a verycomplex metabolic behavior. (Stephanou and Giger1982, Ball, et al., 1989, Maguire 1999) [3, 4, 5]. Lab-oratory experiments have shown that duringbiodegradation, the polyethoxylate chain of 4-NPEO is shortened and that NP, NP1EO andNP2EO (which are more hydrophobic and degrademore slowly than parent compounds) are formedas persistent and toxic metabolites in sludge (Aheland Giger 1994) [6]. Investigation of these com-pounds in different countries around the worldalso shows the presence of these compounds(Torben, et al., 1998, Ventura, et.al., 1988, Sheldon,et al., 1989, Rudel, et al., 1998, Fujita, et al., 1996)[7, 8, 9, 10, 11]. NP, NP1EO and NP2EO are found
at high concentration in some sewage sludge thatmay be spread on agricultural lands. Furthermore,NP, NP1EO and NP2EO are considered today asendocrine disrupters (Rudel, et al., 1998) [10].
Environmental investigations carried out over thelast decade prompted the development of severalspecific analytical procedures for the simultaneousdetermination of NP, NP1EO and NP2EO in envi-ronmental samples (Marcomini, et al., 1996) [12].Non-ionic surfactants are commonly soxhletextracted using methanol (Mathijs, et al., 1987)[13]. In order to reduce extraction time, supercriti-cal fluid extraction with on-line acylation (Lee, etal., 1997) [14] or with a modifier like methanol (Kreisseler et al., 1997) [15] has been used.
Specific gas chromatographic (GC) proceduresavailable for the determination of these com-pounds are based on GC with flame ionizationdetection (GC/FID) (Giger, et al., 1984) [16] ormass spectral detection (GC/MS) (Stephanou,1984)[17]. Methods using high performance liquidchromatography (HPLC) linked to fluorescencedetection (Marcomini, et al., 1987) [18] or diodearray detection (DAD) (Ahel, et al., 1987, Tanghe,et al., 1998) [19, 20] were reported. Liquid chro-matography coupled to mass spectrometry(LC/MS) is an ideal technique for the determina-tion of nonvolatile or labile chemicals in environ-mental samples. Recently, it has proven to be auseful method for the determination of NP, NP1EOand NP2EO (Castillo, et al., 1997 [21]; Chiron, etal., 2000 [22]). However, its use is limited by thehigh cost of this instrumentation or its availabilityin some laboratories.
This application note describes a specific, simple,and reliable procedure for the extraction, enrich-ment, and derivatization of NP, NP1EO and NP2EOin sewage treatment plant sludge. Separation anddetection are by GC/MS using Agilent's 6890/5973GC/MS system.
Figure 1. Metabolic pathway of nonylphenol polyethoxylates (NPnEO).
O CH2 O
n
H
NPnEO
CH2R
2NP2EO
R O CH2 O HCH2
NP1EO
R O CH2 O HCH2
NP
R O H

3
Experimental
Chemicals and Reagents
Hexane and acetone were obtained from Merck(Darmstadt, Germany). The derivatization reagent,Sigma-Sil-A, was purchased from Sigma (Milwau-kee, USA). 4-Nonylphenol, 4-nonylphenol mono-and diethoxylates and 4-nonylphenol-d8 were pur-chased from Cluzeau (France). Florisil cartridges(1 g, 3 mL) were obtained from Supelco (Belle-fonte, USA). Sludge reference material wasobtained from LGC Promochem (Molsheim,France).
Stock solutions for 4-nonylphenol, 4-nonylphenolmono- and diethoxylates were prepared in hexaneat 300 mg/L. The stock solution of 4-nonylphenol-d8 was prepared in hexane at 100 mg/L. Whenstored at 4 °C, the stock solutions were stable forat least six months. Acetic anhydride and BSTFA[N,O-bis (trimethylsilyl)trifluoroacetamide) werepurchased from Aldrich (USA).
Sample Collection
Sludge samples were collected in dark glass con-tainers and stored at –80 °C for 24 hours just priorto drying by lyophilization. The lyophilized sludgewas ground and only the fraction below 200 µmwas analyzed.
Extraction Procedures
One gram of ground lyophilized sludge was Soxtecextracted by 100 mL of hexane (Foss, Nanterre,France). The sample was immersed in hexane for30 minutes (boiling mode) and then rinsed for 15 minutes (rinsing mode). Concentration of theextract to 1 mL was carried out with a stream ofnitrogen using a Turbovap II concentrator (ZymarkUSA). The concentrated extract was then
automatically purified over Florisil using a Rapid-Trace system (Zymark USA). A loading volume of 1 mL of concentrated extract was applied to aFlorisil cartridge at a flow rate of 1 mL/min. Thesorbent was rinsed with 5 mL of a hexane/acetonemixture (70/30) and 5 mL of hexane at 10 mL/min.NP, NP1EO and NP2EO were selectively elutedfrom the cartridge using 5 mL of a hexane/acetonemixture (70/30) at a flow rate of 2 mL/min. Con-centration of the purified extract to less than 1 mLwas carried out with a stream of nitrogen using aTurbovap LV concentrator (Zymark USA); 20 µL oflabelled NP was added just prior to derivatizationwith 50 µL of Sigma-Sil-A. The extract was left for30 min in darkness and was then reconstituted toa final volume of 1 mL just prior to analysis.
Instrumental Conditions
The GC/MS system used was an Agilent 6890/5973MSD (Agilent Technologies, Palo Alto, CA, USA)equipped with a split/splitless inlet heated to 300 °C. The operating conditions were as follows.Using an Agilent 7673 autosampler, 1 µL of thefinal extract was injected in the splitless modewith the purge vent off for 1 min. Helium carriergas was run at constant flow (0.3 mL/min). Theinlet pressure at 50 °C was 52.2 psi. The com-pounds were separated on a 20-m × 0.10-mm id ×0.10 µm RTX5 capillary column (Restek USA). Theoven was programmed from 50 °C (0 min) to 120 °C at 110 °C/min then at 30 °C/min to 300 °C(5 min). A 6890 oven insert (Part no. G2646-60500)was used in order to reduce the oven volume,allowing the column to heat more quickly, yieldingfaster separation and faster chromatography. MSdetection was achieved in the selected ion moni-toring (SIM) mode for quantitative analysis and inscan mode for qualitative analysis. The source washeated at 250 °C, the quadrupole at 150 °C, andthe transfer line at 250 °C.

4
40 120 200 280 360 4400
100000
200000
300000
400000
500000
m/z
Abundance221
135
263
73 193107
29255163 238
40 120 200 280 360 4400
60000
120000
180000
240000
m/z
Abundance265
30773 237
193117
149 3369155
175
217
282
40 120 200 280 360 4400
60000
120000
180000
240000
m/z
Abundance295
351
73
117135 3802071612479155 179
312
267224
330
A B C
Figure 2. Mass spectra of A) NP, B) NP1EO, and C) NP2EO after derivatization with Sigma-Sil-A under quantitative conditions.
Tuning the Mass Selective Detector (MSD)
For qualitative analysis, the MSD was tuned usingthe autotune macro. With this macro, the abun-dances for ions 219 and 502 relative to ion 69(using PFTBA as calibrant) are typically around60%–100% and 3%–10%, respectively. For quantita-tive analysis of derivatized NP, NP1EO, andNP2EO, a target tune was employed using ions 69,219, and 414. The repeller voltage was set to givean optimum response for ion 219. The target tuneresulted in relative abundances (compared to ion69) of 110% and 10% for ions 219 and 414, respec-tively. Figure 2 shows the mass spectra of thederivatized target compounds for quantitation. Formonitoring ions in the SIM mode, 193, 207, 221,and 292 were chosen for NP, 251, 265, and 336 forNP1EO, and 295, 309, and 380 for NP2EO. Theinternal standard (ISTD), 4-nonylphenol-d8, was monitored at m/z 300.
Method Validation
The method was validated according to the AFNORregulation XP T 90-210.
The validation consists in defining:
• The scope of linearity:The linearity was determined over seven con-centration levels from 2 to 200 µg/L, and was
replicated five times. Calibration was doneusing the ISTD mode with NP-d8. Linearity isachieved when the correlation coefficient (R) is0.9990.
• The limit of quantification (LOQ): LOQ is validated when the within-batch relativestandard deviation (RSD) is under 20% for 10 replicate samples spiked with supposedLOQs.
• The repeatability: The repeatability is expressed as a RSD (in %)and is calculated on the basis of three repli-cates of eight different sludge samples and mustbe less than 20%.
• The accuracy:The accuracy is expressed as recovery (in %) ofsludge reference material and must be between80% and 120%.
• The reproducibility:The reproducibility is expressed as a %RSD of acheck calibration standard (20 µg/g) and shouldbe under 20%.

5
7.504.50 5.00 5.50 6.00 6.50 7.00
20000
60000
100000
140000
180000
220000
NP1EONP
NP2EONP-d8
Abundance
7.50
NP1EO
NP
NP2EO
4.50 5.00 5.50 6.00 6.50 7.00
20000
60000
100000
140000
180000
220000
Abundance
40000
80000
120000
160000
200000
240000
NP1EONP
NP2EO
7.504.50 5.00 5.50 6.00 6.50 7.00
Abundance
A B C
NP-d8 NP-d8
Figure 4. Mixture of NP, NP1EO, NP2EO, and NP-d8 derivatized with A) acetic anhydride, B) BSTFA, and C) Sigma-Sil A.
OH19C9
O H
n
OH19C9
O Si
n (CH3)3
TMCS: Trimethylchlorsilane
(H3C)3 Si
Cl
OH19C9
O H
n
OH19C9
O Si
n (CH3)3
HMDS: Hexamethyldisilazane
(H3C)3
SiNH
Si(CH3)3
Figure 3. Reaction of Sigma-Sil-A with NPEO
Results and Discussion
Derivatization Conditions: Optimization
Three kinds of derivatizing reagents were testedduring this study -- acetic anhydride, BSTFA [(N,O-bis(trimethylsilyl)trifluoroacetamide], andSigma-Sil-A which is a 1:3:9 mixture oftrimethylchlorosilane (TMCS), hexamethyldisi-lazane (HMDS ((CH3)3SI-NH-Si(CH3)3), and pyridine (see Figure 3).
Acetic anhydride gave only a small response forthe target compounds while BSTFA and Sigma-Sil-A gave complete derivatization within 30 min-utes. As seen in Figure 4, the BSTFA and Sigma-Sil-A gave the same chromatogram, whichcontained intense molecular ions for NP, NP1EOand NP2EO. Sigma-Sil-A was chosen for furtherwork because the derivatization occurred at roomtemperature while BSTFA required heating at 90 °C.
Separation: Optimization
In some studies, capillary column GC procedureswere used for the analysis of NPnEO either directly(Giger, 1981) [23] or after conversion into morevolatile derivatives (Wahlberg, et al., 1990) [24].Even though this approach was limited to ethoxy-lates with one to five ethoxy units, this techniquewas adopted, instead of HPLC separation becauseof the higher selectivity of the detector. Instead ofa single eluted peak observed for each NPEO inHPLC, the higher resolution of the capillary GCcolumn produced three groups of peaks for deriva-tized NP, NP1EO and NP2EO resulting from differ-ent isomers of the nonyl group. This additionalfingerprint information is very useful for the iden-tification of these compounds in a complex matrixsuch as sludge.
6
There was a desire to improve productivity byreducing the GC run time while maintaining theelution order and selectivity of the analyticalcolumn. Exact translation between conventionaland high-speed chromatography was achieved byusing Agilent's dedicated Method Translation Soft-ware (Agilent Technologies, version 2.0.a.c). Usingempirical methods, it was impossible to maintaincolumn selectivity.
Full scan GC/MS of derivatized NP, NP1EO andNP2EO shows three groups of peaks with retentiontimes (RTs) from 4.5 to 5 min for NP, 5.6 to 6 minfor NP1EO and from 6.5 to 6.8 min for NP2EO(Figure 3). In this case molecular ions were avail-able for quantification. An additional benefit ofhigh-speed chromatography was the increase insensitivity resulting from the 10-fold reduction inpeak width (PW). The first 10 cm of the capillarycolumn had to be removed after each 50 injections.
Purification Conditions: Optimization
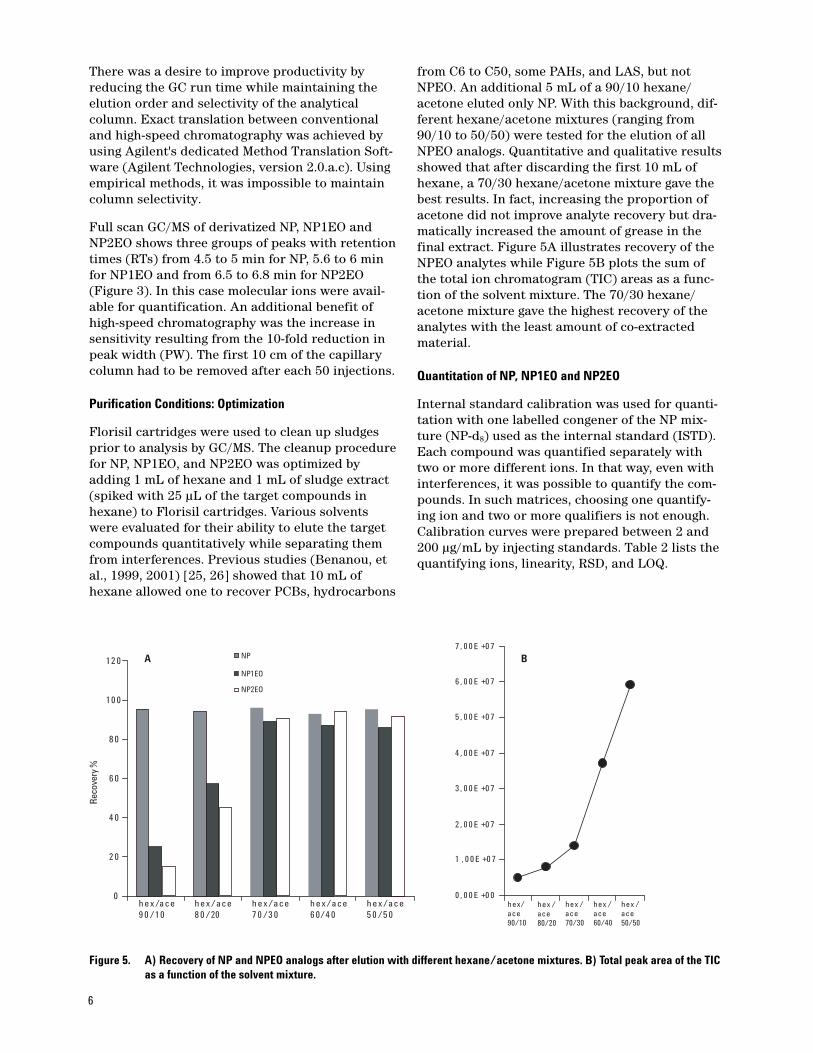
Florisil cartridges were used to clean up sludgesprior to analysis by GC/MS. The cleanup procedurefor NP, NP1EO, and NP2EO was optimized byadding 1 mL of hexane and 1 mL of sludge extract(spiked with 25 µL of the target compounds inhexane) to Florisil cartridges. Various solventswere evaluated for their ability to elute the targetcompounds quantitatively while separating themfrom interferences. Previous studies (Benanou, etal., 1999, 2001) [25, 26] showed that 10 mL ofhexane allowed one to recover PCBs, hydrocarbons
from C6 to C50, some PAHs, and LAS, but notNPEO. An additional 5 mL of a 90/10 hexane/acetone eluted only NP. With this background, dif-ferent hexane/acetone mixtures (ranging from90/10 to 50/50) were tested for the elution of allNPEO analogs. Quantitative and qualitative resultsshowed that after discarding the first 10 mL ofhexane, a 70/30 hexane/acetone mixture gave thebest results. In fact, increasing the proportion ofacetone did not improve analyte recovery but dra-matically increased the amount of grease in thefinal extract. Figure 5A illustrates recovery of theNPEO analytes while Figure 5B plots the sum ofthe total ion chromatogram (TIC) areas as a func-tion of the solvent mixture. The 70/30 hexane/acetone mixture gave the highest recovery of theanalytes with the least amount of co-extractedmaterial.
Quantitation of NP, NP1EO and NP2EO
Internal standard calibration was used for quanti-tation with one labelled congener of the NP mix-ture (NP-d8) used as the internal standard (ISTD).Each compound was quantified separately withtwo or more different ions. In that way, even withinterferences, it was possible to quantify the com-pounds. In such matrices, choosing one quantify-ing ion and two or more qualifiers is not enough.Calibration curves were prepared between 2 and200 µg/mL by injecting standards. Table 2 lists thequantifying ions, linearity, RSD, and LOQ.
0 , 0 0 E +0 0
1 , 0 0 E +0 7
2 , 0 0 E +0 7
3 , 0 0 E +0 7
4 , 0 0 E +0 7
5 , 0 0 E +0 7
6 , 0 0 E +0 7
7 , 0 0 E +0 7
hex/ ace 90/10
hex / ace 80/20
hex / ace 70/30
hex / ace 60/40
hex / ace 50/50
0
2 0
4 0
6 0
8 0
10 0
12 0
h e x/a c e 9 0 /10
h e x/a c e 8 0 /20
h e x/a c e 7 0 /3 0
h e x/a c e 6 0/4 0
h e x/a c e 5 0 /5 0
Rec
over
y %
NP
NP1EO
NP2EO
A B
Figure 5. A) Recovery of NP and NPEO analogs after elution with different hexane/acetone mixtures. B) Total peak area of the TICas a function of the solvent mixture.

7
Table 2. Calibration Results for the Quantitative Determinationof NP, NP1EO, and NP2EO
Performance of the Analytical Method and ExtractionOptimization
A sludge reference material was used to verify theperformance of this method. One g of sludge wasintroduced into a cellulose thimble with 1 g ofsand. The sludge/sand mixture was agitated for 1 min on a vortex mixer and the thimble was thenslurried with glass wool. The extraction tempera-ture was 180 °C. A hexane/acetone mixture waschosen instead of pure hexane for complete recovery of NP1EO and NP2EO. By extracting only
with hexane, recovery was less than 20%. Soxtecextraction performed with methanol gave satisfac-tory recovery, but methanol is not amenable to GCanalysis. Different hexane/acetone mixtures rang-ing from 90/10 to 50/50 and different extractiontimes ranging from 30 to 360 min were tested.Results obtained showed the best compromise wasan extraction time of 45 min with a 50/50 hexane/acetone mixture.
The extract was very brown compared to extrac-tions performed with hexane only. Thehexane/acetone mixture made it possible torecover NP1EO and NP2EO quantitatively, butmany interferences were collected as well (Figure 6). Co-extraction of these polar and mid-polar compounds made it necessary to perform theclean-up twice for some sludge samples. Theextraction was improved by adding and thoroughlymixing 1 g of Florisil and 1 g of sand to the sludgejust prior the extraction. Analyte recoveries werenot diminished by the addition of Florisil to thesamples and only one clean-up step was requiredfor all sludge samples.
15.00 20.00 25.00 30.00 35.00 40.00 45.00 50.00 55.00 60.00 65.00 70.00 75.000
500000
1000000
1500000
2000000
2500000
3000000
3500000
4000000
Abundance
Time (min)
15.00 20.00 25.00 30.00 35.00 40.00 45.00 50.00 55.00 60.00 65.00 70.00 75.000
500000
1000000
1500000
2000000
2500000
3000000
3500000
4000000
Abundance
Time (min)
A
B
Figure 6. Chromatogram of the same sludge sample A) without addition of silica, and B) with addition of silica during the extraction step.
Quantifying ions R2 RSD% LOQ µg/g
192 0.9994 5207 0.9985 12.5
NP 221 0.9989 3.7 2292 0.9997 2.2
251 0.9990 3.5 5NP1EO 265 0.9989 6.2
336 0.9999 5.3
295 0.9994 5.9 5NP2EO 309 0.9993 4.8
380 0.9996 3.6

8
Table 3 illustrates the recoveries obtained withthis method for 10 extractions of the sludge refer-ence material over a 1-week period. Results,expressed in mg/kg DM, are the mean of theresults obtained with each quantifying ion. Resultsobtained with our previous method using Soxtecextraction with methanol (no additional clean up)and normal phase HPLC with fluorescence detection are listed for comparison.
NP NP1EO NP2EO(mg/kg DM) (mg/kg DM) (mg/kg DM)
Certified values 100 ±8.0 5 ±0.9 2 ±0.1
GC/MS meanconcentration 102 ±3.4 4.3 ±0.06 2.1 ±0.02
GC/MSrecovery % 102 86 105
HPLC/Fluo 87 ±9.1 6.1 ±1.0 2.5 ±0.7
HPLC/Fluorecovery % 87 122 125
Table 3. Mean Recovery Values and Uncertainties (n = 10) forNP, NP1EO, and NP2EO Determined in Sludge Reference Material
Both techniques gave good agreement with thepublished values for the reference material. Allrecovery values were higher than 80% showinggood performance of the Soxtec extraction methodwith GC/MS quantitation. However, the uncer-tainty is greater with HPLC/fluorescence thanwith GC/MS due to the lack of specificity of thisLC detector compared with a mass spectrometricdetection.
Sewage Sludge Analysis
This high speed GC/MS method was applied to theanalysis of sludge samples from 10 sewage treat-ment plants (STPs) in France. Each sludge samplewas extracted five times and results are shown inTable 4. Results are expressed in mg/kg DM andare a mean of the results obtained with each quan-tifying ion. Figure 7 shows chromatograms forsludge samples 2 and 5. Some sludge samples wereproblematic when using the m/z 207 ion as thequantifier. Some interference appears due tocolumn bleed, which resulted in a high backgroundat m/z 207 around the RTs of NP and NP1EO. Inthe end, NP was only quantified with ions 193,221, and 292.
Whatever the sludge sample's origin, the sum ofNP, NP1EO, and NP2EO was usually above thelimit value of 50 mg/kg DM indicated in the revi-sion of the current regulation. Values ranged from8.8 to 210 mg/kg DM, with a median value of 91 mg/kg DM. NP2EO showed higher concentra-tions than NP and NP1EO for most sludge samples.It's contribution to the sum for sludges 1 to 6,ranged from 16% to 80% with a median value of50% (31 mg/kg DM). These values point out thatmost of these sludges could not be applied as fertil-izer on agricultural land once the EU approves thisrevision. However, the contamination seems lessheavy than that observed in STPs from Switzerland(Ahel, et al., 1994) [6]. The MSD's specificity madeit possible to obtain satisfactory SDs for all ofthese measurements.
1 2 3 4 5 6 7 8 9 10
NP 15.4 24.7 27.1 11.9 16.2 21.9 10 12.9 8.8 38.4
±0.6 ± 0.4 ± 0.7 ±0.4 ±0.6 ±0.7 ±0.5 0.2 0.3 3.6
NP1EO 8.7 14.6 36.0 25.3 49.9 13.3 12 12.5 <2 41.1
±0.2 ±0.3 ±1.1 ±0.3 ±0.6 ±0.8 ±0.3 0.3 1
NP2EO 90.4 40.5 12.3 152.7 143.9 85.5 21.4 <2 <2 21.8
±2.7 ±0.5 ±0.3 ±2.4 ±2.6 ±1.0 ±0.4 1.2
Total 114.5 79.8 75.3 189.9 210.0 120.7 43 25.4 8.8 101.2
±3.0 ±0.8 ±1.5 ±2.8 ±3.1 ±2.0 ±0.8 0.5 0.3 2.8
Table 4. Determination of NP, NP1EO, and NP2EO in 10 Different Sludge Samples from France

9
2.00 3.00 4.00 5.00 6.00 7.00 8.00 9.000
500
1000
1500
2000
2500
3000
3500
4000
4500
5000
a
b
c
Sample 2
2.00 3.00 4.00 5.00 6.00 7.00 8.00 9.00
0
500
1000
1500
2000
2500
3000
3500
4000
4500
5000
a
b
c
Sample 5
Figure 7. Chromatograms of sludge samples 2 and 5. a) NP, b) NP1EO, c) NP2EO.
Conclusion
High-speed GC/MS enabled rapid determination ofNP, NP1EO and NP2EO in sludge samples. The Agilent 6890 GC was able to separate the NP,NP1EO and NP2EO congener groups into threesets of peaks, instead of a single peak for eachgroup as was observed when using HPLC.
DLs were improved by working in the SIM modeand by reducing peak widths with the 0.10-mm idGC column. The LOQs achieved with this methodwere 2, 5, and 5 mg/kg DM for NP, NP1EO, andNP2EO, respectively. RSDs were under 7%. Soxtecextraction followed by Florisil cleanup resulted inrecovery values above 80% in all cases.
Results for 10 typical sludge samples show that, inmost cases, the sum of NP, NP1EO, and NP2EO isabove the anticipated regulatory value of 50 mg/kgDM. Further work on NPEO will include analysis ofthe same species in wastewater for a better under-standing of their fate during sludge treatment.

10
References1. EU Directive 86/278/EWG
2. Talmage, S. S., Environmental and HumanSafety of Major Surfactants: Alcohol Ethoxy-lates and Alkylphenol Ethoxylates , Lewis pub-lishers: Boca Raton 1994.
3. Stephanou E. and Giger W., Persistent organicchemicals in sewage effluent. 2. Quantitativedetermination of nonylphenol and nonylphenolethoxylates by glass capillary gas chromatogra-phy. (1982) Envir Sci. Technol. 16, 800-805.
4. Ball A. H., Reinhard M., and McCarty P. L., Bio-transformation of halogenated and nonhalo-genated octylphenol polyethoxylate residuesunder aerobic and anaerobic conditions. (1989)Envir Sci. Technol. 23, 951-961.
5. Maguire J. R., Review of the Persistence ofNonylphenol and Nonylphenol Ethoxylates inAquatic Environnement. (1999) Water Qual.Res. J. Canada. 34, 1, 37-78.
6. Ahel M., Giger W., and Kock M., Behaviour ofalkylphenol polyethoxylate surfactants in theAquatic Environnement - I. Occurrence andtransformation in sewage treatment. (1994)Wat. Res. 28, 1131-1142.
7. Torben B. P., and Jensen S., Research Issues inClinical Data Warehousing. (1998) SSDBM, 43-52.
8. Ventura F., Figueras A., Caixach J., Aspadaler I.,Guardiola J., and Rivera J., Characterization ofpolyethoxylated surfactants and their bromi-nated derivatives formed at the water treat-ment plant of Barcelona by GCMS and FABmass spectrometry. (1988) Wat. Res. 22, 1211-1217.
9. Sheldon L.S., and Hites R.A., Sources and move-ments of organic compounds in the DelawareRiver. (1989) Environ. Sci. Technol. 13, 574-579.
10.Rudel R.A., Melly S.J., Geno P.W., Sun G., andBrody J., Identification of alkylphenols andother estrogenic phenolic compounds in wastewater, septage, and ground water on Cape Cod,Massachusetts. (1998) Environ. Sci. Technol.32, 861-869.
11.Fujita, Y., Ding, W. H., and Reinhard, M., Identi-fication of Wastewater Dissolved OrganicCarbon (DOC) Characteristics in ReclaimedWastewater and Recharged Groundwater,(1996) Water Environment Research, 68: 867-876.
12.Marcomini A. and Zanette M., Chromatographicdetermination of nonionic aliphatic surfactantsof the alcohol polyethoxylate type in the envi-ronment, (1996) J Chromatogr. A 733, 193-206.
13.Mathijs, E. and DeHenau H., Determination ofLAS, (1987) Tenside Surf. Det., 24, 193-199.
14.Lee HB., Peart T. E., Bennie D. T., and MaguireR. J., Determination of nonylphenol polyethoxy-lates and their carboxylic acid metabolites insewage treatment plant sludge by supercriticalcarbon dioxide extraction., (1997) J. Chro-matogr. A, 785, 385-394.
15.Kreisseler A. and Durbbeck H., Determinationof alkylphenols, alkylphenolethoxylates andlinear alkylbenezenesulfonates in sediments byaccelerated solvent extraction and supercriticalfluid extraction (1997) J. Chromatogr. A, 775, 187-196.
16.Giger W., Ahel M., and Schaffner C., 1984 Deter-mination of organic water pollutants by thecombined use of HPLC and HRGC. in: G. Angeletti and A. Biorset (editors), Analysisof Organic Micropollutants in Water. Reidel, Dordrecht, pp. 91-109.
17. Stephanou E., Identification of nonionic deter-gents by GC/CI-MS: I. A complementary methodor alternative to GC/EI-MS and others meth-ods?, (1984) Chemosphere, 13, 43-51.
18.Marcomini A. and Giger W., Simultaneousdetermination of linear alkylbenzene sul-fonates, alkylphenol polyethoxylates, andnonylphenol by high-performance liquid chro-matography (1987) Anal. Chem., 59, 1709 -1715.
19.Ahel M., Conrad T., and Giger W., Persistentorganic chemicals in sewage effluent, 3. deter-mination of nonylphenoxy carboxylicas acids byhigh resolution gas chromatography/mass spectrometry and high performance liquidchromatography. (1987) Environ. Sci. Technol.,21, 697-703.
20.Tanghe T., Devriese G., and Verstraete W.,Nonylphenol degradation in lab scale activatedsludge units is temperature dependent. (1998)Water Res. 32, 2889-2896.
21.Castillo M., Alpendurada M. F., and Barcelo D.,Characterization of organic pollutants in indus-trial effluents using liquid chromatography-atmospheric pressure chemical ionization-massspectrometry, (1997) J. of Mass Spec., 32, 1100-1110.

11
22.Chiron S., Sauvard E., and Jeannot R., Determi-nation of nonionic polyethoxylate surfactantsin waste water and sludge samples of sewagetreatment plants by liquid chromatography-mass spectrometry, (2000) Analysis, 28, 535-542.
23.Giger W., Stephanou E, and Schaffner C., Persis-tent organic chemicals in sewage effluents: I.Identifications of nonylphenols and nonylphe-nolethoxylates by glass capillary gas chromatography / mass spectrometry, (1981)Chemosphere, 10, 1253-1263.
24.Wahlberg C., Renberg L., and Wideqvist U.,Determination of nonylphenol and nonylphenolethoxylates as their pentafluorobenzoates inwater, sewage sludge and biota, (1990) Chemos-phere, 20, 179-195.
25.Benanou D., Acobas F., Vessella J., and Guina-mant J.L., PCBs and PAHs analysis in sewagesludge with a Soxtec Avanti extraction, (2001)Focus, 25, 1 pp 12-14.
26.Benanou D., Acobas F., and Guinamant J.L.,(2001) Determination of organic micropollu-tants in sludge, high speed chromatography-mass spectrometry and differentialpurification. The Pittsburgh Conference, NewOrleans, USA.
For More Information
For more information on our products and services,visit our Web site at www.agilent.com/chem.

Agilent shall not be liable for errors contained herein or for incidental or consequentialdamages in connection with the furnishing, performance, or use of this material.
Information, descriptions, and specifications in this publication are subject to changewithout notice.
Soxtec is a registered trademark of Foss Tecator.
© Agilent Technologies, Inc. 2004
Printed in the USAMay 27, 20045989-1152EN
www.agilent.com/chem


![Determination of Alkylphenols and Alkylphenol Mono- and ... › cs › library › applications › 5989-1152EN.pdfextracted using methanol (Mathijs, et al., 1987) [13]. In order to](https://img.pdfslide.net/doc/110x75/60db829dc32116100e5361fc/determination-of-alkylphenols-and-alkylphenol-mono-and-a-cs-a-library-a.jpg)