1
DETERMINATION OF SYNTHETIC Fe(III)-CHELATES IN AGRICULTURAL MATRICES Irene Orera*, Ana Álvarez- Fernández, Javier Abadía and Anunciación Abadía Plant Nutrition Department, Aula Dei Experimental Station, Consejo Superior de Investigaciones Científicas (CSIC) Apdo. 202, 50080 Zaragoza, Spain Materials and Methods HPLC-ESI/MS (TOF) analysis were carried out with a BioTOF II spectrometer (Bruker Daltonics, Billerica, MA, USA) coupled to a Waters Alliance 2795 HPLC system (Waters, Mildford, MA, USA). Recovery assays were carried out for each Fe(III)-chelate by spiking the agricultural matrices with known amounts of each analyte and the corresponding isotope labeled 57 Fe(III)-chelates as internal standards. The nutrient solution matrix was 1/2 Hoagland. Irrigation water was sampled from the “Bardenas” irrigation channel and its main characteristics are pH 8.5, 0.35 dS m -1 electrical conductivity and 1.33, 2.15, 0.42, 0.03, 0.44, 2.36, 0.42, 0.61 mg·l -1 of Ca 2+ , Mg 2+ , Na + , K + , CO 3 2- , HCO 3 - , SO 4 2- , and Cl - , respectively. Soil solution was obtained after water incubation of a soil sampled in a peach orchard located in Alcañiz (Teruel, Spain). The main soil characteristics are silt sandy texture, pH in water 8.0, 30.5% total CaCO 3 and 0.8% organic matter. Peach xylem exudates were isolated following the Schölander chamber method (Larbi et al. 2003). Three commercial fertilizers (A, B and C) containing Fe(III)- EDDHA and 6% soluble Fe (wt/wt) have been analysed . Conclusions The method developed permits the direct and simultaneous analysis of the major synthetic Fe(III)-chelates used as fertilizers in agricultural matrices and commercial fertilizer products. The resolution of the mass spectrometer used can give information on isotopic distribution, allowing its use as a tool in tracer studies with stable isotopes. References •Álvarez-Fernández et al. 2006 J. Am. Soc. Mass. Spectrom. (in press). •Bienfait et al. 2004 Soil Sci. Plant Nutr. 50, 1103–1110. •Dodi and Monnier 2004 J. Chromatogr. A 1032, 87–92 •García-Marco 2005 Ph.D. Thesis Autonoma University of Madrid, Spain, pp 95–115. •Knepper et al. 2003 Trac-Trends Anal. Chem. 22, 708-724 •Larbi et al. 2003 Plant Physiol. 160, 1473-1481 •Nowack 2002, Environ. Sci. Technol. 36, 4009-4016 Acknowledgements Supported by the Spanish MEC (Projects AGL2003-1999, AGL2004-0194 and AGL 2006-1416, co-financed with FEDER) and the Commission of European Communities (project Isafruit). Acquisition of the HPLC-MS(TOF) apparatus was co-financed with FEDER. IO and AA-F were supported by a CONAID-DGA predoctoral fellowship and a “Ramón y Cajal” research contract from the Spanish MEC. Introduction Fertilizers containing synthetic Fe(III)-chelates are commonly used in soilless horticulture as well as in high value, field-grown crops affected by iron deficiency. However, the environmental matters raised on the use of such xenobiotic compounds are far from being completely understood (Nowack 2002, Knepper et al. 2003). Recently, we have developed a liquid chromatography-electrospray time of flight mass spectrometry (HPLC-ESI/MS(TOF)) method (Álvarez-Fernández et al. 2006) to determine the seven major synthetic ferric chelates used in agriculture (Fig 1). The aim of this work is to validate this HPLC- ESI/MS(TOF) method to determine these Fe(III)-chelates in four agricultural matrices, including nutrient solution, irrigation water, soil solution and plant xylem exudates as well as in commercial fertilizers. EDTA N N COOH COOH HOOC HOOC HEDTA N N COOH CH 2 OH HOOC HOOC DTPA N N HOOC HOOC N COOH COOH COOH NH HOOC HN COOH HO * * R 1 R 2 R 3 R 2 R 3 N N COOH COOH HOOC HOOC CDTA R 1 R 2 R 3 o,oEDDHA o,pEDDHA EDDHMA OH H H H OH H OH CH 3 H Fig 1. Chelating agents of Fe(III)-chelates used as Fe-fertilizers. * Chiral carbons Results and discussion Fig 2. Chromatograms at 412.0 m/z of the standard solution and agricultural matrices spiked with 10μM Fe(III)-o,oEDDHA. 14.7 16.7 0 20 40 B 14.8 16.7 0 20 40 C Soil solution 14.8 16.7 0 20 40 D 0 5 10 15 20 Time [min] Plant xylem exudate 14.8 16.7 0 20 40 Nutrient solution Irrigation water 25 racemic Fe(III)-o,oEDDHA meso Fe(III)-o,oEDDHA racemic Fe(III)-o,oEDDHA meso Fe(III)-o,oEDDHA racemic Fe(III)-o,oEDDHA meso Fe(III)-o,oEDDHA racemic Fe(III)-o,oEDDHA meso Fe(III)-o,oEDDHA E 14.8 16.7 0 20 40 racemic Fe(III)-o,oEDDHA meso Fe(III)-o,oEDDHA A Standard solution Agricultural matrices meso Fe(III)-o,oEDDHA 15.7 14.6 16.7 0 100 200 300 400 500 Fe(III)-o,pEDDHA racemic Fe(III)-o,oEDDHA m/z: 412.0 Intensity*10 2 413 410 412 T.R. = 16.7 min 410 412 m/z 0 1 2 3 4 I n t e n s i t y 0 5 10 15 20 Time [min] 30 25 Fig 3. Chromatogram of a commercial fertilizer with Fe(III)-EDDHA at concentration of 10.6 mg product l -1 A zoomed mass spectra at retention time 16.7 min is presented in the inset of Fig 3, as an example of how the MS technique used can resolve the peaks for the different Fe isotopes ( 54 Fe-, 56 Fe- and 57 Fe-o,oEDDHA) corresponding to the [M - H] 1- ions. Chelated Fe contents obtained for commercial fertilizers (3.85% for A, 5.26% for B and 3.71% for C) compares well with data obtained by using the European Community official method of analysis by García-Marco et al. (2005). Fertilizers Table 1. Recoveries (in %) obtained for the seven Fe(III)- chelates in the different agricultural matrices. The amounts spiked were 10 μM of Fe(III)-EDTA, Fe(III)-CDTA, Fe(III)- o,oEDDHA, and Fe(III)-EDDHMA, and 50 μM of Fe(III)-DTPA, Fe(III)-HEDTA, and Fe(III)-o,pEDDHA. Soil solution Fe(III)-EDTA 92.1±2.0 88.9±2.5 82.6±2.3 82.8±1.8 Fe(III)-DTPA 101.2±4.0 100.2±5.7 81.9±4.8 70.0±5.0 Fe(III)-HEDTA 98.9±2.8 101.7±3.0 83.3±9.8 96.9±0.9 Fe(III)-CDTA 99.5±5.4 94.0±5.0 98.6±2.9 110.9±9.9 aFe(III)-o ,o EDDHA 94.8±3.0 96.6±1.6 91.6±1.1 95.6±1.1 aFe(III)-o ,p EDDHA 100.5±1.3 95.3±4.6 91.9±2.0 91.5±1.7 a Fe(III)-EDDHMA 96.6±2.1 93.5±2.3 99.9±5.4 89.9±2.0 Analyte Nutrient solution Irrigation water Plant xylem exudate The recoveries obtained by spiking agricultural matrices were good, and only the recovery for Fe(III)- EDTA in all agricultural matrices tested was relatively low, in the range 83–92%, compared with the 96% obtained for Fe(III)-EDTA in industrial effluents (Dodi and Monnier, 2004). Recoveries for Fe(III)-o,oEDDHA were in the range 79-104%, similar to the 84–94% values found by Bienfait et al. (2004). Lowest recoveries Highest recoveries I n t e n s i t y

DETERMINATION OF SYNTHETIC Fe(III)-CHELATES … · DETERMINATION OF SYNTHETIC Fe(III)-CHELATES IN AGRICULTURAL MATRICES Irene Orera*, Ana Álvarez- Fernández, Javier Abadía and

Embed Size (px)

Citation preview

DETERMINATION OF SYNTHETIC Fe(III)-CHELATES IN AGRICULTURAL MATRICES

Irene Orera*, Ana Álvarez- Fernández, Javier Abadía and Anunciación Abadía

Plant Nutrition Department, Aula Dei Experimental Station, Consejo Superior de Investigaciones Científicas (CSIC) Apdo. 202, 50080 Zaragoza, Spain

Materials and MethodsHPLC-ESI/MS (TOF) analysis were carried out with a BioTOF II spectrometer (Bruker Daltonics, Billerica, MA, USA) coupled to a Waters Alliance 2795 HPLC system (Waters, Mildford, MA, USA). Recovery assays were carried out for each Fe(III)-chelate by spiking the agricultural matrices with known amounts of each analyte and the corresponding isotope labeled 57Fe(III)-chelates as internal standards. The nutrient solution matrix was 1/2 Hoagland. Irrigation water was sampled from the “Bardenas” irrigation channel and its main characteristics are pH 8.5, 0.35 dS m-1

electrical conductivity and 1.33, 2.15, 0.42, 0.03, 0.44, 2.36, 0.42, 0.61 mg·l-1 of Ca2+, Mg2+, Na+, K+, CO3

2-, HCO3-, SO4

2-, and Cl-, respectively. Soil solution was obtained after water incubation of a soil sampled in a peach orchard located in Alcañiz (Teruel, Spain). The main soil characteristics are silt sandy texture, pH in water 8.0, 30.5% total CaCO3 and 0.8% organic matter. Peach xylem exudates were isolated following the Schölander chamber method (Larbi et al. 2003). Three commercial fertilizers (A, B and C) containing Fe(III)-EDDHA and 6% soluble Fe (wt/wt) have been analysed .

ConclusionsThe method developed permits the direct and simultaneous

analysis of the major synthetic Fe(III)-chelates used as fertilizers in agricultural matrices and commercial fertilizer products.

The resolution of the mass spectrometer used can give information on isotopic distribution, allowing its use as a tool in tracer studies with stable isotopes.

References•Álvarez-Fernández et al. 2006 J. Am. Soc. Mass. Spectrom. (in press).•Bienfait et al. 2004 Soil Sci. Plant Nutr. 50, 1103–1110.•Dodi and Monnier 2004 J. Chromatogr. A 1032, 87–92•García-Marco 2005 Ph.D. Thesis Autonoma University of Madrid, Spain, pp 95–115.•Knepper et al. 2003 Trac-Trends Anal. Chem. 22, 708-724•Larbi et al. 2003 Plant Physiol. 160, 1473-1481•Nowack 2002, Environ. Sci. Technol. 36, 4009-4016

AcknowledgementsSupported by the Spanish MEC (Projects AGL2003-1999, AGL2004-0194 and AGL 2006-1416, co-financed with FEDER) and the Commission of European Communities (project Isafruit). Acquisition of the HPLC-MS(TOF) apparatus was co-financed with FEDER. IO and AA-F were supported by a CONAID-DGA predoctoral fellowship and a “Ramón y Cajal” research contract from the Spanish MEC.

IntroductionFertilizers containing synthetic Fe(III)-chelates are commonly used in soilless horticulture as well as in high value, field-grown crops affected by iron deficiency. However, the environmental matters raised on the use of such xenobiotic compounds are far from being completely understood (Nowack 2002, Knepper et al. 2003). Recently, we have developed a liquid chromatography-electrospray time of flight mass spectrometry (HPLC-ESI/MS(TOF)) method (Álvarez-Fernández et al. 2006) to determine the seven major synthetic ferric chelates used in agriculture (Fig 1). The aim of this work is to validate this HPLC-ESI/MS(TOF) method to determine these Fe(III)-chelates in four agricultural matrices, including nutrient solution, irrigation water, soil solution and plant xylem exudates as well as in commercial fertilizers. EDTA

N NCOOH

COOH

HOOC

HOOC

HEDTA

N NCOOH

CH2OH

HOOC

HOOC

DTPA

N NHOOC

HOOCN

COOH

COOHCOOH

NHHOOC

HNCOOH

HO

* *

R1R2

R3

R2

R3

N NCOOH

COOH

HOOC

HOOC

CDTA R1 R2 R3o,oEDDHAo,pEDDHA

EDDHMA

OH H HH OH H

OH CH3 H

Fig 1. Chelating agents of Fe(III)-chelates used as Fe-fertilizers.* Chiral carbons

Results and discussion

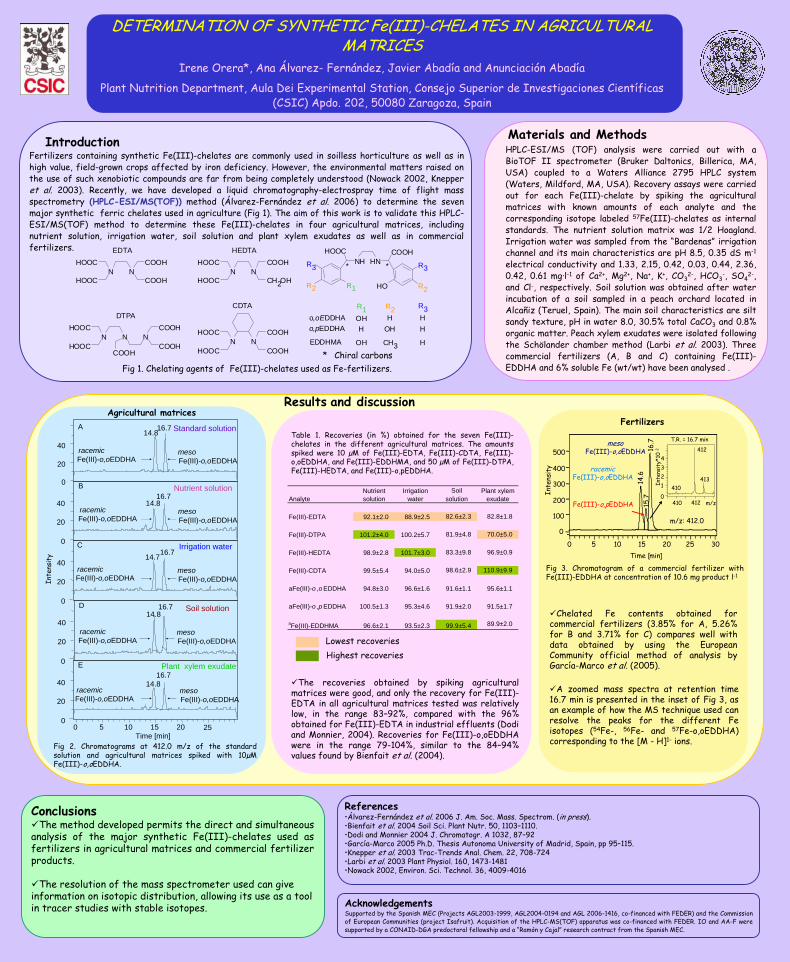
Fig 2. Chromatograms at 412.0 m/z of the standard solution and agricultural matrices spiked with 10µM Fe(III)-o,oEDDHA.

14.716.7

0

20

40

B

14.816.7

0

20

40

C

Soil solution

14.816.7

0

20

40

D

0 5 10 15 20Time [min]

Plant xylem exudate

14.816.7

0

20

40

Nutrient solution

Irrigation water

25

racemicFe(III)-o,oEDDHA

mesoFe(III)-o,oEDDHA

racemicFe(III)-o,oEDDHA

mesoFe(III)-o,oEDDHA

racemicFe(III)-o,oEDDHA

mesoFe(III)-o,oEDDHA

racemicFe(III)-o,oEDDHA

mesoFe(III)-o,oEDDHA

E

14.816.7

0

20

40 racemicFe(III)-o,oEDDHA

mesoFe(III)-o,oEDDHA

A Standard solution

Agricultural matrices

mesoFe(III)-o,oEDDHA

15.7

14.6

16.7

0

100

200

300

400

500

Fe(III)-o,pEDDHA

racemicFe(III)-o,oEDDHA

m/z: 412.0

Inte

nsit

y*10

2

413410

412

T.R. = 16.7 min

410 412 m/z0

1234

Inte

nsi t

y0 5 10 15 20

Time [min]3025

Fig 3. Chromatogram of a commercial fertilizer with Fe(III)-EDDHA at concentration of 10.6 mg product l-1

A zoomed mass spectra at retention time 16.7 min is presented in the inset of Fig 3, as an example of how the MS technique used can resolve the peaks for the different Fe isotopes (54Fe-, 56Fe- and 57Fe-o,oEDDHA) corresponding to the [M - H]1- ions.

Chelated Fe contents obtained for commercial fertilizers (3.85% for A, 5.26% for B and 3.71% for C) compares well with data obtained by using the European Community official method of analysis by García-Marco et al. (2005).

FertilizersTable 1. Recoveries (in %) obtained for the seven Fe(III)-chelates in the different agricultural matrices. The amounts spiked were 10 µM of Fe(III)-EDTA, Fe(III)-CDTA, Fe(III)-o,oEDDHA, and Fe(III)-EDDHMA, and 50 µM of Fe(III)-DTPA, Fe(III)-HEDTA, and Fe(III)-o,pEDDHA.

Soil solution

Fe(III)-EDTA 92.1±2.0 88.9±2.5 82.6±2.3 82.8±1.8

Fe(III)-DTPA 101.2±4.0 100.2±5.7 81.9±4.8 70.0±5.0

Fe(III)-HEDTA 98.9±2.8 101.7±3.0 83.3±9.8 96.9±0.9

Fe(III)-CDTA 99.5±5.4 94.0±5.0 98.6±2.9 110.9±9.9

aFe(III)-o ,o EDDHA 94.8±3.0 96.6±1.6 91.6±1.1 95.6±1.1

aFe(III)-o ,p EDDHA 100.5±1.3 95.3±4.6 91.9±2.0 91.5±1.7

aFe(III)-EDDHMA 96.6±2.1 93.5±2.3 99.9±5.4 89.9±2.0

AnalyteNutrient solution

Irrigation water

Plant xylem exudate

The recoveries obtained by spiking agricultural matrices were good, and only the recovery for Fe(III)-EDTA in all agricultural matrices tested was relatively low, in the range 83–92%, compared with the 96% obtained for Fe(III)-EDTA in industrial effluents (Dodi and Monnier, 2004). Recoveries for Fe(III)-o,oEDDHA were in the range 79-104%, similar to the 84–94% values found by Bienfait et al. (2004).

Lowest recoveriesHighest recoveries

Inte

nsi t

y