Embed Size (px)
Citation preview
DEVELOPING AN INDEX OF FINANCIAL INCLUSION
Dr Gursharan Singh KainthDr Gursharan Singh KainthDr Gursharan Singh KainthDr Gursharan Singh Kainth ICSSR Senior Fellow-cum-Director
Guru Arjan Dev Institute of Development Studies 14-Preet Avenue, Majitha Road PO Naushera, Amritsar 143008
The academic literature has adequately discussed the close relationship between financial
development and economic growth (Levine 1997). However, there has not been much discussion
on whether financial development implies financial inclusion. It has been observed that even
‘well-developed’ financial systems have not succeeded to be ‘all-inclusive’ and certain segments
of the population remain outside the formal financial systems. The importance of an inclusive
financial system is widely recognized in the policy circle in recent years and financial inclusion
is seen as a policy priority in many countries (Kempson et. al., 2004). An inclusive financial
system facilitates efficient allocation of productive resources and thus can potentially reduce the
cost of capital. In addition, access to appropriate financial services can significantly improve the
day-to-day management of finances. An inclusive financial system can help reducing the growth
of informal sources of credit (such as moneylenders) which are often found to be exploitative.
Thus, an all inclusive financial system enhances efficiency and welfare by providing avenues for
secure and safe saving practices and by facilitating a whole range of efficient financial services.
Financial inclusion is the ease of access, availability and usage of the formal financial system by
all members of the economy. The growing literature on financial inclusion has provided plenty
of evidences of the merits of an inclusive financial system. While the importance of financial
inclusion is widely recognized, the literature lacks a comprehensive measure that can be used to
estimate the extent of financial inclusion across economies at a regional level. This paper is an
attempt to fill this gap, and thus, an original contribution to the literature. In this paper, an
attempt is made to fill this gap by proposing an index of financial inclusion. A robust and
comprehensive measure of financial inclusion is important in order to take stock of the current
state of affairs with respect to financial inclusion in an economy and to monitor the progress of
the policy initiatives undertaken to promote financial inclusion. A robust and comprehensive
measure of financial inclusion will also be of importance to the research community to
investigate interesting hypothesis relating to financial inclusion that have been raised in the
academic literature.
Mandira Sharma (2008) made an attempt to develop Index of Financial Inclusion (IFI) across
different countries of the world. Following her approach, an attempt is made in this paper to
develop an Index of Financial Inclusion (IFI) for Punjab state following a multidimensional
approach. The proposed Index of Financial Inclusion (IFI) captures information on several
dimensions of an inclusive financial system. The IFI developed here can be used to compare
levels of financial inclusion across economies at a particular time point. It can also be used to
monitor the progress of policy initiatives for financial inclusion over a period of time. And, most
important, such an index can be of interest to the research community in order to investigate
empirical questions on relationship between development and financial inclusion. The IFI
developed here incorporates information on various dimensions of an inclusive financial system
and it is easy to compute.
INDICATORS:
Several indicators have been used to assess the extent of financial inclusion. The most commonly
used indicator has been the number of bank accounts (per 1000 adult persons). Some other
indicators are number of bank branches (per million people), number of ATMs (per million
people), amount of bank credit and amount of bank deposit. Such indicators, while used
individually, provide only partial information on the inclusiveness of the financial system of an
economy. Using individual indicators can lead to misleading understanding of the extent of
financial inclusion in an economy and fails to adequately capture the extent of financial
inclusion. Thus, a comprehensive measure, such as the index proposed in this study, is required.
A comprehensive measure of financial inclusion should be able to incorporate information on
several aspects (dimensions) of financial inclusion, preferably in one single number. Such a
measure can be used to compare the levels of financial inclusion across economies and across
states/provinces within countries at a particular time point. It can be used to monitor the progress
of policy initiatives for financial inclusion in a country over a period of time. Further, such a
measure can be of useful to address questions of academic interest that have been put forward in
the growing literature on financial inclusion. Some of the questions raised by the academic
community are whether high economic development leads to an all-inclusive financial system
and whether financial inclusion low is associated with high income inequality (Kempson et al,
2004). In order to investigate such questions empirically, a robust and comprehensive measure of
financial inclusion is required. A good measure of financial inclusion, that serves these purposes,
should be constructed based on the following criteria:
1. It should incorporate information on as many aspects (dimensions) of financial inclusion as possible.
2. It should be easy and simple to compute.
3. It should be comparable across countries.
In this study, the proposed Index of Financial Inclusion (IFI), satisfies all the above criteria. The
proposed IFI takes values between 0 and 1, zero indicating lowest financial inclusion (complete
financial exclusion) and 1 indicating complete financial inclusion. Such an index, in our view,
will be most useful for policy makers and academic researchers.
METHODOLOGY
As an inclusive financial system should be judged from several dimensions, we follow a
multidimensional approach while constructing the Index of Financial Inclusion (IFI). Our
approach is similar to that used by UNDP for computation of some well known development
indexes such as the HDI, the HPI, and the GDI and so on. As in the case of these indices, our
proposed IFI is computed by first calculating a dimension index for each dimension of financial
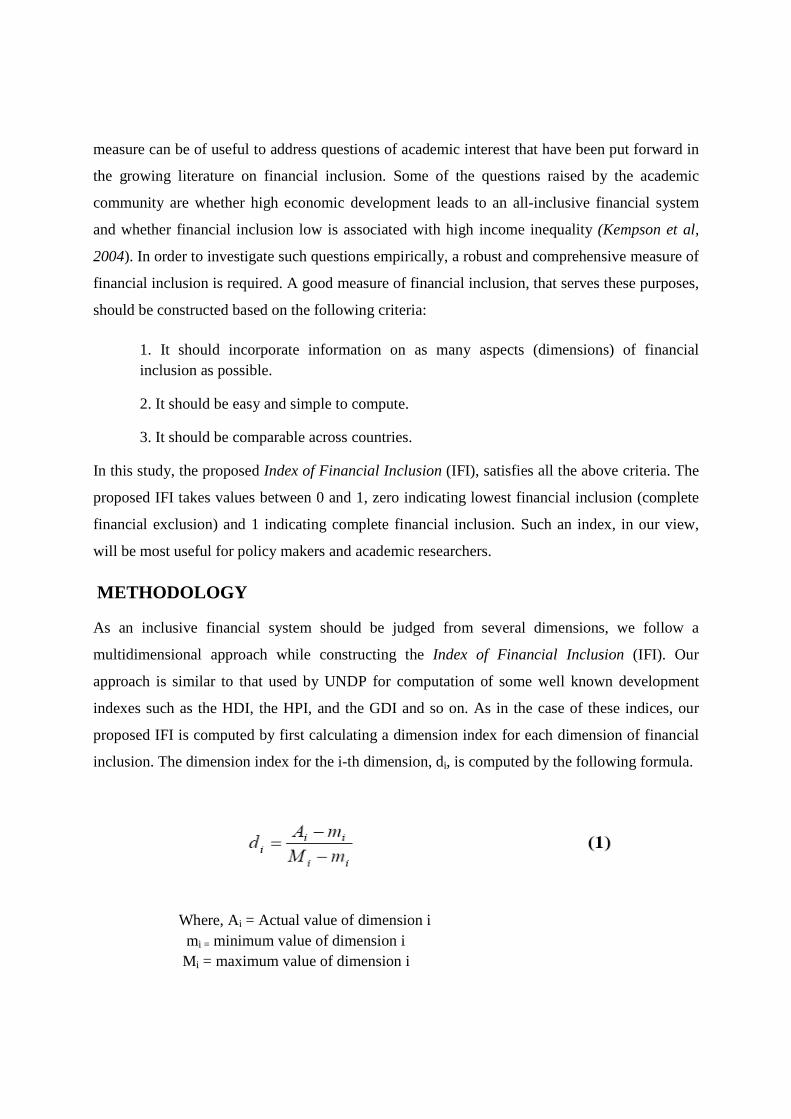
inclusion. The dimension index for the i-th dimension, di, is computed by the following formula.
Where, Ai = Actual value of dimension i mi = minimum value of dimension i Mi = maximum value of dimension i
Formula (1) ensures that 0 ≤ di ≤ 1. Higher the value of di, implies higher district’s achievement
in dimension i. If n dimensions of financial inclusion are considered, then, a district i will be
represented by a point Di = (d1, d2, d3, ….dn) on n-dimensional Cartesian space. (For details see
Technical Note in UNDP’s Human Development).
In the n-dimensional space, the point O = (0,0,0,…0) represents the point indicating the worst
situation while the point I = (1,1,1,…,1) represents the highest achievement in all dimensions.
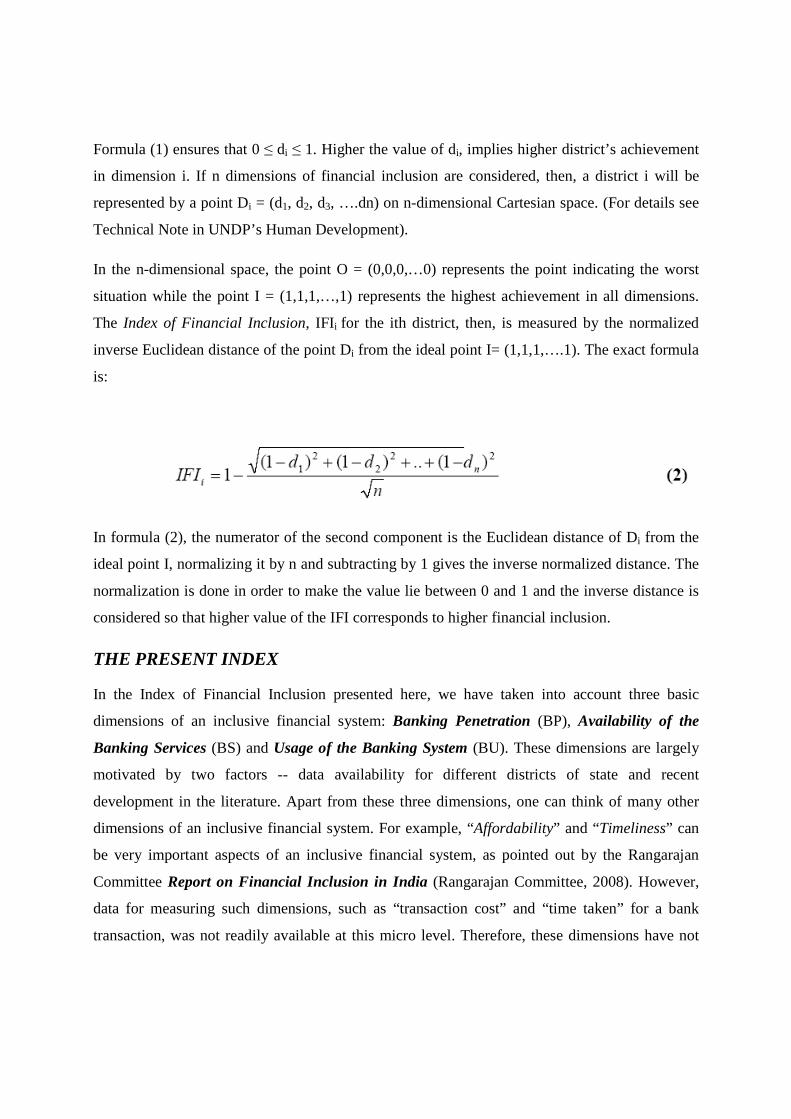
The Index of Financial Inclusion, IFIi for the ith district, then, is measured by the normalized
inverse Euclidean distance of the point Di from the ideal point I= (1,1,1,….1). The exact formula
is:
In formula (2), the numerator of the second component is the Euclidean distance of Di from the
ideal point I, normalizing it by n and subtracting by 1 gives the inverse normalized distance. The
normalization is done in order to make the value lie between 0 and 1 and the inverse distance is
considered so that higher value of the IFI corresponds to higher financial inclusion.
THE PRESENT INDEX
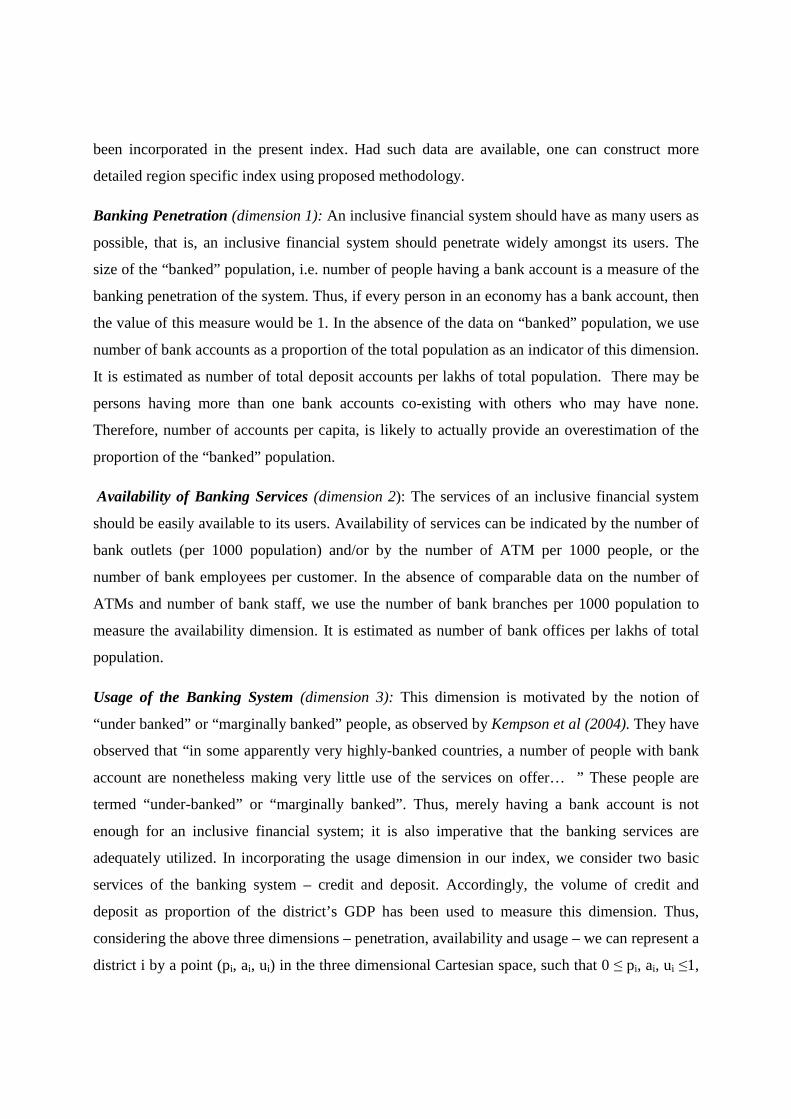
In the Index of Financial Inclusion presented here, we have taken into account three basic
dimensions of an inclusive financial system: Banking Penetration (BP), Availability of the
Banking Services (BS) and Usage of the Banking System (BU). These dimensions are largely
motivated by two factors -- data availability for different districts of state and recent
development in the literature. Apart from these three dimensions, one can think of many other
dimensions of an inclusive financial system. For example, “Affordability” and “Timeliness” can
be very important aspects of an inclusive financial system, as pointed out by the Rangarajan
Committee Report on Financial Inclusion in India (Rangarajan Committee, 2008). However,
data for measuring such dimensions, such as “transaction cost” and “time taken” for a bank
transaction, was not readily available at this micro level. Therefore, these dimensions have not
been incorporated in the present index. Had such data are available, one can construct more
detailed region specific index using proposed methodology.
Banking Penetration (dimension 1): An inclusive financial system should have as many users as
possible, that is, an inclusive financial system should penetrate widely amongst its users. The
size of the “banked” population, i.e. number of people having a bank account is a measure of the
banking penetration of the system. Thus, if every person in an economy has a bank account, then
the value of this measure would be 1. In the absence of the data on “banked” population, we use
number of bank accounts as a proportion of the total population as an indicator of this dimension.
It is estimated as number of total deposit accounts per lakhs of total population. There may be
persons having more than one bank accounts co-existing with others who may have none.
Therefore, number of accounts per capita, is likely to actually provide an overestimation of the
proportion of the “banked” population.
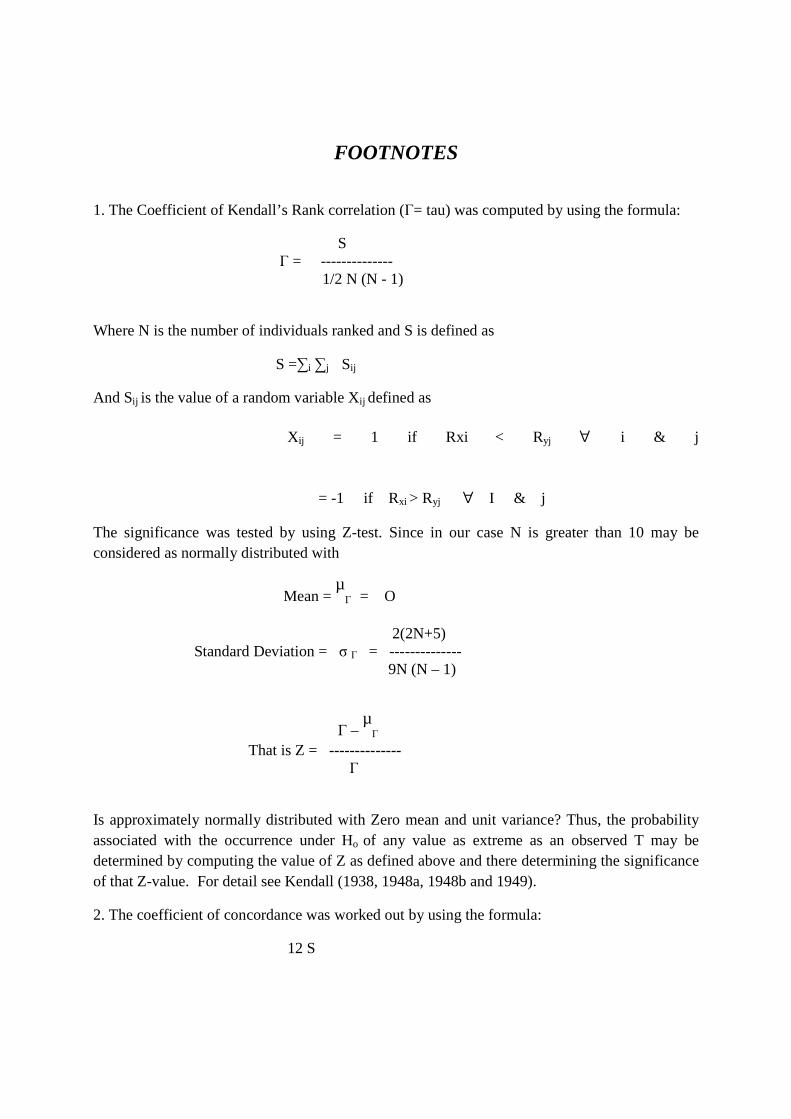
Availability of Banking Services (dimension 2): The services of an inclusive financial system
should be easily available to its users. Availability of services can be indicated by the number of
bank outlets (per 1000 population) and/or by the number of ATM per 1000 people, or the
number of bank employees per customer. In the absence of comparable data on the number of
ATMs and number of bank staff, we use the number of bank branches per 1000 population to
measure the availability dimension. It is estimated as number of bank offices per lakhs of total
population.
Usage of the Banking System (dimension 3): This dimension is motivated by the notion of
“under banked” or “marginally banked” people, as observed by Kempson et al (2004). They have
observed that “in some apparently very highly-banked countries, a number of people with bank
account are nonetheless making very little use of the services on offer… ” These people are
termed “under-banked” or “marginally banked”. Thus, merely having a bank account is not
enough for an inclusive financial system; it is also imperative that the banking services are
adequately utilized. In incorporating the usage dimension in our index, we consider two basic
services of the banking system – credit and deposit. Accordingly, the volume of credit and
deposit as proportion of the district’s GDP has been used to measure this dimension. Thus,
considering the above three dimensions – penetration, availability and usage – we can represent a
district i by a point (pi, ai, ui) in the three dimensional Cartesian space, such that 0 ≤ pi, ai, ui ≤1,
where pi, ai and ui denote the dimension indexes for district i computed using formula (1). In the
three dimensional Cartesian space, the point (0, 0, 0) will indicate the worst situation (complete
financial exclusion) and the point (1, 1, 1) will indicate the best or ideal situation (complete
financial inclusion).
The IFI for the district i is measured by the normalized inverse Euclidean distance of the point
(pi, ai, ui) from the ideal point (1, 1, 1). Algebraically,
Consequences of Financial Exclusion
Consequences of financial exclusion will vary depending on the nature and extent of services
denied. It may lead to increased travel requirements, higher incidence of crime, general decline
in investment, difficulties in gaining access to credit or getting credit from informal sources at
exorbitant rates, and increased unemployment, etc. The small business may suffer due to loss of
access to middle class and higher-income consumers, higher cash handling costs, delays in
remittances of money. According to certain researches, financial exclusion can lead to social
exclusion.
Results and Discussions:
Using data on all three dimensions (penetration, availability and usage) for all the 20 districts of
Punjab as well as for rural area of the state for the year 2008-2009, IFI values have been
computed. Initially all the districts were classified/grouped into three equal categories, that is, up
to 0.333; more than 0.33 and up to 0.66 and more than 0.66. However there was none district that
falls in HFI group in respect of rural Punjab. Therefore, depending on the value of IFI, all the
twenty districts are categorized into categories, viz.:
1. 0.66 < IFI ≤ 1.00 – Very High Financial Inclusion (VHFI)
2. 0.50 ≤ IFI < 0.66 – High Financial Inclusion (HFI)
3. 0.30 ≤ IFI < 0.50 – Medium Financial Inclusion (MFI)
4. 0 ≤ IFI < 0.30 – Low Financial Inclusion (LFI)
Index of Financial Inclusion for Punjab
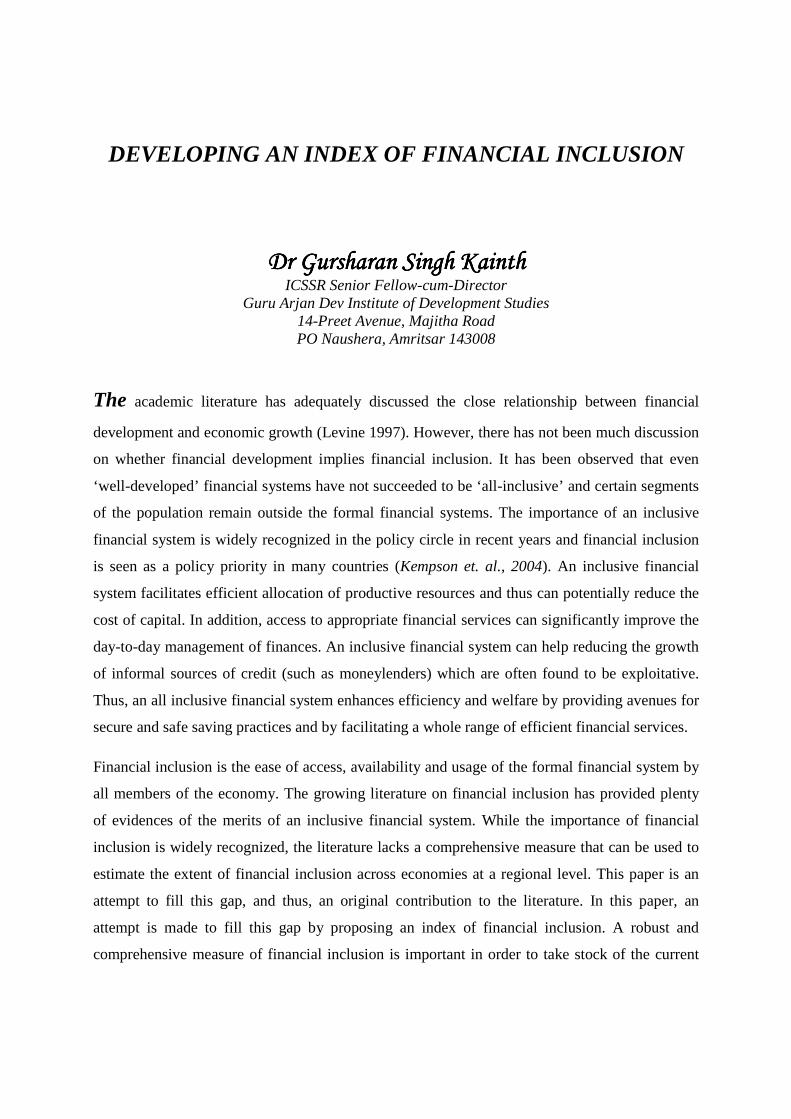
The estimated values of 3-dimensional Index of Financial Inclusion (3d-IFI) across all the
twenty districts of Punjab are presented in Table 1 and depicted in Fig.1 respectively. All the
three dimensions of Index of Financial Inclusion (IFI) are depicted in Fig 2. The average 3d-IFI
of Punjab was estimated at 0.354 indicating a low level of Financial Inclusion in Punjab.
However there was wide variation across different districts of Punjab, the estimated value of
Coefficient of Variation being 133.30 per cent. There are only three districts, namely, Jalandhar;
Sahibsada Ajit Singh (SAS) Nagar and Kapurthala having IFI values above 0.66 levels whereas
Manchester of Punjab - Ludhiana (0.638) is very near to high level group of 3d-IFI. Both
Jalandhar and Kapurthala districts fall under Doaba region, popularly known as Forex Spinner
of Punjab. Majority of persons (almost one person from each urban household) from this region
has gone abroad and hence have higher NRI accounts. Moreover SAS Nagar, popularly known
as Electronic hub of Punjab and adjoining Chandigarh Union Territory and a part of tri-city
ranked second (with 0.750) across different districts of Punjab where majority of the population
are working class in the proximity of state capital.
In a group of 20 districts for which 3-dimensional IFI has been estimated using data on three
dimensions of financial inclusion, higher level of financial inclusion was estimated in as many as
six districts, namely, Jalandhar (0.971), SAS Nagar (0.750), Kapurthala (0.692), Ludhiana
(0.638); Patiala (0.550) and SBS Nagar (0.540). On the other hand Mansa was at the lowest
ladder of the scale with 0.006 followed by Tarn Taran at 0.040 and Ferozpur at 0.075. Majority
of the districts (eleven) are in the low financial index group of having 3-d IFI (up to 0.3 levels).
These districts are Gurdaspur, Tarn Taran, Ferozpur, Mukatsar, Moga, Bathinda, Mansa,
Sangrur, Barnala, Rupnagar and Faridkot. Majority of these districts are newly created with the
view that small administrative units will help more development works. Apparently the
creations of small districts have had no improvement in the development process rather these
districts served as a White Elephant to the state exchequers. There are only three districts,
namely, Amritsar, Hoshiarpur and Fatehgarh Sahib that form the group of medium IFI districts
group with 3d-IFI values between 0.3 ≤ IFI < 0.5
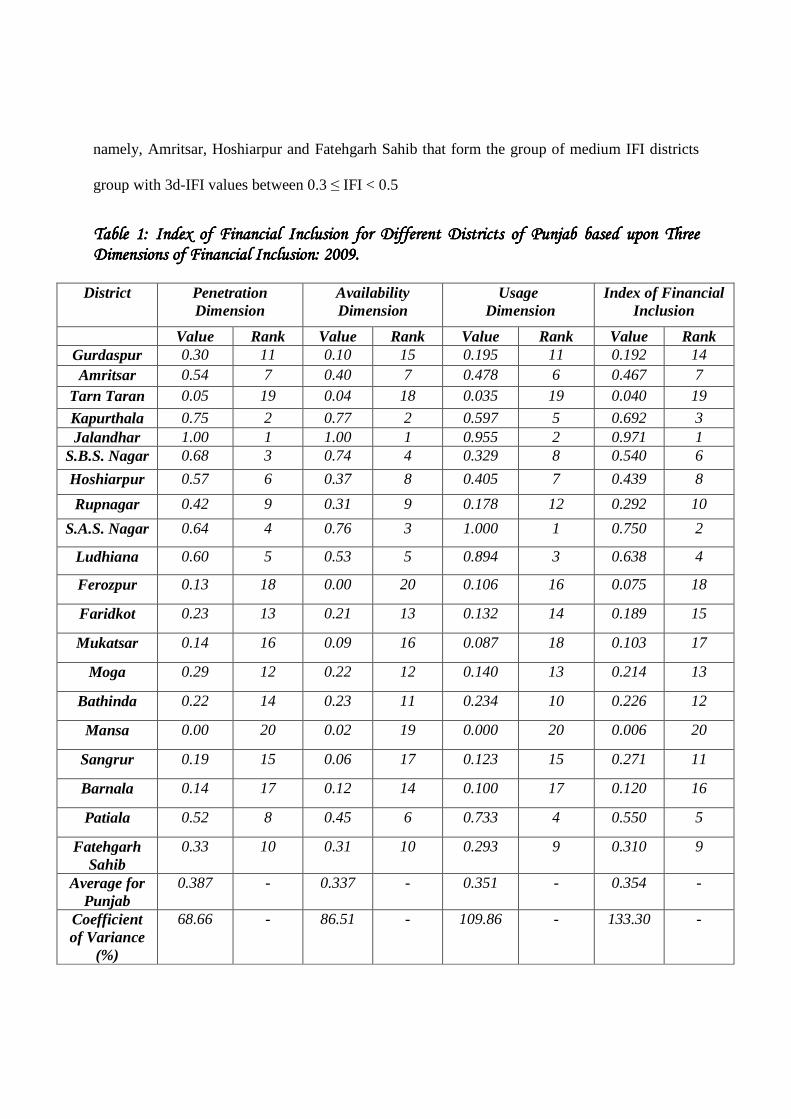
Table Table Table Table 1: Index of Financial Inclusion for Different Districts of Punjab based upon Three 1: Index of Financial Inclusion for Different Districts of Punjab based upon Three 1: Index of Financial Inclusion for Different Districts of Punjab based upon Three 1: Index of Financial Inclusion for Different Districts of Punjab based upon Three Dimensions of Financial Inclusion: 2009.Dimensions of Financial Inclusion: 2009.Dimensions of Financial Inclusion: 2009.Dimensions of Financial Inclusion: 2009.
District Penetration Dimension
Availability Dimension
Usage Dimension
Index of Financial Inclusion
Value Rank Value Rank Value Rank Value Rank Gurdaspur 0.30 11 0.10 15 0.195 11 0.192 14 Amritsar 0.54 7 0.40 7 0.478 6 0.467 7
Tarn Taran 0.05 19 0.04 18 0.035 19 0.040 19
Kapurthala 0.75 2 0.77 2 0.597 5 0.692 3 Jalandhar 1.00 1 1.00 1 0.955 2 0.971 1
S.B.S. Nagar 0.68 3 0.74 4 0.329 8 0.540 6
Hoshiarpur 0.57 6 0.37 8 0.405 7 0.439 8
Rupnagar 0.42 9 0.31 9 0.178 12 0.292 10
S.A.S. Nagar 0.64 4 0.76 3 1.000 1 0.750 2
Ludhiana 0.60 5 0.53 5 0.894 3 0.638 4
Ferozpur 0.13 18 0.00 20 0.106 16 0.075 18
Faridkot 0.23 13 0.21 13 0.132 14 0.189 15
Mukatsar 0.14 16 0.09 16 0.087 18 0.103 17
Moga 0.29 12 0.22 12 0.140 13 0.214 13
Bathinda 0.22 14 0.23 11 0.234 10 0.226 12
Mansa 0.00 20 0.02 19 0.000 20 0.006 20
Sangrur 0.19 15 0.06 17 0.123 15 0.271 11
Barnala 0.14 17 0.12 14 0.100 17 0.120 16
Patiala 0.52 8 0.45 6 0.733 4 0.550 5
Fatehgarh Sahib
0.33 10 0.31 10 0.293 9 0.310 9
Average for Punjab
0.387 - 0.337 - 0.351 - 0.354 -
Coefficient of Variance
(%)
68.66 - 86.51 - 109.86 - 133.30 -
Fig 4Fig 4Fig 4Fig 4.1: Financial Inclusion across Different Districts of Punjab and Rural Punjab.1: Financial Inclusion across Different Districts of Punjab and Rural Punjab.1: Financial Inclusion across Different Districts of Punjab and Rural Punjab.1: Financial Inclusion across Different Districts of Punjab and Rural Punjab
INDEX OF FINANCIAL INCLUSION FOR RURAL PUNJAB
Similar estimates were also made for rural areas across different districts of Punjab (defined as
Rural Punjab in the present study) taking into account all the three dimensions of Financial
Inclusion. The resulting estimates are
dimensions of Index of Financial
was estimated at 0.286 with a coefficient variation of 54.95 per cent. This implies that there are
lesser variations across different districts of rural Punjab as compared to Punjab
Higher consistency in the 3d-
adoption of rural welfare schemes through formal banking system, especially thanks to M
Gandhi NERGA scheme, old age pensions etc on a large scale.
.1: Financial Inclusion across Different Districts of Punjab and Rural Punjab.1: Financial Inclusion across Different Districts of Punjab and Rural Punjab.1: Financial Inclusion across Different Districts of Punjab and Rural Punjab.1: Financial Inclusion across Different Districts of Punjab and Rural Punjab
INDEX OF FINANCIAL INCLUSION FOR RURAL PUNJAB
Similar estimates were also made for rural areas across different districts of Punjab (defined as
ab in the present study) taking into account all the three dimensions of Financial
Inclusion. The resulting estimates are reported in Table 2 and depicted in Fig.
dimensions of Index of Financial Inclusion are depicted in Fig.3.Average 3
was estimated at 0.286 with a coefficient variation of 54.95 per cent. This implies that there are
lesser variations across different districts of rural Punjab as compared to Punjab
-IFI across different districts of rural Punjab may be attributed to
of rural welfare schemes through formal banking system, especially thanks to M
, old age pensions etc on a large scale.
.1: Financial Inclusion across Different Districts of Punjab and Rural Punjab.1: Financial Inclusion across Different Districts of Punjab and Rural Punjab.1: Financial Inclusion across Different Districts of Punjab and Rural Punjab.1: Financial Inclusion across Different Districts of Punjab and Rural Punjab.
INDEX OF FINANCIAL INCLUSION FOR RURAL PUNJAB
Similar estimates were also made for rural areas across different districts of Punjab (defined as
ab in the present study) taking into account all the three dimensions of Financial
reported in Table 2 and depicted in Fig. 1. All the three
3-d IFI for rural Punjab
was estimated at 0.286 with a coefficient variation of 54.95 per cent. This implies that there are
lesser variations across different districts of rural Punjab as compared to Punjab as a whole.
ss different districts of rural Punjab may be attributed to
of rural welfare schemes through formal banking system, especially thanks to Mahatma
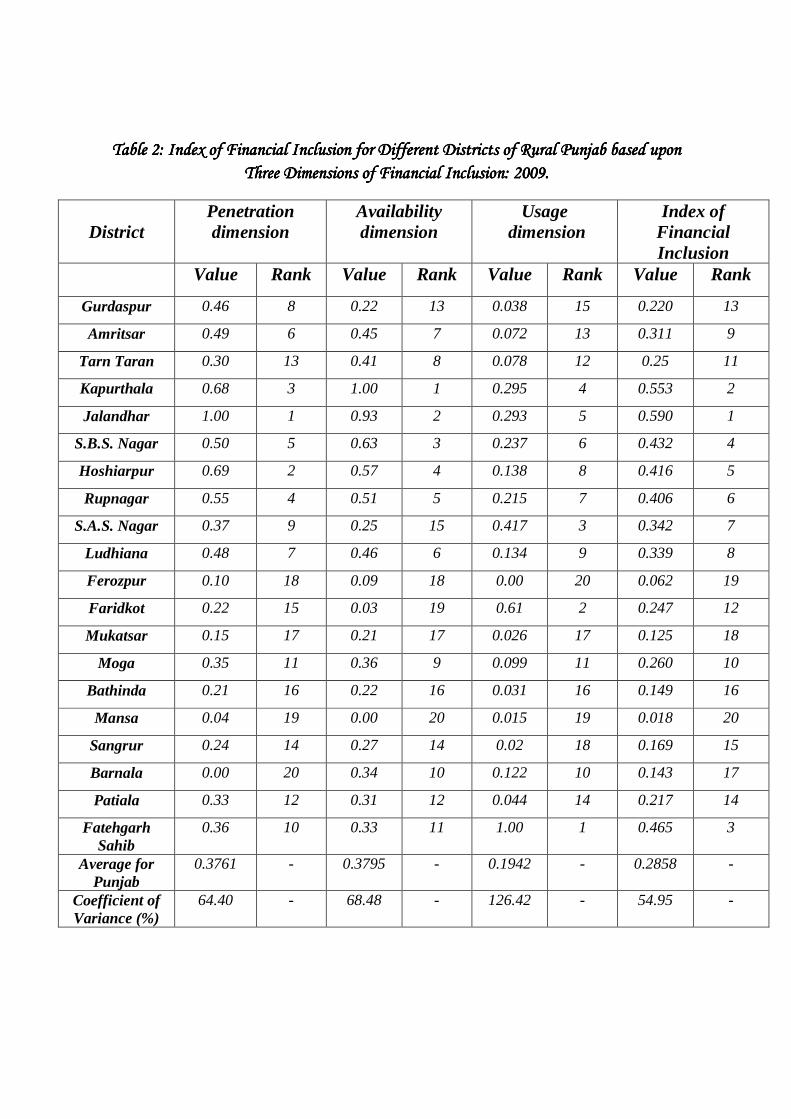
TableTableTableTable 2: Index of Financial Inclusion for2: Index of Financial Inclusion for2: Index of Financial Inclusion for2: Index of Financial Inclusion for Different Districts of Rural Punjab based upon Different Districts of Rural Punjab based upon Different Districts of Rural Punjab based upon Different Districts of Rural Punjab based upon
Three Dimensions of Financial Inclusion: 2009.Three Dimensions of Financial Inclusion: 2009.Three Dimensions of Financial Inclusion: 2009.Three Dimensions of Financial Inclusion: 2009.
District
Penetration dimension
Availability dimension
Usage dimension
Index of Financial Inclusion
Value Rank Value Rank Value Rank Value Rank
Gurdaspur 0.46 8 0.22 13 0.038 15 0.220 13
Amritsar 0.49 6 0.45 7 0.072 13 0.311 9
Tarn Taran 0.30 13 0.41 8 0.078 12 0.25 11
Kapurthala 0.68 3 1.00 1 0.295 4 0.553 2
Jalandhar 1.00 1 0.93 2 0.293 5 0.590 1
S.B.S. Nagar 0.50 5 0.63 3 0.237 6 0.432 4
Hoshiarpur 0.69 2 0.57 4 0.138 8 0.416 5
Rupnagar 0.55 4 0.51 5 0.215 7 0.406 6
S.A.S. Nagar 0.37 9 0.25 15 0.417 3 0.342 7
Ludhiana 0.48 7 0.46 6 0.134 9 0.339 8
Ferozpur 0.10 18 0.09 18 0.00 20 0.062 19
Faridkot 0.22 15 0.03 19 0.61 2 0.247 12
Mukatsar 0.15 17 0.21 17 0.026 17 0.125 18
Moga 0.35 11 0.36 9 0.099 11 0.260 10
Bathinda 0.21 16 0.22 16 0.031 16 0.149 16
Mansa 0.04 19 0.00 20 0.015 19 0.018 20
Sangrur 0.24 14 0.27 14 0.02 18 0.169 15
Barnala 0.00 20 0.34 10 0.122 10 0.143 17
Patiala 0.33 12 0.31 12 0.044 14 0.217 14
Fatehgarh Sahib
0.36 10 0.33 11 1.00 1 0.465 3
Average for Punjab
0.3761 - 0.3795 - 0.1942 - 0.2858 -
Coefficient of Variance (%)
64.40 - 68.48 - 126.42 - 54.95 -
However the lesser value of 3d-IFI for rural Punjab as compared to Punjab is a matter of great
concern. The need of the hour is that: various banking facilities and services should be
introduced/ provided/ adopted in the rural areas of Punjab on war footing. More importantly,
more jobs opportunities assuring regular and assured income flow are created for rural
population, failing which all banking facilities are going to collapse.
Jalandhar (with 3d-IFI = 0.590) again topped across different district of rural Punjab followed by
Kapurthala (0.553) and falls in the high 3d-IFI group, the reason being quite obvious. There are
as many as 11 districts, namely, Gurdaspur, Tarn Taran, Ferozpur, Faridkot, Mukatsar, Moga,
Bathinda, Mansa, Sangrur, Barnala and Patiala that lie in the low IFI group (up to 0.3 level).
Mansa (0.0.18) remained at the bottom of the ladder followed by Ferozpur with 0.062. There are
seven districts, namely, Amritsar, S.B.S. Nagar, Hoshiarpur, Rupnagar, S.A.S. Nagar, Ludhiana
and Fatehgarh Sahib that lie in middle IFI group (0.30 ≤ IFI < 0.50).
COMPLEMENTARY BETWEEN DIFFERENT DIMENSIONS:
It was hypothesized that those districts which had lower 3-dimensional Index of Financial
Inclusion were also having all the three dimensions at a lower rank and those where 3d-IFI was
higher all the three dimensions had higher ranks. This implies that different dimensions move in
complimentary fashions. Different dimensions of Financial Inclusions are depicted in Fig. 2 for
Punjab and Fig. 3 for rural Punjab. It is interesting to note that all the three dimensions of
financial inclusion moved in unison for Punjab as well as for rural Punjab. For example in higher
IFI group all the three dimensions of Financial Inclusion topped across different districts of
Punjab. Likewise all the three dimension of Financial Inclusion remained at the bottom of the
ladder across different districts of Punjab in low 3d-IFI group.
To confirm this, Coefficient of Complementary was estimated by rank correlation between all
possible pairs of ranks of different dimensions of Financial Inclusions. There were three
dimensions and hence three possible pairs. The resulting estimates of Coefficient of
Complimentary are reported in Table 3. All these estimated values are highly significant for both
Punjab as well as for rural Punjab. These estimates confirmed our view that all the three
dimensions moved in a complimentary fashions. This showed that in order to bring
improvements in the Financial Inclusions viz. various dimensions, all the three dimensions in the
lowest IFI group have to be tackled; for those in the middle group, the lagged dimensions have to
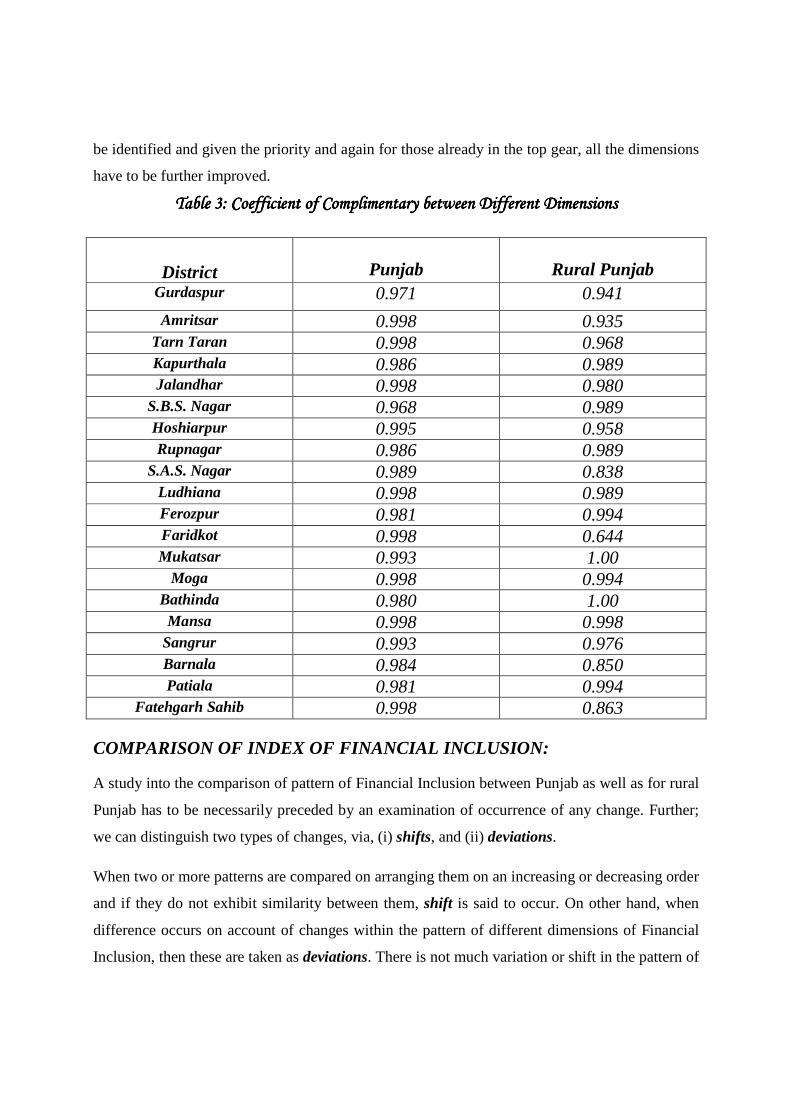
be identified and given the priority and again for those already in the top gear, all the dimensions
have to be further improved.
TTTTable able able able 3: Coefficient of Complimentary between Different Dimensions3: Coefficient of Complimentary between Different Dimensions3: Coefficient of Complimentary between Different Dimensions3: Coefficient of Complimentary between Different Dimensions
District
Punjab
Rural Punjab
Gurdaspur 0.971 0.941
Amritsar 0.998 0.935 Tarn Taran 0.998 0.968 Kapurthala 0.986 0.989 Jalandhar 0.998 0.980
S.B.S. Nagar 0.968 0.989 Hoshiarpur 0.995 0.958 Rupnagar 0.986 0.989
S.A.S. Nagar 0.989 0.838 Ludhiana 0.998 0.989 Ferozpur 0.981 0.994 Faridkot 0.998 0.644 Mukatsar 0.993 1.00
Moga 0.998 0.994 Bathinda 0.980 1.00 Mansa 0.998 0.998
Sangrur 0.993 0.976 Barnala 0.984 0.850 Patiala 0.981 0.994
Fatehgarh Sahib 0.998 0.863 COMPARISON OF INDEX OF FINANCIAL INCLUSION:
A study into the comparison of pattern of Financial Inclusion between Punjab as well as for rural
Punjab has to be necessarily preceded by an examination of occurrence of any change. Further;
we can distinguish two types of changes, via, (i) shifts, and (ii) deviations.
When two or more patterns are compared on arranging them on an increasing or decreasing order
and if they do not exhibit similarity between them, shift is said to occur. On other hand, when
difference occurs on account of changes within the pattern of different dimensions of Financial
Inclusion, then these are taken as deviations. There is not much variation or shift in the pattern of
financial inclusion between Punjab as well as rural Punjab. However, some deviations do occur
as the customers respond to changes is banking facilities and services and other influencing
variables.
However some significant changes have been noticed in some of the districts of rural Punjab as
compared to Punjab. Importantly, Fatehgarh Sahib has improved its position from ninth to third;
Rupnagar from tenth to six while Tarn Taran has improved its position from nineteen to
eleventh. Slight improvement in the relative position of Moga; Mukatsar and SBS Nagar has also
been noticed.
On the other hand, Ludhiana has deteriorated/slipped its fourth position to eighth position;
Patiala from fifth to fourteen while S.A.S Nagar slipped to seventh position from second best.
Likewise relative position of Bathinda and Sangrur, though at the lower web, has further
deteriorated in rural Punjab as compared to Punjab. All the districts fall in the Central Punjab
region. To test whether there is a shift in the pattern of financial inclusion across different
districts of Punjab with that of rural Punjab; Kendall’s rank correlation coefficient (Г = tau) was
estimated at 0.767, which is highly significant. Apparently, there are no shifts in the pattern of
financial inclusion across different districts in Punjab as compared to rural Punjab. Alternatively,
a coefficient of concordance was also estimated to be 0.8103 which was again highly significant.
Hence it can be definitely concluded that there has been no shift in the pattern of 3-dimensional
Index of Financial Inclusions (IFI) across different districts of Punjab as compared to rural
Punjab.
The need of the hours is that more branches of banks should be opened in the Rural Areas.
People must be made aware of financial services and new products should be introduced by
banks. Banks should design their products according to the requirement of low income group
people which will lead to inclusive growth Moreover bank employees should change their
behaviour towards the customers. The banks should provide credit to people at lower rate of
interest. Paper work and formalities should be reduced in banks. The Reserve Bank of India
should encourage scheduled commercial banks to open their branches in Rural Areas because
generally banks prefer to open their branches in urban areas due to profitable business. There is
need to change the mindset of the banking community. These efforts will increase the level of
Financial Inclusion in Rural Punjab.
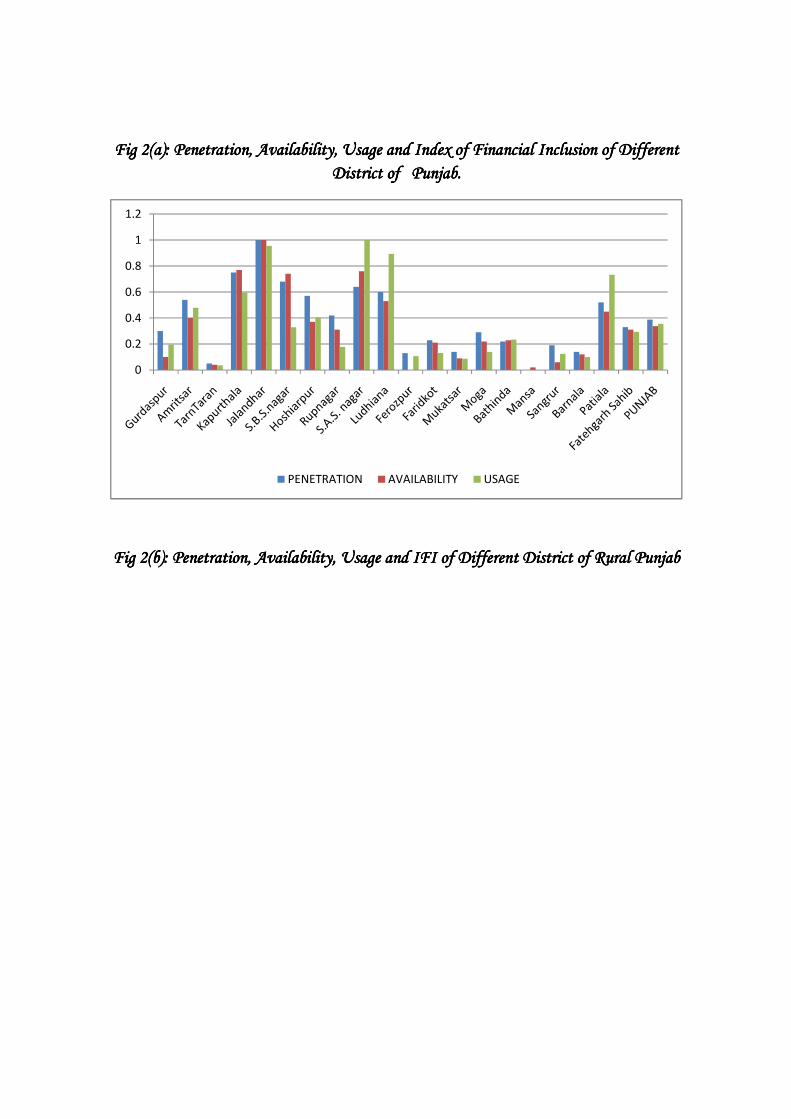
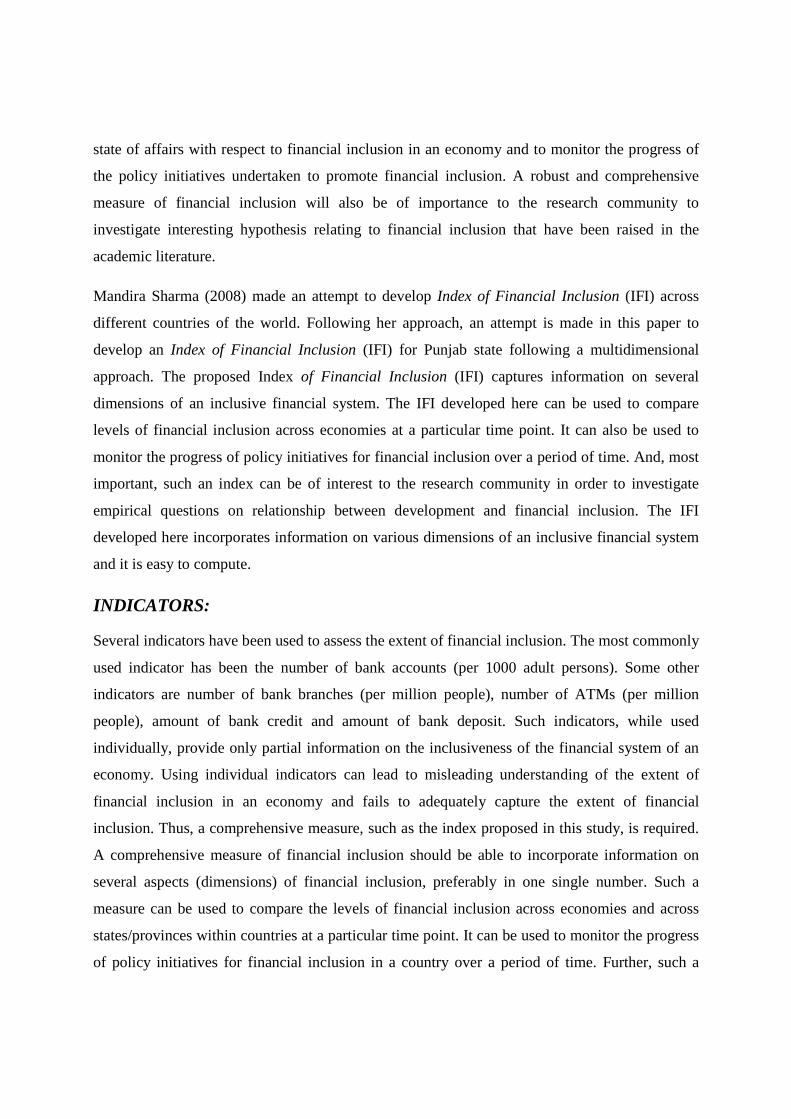
Fig Fig Fig Fig 2222(a)(a)(a)(a): Penetration, Availability, Usage and Index of Financial Inclusion of Different : Penetration, Availability, Usage and Index of Financial Inclusion of Different : Penetration, Availability, Usage and Index of Financial Inclusion of Different : Penetration, Availability, Usage and Index of Financial Inclusion of Different
Fig Fig Fig Fig 2(b)2(b)2(b)2(b): Penetration, : Penetration, : Penetration, : Penetration, Availability, Usage and IFI of Different District of Rural PunjabAvailability, Usage and IFI of Different District of Rural PunjabAvailability, Usage and IFI of Different District of Rural PunjabAvailability, Usage and IFI of Different District of Rural Punjab
0
0.2
0.4
0.6
0.8
1
1.2
: Penetration, Availability, Usage and Index of Financial Inclusion of Different : Penetration, Availability, Usage and Index of Financial Inclusion of Different : Penetration, Availability, Usage and Index of Financial Inclusion of Different : Penetration, Availability, Usage and Index of Financial Inclusion of Different
District of Punjab.District of Punjab.District of Punjab.District of Punjab.
Availability, Usage and IFI of Different District of Rural PunjabAvailability, Usage and IFI of Different District of Rural PunjabAvailability, Usage and IFI of Different District of Rural PunjabAvailability, Usage and IFI of Different District of Rural Punjab
PENETRATION AVAILABILITY USAGE
: Penetration, Availability, Usage and Index of Financial Inclusion of Different : Penetration, Availability, Usage and Index of Financial Inclusion of Different : Penetration, Availability, Usage and Index of Financial Inclusion of Different : Penetration, Availability, Usage and Index of Financial Inclusion of Different
Availability, Usage and IFI of Different District of Rural PunjabAvailability, Usage and IFI of Different District of Rural PunjabAvailability, Usage and IFI of Different District of Rural PunjabAvailability, Usage and IFI of Different District of Rural Punjab
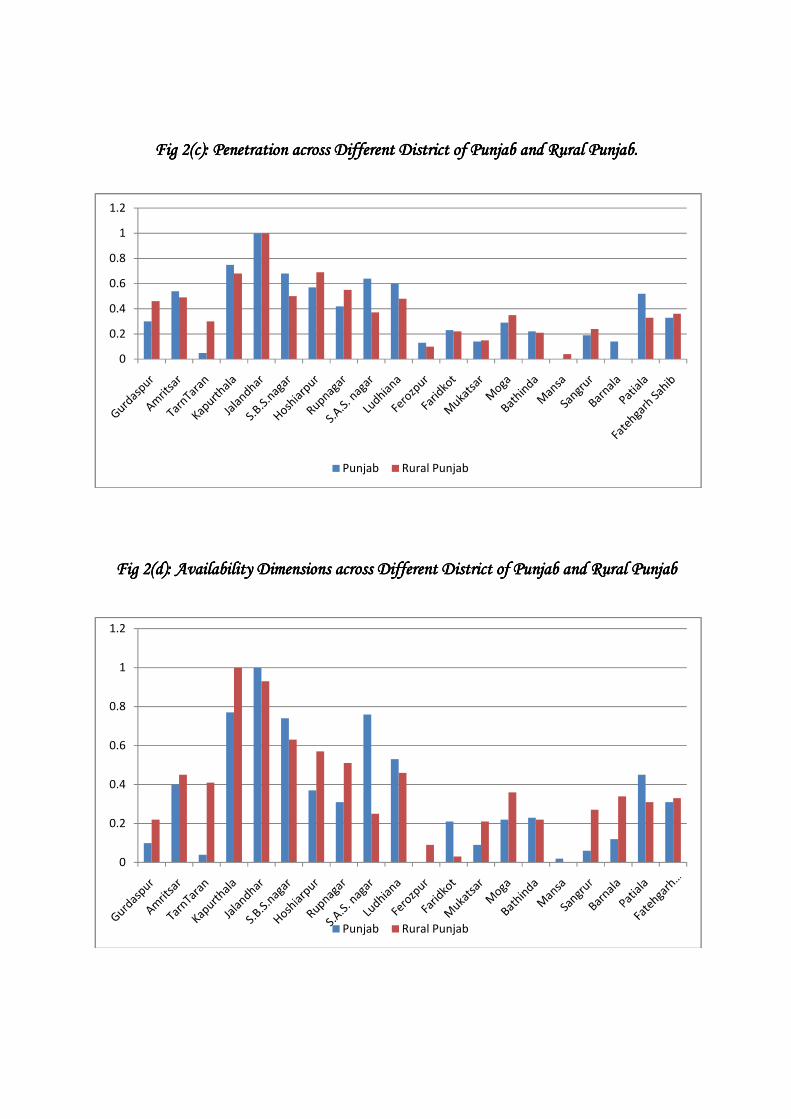
Fig Fig Fig Fig 2(c):2(c):2(c):2(c): Penetration across Different District of Punjab and Rural Punjab.Penetration across Different District of Punjab and Rural Punjab.Penetration across Different District of Punjab and Rural Punjab.Penetration across Different District of Punjab and Rural Punjab.
Fig Fig Fig Fig 2(d2(d2(d2(d):):):): Availability Dimensions across Different District of Punjab and Rural PunjabAvailability Dimensions across Different District of Punjab and Rural PunjabAvailability Dimensions across Different District of Punjab and Rural PunjabAvailability Dimensions across Different District of Punjab and Rural Punjab
0
0.2
0.4
0.6
0.8
1
1.2
Punjab Rural Punjab
0
0.2
0.4
0.6
0.8
1
1.2
Punjab Rural Punjab

Fig Fig Fig Fig 2(e)2(e)2(e)2(e): Usability Dimensions of Across Different District of Punjab and Rural Punjab.: Usability Dimensions of Across Different District of Punjab and Rural Punjab.: Usability Dimensions of Across Different District of Punjab and Rural Punjab.: Usability Dimensions of Across Different District of Punjab and Rural Punjab.
: Usability Dimensions of Across Different District of Punjab and Rural Punjab.: Usability Dimensions of Across Different District of Punjab and Rural Punjab.: Usability Dimensions of Across Different District of Punjab and Rural Punjab.: Usability Dimensions of Across Different District of Punjab and Rural Punjab.
: Usability Dimensions of Across Different District of Punjab and Rural Punjab.: Usability Dimensions of Across Different District of Punjab and Rural Punjab.: Usability Dimensions of Across Different District of Punjab and Rural Punjab.: Usability Dimensions of Across Different District of Punjab and Rural Punjab.
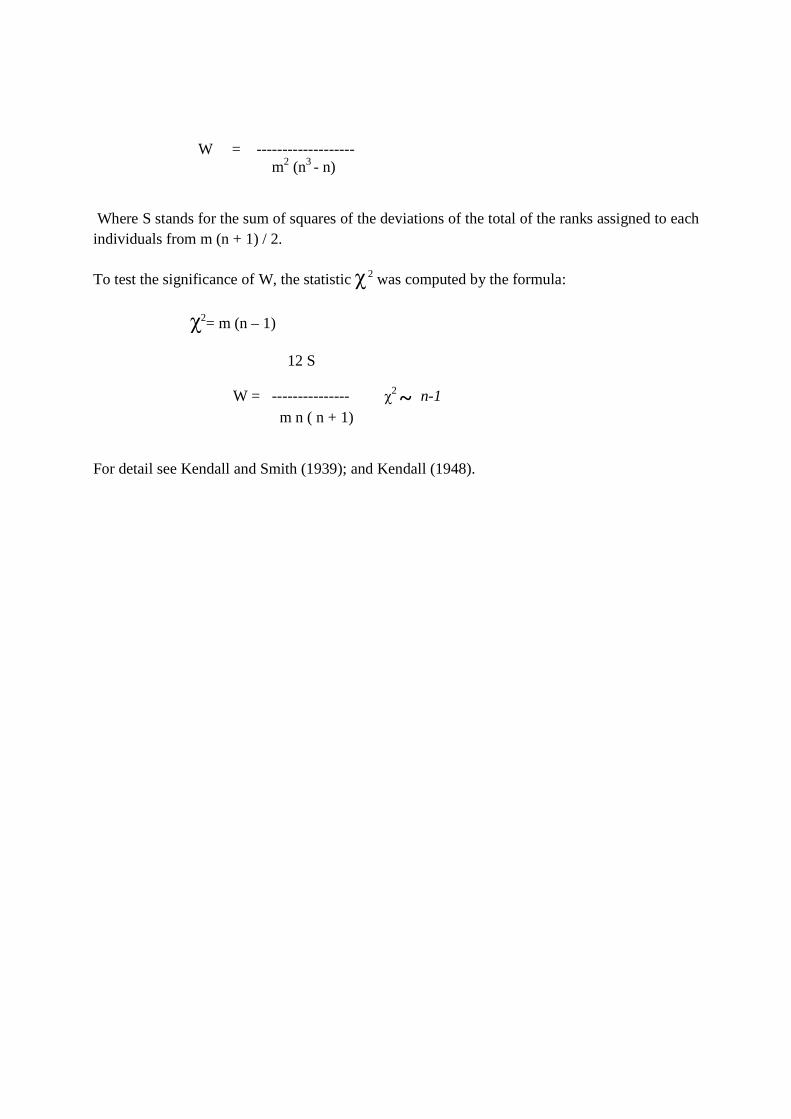
FOOTNOTES
1. The Coefficient of Kendall’s Rank correlation (Г= tau) was computed by using the formula:
S Г = -------------- 1/2 N (N - 1)
Where N is the number of individuals ranked and S is defined as
S =∑i ∑j Sij
And Sij is the value of a random variable Xij defined as
Xij = 1 if Rxi < Ryj ∀ i & j
= -1 if Rxi > Ryj ∀ I & j
The significance was tested by using Z-test. Since in our case N is greater than 10 may be considered as normally distributed with
Mean = µГ = O
2(2N+5) Standard Deviation = σ Г = -------------- 9N (N – 1)
Г – µГ
That is Z = -------------- Г
Is approximately normally distributed with Zero mean and unit variance? Thus, the probability associated with the occurrence under Ho of any value as extreme as an observed T may be determined by computing the value of Z as defined above and there determining the significance of that Z-value. For detail see Kendall (1938, 1948a, 1948b and 1949).
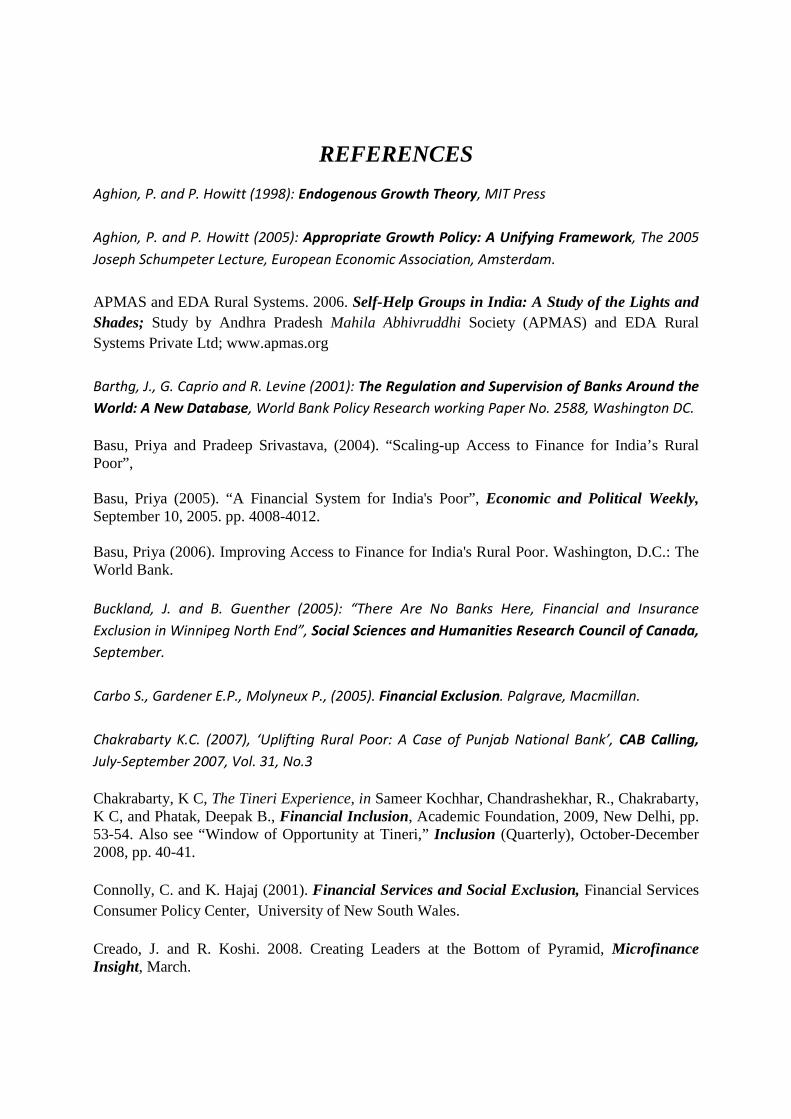
2. The coefficient of concordance was worked out by using the formula:
12 S
W = ------------------- m2 (n3 - n)
Where S stands for the sum of squares of the deviations of the total of the ranks assigned to each individuals from m (n + 1) / 2.
To test the significance of W, the statistic χ 2 was computed by the formula:
χ2= m (n – 1) 12 S
W = --------------- χ2 ~ n-1 m n ( n + 1)
For detail see Kendall and Smith (1939); and Kendall (1948).
REFERENCES
Aghion, P. and P. Howitt (1998): Endogenous Growth Theory, MIT Press
Aghion, P. and P. Howitt (2005): Appropriate Growth Policy: A Unifying Framework, The 2005
Joseph Schumpeter Lecture, European Economic Association, Amsterdam.
APMAS and EDA Rural Systems. 2006. Self-Help Groups in India: A Study of the Lights and Shades; Study by Andhra Pradesh Mahila Abhivruddhi Society (APMAS) and EDA Rural Systems Private Ltd; www.apmas.org
Barthg, J., G. Caprio and R. Levine (2001): The Regulation and Supervision of Banks Around the
World: A New Database, World Bank Policy Research working Paper No. 2588, Washington DC.
Basu, Priya and Pradeep Srivastava, (2004). “Scaling-up Access to Finance for India’s Rural Poor”,
Basu, Priya (2005). “A Financial System for India's Poor”, Economic and Political Weekly, September 10, 2005. pp. 4008-4012. Basu, Priya (2006). Improving Access to Finance for India's Rural Poor. Washington, D.C.: The World Bank.
Buckland, J. and B. Guenther (2005): “There Are No Banks Here, Financial and Insurance
Exclusion in Winnipeg North End”, Social Sciences and Humanities Research Council of Canada,
September.
Carbo S., Gardener E.P., Molyneux P., (2005). Financial Exclusion. Palgrave, Macmillan.
Chakrabarty K.C. (2007), ‘Uplifting Rural Poor: A Case of Punjab National Bank’, CAB Calling,
July-September 2007, Vol. 31, No.3
Chakrabarty, K C, The Tineri Experience, in Sameer Kochhar, Chandrashekhar, R., Chakrabarty, K C, and Phatak, Deepak B., Financial Inclusion, Academic Foundation, 2009, New Delhi, pp. 53-54. Also see “Window of Opportunity at Tineri,” Inclusion (Quarterly), October-December 2008, pp. 40-41.
Connolly, C. and K. Hajaj (2001). Financial Services and Social Exclusion, Financial Services Consumer Policy Center, University of New South Wales. Creado, J. and R. Koshi. 2008. Creating Leaders at the Bottom of Pyramid, Microfinance Insight, March.
Desai, M., (1991). “Human Development: Concepts and Measurement”, European Economic
Review 35, Pp. 350-357
Diamond Management and Technology Consultants (2006) “Building a More Inclusive Financial System in India”. Mumbai: DMTC. Dreze, J. and Sen, A., 1989, Hunger and Public Action. Oxford: Oxford University Press, p. 60. Ghate, Prabhu. “Consumer Protection in India Microfinance: Lessons from Andhra Pradesh and the Microfinance Bill.” Economic and Political Weekly, March 31, 2007. Government of India, Economic Survey - an annual publication of Ministry of Finance, Various
issues, Government of India, New Delhi
Government of India, (2008). Report of the Committee on Financial Inclusion in India (Chairman Dr. C. Rangarajan).January. Government of India, Development Challenges in Extremist Affected Areas, Report of an Expert Group to Planning Commission, Government of India, New Delhi, 2008, Government of India, National Initiatives Concerning Poverty Alleviation through Education and Training – National Policy for Empowerment of Women 2001, Ministry of Human Resource Development, New Delhi
Government of Punjab, Statistical Abstract of Punjab, Various Issues- an annual publication of
Economic and Statistical organization, Government of Punjab, Chandigarh
HM Treasury (1999). Access to Financial Services. London: HM Treasury.
Kainth, Gursharan Singh (2010), Managing Rural Finances in India, Concept Publishing Company, New Delhi Kainth, Gursharan Singh (2010), “Micro Finance in India: New mantra of Rural Finance” in Gursharan Singh Kainth (Ed.).op cit Kainth, Gursharan Singh (2010), “Institutional Credit for Agriculture in India: Status, Constraints and Future Agenda”, in Gursharan Singh Kainth (Ed.). Op cit Kainth, Gursharan Singh (2010), “Innovation in Rural Financial System”, in Gursharan Singh Kainth (Ed.). op cit
Kamath, Raghav. 2007. Branchless Banking: Corp Bank’s Answer for Financial Inclusion; CAB Calling July-September; Vol. 31, No. 3. Karmakar, K.G. (1999), Rural Credit and Self Help Groups: Micro Finance Needs and Concepts in India, Sage Publications, New Delhi Kelkar, Vijay, “Financial Inclusion for Inclusive Growth,” N P Sen Memorial Lecture at Administrative Staff College of India, Hyderabad, January 13, 2008, Kempson, E. (2006). Policy Level Response to Financial Exclusion in Developed Economies: Lessons for Developing Countries, paper presented at the conference, Access to Finance: Building Inclusive Financial Systems, World Bank, Washington, D.C.
Kempson E, A. Atkinson and O. Pilley, (2004). Policy Level Response to Financial Exclusion in
Developed Economies: Lessons for Developing Countries, Report of Personal Finance Research
Centre, University of Bristol.
Kempson E., C. Whyley, J. Caskey J, and S. Collard, (2000). In or Out? Financial Exclusion: A
Literature and Research Review, Report, Financial Services Authority.
Kochhar, Sameer (2008): Speeding Financial Inclusion, KOCH Development Foundation,
Kochhar, Sameer, Chandrashekhar, R,Chakrabarty, K C, and Phatak, Deepak B, (eds)., Financial Inclusion, Academic Foundation, 2009, New Delhi. Sameer Kochhar and Dhanjal, Gursharan, Participatory Democracy, Infrastructure and Empowerment, in Sameer Kochhar, Phatak, Deepak B, Krishnamurthy, H, and Dhanjal, Gursharan, eds., Infrastructure &Governance, Academic Foundation, 2008, New Delhi,
Leeladhar, V. (2005): Taking Banking Services to the Common Man- Financial Inclusion,
Commemorative Lecture at the Fedbank Hormis Memorial Foundation, Ernakulam on December
2, 2005
Levine R, (1997). “Financial Development and Economic Growth: Views and Agenda”, Journal of
Economic Literature, 35(2), Pp. 688-726
Leyshon, T., (1995). “Geographies of Financial Exclusion: Financial Abandonment in Britain and
the United States”, Transactions of the Institute of British Geographers New Series, 20,
Pp.312–41
Luchters, G. And Menkhoff, L., (1996). “Human Development as a Statistical Abstract”, World
Development, 24(8), Pp. 1385 – 1392
Mazumdar, Tanushree, Revisiting Financial Inclusion, Indian Institute of Banking and Finance,
Monthly Column;
Mohan, Rakesh, (2006), Economic Growth, Financial Deepening and Financial Inclusion, Address at the Annual Bankers' Conference 2006, at Hyderabad on Nov 3, 2006. Nathan, H.S.K., S. Mishra and B.S. Reddy, (2008). An Alternative Approach to Measure HDI,
IGIDR Working Paper WP-2008-002. Mumbai
Puhazhendi, V. and Satyasai, K.J.S. 2000. Micro-finance for Rural People: An Impact Evaluation; NABARD. Puhazhendi, V. and Badatya, K.C. 2002. SHG-bank Linkage Programme for Rural Poor - an Impact Assessment; www.microfinancegateway.org Rangarajan, C., “Reduce Economic Disparities, Improve Social Indicators”, Inclusion, April-June 2009,
Rangarajan, C. (2007). Financial Inclusion: Some Key Issues, Lecture delivered at Mangalore University, Mangalore, August 10, 2007. Ramji, Minakshi (2009). “Financial Inclusion in Gulbarga: Finding Usage Through Access”.Paper presented at CAB Conference on ‘Microfinance: From Research to Practice’, Pune, January 16-17, 2009. Reddy, Y. V. (1999). Future of Rural Banking. Prof. G. Ram Reddy Third. Endowment Lecture, Hyderabad, India, December 4, 1999. Reserve Bank of India, available at rbidocs.rbi.org.in/rdocs/Bulletin/DOCs/10991.doc Reserve Bank of India (2008), ‘Report on Currency and Finance 2006-08- (Volume II), 2008
Reserve bank of India, Draft Report of the High Level Committee to Review the Lead Bank Scheme, Reserve Bank of India, May 2009, available at http://rbi.org.in/scripts/PublicationReportDetails.aspx?ID=552
Romesh, S. and Preeti Sahai, (2007) “Universal Financial Inclusion in India: The Way Forward”,
Cab Calling, Vol. 31, No.3, July-September 2007
Ruthven, Orlanda (2001). Money Mosaics: Financial Choice and Strategy in a West Delhi Squatter Settlement, University of Manchester, Institute for Development Policy and Management, Finance and Development Research Programme Paper 32. Ruthven, Orlanda and Sushil Kumar (2002). Finegrain Finance: Financial Choice and Strategy among the Poor in Rural North India, University of Manchester, Institute for Development Policy and Management, Finance and Development Research Programme Paper 57.
Sagar, A. D. and A. Najam, (1998). “The Human Development Index: A Critical Review”,
Ecological Economics, 25, Pp. 249-264
Sarma, Mandira, (2008), Index of Financial Inclusion, Working Paper No. 215, Indian Council for
Research on International Economic Relation, New Delhi, June
Sinclair S. P., (2001). Financial Exclusion: An Introductory Survey, Report of Centre for Research
in Socially Inclusive Services, Heriot-Watt University, Edinburgh.
Sundara Rajan, M.S. (2007), ‘Replication of Financial Inclusion: Opportunities and Challenges-
Indian Bank Experience’, CAB Calling, July-September 2007, Vol. 31, No.3
Thorat, Usha. 2007. Financial Inclusion – The Indian Experience, Speech made at the HMT-DFID Financial Inclusion Conference 2007, London, June 19, 2007, available at www.rbi.org.in/scripts/speeches. Thorat, Usha (2008) Keynote address on ‘Financial Inclusion and Information Technology’ at ‘Vision 2020 - Indian Financial Services Sector’, Mumbai, September 12, 2008.
Trabold-Nubler, H., (1991), “The Human Development Index – A New Development Indicator?”,
Intereconomics, 26 (5), Pp.236-243
Wallace, James E. 1995. “Financing Affordable Housing in the United States”, Housing Policy Debate, 6(4). World Bank. 2008. Finance for All – Policy and Pitfalls in Expanding Access. The World Bank, Washington, D.C.
Zeleny, M., (1974), “A Concept of Compromise Solutions and the Method of the Displaced Ideal”,
Computers and Operations Research, 1, Pp. 479-496.