Embed Size (px)
Citation preview

Db
Ya
b
c
h
••••
a
ARRA
1
dAsmtiioaai
f
yy
h0
Nuclear Engineering and Design 278 (2014) 255–267
Contents lists available at ScienceDirect
Nuclear Engineering and Design
jou rn al hom ep age: www.elsev ier .com/ locate /nucengdes
evelopment of a risk monitoring system for nuclear power plantsased on GO-FLOW methodology
ang Juna, Yang Minga,∗, Hidekazu Yoshikawab, Yang Fangqingc
College of Nuclear Science and Technology, Harbin Engineering University, No. 145 Nantong Street, Nangang District, Harbin 150001, PR ChinaSymbio Community Forum, Kyoto, JapanChina Nuclear Power Technology Research Institute, 518000, PR China
i g h l i g h t s
A method for developing Living PSA is proposed.Living PSA is easy to update with online modification to system model file.A risk monitoring system is designed and developed using the GO-FLOW.The risk monitoring system is useful for plant daily operation risk management.
r t i c l e i n f o
rticle history:eceived 12 April 2014eceived in revised form 22 June 2014ccepted 29 July 2014
a b s t r a c t
The paper presents a risk monitoring system developed based on GO-FLOW methodology which is asuccess-oriented system reliability modeling technique for phased mission as well as time-dependentproblems analysis. The risk monitoring system is designed to receive information on plant configuration
changes either from equipment failures, operator interventions, or maintenance activities, then updatethe Living PSA model with online modification to the system GO-FLOW model file which contains all thefunctional modes of equipment represented by a proposed generalized GO-FLOW modeling structure,and display risk values graphically. The risk monitoring system can be used to assist safety engineers andplant operators in their maintenance management and daily operation risk management at NPPs.. Introduction
Safe operation is the precondition for pursuing higher pro-uctivity at nuclear power plants (NPP). Probabilistic Safetyssessment (PSA), aiming at providing insights on the existingafety margins for event sequences with an integrated risk analysisodel, has been widely used as a complement to the determinis-
ic analyses for NPPs in recent years (Ahn et al., 2010). The safetymprovements resulting from the PSA applications also lead to itsncreasing development in plant operation toward to a continu-us monitoring of safety (Hahn and Requssard, 2008). In order to
chieve the continuous monitoring of safety, PSA enhancementsnd PSA upkeep are necessary to reflect plant changes for enhanc-ng the understanding of the current plant safety. This specific PSA∗ Corresponding author. Tel.: +86 13945152277/451 82568019;ax: +86 451 82568019.
E-mail addresses: [email protected], [email protected] (J. Yang),[email protected] (M. Yang), [email protected] (H. Yoshikawa),[email protected] (F. Yang).
ttp://dx.doi.org/10.1016/j.nucengdes.2014.07.035029-5493/© 2014 Elsevier B.V. All rights reserved.
© 2014 Elsevier B.V. All rights reserved.
practices are known as Living PSA (Gomez Cobo, 1999) and riskmonitor (Balfanz and Virolainen, 1999; Kafka, 1992; Gomez Cobo,2001).
Living PSA (Johanson and Holmberg, 1994) is a plant specificPSA that is used for determining the average risk of the plant forsome average assumed conditions or simplifications made in themodel, with aspects such as average initiating event frequencies,maintenance unavailability and simplified system alignments. Riskmonitor (Shepherd et al., 2004) is a real-time analysis tool of LivingPSA. Risk monitor aims at providing point-in-time risk based on theactual plant configuration. The risk monitor model is based on andupdated with higher or at least the same frequency as Living PSA.While, at the same time risk monitor PSA model is significantlydifferent from the model that is used for Living PSA. Hence, theLiving PSA model needs to be inspected and amended to removethese simplifications and more information of the current state ofthe plant needs be used in the PSA to make it more suitable for therisk monitor.
A risk monitoring system that the authors proposed in this paperis shown in Fig. 1. The core of risk monitoring system is Living PSAwhich consists of two aspects, that is, developing and updating

256 J. Yang et al. / Nuclear Engineering and Design 278 (2014) 255–267
OperationalDecisions
Condition Monitoring
Fault Diagonosis
ReliabilityDatabase
BuildLiving PSAModels
Human-Machine Interface
MaintenancePlans
Reliability DataUpdate
UpdateLiving PSAModels
Develop intoRisk Monitor Models(Risk Monitor Database)
Level 1 PSADocuments
Bayesian Theorem for Data Evaluation
SolutionEngine Maintenance
Planning
Apply toRisk-informedTechnical
Specifications
ReliabilityCenteredMaintenance(RCM)
EquipmentIn Fault
Reliability DataFor LPSA
EquipmentStatus Operator
SupportSystem
rk of t
L1deoobmmbrmgmo
mrGdafpsabaF
2
2
om
Fig. 1. Conceptual framewo
iving PSA models. Living PSA models are built based on Level- PSA models with specific considerations reflecting the currentesign and operation features adequately. The Living PSA mod-ls will be online updated automatically or manually as changesccur in any aspect of plant operation and fault phenomenol-gy, maintenance activities or update of reliability data which cane captured from information system, operator support system,aintenance management system, and reliability data manage-ent system respectively. The updated Living PSA models will
e sent to the solution engine for re-quantification. The analysisesults are interpreted and documented in the database of riskonitoring system and shown to the plant personnel through
raphical human–machine interface for risk monitoring and riskanagement which will contribute to significant improvements in
perational economy and safety.This paper will present the risk monitoring system based on a
ethod for developing Living PSA by GO-FLOW methodology. Theest of the paper is organized as follows. The motivation of whyO-FLOW is applied to the development of Living PSA is first intro-uced in Section 2. Then a method for developing Living PSA with
proposed GO-FLOW modularization model is presented, whereollowing that online model modification together with the remoterocedure call technique for model re-quantification are also pre-ented in this section. With the utilization of these key technologies,
risk monitoring system is configured and designed for a PWR NPPy GO-FLOW method in Section 3. In Section 4, the functional char-cteristics of the risk monitoring system developed are introduced.inally, the conclusions are made in Section 5.
. Living PSA by GO-FLOW method
.1. The motive for developing Living PSA by GO-FLOW method
PSA models for risk monitoring can be represented in a numberf ways. Fault tree (FT)/event tree (ET) are the most conventionalethods (Nelson and Novack, 2003) used for PSA models. Fault tree
he risk monitoring system.
analysis puts the possible causes for system failure in a logical formthat is helpful in identifying weakness in the system. Fault treescan be used in system reliability analysis from both qualitative andquantitative points of view. However, the conventional fault treehas several limitations in order to describe the effects of systemconfiguration changes, especially caused by surveillance test andmaintenance activities (Cepin and Mavko, 2002). This is because thefailure behavior of systems with those different modes of operationis generally dependent on the time stamp or the sequence of events(Walker and Papadopoulos, 2008), while time-dependent unavail-ability analysis cannot be performed by one fault tree analysis (Renand Dugan, 1998). In addition, a fault tree is difficult to modify orvalidate as a large complex target system is to be considered.
GO-FLOW methodology (Matsuoka, 1986) is a success-treebased system reliability analysis technique. Compared to fault treeanalysis (FTA), GO-FLOW is more suitable for the availability analy-sis of repairable systems with phased mission problems (Matsuokaand Kobayashi, 1988, 1989a) and timing consideration (Matsuokaand Kobayashi, 1989b). Reliability analysis by GO-FLOW consists oftwo steps: first constructing a GO-FLOW chart for the target systemand then calculating the system reliability quantitatively. The GO-FLOW model corresponds to the physical layout of the system. Themodel can be easily constructed from GO-FLOW operators. Theseoperators represent particular functional modes or logical gates.Reliability analysis by GO-FLOW is performed by the approximatemethod used in the fast fault-tree analysis program (Matsuoka,1986). The GO-FLOW methodology can also be used for commoncause failure analysis (Matsuoka and Kobayashi, 1997) and logi-cal loops (Matsuoka, 2010a) evaluation and has been applied to awide variety of systems, ranging from railways (Matsuoka, 2010b),and elevator systems (Matsuoka, 2010b) to nuclear power plants(Okazaki et al., 2006).
One of the specific applications of living PSA is to use it as aPSA tool to generate risk information for day-to-day managementof operational safety at NPPs. These daily operational and mainte-nance activities on components turn out to be sequence-dependent

ing an
asficobtimraBswp
2P
vcbcdaadiim
dcbaasepoaeampsleBtitT
atnuTicooib
J. Yang et al. / Nuclear Engineer
nd time-dependent with dynamic behavior. The time-dependentequential action order requires continuous-time processes or anite number of discrete time values to express it, which is indi-ated to be difficult to handle by conventional fault trees. On thether hand, the system operation sequence with time stamps cane easily analyzed by GO-FLOW method. Apart from the sequen-ial action problem, a component may vary its functional statusn different phases of the system life cycle, i.e. operation, standby,
aintenance, test and failure. When component status is changing,e-arrangements of system configuration and operation sequencere necessarily made to maintain the objective of system function.y then, the GO-FLOW model must be updated in terms of the newystem configuration. The model update is readily accomplishedith a GO-FLOW modularization modeling method which will beresented in the next section.
.2. Development of a generalized GO-FLOW structure for livingSA
In conventional GO-FLOW analysis, the system logic modelaries greatly as the component status and system configurationhanges. Although sometimes the updated GO-FLOW model maye only subtle alternations to the original system model, the pro-ess of update involves many trivial manual operations by eitherisplacing GO-FLOW operators or modifying parameters of oper-tors in conventional GO-FLOW modeling method. Human errorsre easily introduced in the process. And this is even more bur-ensome for those who are not PSA specialists but are required to
nteract with the PSA model. Therefore, it is most desirable that Liv-ng PSA update could be completed in a convenient way by a risk
anagement tool.In this section, a generalized GO-FLOW structure is proposed for
eveloping living PSA models that contain all possible system andomponent operational states. The generalized model is presentedased on the conventional GO-FLOW modeling method. The gener-lized model is actually an integrated model of a component withll kinds of functional modes synthesized in different phased mis-ions. Fig. 2 shows the integrated model structure. The structurexhibits all the functional status modes that a component such asump, valve, actuator, etc. may experience in its lifetime withinne single module. In the GO-FLOW module, all component statesre arrayed in a parallel structure, which is straightforward forxpressing the component state. The state changes among themre easily completed through the switchover of different functionalode lines. The status modes included in the generalized model are
resented in individual modules, with each functional module con-isting of a set of designated GO-FLOW operators so that differentevels of component performance and task demands can be mod-led. Each functional mode module is taken as a stand-alone unit.y adding or deleting the corresponding functional mode unit inhe integrated model, the reliability characteristics of equipmentn different mission profiles and modes are described. The func-ions of operators defined in GO-FLOW method are explained inable 1.
The generalized GO-FLOW model covers all functional modes of component, which are operating, standby, test, failure, and main-enance, respectively as Line A to Line E as shown in Fig. 2. Theumber below the horizontal line of each operator in the model issed to identify operators that may be of the same operator type.hese numbers will be given by GO-FLOW editor automatically dur-ng the GO-FLOW modeling. The subroutine line drawn in differentolor in the model is used to guide and distinguish the signal flows
f component in different functional modes. The signal flows outf functional operators such as type-21 operator (No. 11 operatorndicated by cyan) and type-28 operator (No. 12 operator indicatedy bold black) in the model that represent the basic characteristicd Design 278 (2014) 255–267 257
and time delay of a component, and it comes to an end at an ORgate through mutually exclusive functional mode lines. Because ofthe mutual exclusion of component status, exclusive-OR operationin this generalized GO-FLOW model is hence substituted by com-bining type-22 operator (OR gate) with the control over open andclose demand signal of type-39 operator in each subroutine line.The type-21 operator in the model structure represents a pass/failtype component. It can be also replaced by a type-26 operator, type-27 operator or type-39 operator depending on the type of productsranging from normally closed component, normally open compo-nent to on-off component. Type-28 operator is a delay operatorused for describing the delay effect of a component but is not anecessity in every component model. When the time delay of asignal is not being considered, type-28 operator is allowed to beremoved from the model so that the signal flow will come out ofthe basic characteristic operator (in this model, it is indicated by No.12 operator) to a particular subroutine line. The functional modesas well as its subroutine lines are explained in detail as follows.
2.2.1. MODE 1: operating – signal flows through subroutine line AFor a component working in operating mode, type-35 operator
(No. 13 operator) is used to model the aging impacts of operatingfailure. The operating failure follows an exponential distributionand is modeled by
R(t) = �
� + �+ �
� + �exp[−(� + �) · t] (1)
where R(t) is the output signal intensity of the operator, � is the fail-ure rate and � is the repair rate, which describes the time to failureand the time to repair of component as an exponential distribution.The failure rate and repair rate are assumed to be constant. The timeperiod t for operation is represented by a type-25 operator (No. 2operator).
2.2.2. MODE 2: standby – signal flows through subroutine line BStandby failure of component is modeled by type-37 operator
(No. 14 operator) in GO-FLOW method. Type-37 operator in theGO-FLOW model also models the preventive maintenance activitywith a type-25 operator (No. 3 operator) connected which yieldsnegative sub-input values to cancel the age effects of standby fail-ure.
The reliability changes of a component in preventive mainte-nance is given by
R(t) = �
� + �+ �
� + �exp[−(� + �) · t]
(�, �) ={
(�1, 0) t ≤ ti
(�2, �) t > ti
(2)
where �1 is the failure rate of component under standby state, �2 isthe failure rate and � is the repair rate of component in preventivemaintenance, and ti is the time for preventive maintenance.
2.2.3. MODE 3: test – signal flows through subroutine line CThe modeling of a testing activity includes the effects of test
downtimes and test overrides. The opening and closing action of acomponent during testing activity is modeled by type-39 operator(No. 16 operator). If the sub-input signal P1(t) arrives, the operatortakes the opening action. Then the output intensity is calculated by
R(t) = S(t) · {O(t′) + [1 − O(t′)] · P1(t) · PO} (3)
If the sub-input signal P2(t) arrives, closing action is taken. Theoutput intensity becomes
R(t) = S(t) · O(t′) · [1 − P2(t) · Pc] (4)

258 J. Yang et al. / Nuclear Engineering and Design 278 (2014) 255–267
DLY
12
OR
20
Start of component Time delay
Operation
Time period for operation
Standby
Time period for standby
Test
Failure
Maintenance
Repair time
AND
15 17
16
1918
14
Open demand
Open demand
Close demand
Close demand
2
4 5
6 7
8 9 10
13
1
Open demand Close demand
Orange:MODE 3(Test)E 4(
Green:MODE 1(Operation) Magenta:MODE 5(Maintenance)
Line BLine E
Line D
Line CLine A
3
11
g stru
wgibdi
TO
Dark-red:MODBlue:MODE 2(Standby)
Fig. 2. Generalized GO-FLOW modelin
here S(t) is the main input signal, P1(t) is the probability ofenerating the open demand, P2(t) is the probability of generat-
ng the close demand, PO and Pc are probabilities of a componenteing successfully opened and successfully closed upon demandsuring test, and the test override can be also modeled by giv-ng a particular value to Pc. O(t′) is the probability of component
able 1perators in GO-FLOW method.
Symbol Type Meaning S
Type-21operator
Operator for a“Good/Bad”item
Type-22operator
OR gate
Type-23operator
NOT gate
Type-24operator
Differenceoperator
Type-25operator
Signalgenerator
Type-26operator
Operator fornormallyclosed item
Type-27operator
Operator fornormally openitem
Failure)
cture developed for use in living PSA.
in the open state at the time point immediately before timepoint t.
2.2.4. MODE 4: failure – signal flows through subroutine line DFailure means a component is out of service and gives no out-
put. In this respect, type-39 operator (No. 17 operator) is used as a
ymbol Type Meaning
Type-28Operator
Operator for an itemwith delay impact
Type-30operator
AND gate
Type-35operator
Operator for an itemwith aging effect(operating failure)
Type-37operator
Operator for an itemwith aging effect(standby failure)Operator for an item inpreventivemaintenance
Type-38operator
Failure of a item inclosed state
Type-39operator
Operator for an itemwith opening andclosing action
Type-40operator
Phased missionoperator

ing an
sa
R
womttittiP3m((sts
2l
mmd
R
wr
t
R
TR
tt
t
R
Tter
nEduts3
J. Yang et al. / Nuclear Engineer
witch to control output of a component in failure. When it is useds a switch, the expression of type-39 operator becomes
(t) ={
1 P1(t) = 1, P2(t) = 0
0 P1(t) = 0, P2(t) = 1(Pp = 0, PO = 1, Pc = 1) (5)
here Pp is the probability of component being prematurelypened. Pp = 0, Po = 1, Pc = 1 setting in the expression is used forodeling “off–on–off” functional state of a switch represented by
ype-39 operator, P1(t) is the open demand signal used for turningype-39 operator on, and P2(t) is the close demand signal whichs used to turn type-39 operator off. P1(t) = 1, P2(t) = 0 means thatype-39 operator turns on and the signal can be output as usual. Theype-39 operator is normally “on” to represent a component beingn service, e.g. operation and standby. Once the component fails,1(t), P2(t) will change to P1(t) = 0, P2(t) = 1 and the connected type-9 operator is turned off. The type-39 operator in line of failureode is reused for state cutover of a component being in-service
operation and/or standby) and failure. The open demand signalNo. 6 operator) is triggered when components are removed fromervice for failure. The close demand signal (No. 7 operator) meanshe end of failure mode and at the same time indicates a return ofervice.
.2.5. MODE 5: maintenance – signal flows through subroutineine E
With the use of a type-38 operator (No. 18 operator), correctiveaintenance of a component can be implemented in the GO-FLOWodel. Type-38 operator is originally used to model a time depen-
ent valve failure in a closed state by the following formula
(t) = S(t) ·{
1.0 − �
� + �− �
� + �exp[−(� + �)t]
}= S(t) ·
{�
� + �− �
� + �exp[−(� + �)t]
}(6)
here S(t) is the main input signal, � is the failure rate, � is theepair rate, and t stands for time durations.
While the reliability changes of a component in corrective main-enance is exactly given by
(t) = �
� + �{1 − exp[−(� + �)t]} (7)
his equation means that the component is initially in failure state,(t = 0) = 0.0 and then recovers gradually.
Consider that � is the repair rate and � is the failure rate inype-38 operator, then type-38 operator can act as a new operatoro represent the component in corrective maintenance.
Now replace � with �′, and � with �′, then the expression ofype-38 operator becomes
(t) = S(t) ·{
�′
�′ + �′ − �′
�′ + �′ exp[−(�′ + �′)t]}
= S(t) · �
� + �{1 − exp[−(� + �)t]} (8)
his new operator defined from type-38 operator can then be usedo model the corrective maintenance of a component which recov-rs gradually from a completely failed state. The repair time isepresented by No. 8 operator.
In each subroutine line, a type-39 operator is also serially con-ected to control the signal output of different component status.ach type-39 operator in parallel has two sub-inputs, an openemand signal and close demand signal. The open demand signal is
sed to turn on the type-39 operator and the corresponding func-ional state is “on”. The close demand signal turns the componenttatus into “off”. By setting open and close demand signals to type-9 operators in each functional mode unit at different time points,d Design 278 (2014) 255–267 259
the status change is realized. For example, if a component is undertest, the No. 4 operator which is connected to the type-39 operatorin the test line will take an opening action. After that we can give it aclose demand signal to the No. 5 operator to stop the testing activ-ity. When component status changes, e.g. from test to operation,then both type-39 operators in test mode and operation mode takeactions. The turn-off action of type-39 operator in test parallel andturn-on action of type-39 operator in operation parallel should befulfilled by inputting a command signal to No. 5 operator and No. 7operator simultaneously. By this means, the status changes of com-ponent and system are easily realized with the generalized model.
Fig. 3 shows the time dependent output of the generalized GO-FLOW structure in hypothetical scenarios. Component is assumedin initial standby status, which may be also placed in other reason-able status. And the status of component changes over time. Thetrends reflect the reliability/availability characteristics of a compo-nent during status changes. The reliability decreases as a negativeexponential distribution over time due to the deterioration ofcomponent on standby or operation. During the test period, thereliability may continue unchanged. Availability may decrease totest override levels, such as 0.6 or 0.7 as shown in the following fig-ure. Because the average test periods are relatively short, the agingeffect of a component during testing is neglected. The failure modemeans component fails suddenly with probability 0.0. Assume thatevery time the component after repair is “as good as new”. Thisallows that the reliability output of component increases graduallyuntil its sound state accompanying with the repair contributions(preventive maintenance and/or corrective maintenance). The reli-ability changes in agreement with the reliability growth model.
2.3. Living PSA model update on system GO-FLOW model file
Living PSA models are built using the proposed GO-FLOW mod-eling method. The generalized GO-FLOW model is applied to therepresentation of all possible component statuses. In living PSA byGO-FLOW, the system model is initially setup with average assump-tions and values, which need be amended and updated in termsof current plant configuration to convert it into risk monitor PSAmodel. The route for going from Living PSA model to risk moni-tor PSA model can be established through removing these averageassumptions and simplifications, such as specifying which trains ofsystem are standby/running, identifying whether the componentsis out-of-service for maintenance or test, replacing the average ini-tiating event frequencies with individual initiating event, etc. in asystem GO-FLOW model file. The GO-FLOW model file is a trans-lation of the GO-FLOW model. The data in the system model filecontains all possible system operational states and the file itself canbe repeatedly modified for model updating. The GO-FLOW modelfile initially with average assumptions and values is output as theoriginal system model file (also referred to as living PSA model).Every time when performing living PSA updating, a new file thesame as the original system model file will be created for repeateduses. This can be done for a range of plant configuration changesbeing updated by a system model file. A system GO-FLOW modelfile (“*.GFD” file) is shown in Fig. 4.
As shown in Fig. 4, the system model file consists of four sec-tions, which are (i) system logic model, (ii) failure data given tooperators, (iii) definition of time points, and (iv) signals outputby signal generator (type-25 operator). In section (i), system logicmodel is represented by various operators which connect to eachother with unique numbers allocated. As to each operator, the fail-ure data is then given in part (ii). Time points are predefined in
part (iii). The expressions of the signal generated by signal gen-erator in part (iv) range from source signal, trigger signal to timeinterval in response to the different uses of type-25 operators in GO-FLOW model. The signal intensity can be modified by part (iv) to
260 J. Yang et al. / Nuclear Engineering and Design 278 (2014) 255–267
ized G
sam
c
Fig. 3. Time-dependent outputs of general
pecify the standby/operating trains of normally operating systems,nd to change the average initiating event frequencies as well as
aintenance unavailability for system GO-FLOW model updating.Following update of system model, the analysis result for thehanged system configuration can be obtained using a remote pro-
Fig. 4. System GO-FL
O-FLOW model in hypothetical scenarios.
cedure call “a.bat”. the function “a.bat” is developed as an automatictool for GO-FLOW analysis. The function will call GO-FLOW
program to evaluate the system model when it is demanded. Thescheme of system model modification and analysis is shown inFig. 5.OW model file.

J. Yang et al. / Nuclear Engineering and Design 278 (2014) 255–267 261
and a
tasounldTcoabbcbii
3
3
pi
Fig. 5. System model modification
As shown in Fig. 5, the system model files are called directlyo update the analysis results. The system GO-FLOW model filesre located on the left side, whereas system analysis results arehowed to the right of the figure. A new model file same as theriginal system model file is generated every time when systempdate being performed within the risk monitoring system. Theewly modified system model file is generated and presented in the
ower left corner of the figure with parameters modifications. Theata modifications reflect the changes to the system configuration.he modifications to the parameters in the GO-FLOW model file arelassified into three types, which are open and close demand signalf each functional mode, time interval between functional modesnd source signal intensity, respectively. Time interval (1 day, 24 hy default for daily risk monitoring) between functional modes wille given automatically accompanying by the changes to open andlose action of each functional mode. Source signal intensity cane imported from the output of low-level GO-FLOW models or use
nitial settings. The changes to the system configuration are easilynput into the model file for Living PSA update and analysis.
. Development of a risk monitoring system for NPPs
.1. Overview of a risk monitoring system
A risk monitoring system is designed and developed using theroposed GO-FLOW modeling method and online model mod-
fication as well as remote procedure call technique for model
nalysis by a remote procedure call.
re-quantification introduced above. The risk monitoring systemaims at showing the instantaneous risk state based on the actualplant configuration and plant environment at any given time. Twomain application requirements can be satisfied by the proposed riskmonitoring system, which are maintenance planning managementand online risk assessment for NPPs. The risk monitoring system isprimarily used for online risk management by connecting it to theinformation system at NPPs. Plant operators in main control roomcan use the risk monitoring system online to monitor whether theplant is operating under acceptable risk level and pre-evaluate theactions they will take. By this way, the risk monitoring system canbe used for not only informing the operators of the current plantconditions, but also help reducing human errors related to the nextmovements for system plant anomaly handling.
For the maintenance risk management, the safety engineersand maintenance engineers can use the risk monitoring systemto get the risk information of all plant configurations in associa-tion with the maintenance activities. The risk monitoring systemprovides capabilities of offline evaluating a maintenance plan ora test plan in terms of the information of equipments being out-of-service in plan. In addition, we also extended the application ofplant configuration from offline to online by connecting it to a con-dition monitoring system/fault diagnose system within an operator
support system. This phase is particularly designed to assess theinstantaneous risk impact of the actually on-going maintenanceactivities each day when unplanned emergency situations com-ing forth, i.e. unexpected running components being out-of-service.
2 ing an
TttoTtpcmsttbuipnt
3
drmlcstsbsruTs
3
auo(ccmifMafle
pLwtwwmmasoim
62 J. Yang et al. / Nuclear Engineer
he real-time information about the systems and components sta-us detected and diagnosed by the operator support system are sento the risk monitoring system through the data interface to alertperators the unexpected components status or faulty phenomena.he input information needs be confirmed by operators first beforehey are written to maintenance worksheets to update to the actuallant configurations. The risk monitoring system will then take theurrent plant information to update and calculate the Living PSAodels for online risk monitoring. The risk monitoring system also
hows a rough guide for risk management during the online main-enance at NPPs by using a risk matrix. If the risk increase level forhe configuration is unacceptable, then equipment outages shoulde re-arranged and some measures should be taken to relieve thenderlying consequences until the risk is sufficiently low. The facil-
ties of risk management can increase the risk awareness of plantersonnel, provide more rigorous planning and control of mainte-ance activities, and remind operators to take measures to controlhe magnitude as well as duration of the risk.
.2. Framework of a risk monitoring system by GO-FLOW method
At present, the risk monitoring system is connected to a con-ition monitoring system and a fault diagnosis system whicheceive data from a simulator of NPPs. As shown in Fig. 6, the riskonitoring system that the authors have been engaging by uti-
izing GO-FLOW is designed to receive the information on plantonfiguration changes resulting from operator interventions onystem, maintenance plans or condition monitoring system, andhen update the GO-FLOW model with online modification to theystem GO-FLOW model file and perform the GO-FLOW analysisy a remote procedure call, and display risk values graphically. Thepecific procedures for risk management at NPPs by this proposedisk monitoring system are (i) GO-FLOW modeling, (ii) GO-FLOWpdating, (iii) GO-FLOW analysis and (iv) risk information display.he methods employed in those four items are described in theubsequent part of this Section.
.2.1. GO-FLOW modelingThe GO-FLOW model is constructed using the proposed gener-
lized GO-FLOW modeling method to make it easy for Living PSApdate. The GO-FLOW model can be either generated from the toolf GO-FLOW modeling or converted from multi-level flow modelsMFM) which are graphical models of goals and functions of pro-ess systems (Lind, 1994, 2011). Compared to the system GO-FLOWhart modeled by the tool of GO-FLOW modeling, the GO-FLOWodels that are converted from MFM are of higher understandabil-
ty with multiple levels of means-end and whole-part hierarchyor the system configuration. The software tool of mapping the
FM models into GO-FLOW models has been developed by theuthors and a reliability analysis program based on the multilevelow models is under development (Ming and Zhijian, 2011; Mingt al., 2008).
The proposed generalized GO-FLOW structure can represent allossible functional modes of a single physical component. And theiving PSA by GO-FLOW modularization method is easy to performith the online model modification as well as remote procedure call
echnique for model re-quantification. But it is also coming alongith a problem, that is, the GO-FLOW model to the target systemill become complex when all possible functional modes of equip-ents are fully included in the model. That makes the GO-FLOWodel difficult to read from the physical layout of system, of which
lso makes the advantage of GO-FLOW chart being easy to con-
truct and validate lost. Therefore, hierarchy and modularizationf the modeling step seems very desirable in GO-FLOW model-ng process for it can not only enhance the readability of systemodel but also can make a rapid calculation on system GO-FLOW
d Design 278 (2014) 255–267
model. The complex system structure is first decomposed into mul-tiple layers of interrelated functional modules by means-end andwhole-part hierarchical analysis. Then the proposed GO-FLOWmethod is applied for Living PSA modeling of each functional mod-ule. In such way, the size of system GO-FLOW model resulted fromhierarchical analysis will be relatively small and at the same timeit is helpful to know about the realization of each functional mod-ule within a complex system. The system GO-FLOW analysis canbe also easily performed by linking all functional modules in dif-ferent abstraction levels together through data interface amongcorresponding GO-FLOW model files.
3.2.2. GO-FLOW updatingAs changes occur to plant configuration, the corresponding Liv-
ing PSA models must be updated and recalculated to reflect theactual risk level of the current plant configuration. Since the com-ponent functional mode represented by the proposed GO-FLOWmodel structure is in one-to-one correspondence with the sig-nal number in system GO-FLOW model file, the model file can beused for online update of Living PSA model. The equipment statuschanges and system configuration changes can be easily achievedwith online modification to the signal information of the systemmodel file instead of manual operations on the tool of GO-FLOWmodeling. In the risk monitoring system, a database is developedto link the tool of risk monitoring system with the Living PSA mod-els. Living PSA models (GO-FLOW model files) and the data usedfor Living PSA analyses are stored in the database of risk monitor-ing system. The signal data of the model file are interpreted andaccessed by a number of equipment information tables within therisk monitoring system. When the tool of the risk monitoring sys-tem is connected online, changes to the plant configuration thatare captured by the information system will be firstly input to thedatabase. Then the changes are automatically written into the sys-tem model files via the databases to complete the model update.The model files can also be updated manually by safety engineersfor offline uses.
3.2.3. GO-FLOW analysisIn the risk monitoring system, GO-FLOW analysis will involve
the activities of system reliability analysis and risk assessment. TheGO-FLOW analysis is performed automatically through a remoteprocedure call in system reliability analysis. As for risk assessment,an accident sequence model is first represented by a GO-FLOWchart. The GO-FLOW model is the logical equivalent to a dynamicevent tree which is conventionally used for accident sequence anal-ysis. The safety systems which are required to operate to prevent orlimit core damage are considered as basic heading events appear-ing in the sequence model. System failure analysis results fromGO-FLOW can be directly linked to the headings in the sequencemodel. Then the sequence model GO-FLOW chart is analyzed to getthe quantitative risk level. In this designed risk monitoring system,core damage frequency (CDF) will be taken as a quantitative riskmeasure.
3.2.4. Risk information displayThe risk information obtained by GO-FLOW analysis will be
entered into the interface of the risk monitoring system as a curveor in the form of colored displays that give the user a clear visual
indication of the level of risk. The safety margins and risk bands areemployed to heighten the awareness of plant personnel as well asresulting in corresponding actions involvement during plant oper-ation or maintenance activities.
J. Yang et al. / Nuclear Engineering and Design 278 (2014) 255–267 263
System ReliabilityAnalysis
RiskAssessment
GO-FLOWModel(model file *.GFD)
Update ofGO-FLOW Model
SafetyEngineers
Make maintenanceplans
Equipments inservice
UnplannedEquipmentsOut-of-Service
Equipments inMaintenance
Equipments in test
Equipmentsstandby
In Service
Out-of-Service
offline
maintenance
testing
online
maintenance
SystemConfigurationChanges
EquipmentsStatus
Make testingplans
Operators
Take actions
InstantaneousFault
Condition Monitoring/Fault Diagnosis System(G2 Expert System)
Tool ofGO-FLOW Modeling(GO-FLOW Program)
riskmonitoring
riskmonitoring
risk monitoring
RiskMonitoring
User Interface
SystemReliabilityMonitoring
RiskMatrix
datatrans fer
d atatrans fer
Model construction
Modeling Tool ofMulti-level Flow
Model
Modelconversion
itorin
4
ammmsfs
4
saaa
lsspTWtmpsiutoaeTtA
Fig. 6. Configuration of risk mon
. Functions of the risk monitoring system tool
To allow the risk monitoring system to be used by plant oper-tors and safety engineers in the day-to-day management andaintenance schedules, a user-friendly interface with risk manage-ent tool is provided. The user interface was created for the riskonitoring system with a wide range of functional modules, e.g.
ub-system for maintenance planning management, sub-systemor reliability monitoring, sub-system for risk monitoring, sub-ystem for information inquiry and statistics, etc.
.1. Sub-system for reliability monitoring
The sub-system for reliability monitoring is shown in Fig. 7. Thecreen of user-interface is designed into five functional areas, whichre equipment information table area, system configuration displayrea, system reliability display area, faulty message receiving areand functional operation area.
System reliability display area. In Fig. 7, the time history of calcu-ated reliability results of safety systems is shown as a curve formo that plant personnel could be clearly aware of the instantaneousystem safety state based on the actual plant configuration andlant environment at any time of plant operation and maintenance.he whole display region of this area is laid out on a grid pattern.here numeric on the vertical axis indicates system reliability and
ime frame is marked by the horizontal axis. The horizontal line isapped into 31 intervals which represent 31 time points. The time
oint could be one day of a month, or being only an expression ofystem operational sequence. When there are alterations occurringn component status or system configuration, the curve will floatp and down on the corresponding grid of the time frame to reflecthe particular system reliability value fluctuations. The high levelf risk may arise either from inappropriate maintenance plan ornomaly operations on equipments. In such case, operators/safety
ngineers need to first check the current system configuration.hey have to find out if there is a fault in equipment from the sys-em configuration display area and fault message receiving area.fter confirmation, operators can take measures, e.g. re-arrangingg system by GO-FLOW method.
the maintenance schedules or re-configuring the system layout, toavoid the high plant risk in terms of the curve tendency.
System configuration display area. This area is used to displaythe system configuration with combined indication of equipmentsstatus. The equipment status is shown in a form of graph to helpsafety engineers/operators to easily identify. The tool reads theinformation of equipment status coming from the condition mon-itoring system or maintenance schedule file, and automaticallygenerates the system configuration with the detailed equipmentsstatus, e.g. in-service or out-of-service in each day of a month witha graphical representation. In this area, the in-service equipmentis shown in green color. The equipments in standby state are inblue. The equipment under test is shown in orange. The plannedout-of-service equipment in maintenance is in magenta. As tothe unplanned equipment out-of-service detected by conditionmonitoring system, the red color is used. The width of the graphindicates the mean time to repair of the equipment.
Equipment information table area. This area shows the equip-ments information of system in a table form. An enlarged pictureof equipment information table is shown in Fig. 8.
The table contains the equipment ID, equipment name, equip-ment status, start time and end time for each equipment functionalmode, corresponding signal numbers to the functional modes inGO-FLOW model, etc. By double clicking the status column, theoperator can select the current equipment status from the pull-down menu of status modes. These status modes are predefined andrepresented by a proposed generalized GO-FLOW model structure.The time interval for each functional mode is fixed with the settingsof start time and end time in line with the predefined maintenanceplans. By online configuring the equipment status and correspond-ing time interval, the equipment status alternations will be firstwritten into database. Then database links the information to thesystem GO-FLOW model file to complete model update. While inthe process of databases development for risk monitoring system,
the system model file together with the system in the database forsystem configuration management must be of the same name toensure that the right system model is checked and modified. Theupdate of system configuration is completed with colored displays.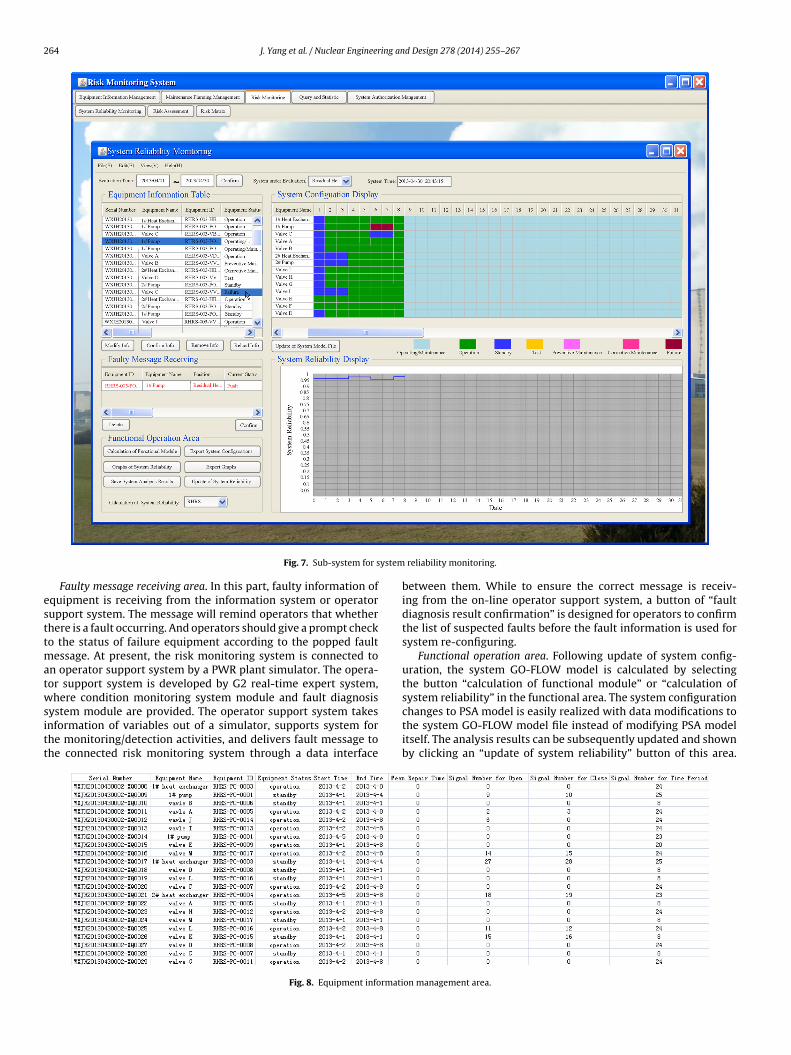
264 J. Yang et al. / Nuclear Engineering and Design 278 (2014) 255–267
ystem
esttmatwsitt
Fig. 7. Sub-system for s
Faulty message receiving area. In this part, faulty information ofquipment is receiving from the information system or operatorupport system. The message will remind operators that whetherhere is a fault occurring. And operators should give a prompt checko the status of failure equipment according to the popped fault
essage. At present, the risk monitoring system is connected ton operator support system by a PWR plant simulator. The opera-or support system is developed by G2 real-time expert system,here condition monitoring system module and fault diagnosis
ystem module are provided. The operator support system takesnformation of variables out of a simulator, supports system forhe monitoring/detection activities, and delivers fault message tohe connected risk monitoring system through a data interface
Fig. 8. Equipment informati
reliability monitoring.
between them. While to ensure the correct message is receiv-ing from the on-line operator support system, a button of “faultdiagnosis result confirmation” is designed for operators to confirmthe list of suspected faults before the fault information is used forsystem re-configuring.
Functional operation area. Following update of system config-uration, the system GO-FLOW model is calculated by selectingthe button “calculation of functional module” or “calculation ofsystem reliability” in the functional area. The system configuration
changes to PSA model is easily realized with data modifications tothe system GO-FLOW model file instead of modifying PSA modelitself. The analysis results can be subsequently updated and shownby clicking an “update of system reliability” button of this area.on management area.

J. Yang et al. / Nuclear Engineering and Design 278 (2014) 255–267 265
Fig. 9. GO-FLOW chart for accident sequence analysis.
Fig. 10. Sub-system for risk monitoring.

266 J. Yang et al. / Nuclear Engineering and Design 278 (2014) 255–267
g of s
Mssr
4
ouTivttercdGtfotmao
i
C
wfapaa
isnig
Fig. 11. Risk rankin
oreover, some additional functional operations such as “exportystem configurations”, “graphs of system reliability”, and “saveystem analysis results” are also designed to facilitate systemeliability monitoring.
.2. Sub-system for risk monitoring
The risk monitoring system is designed to support a wide rangef functions including measures of risk. The risk monitoring systemses core damage frequency (CDF) for quantitative risk measures.he calculation of Living PSA is performed to provide the numer-cal estimate of CDF for risk monitoring. In order to calculate thealue of CDF, accident sequence analysis model is developed toreat dynamic operational phenomena of an initiating event withime progresses. Accident sequences analysis is usually done byvent tree. While in this study accident sequences model is rep-esented by a GO-FLOW chart, as shown in Fig. 9. The GO-FLOWhart is logical equivalent to a dynamical event tree used for acci-ent sequences analysis. System reliability analysis results by theO-FLOW can be directly read as input data for the headings in
he event tree. The headings in the event tree usually refers tounction events such as the safety functions performed for eachf groups of initiating events or the safety systems in performinghese safety functions. The dynamic event tree based on GO-FLOW
odel also provides facilities for re-arrangement of heading order,nd to obtain both the success and failure occurrence probabilitiesf event sequences at all time points by one computer run.
The core damage frequency (CDF) is calculated with the follow-ng formula based on accident sequence analysis.
DF =n∑
i=1
P(Ii) ·Kj∑
j=1
P
(Sij
Ii
)(9)
here Ii represents initiating event group i, P(Ii) is the occurrencerequency of each initiating event group, Kj means contribution ofccident sequence j to CDF from initiating event group Ii, Sij is theossible accident sequences that will contribute to CDF from initi-ting event group Ii, and P(Sij/Ii) is the probability of occurrence ofccident sequences from initiating event group Ii.
Fig. 10 shows the user-interface of sub-system for risk monitor-ng. Where links between system reliability analysis and accident
equence analysis model are established in a table form with uniqueumbering identification of each front-line system on it. The risknformation is displayed in a curve with three-color bands back-round indicating different risk levels. The boundaries between
ystem equipments.
these risk bands are predefined according to the operational safetycriteria and plant specific risk level. In risk management, the riskacceptance guidelines are essential. There are two kinds of riskmeasures used in measuring plant risk level: the instantaneous riskof core damage frequency (CDF), and the incremental conditionalcore damage probability (ICCDP). CDF is used for risk measuring inthe risk monitoring system developed. According to the RegulatoryGuide 1.174(RG1.174) (NRC, 2002) developed by U.S. Nuclear Reg-ulatory Commission, the risk level is divided into three areas withthe CDF, and with three kinds of color bands to identify it. Rules forrisk levels partition are listed below.
Red: CDFins > 1.0E−4/yearYellow: 1.0E−4/year ≥ CDFins ≥ 1.0E−5/yearGreen: CDFins < 1.0E−5/year
The red region indicates a high and unacceptable risk level.Hence, immediate action need be taken to lower the risk level to anormal state. The yellow band means that risk level is moderate andacceptable so no compensatory measures are required. When therisk curve lies in the green band, it means the system is normallyand safely operated.
4.3. Risk matrix
A risk matrix is a table sheet developed, for the safety engineerswith the purpose of providing a rough guide for the risk manage-ment in making of the long-term maintenance plans, and for theoperators with the purpose of providing an outlook of the weaknessin plant operation.
Risk matrix in Fig. 11 provides a general viewpoint of impor-tance ranking of equipments in a safety system at NPPs based onrisk assessment. The magnitude and rating of a given risk is estab-lished using a two-dimensional grid, with each axis representingthe equipments that will be involved in the periodic and preventivemaintenance activities or in fault status. The number of trains of asystem is plant specific. The risk matrix uses the incremental condi-tional core damage probability (ICCDP) to measure the risk level ofsystem configuration. According to the NUMARC 93-01 (NEI, 2000)developed by the Nuclear Energy Institute (NEI), in risk matrix therisk level of system configuration is divided into four levels with
ICCDP. Four colors are assigned to each crossing cell to identifythe risk level of system with the combined unavailability of equip-ments in corresponding trains. The risk insights provided are alsotaken into consideration for prioritizing compensatory measures.
ing an
BrttvccTt
5
gfbFmm
iscoorun
A
oPi
R
A
B
Shepherd, C., Evans, M., Boneham, P., 2004. RISK MONITORS—The State of the Art in
J. Yang et al. / Nuclear Engineer
lack indicates that the system configuration is in violation of theequirements of technical specifications. Red in the matrix showshe high risk level of system, which means the equipments listed inhe row headings and column headings cannot be taken out of ser-ice at the same time. Yellow represents medium risk level. In thease, the maintenance activities of related equipments need to bearried out quickly to reduce the risk. And green is for low risk level.hat means equipments on the two trains can be simultaneouslyaken out of service within certain allowed outage time.
. Conclusions
In this paper, a Living PSA method is developed based on aeneralized GO-FLOW modeling structure, where all the necessaryunctional modes of the component comprising a whole system cane taken into account. Living PSA by the proposed structure of GO-LOW modeling is easily updated and performed with the onlineodel modification as well as remote procedure call technique forodel re-quantification.On the basis of the presented method for living PSA, a risk mon-
toring system is also developed in this paper. The risk monitoringystem is developed to receive information on plant configurationhanges either from equipment failures, operator interventions,r maintenance activities, then update the Living PSA model withnline modification to the system GO-FLOW model file, and displayisk information graphically. The risk monitoring system can besed to assist safety engineers and plant operators in their mainte-ance management and daily operation risk management at NPPs.
cknowledgments
The authors appreciate the financial support from “111” Projectn Nuclear Power Safety and Simulation (Grant No. b08047) androf. Takeshi Matsuoka of Utsunomiya University for his kind helpn this study.
eferences
hn, S.K., Kim, I.S., Oh, K.M., 2010. Deterministic and risk-informed approaches forsafety analysis of advanced reactors: Part II. Risk-informed approaches. Reliab.Eng. Syst. Saf. 95, 459–468.
alfanz, H.P., Virolainen, R.K., 1999. State of Living PSA and Future Development,NEA/CSNI/R(99)15.
d Design 278 (2014) 255–267 267
Cepin, M., Mavko, B., 2002. A dynamic fault tree. Reliab. Eng. Syst. Saf. 75, 83–91.Gomez Cobo, A., 1999. Living Probabilistic Safety Assessment (LPSA). IAEA-TECDOC-
1106.Gomez Cobo, A., 2001. Applications of Probabilistic Safety Assessment (PSA) for
Nuclear Power Plants. IAEA-TECDOC-1200.Hahn, L., Requssard, J., 2008. Probabilistic safety assessment. In: EUROSAFE Tribune.Johanson, G., Holmberg, J. (Eds.), 1994. Safety Evaluation by Living Probabilistic
Safety Assessment. Swedish Nuclear Power Inspectorate, Stockholm, SKI Report94:2.
Kafka, P., 1992. Living PSA-Risk Monitor: Current Developments. InternationalAtomic Energy Agency TCM, Budapest, IAEA-TECDOC-737.
Lind, M., 1994. Modeling goals and functions of complex industrial plants. Appl. Artif.Intell. 18 (2), 259–283.
Lind, M., 2011. An introduction to multilevel flow modeling. Nucl. Saf. Simul. 2 (1),22–32.
Matsuoka, T., 1986. FFTA: a fast tree analysis program. Nucl. Eng. Des. 91, 93–101.Matsuoka, T., 2010a. Method for solving logical loops in system reliability analysis.
Nucl. Saf. Simul. 1 (4), 328–339.Matsuoka, T., 2010b. GO-FLOW methodology—basic concept and integrated analysis
framework for its applications. Nucl. Saf. Simul. 1 (3), 198–206.Matsuoka, T., Kobayashi, M., 1988. GO-FLOW: a new reliability analysis methodol-
ogy. Nucl. Sci. Eng. 98 (1), 64–78.Matsuoka, T., Kobayashi, M., 1989a. A phased mission analysis by the GO-FLOW
methodology. In: Proc. Int. ANS/ENS Tropical Meeting Probability, Reliabilityand Safety Assessment, Pittsburgh, USA.
Matsuoka, T., Kobayashi, M., 1989b. GO-FLOW methodology: a reliability analy-sis of the emergency core cooling system of a marine reactor under accidentconditions. Nucl. Technol. 84 (3), 285–295.
Matsuoka, T., Kobayashi, M., 1997. The GO-FLOW reliability analysismethodology—analysis of common cause failures with uncertainty. Nucl.Eng. Des. 175, 205–214.
Ming, Y., Zhijian, Z., 2011. Study on quantitative reliability analysis by multilevelflow models for nuclear power plants. Nucl. Power Eng. 32 (4), 72–76.
Ming, Y., Zhijian, Z., Minjun, P., Shengyuan, Y., 2008. Design and development of areliability analysis tool based on multilevel flow models. In: Proceedings of 16thInternational Conference on Nuclear Engineering, Orlando, Florida.
NEI, 2000. Industry Guideline for Monitoring the Effectiveness of Maintenance atNuclear Power Plants. NUMARC 93-01, Revision 3.
Nelson, W.R., Novack, S.D., 2003. Real-Time Risk and Fault Management in the Mis-sion Evalution Room for the International Space Station, INEEL/EXT-03-00661.
NRC, 2002. An Approach for using Probabilistic Risk Assessment in Risk-InformedDecision on Plant-Specific Changes to the Licensing Basis. Regulatory Guide1.174, Revision 1, U.S.
Okazaki, T., Mitomo, N., Matsuoka, T., 2006. The use of the GO-FLOW methodology toinvestigate the aging effects in nuclear power plants. In: Proceedings of PSAM-8:International Conference on Probabilistic Safety Assessment and Management,New Orleans, Louisiana, USA.
Ren, Y., Dugan, J.B., 1998. Optimal design of reliable systems using static and dynamicfault trees. IEEE Trans. Reliab., 234–244.
their Development and Use at Nuclear Power Plants, NEA/CSNI/R(2004)20.Walker, M., Papadopoulos, Y., 2008. Qualitative temporal analysis: towards a
full implementation of the fault tree handbook. Control Eng. Pract. 17,1115–1125.