Embed Size (px)
Citation preview
Ple
ase
note
that
this
is a
n au
thor
-pro
duce
d P
DF
of a
n ar
ticle
acc
epte
d fo
r pub
licat
ion
follo
win
g pe
er re
view
. The
def
initi
ve p
ublis
her-a
uthe
ntic
ated
ver
sion
is a
vaila
ble
on th
e pu
blis
her W
eb s
ite
1
Composites Science and Technology March 2005; 65(3-4) : 359-368 http://dx.doi.org/10.1016/j.compscitech.2004.09.008© 2004 Elsevier Ltd All rights reserved
Archimer http://www.ifremer.fr/docelec/Archive Institutionnelle de l’Ifremer
Development of an improved adhesive test method for composite
assembly design
J.Y. Cognarda,b*, P. Daviesc, B. Ginested and L. Sohierd aLaboratoire de Mécanique des Structures Navales – ENSIETA, 2 rue F. Verny, 29806 Brest Cedex 09, France bE.N.S. de Cachan, Antenne de Bretagne, campus de Ker Lann, 35170 BRUZ, France cService Matériaux et Structures, IFREMER Centre de Brest, 29280 Plouzané, France dLaboratoire de Rhéologie et de Mécanique des Structures Université de Bretagne Occidentale–29285 BREST Cedex, France *: Corresponding author : [email protected]
Abstract: This study is concerned with improving performance of composite structures through the use of adhesive bonding, particularly for marine and underwater applications. Some preliminary results from tests on simple composite/composite assemblies are given first. Difficulty in modelling the failure of even these simple joints highlighted the need for more reliable constituent input data. The first objective was to define an experimental methodology enabling the adhesives of interest to be characterised up to failure. A metal–metal assembly was considered, in order to concentrate on the analysis of the behaviour of thin adhesive films. The aims were to characterise the adhesive, analyse its non-linear behaviour, and study the influence of parameters such as film thickness and manufacturing conditions. In order to be able to study the behaviour of the adhesive as a function of the normal stress component, an important parameter, a modified Arcan fixture has been developed, which enables compression or tension to be combined with shear loads. First results from this fixture are presented, together with analysis of sources of scatter in results. Keywords: Adhesion; C. Finite element analysis
− 2 −
1 - INTRODUCTION
Polymer matrix composites are widely used in marine structures. Assembly by adhesive bonding offers many advantages and major aerospace projects have addressed its use in aircraft structures, but a lack of confidence currently limits the marine use of this technology. If applications are to be extended it must be clearly demonstrated that the strength of adhesively bonded structures can be predicted accurately. There are several approaches to the strength analysis of bonded joints [1,2]. Conventional stress analysis may be applied, using closed form solutions when available or more generally by methods such as finite element analysis [3]. These are complicated by stress singularities, at the end of overlaps for example, but average stresses and strains can be compared to traditional stress or strain based failure criteria. Alternatively fracture mechanics analysis may be used if the presence of a defect is considered [4,5], or damage mechanics if damage zones develop [6]. The latter may be better suited to analysis of composite substrates than stress analyses. Cohesive damage zone models are also attracting much attention at present [7-9]. The method used will depend on the behaviour of the adhesive and the substrates, and the different approaches will often be complementary rather than competing. Essential to all the models is detailed knowledge of the adhesive behaviour.
In the present paper some typical results from tests on simple lap shear composite assemblies will be presented first. These illustrate some of the difficulties associated with the analysis of adhesively bonded composites. The main part of the paper is then concerned with the development of a test method to obtain reliable data to characterise the adhesive response under a wide range of loading. Numerical analyses and test design are described. The manufacture of a test fixture then enabled first experimental results to be obtained and sources of errors in the measurements are discussed. This work is part of an ongoing project aimed at developing design tools for adhesively bonded marine structures. 2 - COMPOSITE ASSEMBLIES
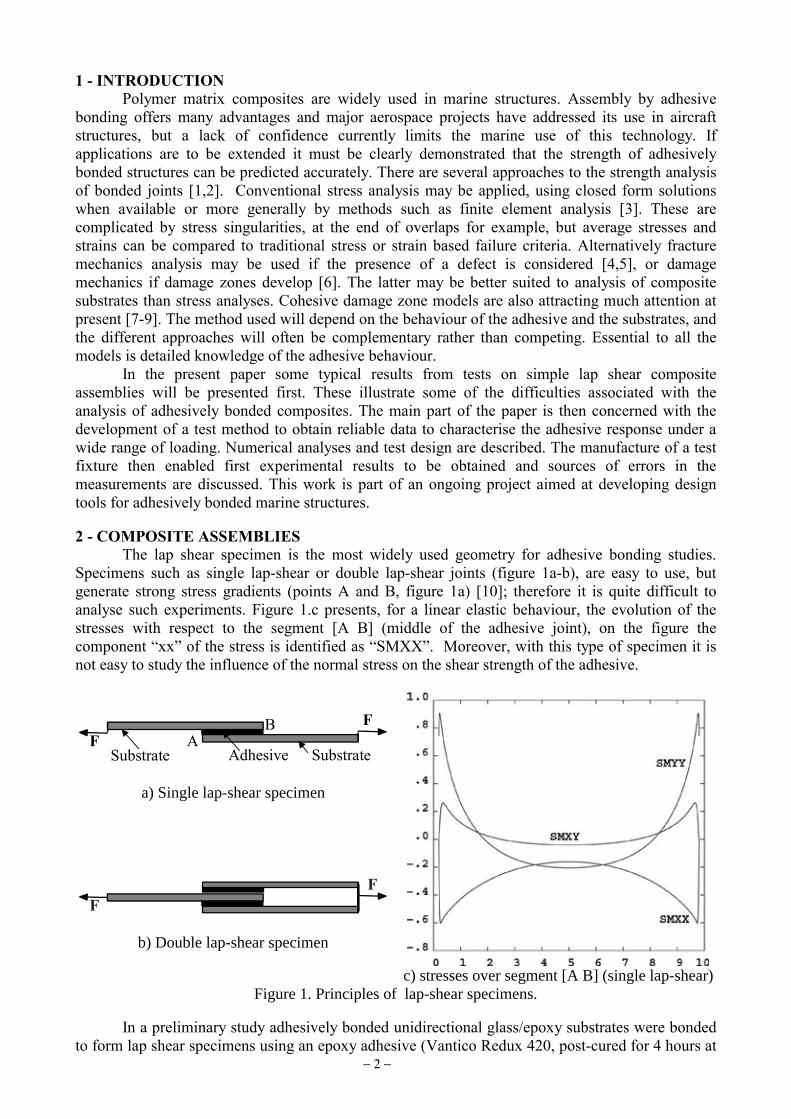
The lap shear specimen is the most widely used geometry for adhesive bonding studies. Specimens such as single lap-shear or double lap-shear joints (figure 1a-b), are easy to use, but generate strong stress gradients (points A and B, figure 1a) [10]; therefore it is quite difficult to analyse such experiments. Figure 1.c presents, for a linear elastic behaviour, the evolution of the stresses with respect to the segment [A B] (middle of the adhesive joint), on the figure the component “xx” of the stress is identified as “SMXX”. Moreover, with this type of specimen it is not easy to study the influence of the normal stress on the shear strength of the adhesive.
Substrate Adhesive
BF
SubstrateA
F
a) Single lap-shear specimen
FF
b) Double lap-shear specimen
c) stresses over segment [A B] (single lap-shear)
Figure 1. Principles of lap-shear specimens.
In a preliminary study adhesively bonded unidirectional glass/epoxy substrates were bonded to form lap shear specimens using an epoxy adhesive (Vantico Redux 420, post-cured for 4 hours at
− 3 −
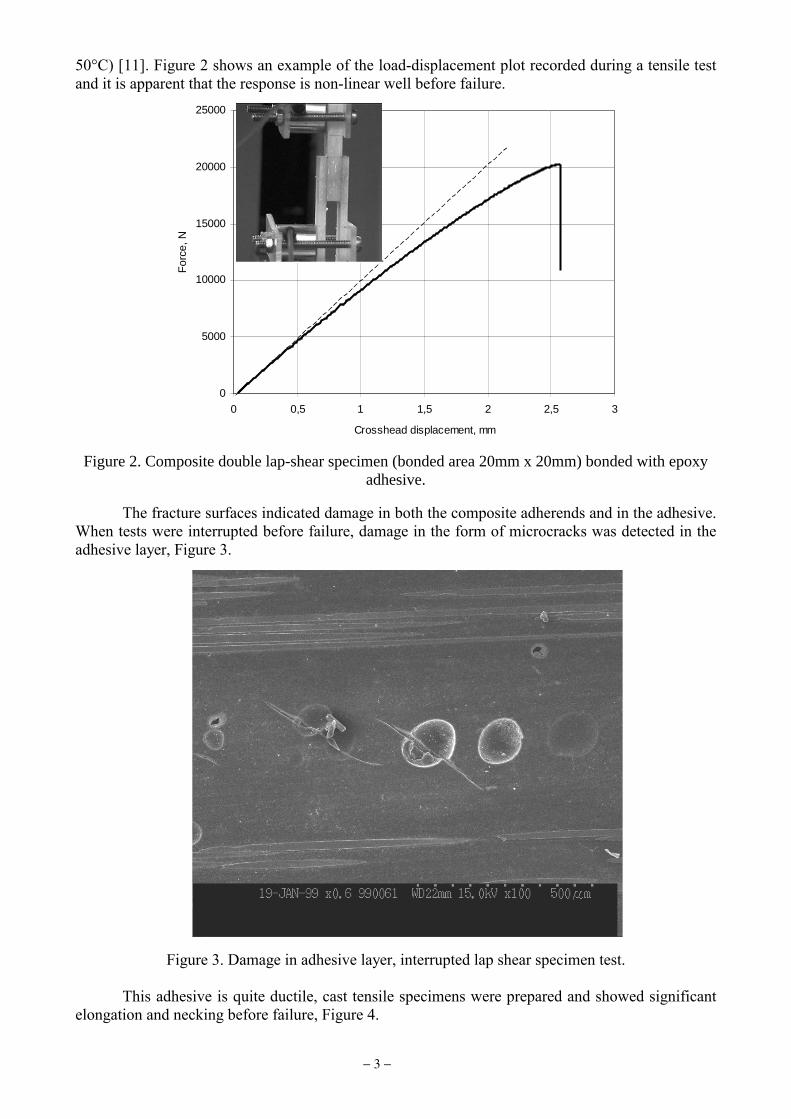
50°C) [11]. Figure 2 shows an example of the load-displacement plot recorded during a tensile test and it is apparent that the response is non-linear well before failure.
0
5000
10000
15000
20000
25000
0 0,5 1 1,5 2 2,5 3
Crosshead displacement, mm
For
ce, N
Figure 2. Composite double lap-shear specimen (bonded area 20mm x 20mm) bonded with epoxy
adhesive.
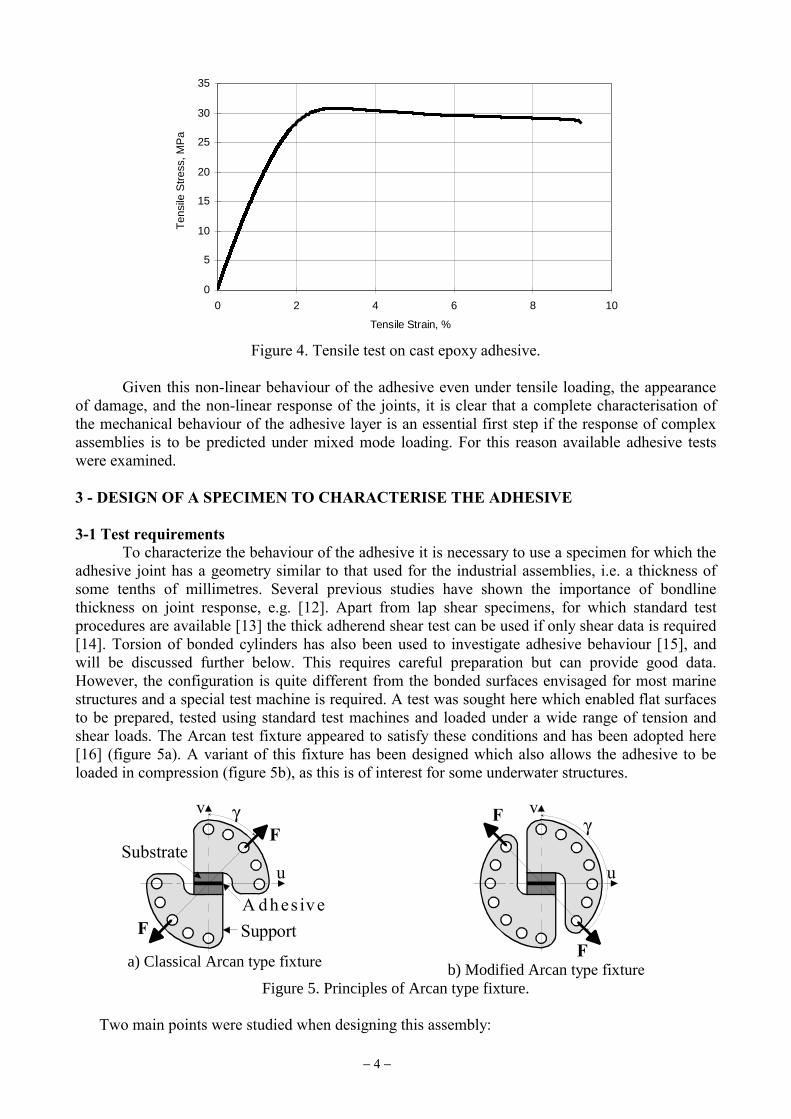
The fracture surfaces indicated damage in both the composite adherends and in the adhesive. When tests were interrupted before failure, damage in the form of microcracks was detected in the adhesive layer, Figure 3.
Figure 3. Damage in adhesive layer, interrupted lap shear specimen test.
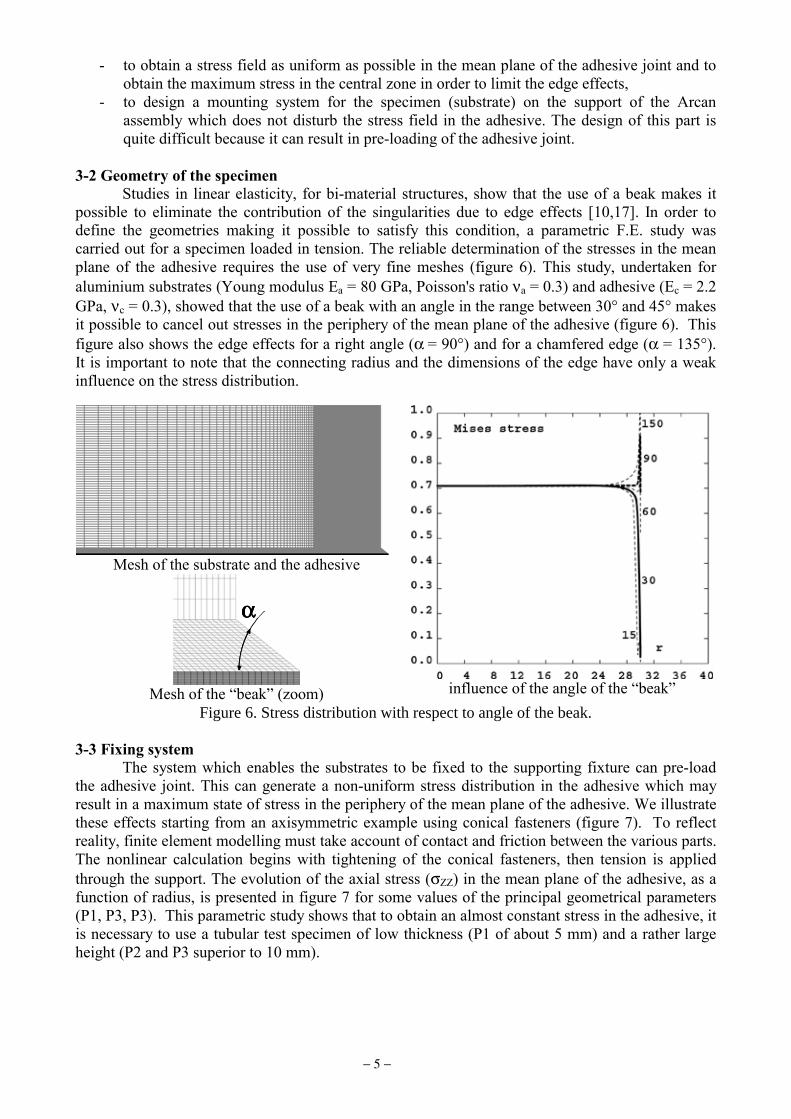
This adhesive is quite ductile, cast tensile specimens were prepared and showed significant
elongation and necking before failure, Figure 4.
− 4 −
0
5
10
15
20
25
30
35
0 2 4 6 8 10
Tensile Strain, %
Ten
sile
Str
ess,
MP
a
Figure 4. Tensile test on cast epoxy adhesive.
Given this non-linear behaviour of the adhesive even under tensile loading, the appearance
of damage, and the non-linear response of the joints, it is clear that a complete characterisation of the mechanical behaviour of the adhesive layer is an essential first step if the response of complex assemblies is to be predicted under mixed mode loading. For this reason available adhesive tests were examined. 3 - DESIGN OF A SPECIMEN TO CHARACTERISE THE ADHESIVE 3-1 Test requirements
To characterize the behaviour of the adhesive it is necessary to use a specimen for which the adhesive joint has a geometry similar to that used for the industrial assemblies, i.e. a thickness of some tenths of millimetres. Several previous studies have shown the importance of bondline thickness on joint response, e.g. [12]. Apart from lap shear specimens, for which standard test procedures are available [13] the thick adherend shear test can be used if only shear data is required [14]. Torsion of bonded cylinders has also been used to investigate adhesive behaviour [15], and will be discussed further below. This requires careful preparation but can provide good data. However, the configuration is quite different from the bonded surfaces envisaged for most marine structures and a special test machine is required. A test was sought here which enabled flat surfaces to be prepared, tested using standard test machines and loaded under a wide range of tension and shear loads. The Arcan test fixture appeared to satisfy these conditions and has been adopted here [16] (figure 5a). A variant of this fixture has been designed which also allows the adhesive to be loaded in compression (figure 5b), as this is of interest for some underwater structures.
SupportA dhes ive
u
v γ
SubstrateF
F
a) Classical Arcan type fixture
u
v
F
γF
b) Modified Arcan type fixture
Figure 5. Principles of Arcan type fixture.
Two main points were studied when designing this assembly:
− 5 −
- to obtain a stress field as uniform as possible in the mean plane of the adhesive joint and to obtain the maximum stress in the central zone in order to limit the edge effects,
- to design a mounting system for the specimen (substrate) on the support of the Arcan assembly which does not disturb the stress field in the adhesive. The design of this part is quite difficult because it can result in pre-loading of the adhesive joint.
3-2 Geometry of the specimen
Studies in linear elasticity, for bi-material structures, show that the use of a beak makes it possible to eliminate the contribution of the singularities due to edge effects [10,17]. In order to define the geometries making it possible to satisfy this condition, a parametric F.E. study was carried out for a specimen loaded in tension. The reliable determination of the stresses in the mean plane of the adhesive requires the use of very fine meshes (figure 6). This study, undertaken for aluminium substrates (Young modulus Ea = 80 GPa, Poisson's ratio νa = 0.3) and adhesive (Ec = 2.2 GPa, νc = 0.3), showed that the use of a beak with an angle in the range between 30° and 45° makes it possible to cancel out stresses in the periphery of the mean plane of the adhesive (figure 6). This figure also shows the edge effects for a right angle (α = 90°) and for a chamfered edge (α = 135°). It is important to note that the connecting radius and the dimensions of the edge have only a weak influence on the stress distribution.
Mesh of the substrate and the adhesive
αααα
Mesh of the “beak” (zoom)
influence of the angle of the “beak”
Figure 6. Stress distribution with respect to angle of the beak. 3-3 Fixing system
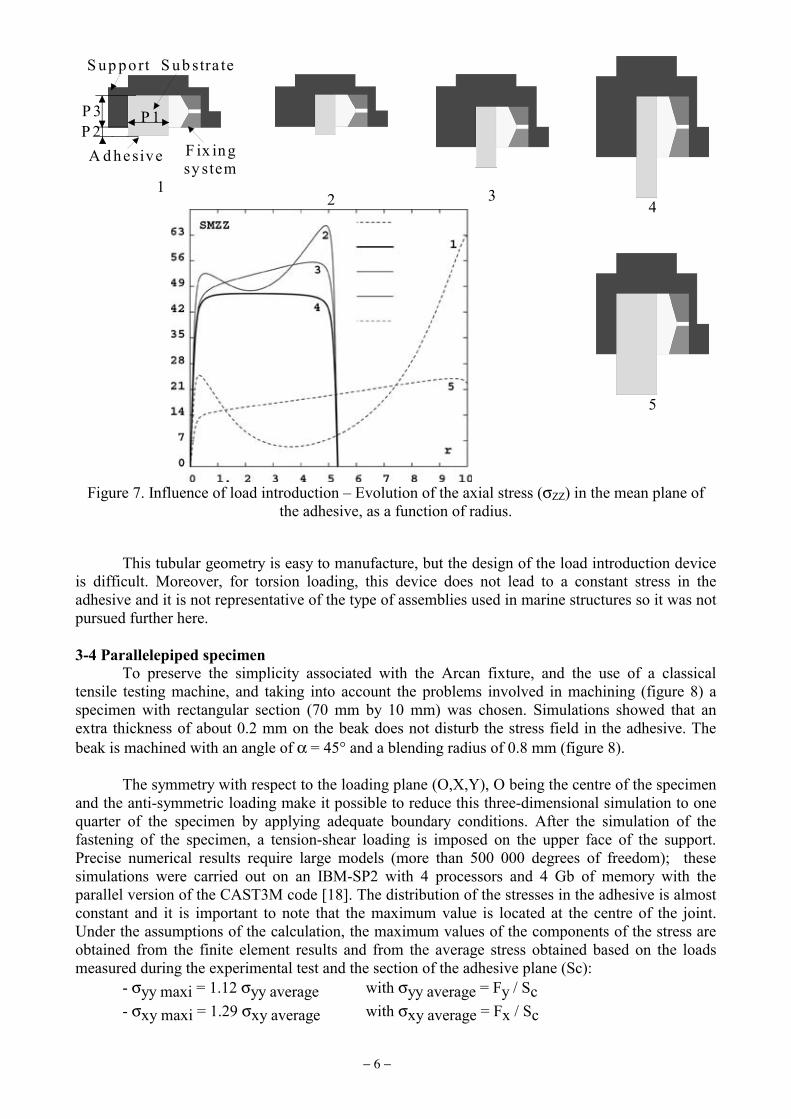
The system which enables the substrates to be fixed to the supporting fixture can pre-load the adhesive joint. This can generate a non-uniform stress distribution in the adhesive which may result in a maximum state of stress in the periphery of the mean plane of the adhesive. We illustrate these effects starting from an axisymmetric example using conical fasteners (figure 7). To reflect reality, finite element modelling must take account of contact and friction between the various parts. The nonlinear calculation begins with tightening of the conical fasteners, then tension is applied through the support. The evolution of the axial stress (σZZ) in the mean plane of the adhesive, as a function of radius, is presented in figure 7 for some values of the principal geometrical parameters (P1, P3, P3). This parametric study shows that to obtain an almost constant stress in the adhesive, it is necessary to use a tubular test specimen of low thickness (P1 of about 5 mm) and a rather large height (P2 and P3 superior to 10 mm).
− 6 −
A d hesive
S up port S ub stra te
F ix ingsy stem
P 2P 3 P 1
1
2
3
4
5
Figure 7. Influence of load introduction – Evolution of the axial stress (σZZ) in the mean plane of the adhesive, as a function of radius.
This tubular geometry is easy to manufacture, but the design of the load introduction device is difficult. Moreover, for torsion loading, this device does not lead to a constant stress in the adhesive and it is not representative of the type of assemblies used in marine structures so it was not pursued further here. 3-4 Parallelepiped specimen
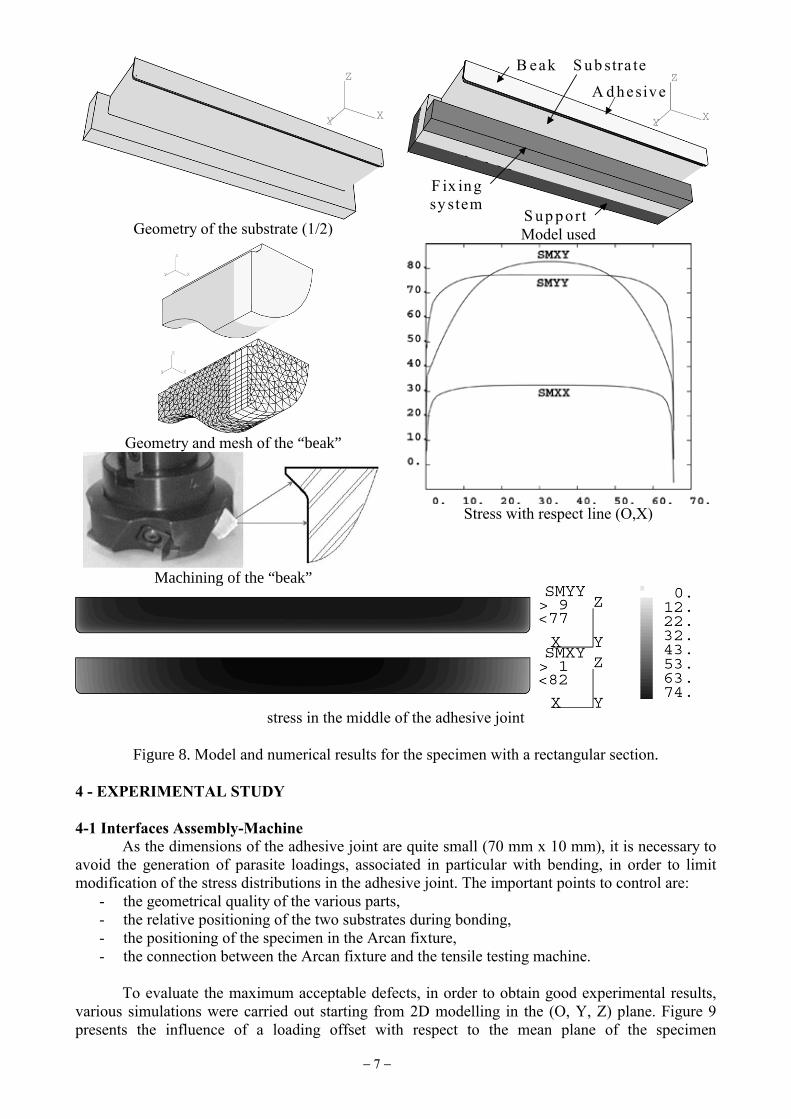
To preserve the simplicity associated with the Arcan fixture, and the use of a classical tensile testing machine, and taking into account the problems involved in machining (figure 8) a specimen with rectangular section (70 mm by 10 mm) was chosen. Simulations showed that an extra thickness of about 0.2 mm on the beak does not disturb the stress field in the adhesive. The beak is machined with an angle of α = 45° and a blending radius of 0.8 mm (figure 8).
The symmetry with respect to the loading plane (O,X,Y), O being the centre of the specimen and the anti-symmetric loading make it possible to reduce this three-dimensional simulation to one quarter of the specimen by applying adequate boundary conditions. After the simulation of the fastening of the specimen, a tension-shear loading is imposed on the upper face of the support. Precise numerical results require large models (more than 500 000 degrees of freedom); these simulations were carried out on an IBM-SP2 with 4 processors and 4 Gb of memory with the parallel version of the CAST3M code [18]. The distribution of the stresses in the adhesive is almost constant and it is important to note that the maximum value is located at the centre of the joint. Under the assumptions of the calculation, the maximum values of the components of the stress are obtained from the finite element results and from the average stress obtained based on the loads measured during the experimental test and the section of the adhesive plane (Sc):
- σyy maxi = 1.12 σyy average with σyy average = Fy / Sc - σxy maxi = 1.29 σxy average with σxy average = Fx / Sc
− 7 −
Geometry of the substrate (1/2)
F ix ingsy stem
S up port
A d hesive
S ub stra teB eak
Model used
Geometry and mesh of the “beak”
Machining of the “beak”
Stress with respect line (O,X)
stress in the middle of the adhesive joint
Figure 8. Model and numerical results for the specimen with a rectangular section.
4 - EXPERIMENTAL STUDY 4-1 Interfaces Assembly-Machine
As the dimensions of the adhesive joint are quite small (70 mm x 10 mm), it is necessary to avoid the generation of parasite loadings, associated in particular with bending, in order to limit modification of the stress distributions in the adhesive joint. The important points to control are:
- the geometrical quality of the various parts, - the relative positioning of the two substrates during bonding, - the positioning of the specimen in the Arcan fixture, - the connection between the Arcan fixture and the tensile testing machine.
To evaluate the maximum acceptable defects, in order to obtain good experimental results,
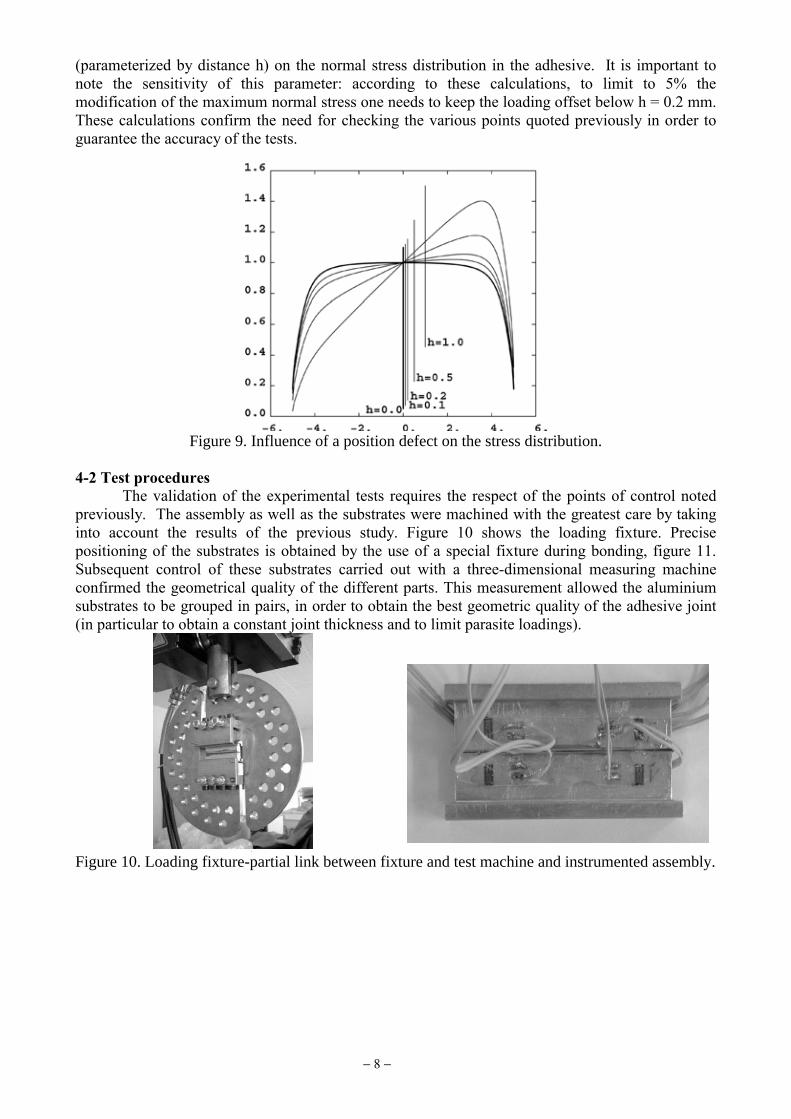
various simulations were carried out starting from 2D modelling in the (O, Y, Z) plane. Figure 9 presents the influence of a loading offset with respect to the mean plane of the specimen
− 8 −
(parameterized by distance h) on the normal stress distribution in the adhesive. It is important to note the sensitivity of this parameter: according to these calculations, to limit to 5% the modification of the maximum normal stress one needs to keep the loading offset below h = 0.2 mm. These calculations confirm the need for checking the various points quoted previously in order to guarantee the accuracy of the tests.
Figure 9. Influence of a position defect on the stress distribution.
4-2 Test procedures
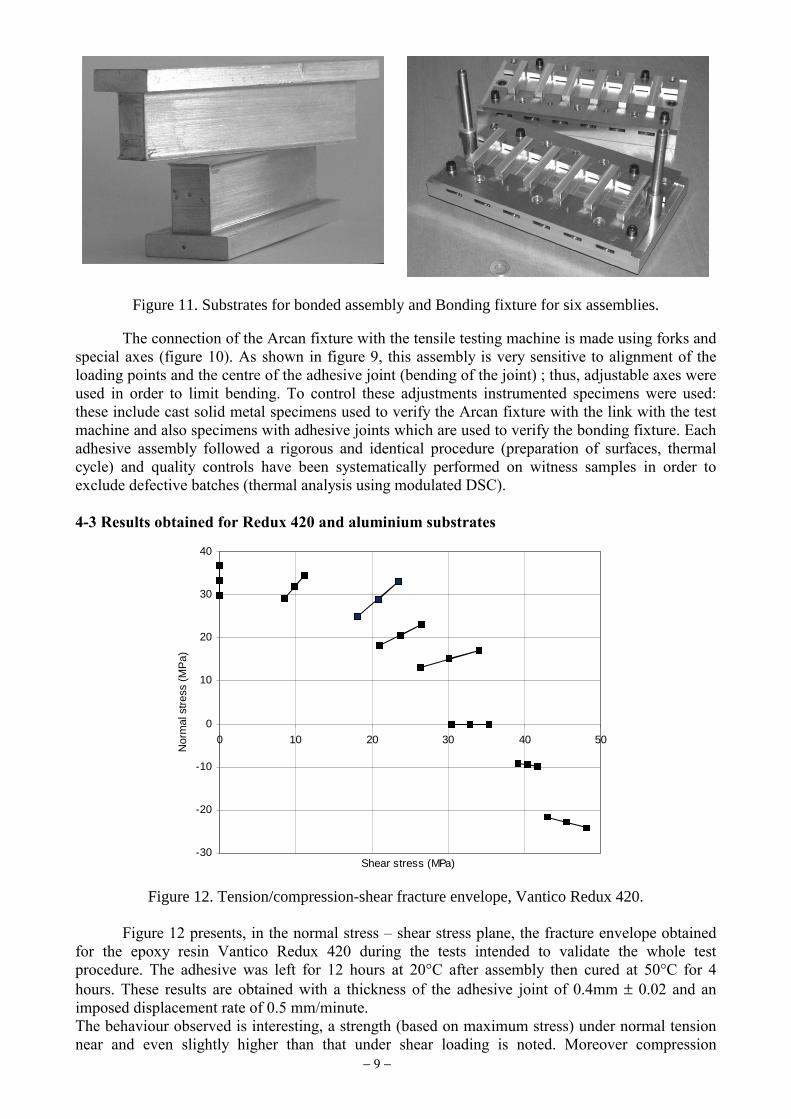
The validation of the experimental tests requires the respect of the points of control noted previously. The assembly as well as the substrates were machined with the greatest care by taking into account the results of the previous study. Figure 10 shows the loading fixture. Precise positioning of the substrates is obtained by the use of a special fixture during bonding, figure 11. Subsequent control of these substrates carried out with a three-dimensional measuring machine confirmed the geometrical quality of the different parts. This measurement allowed the aluminium substrates to be grouped in pairs, in order to obtain the best geometric quality of the adhesive joint (in particular to obtain a constant joint thickness and to limit parasite loadings).
Figure 10. Loading fixture-partial link between fixture and test machine and instrumented assembly.
− 9 −
Figure 11. Substrates for bonded assembly and Bonding fixture for six assemblies.
The connection of the Arcan fixture with the tensile testing machine is made using forks and
special axes (figure 10). As shown in figure 9, this assembly is very sensitive to alignment of the loading points and the centre of the adhesive joint (bending of the joint) ; thus, adjustable axes were used in order to limit bending. To control these adjustments instrumented specimens were used: these include cast solid metal specimens used to verify the Arcan fixture with the link with the test machine and also specimens with adhesive joints which are used to verify the bonding fixture. Each adhesive assembly followed a rigorous and identical procedure (preparation of surfaces, thermal cycle) and quality controls have been systematically performed on witness samples in order to exclude defective batches (thermal analysis using modulated DSC). 4-3 Results obtained for Redux 420 and aluminium substrates
-30
-20
-10
0
10
20
30
40
0 10 20 30 40 50
Shear stress (MPa)
Nor
mal
str
ess
(MP
a)
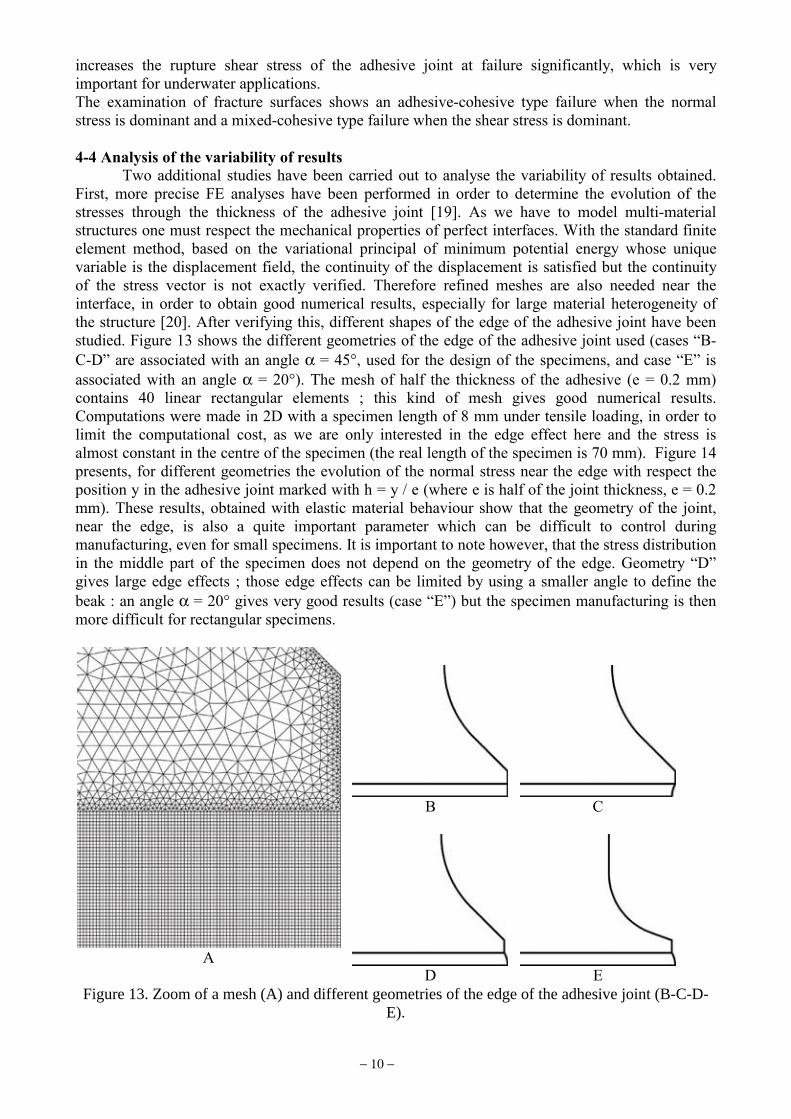
Figure 12. Tension/compression-shear fracture envelope, Vantico Redux 420.
Figure 12 presents, in the normal stress – shear stress plane, the fracture envelope obtained
for the epoxy resin Vantico Redux 420 during the tests intended to validate the whole test procedure. The adhesive was left for 12 hours at 20°C after assembly then cured at 50°C for 4 hours. These results are obtained with a thickness of the adhesive joint of 0.4mm ± 0.02 and an imposed displacement rate of 0.5 mm/minute. The behaviour observed is interesting, a strength (based on maximum stress) under normal tension near and even slightly higher than that under shear loading is noted. Moreover compression
− 10 −
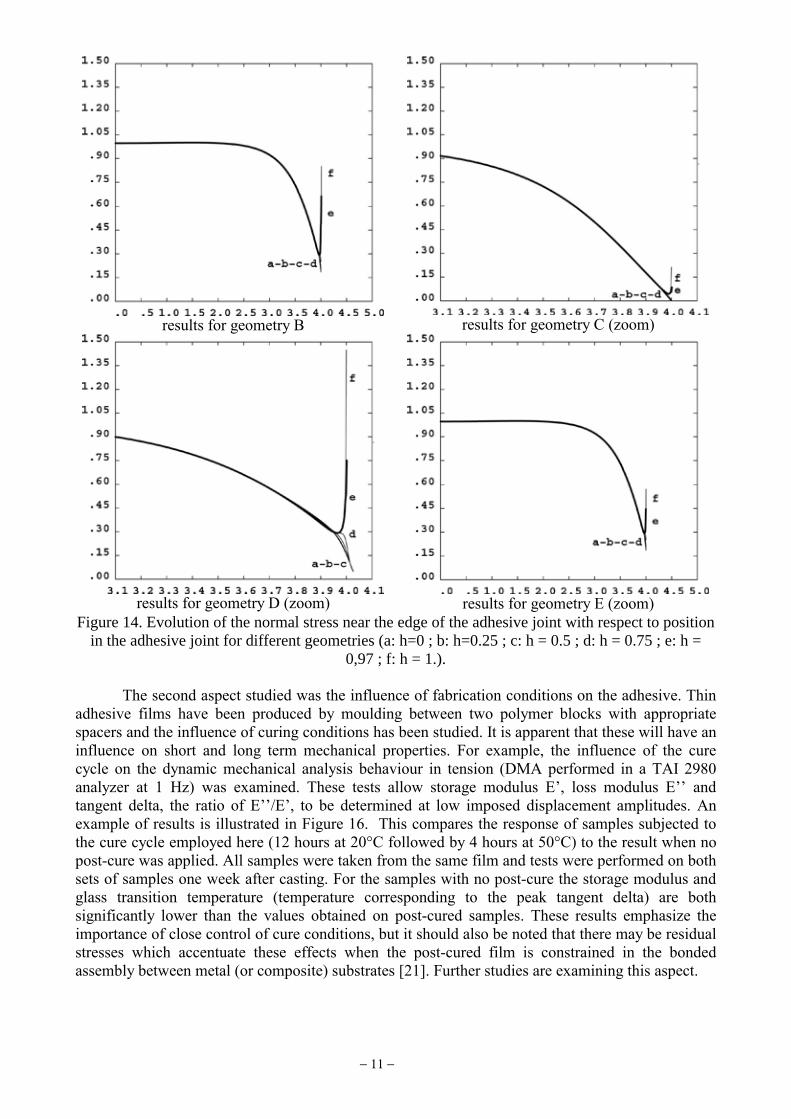
increases the rupture shear stress of the adhesive joint at failure significantly, which is very important for underwater applications. The examination of fracture surfaces shows an adhesive-cohesive type failure when the normal stress is dominant and a mixed-cohesive type failure when the shear stress is dominant. 4-4 Analysis of the variability of results Two additional studies have been carried out to analyse the variability of results obtained. First, more precise FE analyses have been performed in order to determine the evolution of the stresses through the thickness of the adhesive joint [19]. As we have to model multi-material structures one must respect the mechanical properties of perfect interfaces. With the standard finite element method, based on the variational principal of minimum potential energy whose unique variable is the displacement field, the continuity of the displacement is satisfied but the continuity of the stress vector is not exactly verified. Therefore refined meshes are also needed near the interface, in order to obtain good numerical results, especially for large material heterogeneity of the structure [20]. After verifying this, different shapes of the edge of the adhesive joint have been studied. Figure 13 shows the different geometries of the edge of the adhesive joint used (cases “B-C-D” are associated with an angle α = 45°, used for the design of the specimens, and case “E” is associated with an angle α = 20°). The mesh of half the thickness of the adhesive (e = 0.2 mm) contains 40 linear rectangular elements ; this kind of mesh gives good numerical results. Computations were made in 2D with a specimen length of 8 mm under tensile loading, in order to limit the computational cost, as we are only interested in the edge effect here and the stress is almost constant in the centre of the specimen (the real length of the specimen is 70 mm). Figure 14 presents, for different geometries the evolution of the normal stress near the edge with respect the position y in the adhesive joint marked with h = y / e (where e is half of the joint thickness, e = 0.2 mm). These results, obtained with elastic material behaviour show that the geometry of the joint, near the edge, is also a quite important parameter which can be difficult to control during manufacturing, even for small specimens. It is important to note however, that the stress distribution in the middle part of the specimen does not depend on the geometry of the edge. Geometry “D” gives large edge effects ; those edge effects can be limited by using a smaller angle to define the beak : an angle α = 20° gives very good results (case “E”) but the specimen manufacturing is then more difficult for rectangular specimens.
B
C
A
D
E Figure 13. Zoom of a mesh (A) and different geometries of the edge of the adhesive joint (B-C-D-
E).
− 11 −
results for geometry B
results for geometry C (zoom)
results for geometry D (zoom)
results for geometry E (zoom)
Figure 14. Evolution of the normal stress near the edge of the adhesive joint with respect to position in the adhesive joint for different geometries (a: h=0 ; b: h=0.25 ; c: h = 0.5 ; d: h = 0.75 ; e: h =
0,97 ; f: h = 1.).
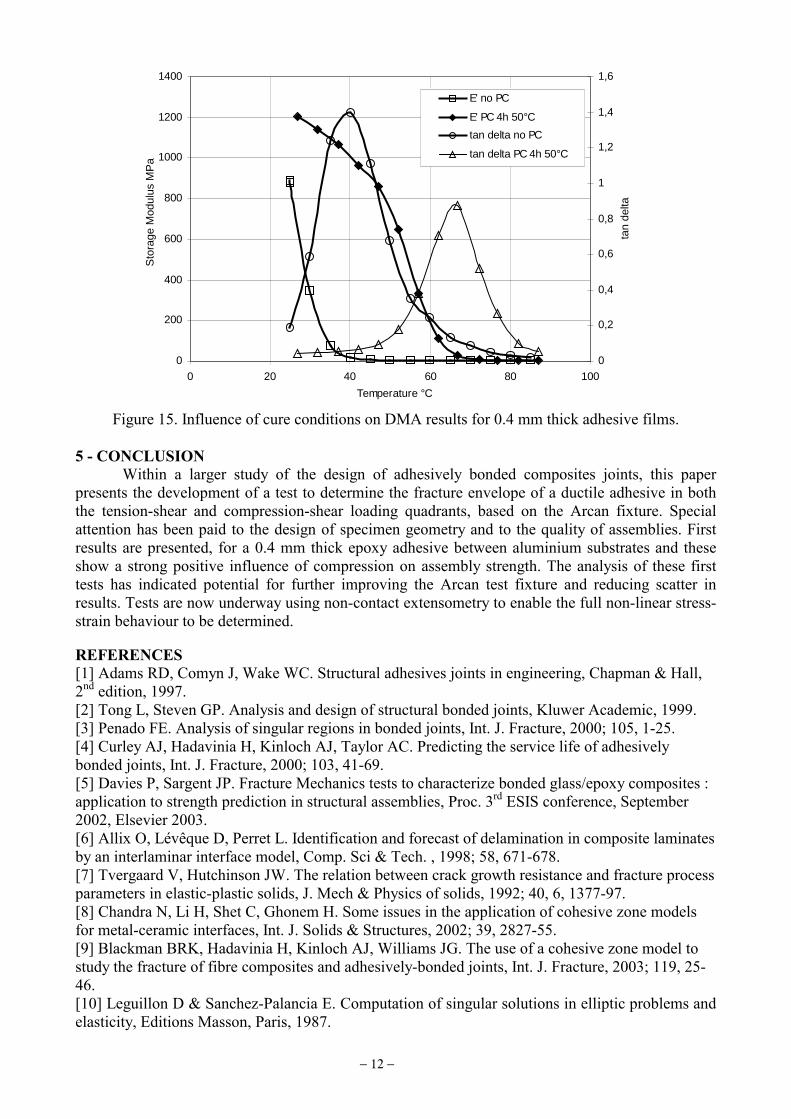
The second aspect studied was the influence of fabrication conditions on the adhesive. Thin adhesive films have been produced by moulding between two polymer blocks with appropriate spacers and the influence of curing conditions has been studied. It is apparent that these will have an influence on short and long term mechanical properties. For example, the influence of the cure cycle on the dynamic mechanical analysis behaviour in tension (DMA performed in a TAI 2980 analyzer at 1 Hz) was examined. These tests allow storage modulus E’, loss modulus E’’ and tangent delta, the ratio of E’’/E’, to be determined at low imposed displacement amplitudes. An example of results is illustrated in Figure 16. This compares the response of samples subjected to the cure cycle employed here (12 hours at 20°C followed by 4 hours at 50°C) to the result when no post-cure was applied. All samples were taken from the same film and tests were performed on both sets of samples one week after casting. For the samples with no post-cure the storage modulus and glass transition temperature (temperature corresponding to the peak tangent delta) are both significantly lower than the values obtained on post-cured samples. These results emphasize the importance of close control of cure conditions, but it should also be noted that there may be residual stresses which accentuate these effects when the post-cured film is constrained in the bonded assembly between metal (or composite) substrates [21]. Further studies are examining this aspect.
− 12 −
0
200
400
600
800
1000
1200
1400
0 20 40 60 80 100
Temperature °C
Sto
rage
Mod
ulus
MP
a
0
0,2
0,4
0,6
0,8
1
1,2
1,4
1,6
tan
delta
E' no PC
E' PC 4h 50°C
tan delta no PC
tan delta PC 4h 50°C
Figure 15. Influence of cure conditions on DMA results for 0.4 mm thick adhesive films.
5 - CONCLUSION
Within a larger study of the design of adhesively bonded composites joints, this paper presents the development of a test to determine the fracture envelope of a ductile adhesive in both the tension-shear and compression-shear loading quadrants, based on the Arcan fixture. Special attention has been paid to the design of specimen geometry and to the quality of assemblies. First results are presented, for a 0.4 mm thick epoxy adhesive between aluminium substrates and these show a strong positive influence of compression on assembly strength. The analysis of these first tests has indicated potential for further improving the Arcan test fixture and reducing scatter in results. Tests are now underway using non-contact extensometry to enable the full non-linear stress-strain behaviour to be determined. REFERENCES [1] Adams RD, Comyn J, Wake WC. Structural adhesives joints in engineering, Chapman & Hall, 2nd edition, 1997. [2] Tong L, Steven GP. Analysis and design of structural bonded joints, Kluwer Academic, 1999. [3] Penado FE. Analysis of singular regions in bonded joints, Int. J. Fracture, 2000; 105, 1-25. [4] Curley AJ, Hadavinia H, Kinloch AJ, Taylor AC. Predicting the service life of adhesively bonded joints, Int. J. Fracture, 2000; 103, 41-69. [5] Davies P, Sargent JP. Fracture Mechanics tests to characterize bonded glass/epoxy composites : application to strength prediction in structural assemblies, Proc. 3rd ESIS conference, September 2002, Elsevier 2003. [6] Allix O, Lévêque D, Perret L. Identification and forecast of delamination in composite laminates by an interlaminar interface model, Comp. Sci & Tech. , 1998; 58, 671-678. [7] Tvergaard V, Hutchinson JW. The relation between crack growth resistance and fracture process parameters in elastic-plastic solids, J. Mech & Physics of solids, 1992; 40, 6, 1377-97. [8] Chandra N, Li H, Shet C, Ghonem H. Some issues in the application of cohesive zone models for metal-ceramic interfaces, Int. J. Solids & Structures, 2002; 39, 2827-55. [9] Blackman BRK, Hadavinia H, Kinloch AJ, Williams JG. The use of a cohesive zone model to study the fracture of fibre composites and adhesively-bonded joints, Int. J. Fracture, 2003; 119, 25-46. [10] Leguillon D & Sanchez-Palancia E. Computation of singular solutions in elliptic problems and elasticity, Editions Masson, Paris, 1987.
− 13 −
[11] Davies P et al, Failure of bonded glass/epoxy composite joints, Proc. Structural Adhesives in Engineering (SAE6), Bristol, June 2001. [12] Bascom WD, Cottington RL, Jones RL, Peyser, P. J. Appl. Polym.Sci, 1975; 19, 2545 [13] ASTM D1002 Test Method for Apparent Shear Strength of Single-Lap-Joint Adhesively Bonded Metal Specimens by Tension Loading (Metal-to-Metal) [14] ASTM D5656-01 Standard Test Method for Thick-Adherend Metal Lap-Shear Joints for Determination of the Stress-Strain Behavior of Adhesives in Shear by Tension Loading. [15] Fischer M, Pasquier M. Shear behaviour of structural adhesives in the bondline, Construction & Building Materials, 3, 1, March 1989, 31-34. [16] Arcan L, Arcan M, Daniel I, SEM fractography of pure and mixed mode interlaminar fracture in graphite/epoxy composites, ASTM Special Tech. Publ., 1987 ; 948, 41-67. [17] Néon N. Mécanismes de rupture de l’interface implant-ciment des tiges fémorales", PhD thesis, Université de Nantes, 1998. [18] Cognard JY, Thomas F, Verpeaux P. An integrated approach to solving mechanical problems on parallel computers, Advances in Engineering Software, 2000; 31, 885-899. [19] Goncalves JPM, Moura MFSF, De Castro PMST. A three-dimensional finite element model for stress analysis of adhesive joints. Inter J. Adhesion et Adhesives, 2002 ; 22, 357-365. [20] Cheikh M, Coorevits P, Loredo A. Modelling the stress vector continuity at the interface of bonded joints , Int. J. Adhesion & Adhesives, 2001; 22, 249-257. [21] Nairn JA. Energy release rate analysis for adhesive and laminate double cantilever beam specimens emphasizing the effect of residual stresses, Int. J. Adhesion & Adhesives, 2000; 20, 59-70.