Embed Size (px)
Citation preview
Development of Aquatic Life Use Assessment Protocols
for Class VII Waters in Virginia
2013 Report of the Academic Advisory Committee for
Virginia Department of Environmental Quality
VIRGINIA POLYTECHNIC INSTITUTE AND STATE UNIVERSITY BLACKSBURG, VIRGINIA
2013
This special report is a publication of the Virginia Water Resources Research Center. The research was supported with funds provided by the Virginia Department of Environmental Quality. Contents of this publication do not necessarily reflect the views or polices of the Virginia Department of Environmental Quality or the Virginia Water Resources Research Center. Mention of commercial products, trade names, or services does not constitute an
endorsement or recommendation.
This report is available online. Hard copies may be obtained from the Virginia Water Resources Research Center for a small fee.
210 Cheatham Hall, Virginia Tech 310 West Campus Drive Blacksburg, VA 24061
(540) 231-5624 FAX: (540) 231-6673 E-mail: [email protected]
Web address: http://vwrrc.vt.edu
Stephen Schoenholtz, Director Virginia Tech does not discriminate against employees, students, or applicants on the basis of race, color, sex, sexual orientation, disability, age, veteran status, national origin, religion, or political affiliation. Anyone having questions concerning discrimination should contact the Equal Opportunity and Affirmative Action Office.
DEVELOPMENT OF AQUATIC LIFE USE ASSESSMENT PROTOCOLS
FOR CLASS VII WATERS IN VIRGINIA
2013 Report of the Academic Advisory Committee for
Virginia Department of Environmental Quality
by:
Greg C. Garman Member, Academic Advisory Committee
Associate Professor, Department of Biology Director, Center for Environmental Studies
Virginia Commonwealth University
Leonard A. Smock Member, Academic Advisory Committee
Professor, Department of Biology Director, VCU Rice Center for Environmental Sciences
Virginia Commonwealth University
Andrew L. Garey Member, Academic Advisory Committee
Lab & Research Specialist II, Aquatic Ecology Laboratory Department of Biology and VCU Rice Center for Environmental Sciences
Virginia Commonwealth University
and
Stephen P. McIninch Assistant Professor, Center for Environmental Studies
Virginia Commonwealth University
Edited by:
Jane L. Walker
Publication of the Virginia Water Resources Research Center
210 Cheatham Hall, Virginia Tech 310 West Campus Drive Blacksburg, VA 24061
SR53-2013
November 2013

ii
Members of the 2013 Academic Advisory Committee to the Virginia Department of Environmental Quality
Stephen H. Schoenholtz, Chair Virginia Water Resources Research Center Virginia Tech E. Fred Benfield Department of Biology Virginia Tech Paul Bukaveckas Department of Biology Virginia Commonwealth University Andrew L. Garey Department of Biology Virginia Commonwealth University Gregory C. Garman Department of Biology Virginia Commonwealth University Carl Hershner Department of Biology Virginia Institute of Marine Science The College of William and Mary Golde I. Holtzman Department of Statistics Virginia Tech Howard Kator Department of Environmental and Aquatic
Animal Health Virginia Institute of Marine Science The College of William and Mary Wu-Seng Lung Department of Civil and Environmental
Engineering The University of Virginia
Kevin J. McGuire Virginia Water Resources Research Center Virginia Tech Leonard A. Shabman Resources for the Future Eric Smith Department of Statistics Virginia Tech Leonard A. Smock Department of Biology Virginia Commonwealth University Kurt Stephenson Department of Agricultural and Applied
Economics Virginia Tech Jane L. Walker Virginia Water Resources Research Center Virginia Tech Gene Yagow Department of Biological Systems
Engineering Virginia Tech Carl E. Zipper Department of Crop and Soil Environmental
Sciences Virginia Tech
iii
Development of Aquatic Life Use Assessment Protocols
for Class VII Waters in Virginia
2013 Report of the Academic Advisory Committee for
Virginia Department of Environmental Quality
Table of Contents
Members of the 2013 Academic Advisory Committee to the Virginia Department of Environmental Quality
ii
Table of Contents iii
Introduction 1
Task 1 Blackwater Habitat Protocol 2
Task 2 Blackwater Condition Index 27
Conclusions and Recommendations 30
References 30
Appendices 31
Introduction
Biological organisms that are endemic to blackwater habitats are physiologically and behaviorally adapted to natural conditions of low pH and low oxygen concentration or saturation that might represent impaired conditions elsewhere. For example, many of the fishes native to blackwaters (Class VII) are facultative air-breathers or possess other adaptations to these unusual—but natural—conditions. In contrast, aquatic taxa with more cosmopolitan (i.e., geographically broad) distributions lack specific adaptations to blackwater conditions, are uncommon in ecologically healthy blackwater systems, and may be indicators of impairment in these streams. As a consequence, it may be possible to use the taxonomic and functional composition of biotic assemblages (e.g., fishes, macroinvertebrates) sampled in coastal freshwaters of Virginia to accurately assess the status of Class VII blackwaters and to evaluate the level of ecological health—or conversely, impairment—using biological (cp. chemical) criteria. Other states with blackwater streams and swamps (e.g., Maryland and New Jersey) have also recognized the problem of using physicochemical criteria (low pH, hypoxia) to determine impairment where such conditions are natural and contribute to unique communities of endemic taxa. The development of bioassessment tools for Virginia Class VII waters has been a task of the Academic Advisory Committee (AAC) for the Virginia Department of Environmental Quality (DEQ) since 2011.
A recent report of the AAC described the development of a biology-based stream assessment tool (the Blackwater Condition Index, BCI) specifically for use in Class VII blackwater stream and swamp systems (Garman et al. 2012). In a related effort, Garman et al. (2012) developed a working protocol for the use of field-based, non-biological criteria to identify blackwater systems as distinct from other Class VII waters in the region. Subsequent feedback from AAC members and DEQ personnel suggested that both of these procedures were effective but remain insufficiently developed for formal testing and validation.
As one of the next steps in the development of a BCI for Class VII blackwater streams in Virginia, it was deemed necessary to further develop and then validate a protocol that employs the best combination of field-based habitat evaluation metrics and/or GIS-based data to quantitatively separate Class VII blackwater streams from other types of Class VII waters as well as from Coastal Plain streams not appropriate for Class VII designation (Task 1 of this report). Not until this task is accomplished can a protocol be developed that is effective for indicating anthropogenic stress in systems identified as blackwater. The second necessary step in the development of a functional BCI for Virginia was to expand the results of fish community analysis completed in 2012 and to develop and test specific metrics and scoring criteria (cp. Pont et al. 2009) to identify impairment of blackwater stream and swamp systems (Task 2 of this report).
The overall long-term objective of our work is to develop and validate an assessment protocol for Class VII blackwater streams and swamps based solely on biological criteria, specifically fish

2
assemblage structure. The work detailed in this report focuses on the development of a habitat classification protocol for blackwater streams (referred to hereafter as the blackwater habitat protocol, or BHP). The initial deliverable is a field protocol that can be used by Virginia Department of Environmental Quality biologists as an aid to their best professional judgment in determining whether field sites are appropriate for designation as a Class VII blackwater and thus to be assessed using the BCI protocol currently under development. This classification protocol thus is intended to serve as a decision support tool for augmenting best professional judgment regarding the proper classification of wadeable, freshwater systems on the Virginia Coastal Plain. The current report, the results of which were presented to AAC and DEQ staff on April 19, 2013, describes the next steps in the evolution of a BHP and BCI for assessment of Class VII waters in Virginia.
Task 1 Blackwater Habitat Protocol
Methods
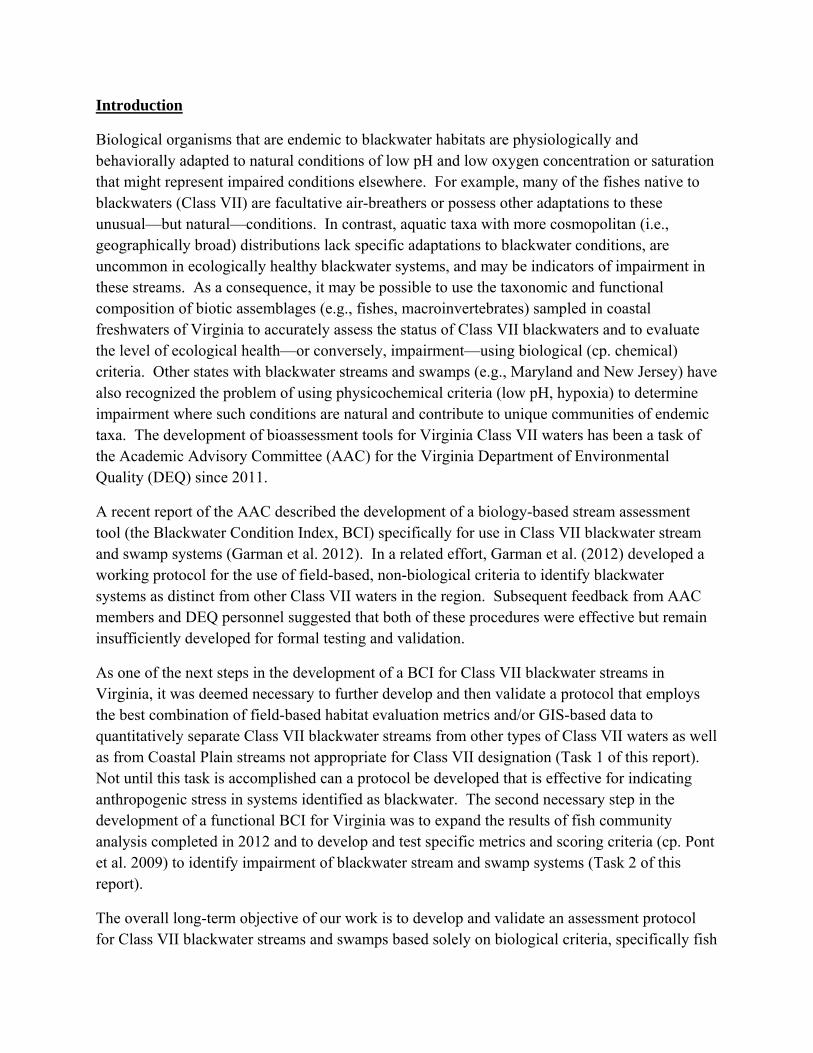
We used topographic maps and aerial photographs to select sites that represented a wide range of variation with respect to the chosen habitat parameters. In addition to the 12 study sites selected for the 2012 report, we visited an additional 32 sites to collect habitat data (total n=44 sites, Fig. 1, and see Appendix A for latitude/longitude coordinates of sites).
At all sites, a 100 m reach was evaluated. Before extensively measuring or evaluating any site characteristics we began each survey by subjectively classifying each site as either a blackwater swamp system, a non-blackwater swamp system, or a free-flowing Coastal Plain stream. The first two of these classification categories were considered as potential Class VII waters. We then measured pH, dissolved oxygen, temperature and conductivity using YSI and Hydrolab multimeters (YSI Inc., Yellow Springs, OH; Hach Inc., Loveland, CO). After the physiochemical measurements were completed, we estimated a series of in-stream and watershed habit characteristics:
-- Channel Formation and Flow Characteristics: this category included metrics associated with the number of clearly-defined channels along the study reach, flow velocity and directionality, and benthic substrate.
-- Riparian Zone Characteristics: this category included evaluations of riparian zone vegetation type and prevalence, the presence of riparian wetlands, and topography.
All data collected at the 12 sites in the 2012 investigation were also collected at the 32 new sites, with five notable changes:
1) Due to the difficulty of the original method for judging water color (evaluation of a vial of water against a Munsell color chart), the method was modified to include evaluating stream
3
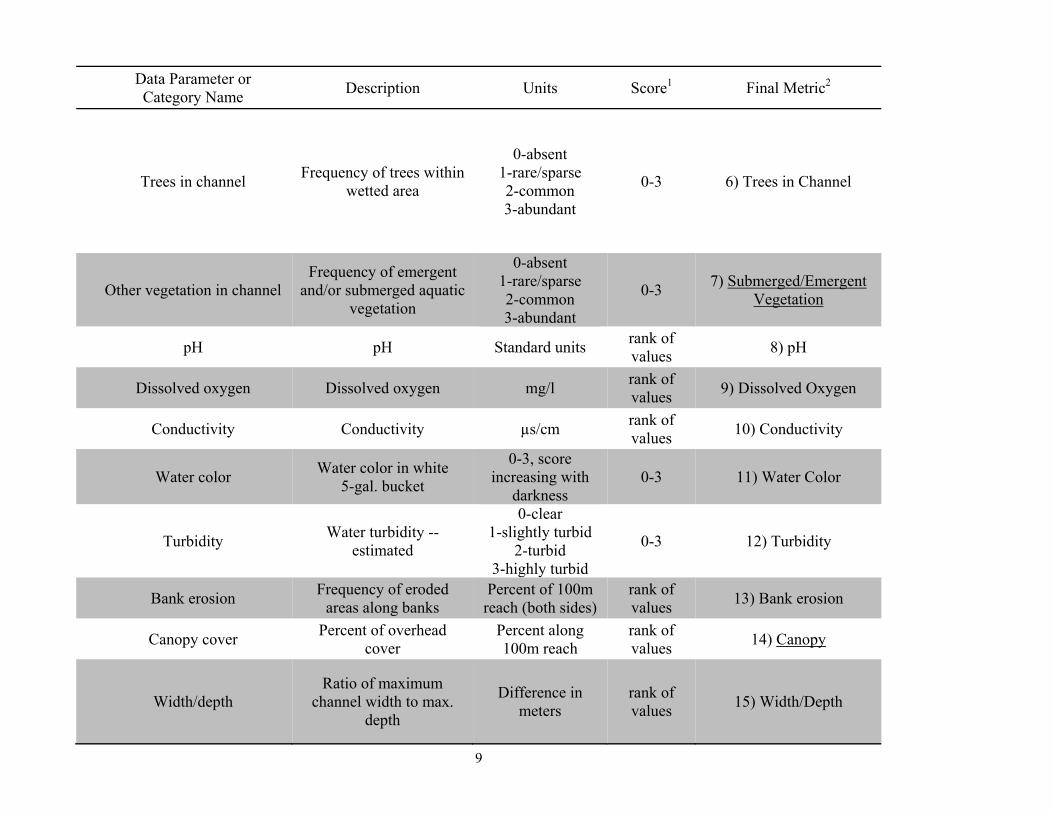
water collected in a full, white, 5-gallon bucket and scoring the water based on color (with scores of: 0=clear; 1=pale yellow/brown; 2=brown; and 3=dark brown; Metric 11, Table 1).
2) The percentage of overhead canopy cover was added as a metric (Metric 14, Table 1).
3) The depth variation metric used in 2012 was changed to the ratio of maximum channel width to maximum depth (Metric 15, Table 1)
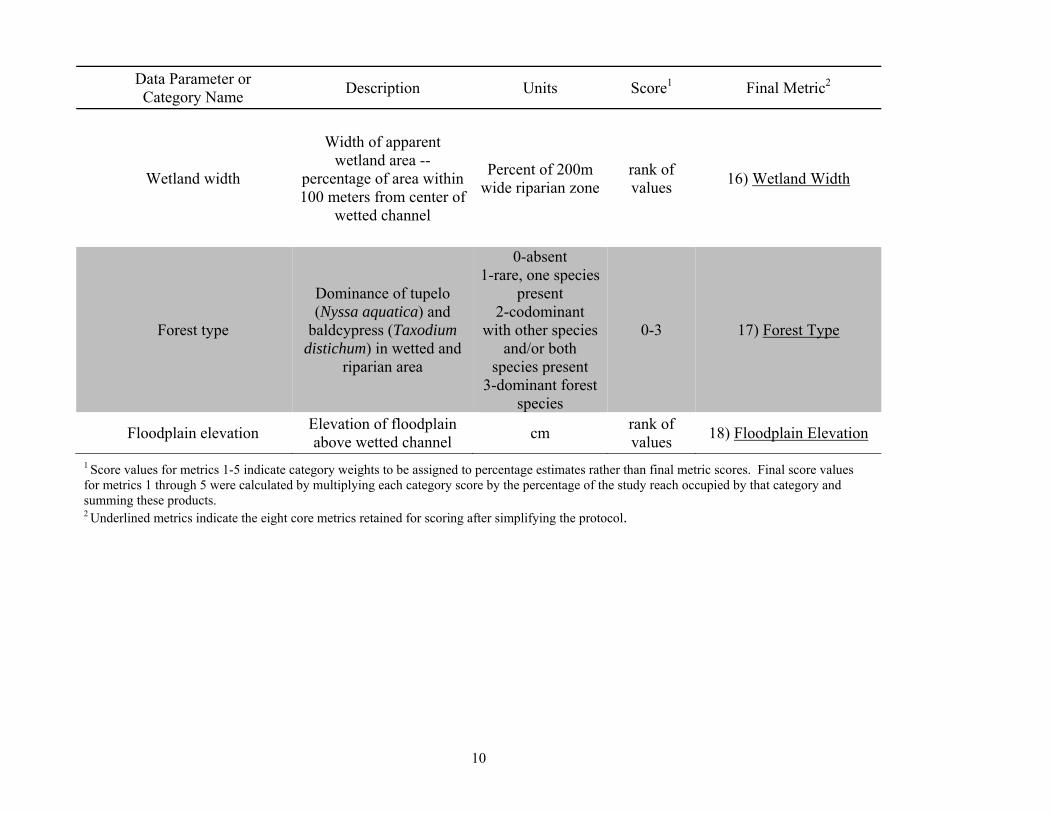
4) A metric was added to judge the presence and relative abundance of two tree species that commonly occur in blackwater swamp systems: baldcypress (Taxodium distichum) and water tupelo (Nyssa aquatica; Metric 17, Table 1).
5) A metric was added to estimate the elevation of the riparian floodplain above the wetted area (Metric 18, Table 1).
Data analysis
From the field observations, 18 quantitative habitat metrics were calculated (see Table 1 for brief explanations of metrics and their calculations). Parameters for those measurements or estimations that yielded continuous data were simply scored using the raw data (e.g., meters of riparian wetland, mg/L of dissolved oxygen), whereas those indicating categorical attributes (e.g., single, multiple, or undefined channel) were given numerical scores based on a priori hypotheses regarding the potential for each categorical condition to occur in Class VII waters (Table 1).
To visualize relationships among the study sites with respect to all of the observed habitat metrics, we conducted Principal Components Analysis (PCA) ordination, a linear multivariate analysis technique, using PC-ORD, Version 5.0 (McCune and Mefford 2006). Sites are represented on ordination plots by points, whereas the distances among points represent the degree of the overall differences among sites in terms of overall habitat structure. The axes on the ordination plots are unitless and simply represent linear composites of the observed habitat metrics. To eliminate the effects of variations in scaling among metrics of different numerical types (i.e., percentages, continuous measurements, and discrete scores), the percentile rank of each metric score was calculated, and these data were used in the PCA analysis.
We found that collection of the data required for all 18 metrics was very time-consuming at sites where access was limited or where lines of site were short. In addition field biologists not involved in the original development of the protocol reported some difficulty in interpreting metrics. Based on these challenges, we attempted to simplify the protocol to produce a more time-efficient and easy-to-interpret suite of metrics. To simplify the protocol, we first excluded the physicochemical water quality measurements and water color evaluation, as these require additional equipment and are more likely to be confounded by anthropogenic impairment or short-term temporal variation than the other metrics. Next, we constructed a correlation matrix,
4
which included the Pearson correlation coefficient (r) for all pairwise comparisons of metrics, and eliminated metrics so that none remained that were correlated with others at r-values ≥ 0.75 or ≤ -0.75 (Table 2). When such correlations occurred, we eliminated metrics that we judged to be the most difficult or time-consuming to evaluate and those that exhibited correlations with multiple other metrics.
We have changed the metric suite and analyses slightly since the presentation given to the Academic Advisory Committee on April 19, 2013. During that presentation, the Trees in Channel metric (Metric 6, Table 1) was used, and the Forest Type metric (Metric 17, Table 1) was excluded as the two metrics were highly correlated (r: 0.80, Table 2); however, upon further examination of the data, we determined that the Trees in Channel metric showed moderate correlations (r: 0.64-0.74) with several other metrics, whereas the Forest Type metric did not, indicating that the latter explains more new information relative to site classification. In addition, the latter metric is the only one that includes information on the type of riparian vegetation present at a given site, and, therefore, likely provides a more robust description of the habitat conditions. Therefore, for this report, we use the Forest Type metric rather than the Trees in Channel metric, and recommend this change for future assessments.
The revised, simplified protocol contained eight core metrics: 1) the degree of channel formation (Channel Development); 2) flow velocity along the reach (Flow Velocity); 3) the percentage of the bottom area covered by organic matter (Benthic OM); 4) the commonness of submerged and/or emergent aquatic vegetation in the wetted area (Submerged/Emergent Vegetation); 5) the percentage of overhead canopy cover (Canopy); 6) the lateral width of wetlands in the riparian zone (Wetland Width); 7) Forest Type (as discussed above); and 8) the elevation of the floodplain adjacent to the site (Floodplain Elevation).
We conducted a second PCA analysis using only the eight core metrics to determine if the simplified protocol was as effective at classifying the sites as the original 18-metric protocol. We then refined the protocol further by developing a simplified scoring criterion, wherein the metric values were divided by quartiles, and sites falling into each 25 percent interval were given scores of 0, 1, 2, or 3, with increasing values indicating an increased likelihood that the site should be considered Class VII and blackwater. This new scoring criterion and the resulting field classification protocol are discussed more extensively in the following section.
Preliminary Geographic Information Systems (GIS) Analysis
At the 2012 AAC meeting, members expressed interest in determining whether geospatial data such as soils and topography could be used to classify sites as Class VII. To this end, we obtained a 10-meter digital elevation model (DEM) from the National Elevation Dataset (NED). We used the DEM to delineate the watershed upstream of each sampling site, to derive mean slope values for each watershed, and to assess slope variability by determining the standard deviation of the slope values within the watersheds. We also obtained U.S. Department of

5
Agriculture Soils Data to determine the proportion of each watershed occupied by commonly-flooded soils, by commonly-ponded soils, by hydric soils, and by sandy soil types, as well as the average depth to the water table in each watershed (see Appendix A for further explanation of GIS variables). All GIS data used in this analysis and supporting metadata are available, free of charge, via the National Resources Conservation Services Data Gateway (http://datagateway.nrcs.usda.gov/). All GIS analyses were conducted using ARCMAP, version 10.0 (ESRI, Inc., Redlands, CA). All statistical analyses conducted on the derived GIS data were conducted using R, version 2.15.2 (R Core Team 2012).
6
Figure 1: Map of the 44 habitat classification sites.

7
Table 1: Explanation of habitat metrics and water chemistry parameters used in site classification.
Data Parameter or Category Name
Description Units Score1 Final Metric2
Single channel Proportion of reach
composed of a single, defined channel
Percent of 100m reach
2
1) Channel Development Multiple channels Proportion of reach
composed of multiple channels
Percent of 100m reach
1
Undefined channel pattern Proportion of reach with
no defined channel Percent of 100m
reach 0
No flow No perceptible flow Percent of 100m
reach 0
Slow flow Sluggish, but apparent
flow Percent of 100m
reach 1
Moderate flow Moderate, laminar flow Percent of 100m
reach 2 2) Flow Velocity
Rapid, laminar flow Rapid, laminar flow Percent of 100m
reach 3
Turbulent flow Rapid, turbulent flow Percent of 100m
reach 4
One flow vector One clearly-defined
direction of flow Percent of 100m
reach 0
Multiple flow vectors Multiple, clearly-defined
flow directions Percent of 100m
reach 1 3) Flow Direction
No flow vectors Undefined flow direction
(no discernible flow) Percent of 100m
reach 2

8
Data Parameter or Category Name
Description Units Score1 Final Metric2
Silt Frequency of silt
substrate Percent of 100m
reach 1
Sand Frequency of sand
substrate Percent of 100m
reach 2
4) Mineral Substrate Size
Clay hardpan Frequency of hard-pan
clay substrate Percent of 100m
reach 3
Rock Frequency of gravel and
cobble substrate Percent of 100m
reach 3
Fine particulate organics Frequency of substrate
composed of fine particulate organic matter
Percent of 100m reach
0
Coarse particulate organics Frequency of substrate
composed of coarse particulate organic matter
Percent of 100m reach
0
Silt Frequency of silt
substrate Percent of 100m
reach 1
5) Benthic Organic Matter
Sand Frequency of sand
substrate Percent of 100m
reach 0
Clay hardpan Frequency of hard-pan
clay substrate Percent of 100m
reach 0
Rock Frequency of gravel and
cobble substrate Percent of 100m
reach 0
Fine particulate organics Frequency of substrate
composed of fine particulate organic matter
Percent of 100m reach
2
CPOM/wood
Frequency of substrate composed of coarse
particulate organic matter and large woody debris
Percent of 100m reach
2
9
Data Parameter or Category Name
Description Units Score1 Final Metric2
Trees in channel Frequency of trees within
wetted area
0-absent 1-rare/sparse 2-common 3-abundant
0-3 6) Trees in Channel
Other vegetation in channel Frequency of emergent
and/or submerged aquatic vegetation
0-absent 1-rare/sparse 2-common 3-abundant
0-3 7) Submerged/Emergent
Vegetation
pH pH Standard units rank of values
8) pH
Dissolved oxygen Dissolved oxygen mg/l rank of values
9) Dissolved Oxygen
Conductivity Conductivity µs/cm rank of values
10) Conductivity
Water color Water color in white
5-gal. bucket
0-3, score increasing with
darkness 0-3 11) Water Color
Turbidity Water turbidity --
estimated
0-clear 1-slightly turbid
2-turbid 3-highly turbid
0-3 12) Turbidity
Bank erosion Frequency of eroded
areas along banks Percent of 100m reach (both sides)
rank of values
13) Bank erosion
Canopy cover Percent of overhead
cover Percent along 100m reach
rank of values
14) Canopy
Width/depth Ratio of maximum
channel width to max. depth
Difference in meters
rank of values
15) Width/Depth
10
Data Parameter or Category Name
Description Units Score1 Final Metric2
Wetland width
Width of apparent wetland area --
percentage of area within 100 meters from center of
wetted channel
Percent of 200m wide riparian zone
rank of values
16) Wetland Width
Forest type
Dominance of tupelo (Nyssa aquatica) and
baldcypress (Taxodium distichum) in wetted and
riparian area
0-absent 1-rare, one species
present 2-codominant
with other species and/or both
species present 3-dominant forest
species
0-3 17) Forest Type
Floodplain elevation Elevation of floodplain above wetted channel
cm rank of values
18) Floodplain Elevation
1 Score values for metrics 1-5 indicate category weights to be assigned to percentage estimates rather than final metric scores. Final score values for metrics 1 through 5 were calculated by multiplying each category score by the percentage of the study reach occupied by that category and summing these products. 2 Underlined metrics indicate the eight core metrics retained for scoring after simplifying the protocol.

11
Table 2: Correlation matrix for all pairwise comparisons of habitat metrics.1
pH Dissolved Oxygen
Spec. Cond.
Water Color
Water Turbidity
Channel Dev.
Bank Erosion
Flow Velocity
Flow Direction
Organic Matter
Mineral Subst.
Width/Depth
Wetland Width Canopy
Floodplain Elevation
Trees in Channel
Sub./Emerg. Veg.
Forest Type
pH 0.00 0.73 0.00 0.43 0.47 0.68 0.83 0.55 0.91 0.95 0.44 0.35 0.32 0.56 0.87 0.99 0.10 0.98
Dissolved Oxygen 0.05 0.00 0.64 0.01 0.10 0.08 0.02 0.00 0.04 0.03 0.06 0.46 0.14 0.13 0.23 0.03 0.65 0.08
Spec. Conductance 0.69 0.07 0.00 0.02 0.61 0.36 0.96 0.18 0.32 0.14 0.07 0.75 0.55 0.46 0.24 0.58 0.87 0.65
Water Color ‐0.12 ‐0.41 ‐0.36 0.00 0.66 0.01 0.09 0.00 0.00 0.07 0.01 0.22 0.44 0.31 0.02 0.03 0.85 0.00
Water Turbidity 0.11 ‐0.25 0.08 0.07 0.00 0.65 0.22 0.22 0.90 0.20 0.06 0.51 0.14 0.02 0.65 0.71 0.82 0.23
Channel Dev. 0.06 0.27 0.14 ‐0.40 ‐0.07 0.00 0.00 0.00 0.00 0.00 0.00 0.00 0.00 0.80 0.00 0.00 0.25 0.00
Bank Erosion ‐0.03 0.35 0.01 ‐0.26 ‐0.19 0.74 0.00 0.00 0.00 0.00 0.00 0.00 0.00 0.94 0.00 0.00 0.01 0.00
Flow Velocity 0.09 0.49 0.21 ‐0.57 ‐0.19 0.72 0.60 0.00 0.00 0.00 0.00 0.00 0.03 0.66 0.00 0.00 0.85 0.01
Flow Direction 0.02 0.32 0.15 ‐0.48 ‐0.02 0.91 0.76 0.77 0.00 0.00 0.00 0.00 0.00 0.43 0.00 0.00 0.22 0.00
Organic Matter ‐0.01 ‐0.33 ‐0.23 0.28 0.20 ‐0.44 ‐0.60 ‐0.44 ‐0.48 0.00 0.00 0.14 0.00 0.27 0.00 0.00 0.03 0.16
Mineral Substrate 0.12 0.28 0.28 ‐0.37 ‐0.28 0.53 0.67 0.47 0.56 ‐0.84 0.00 0.01 0.00 0.17 0.00 0.00 0.01 0.03
Width/Depth ‐0.14 ‐0.11 ‐0.05 0.19 ‐0.10 ‐0.82 ‐0.65 ‐0.49 ‐0.77 0.22 ‐0.39 0.00 0.00 0.20 0.00 0.00 0.37 0.00
Wetland Width 0.15 ‐0.23 0.09 0.12 0.23 ‐0.59 ‐0.80 ‐0.32 ‐0.55 0.58 ‐0.62 0.49 0.00 0.92 0.00 0.00 0.10 0.00
Canopy 0.09 ‐0.23 0.11 0.16 ‐0.34 ‐0.04 0.01 ‐0.07 ‐0.12 ‐0.17 0.21 0.20 ‐0.01 0.00 0.28 0.04 0.07 0.00
Floodplain Elevation 0.03 0.19 0.18 ‐0.35 ‐0.07 0.71 0.64 0.53 0.70 ‐0.52 0.61 ‐0.59 ‐0.59 0.17 0.00 0.00 0.01 0.01
Trees in Channel 0.00 ‐0.32 ‐0.09 0.32 ‐0.06 ‐0.69 ‐0.74 ‐0.55 ‐0.70 0.49 ‐0.55 0.70 0.64 0.32 ‐0.55 0.00 0.19 0.00
Submerged/Emerg. Veg. 0.25 0.07 0.02 0.03 0.04 ‐0.18 ‐0.39 ‐0.03 ‐0.19 0.33 ‐0.37 0.14 0.25 ‐0.28 ‐0.39 0.20 0.00 0.33
Forest Type 0.00 ‐0.27 ‐0.07 0.45 ‐0.18 ‐0.49 ‐0.57 ‐0.40 ‐0.55 0.22 ‐0.33 0.59 0.43 0.42 ‐0.41 0.80 0.15 0.00
1 Values in the lower triangle (unshaded) are correlation coefficients (Pearson r-values); red shaded values indicate correlations exceeding +/- 0.75. Values in the upper half (shaded) are p-values. Underlined metrics were used in the simplified protocol.
12
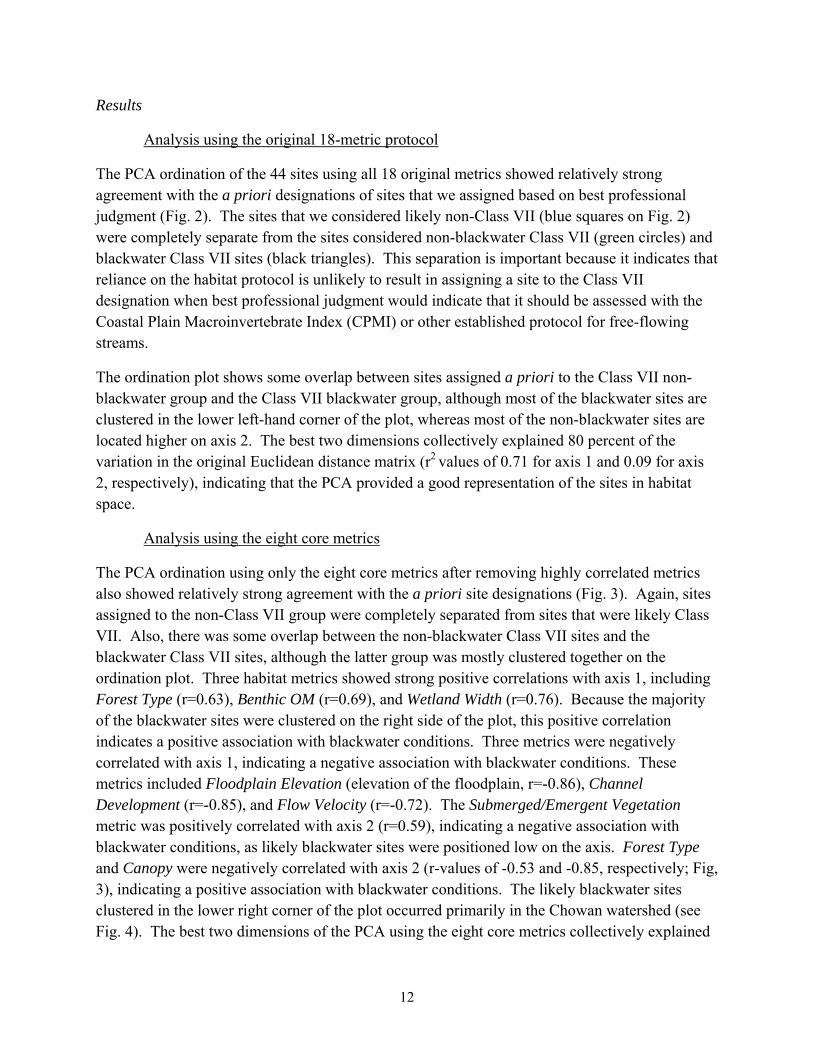
Results
Analysis using the original 18-metric protocol
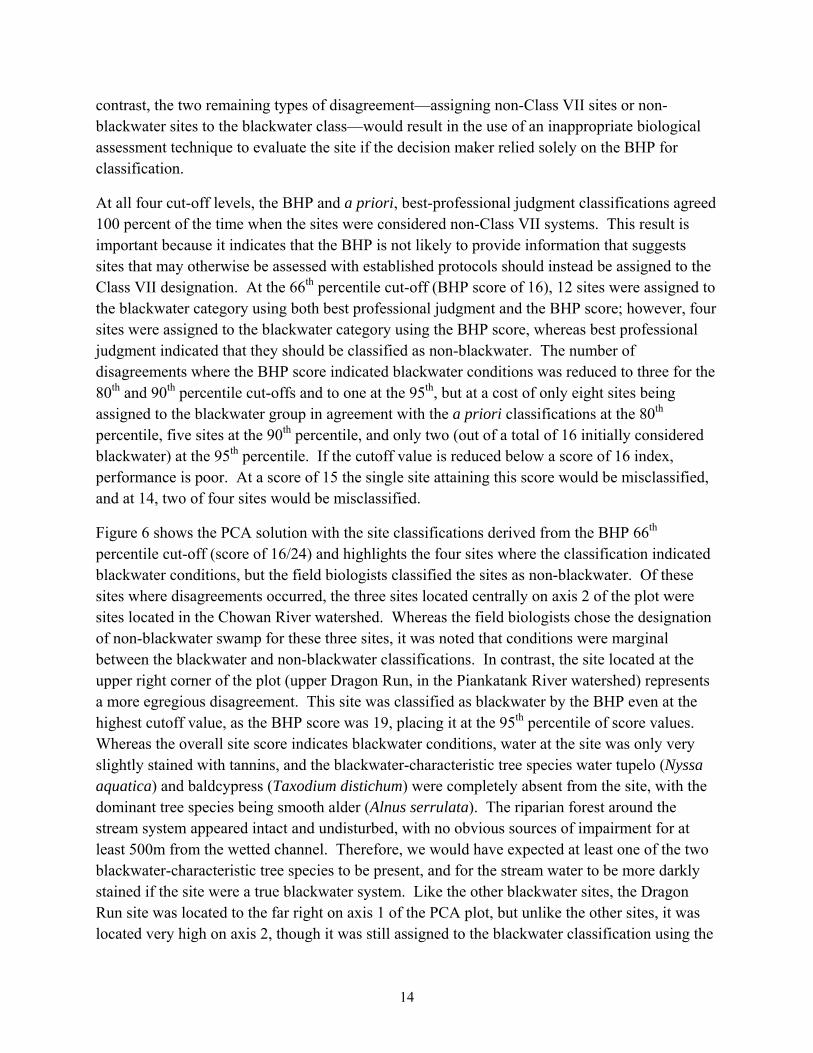
The PCA ordination of the 44 sites using all 18 original metrics showed relatively strong agreement with the a priori designations of sites that we assigned based on best professional judgment (Fig. 2). The sites that we considered likely non-Class VII (blue squares on Fig. 2) were completely separate from the sites considered non-blackwater Class VII (green circles) and blackwater Class VII sites (black triangles). This separation is important because it indicates that reliance on the habitat protocol is unlikely to result in assigning a site to the Class VII designation when best professional judgment would indicate that it should be assessed with the Coastal Plain Macroinvertebrate Index (CPMI) or other established protocol for free-flowing streams.
The ordination plot shows some overlap between sites assigned a priori to the Class VII non-blackwater group and the Class VII blackwater group, although most of the blackwater sites are clustered in the lower left-hand corner of the plot, whereas most of the non-blackwater sites are located higher on axis 2. The best two dimensions collectively explained 80 percent of the variation in the original Euclidean distance matrix (r2 values of 0.71 for axis 1 and 0.09 for axis 2, respectively), indicating that the PCA provided a good representation of the sites in habitat space.
Analysis using the eight core metrics
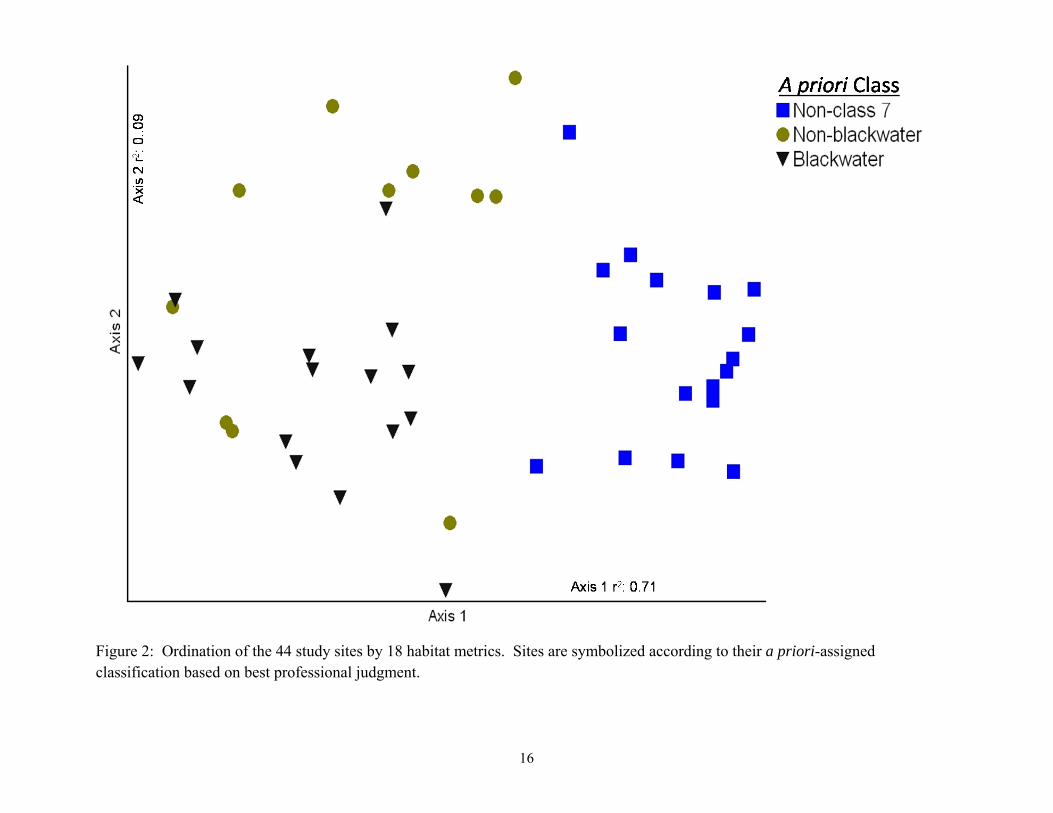
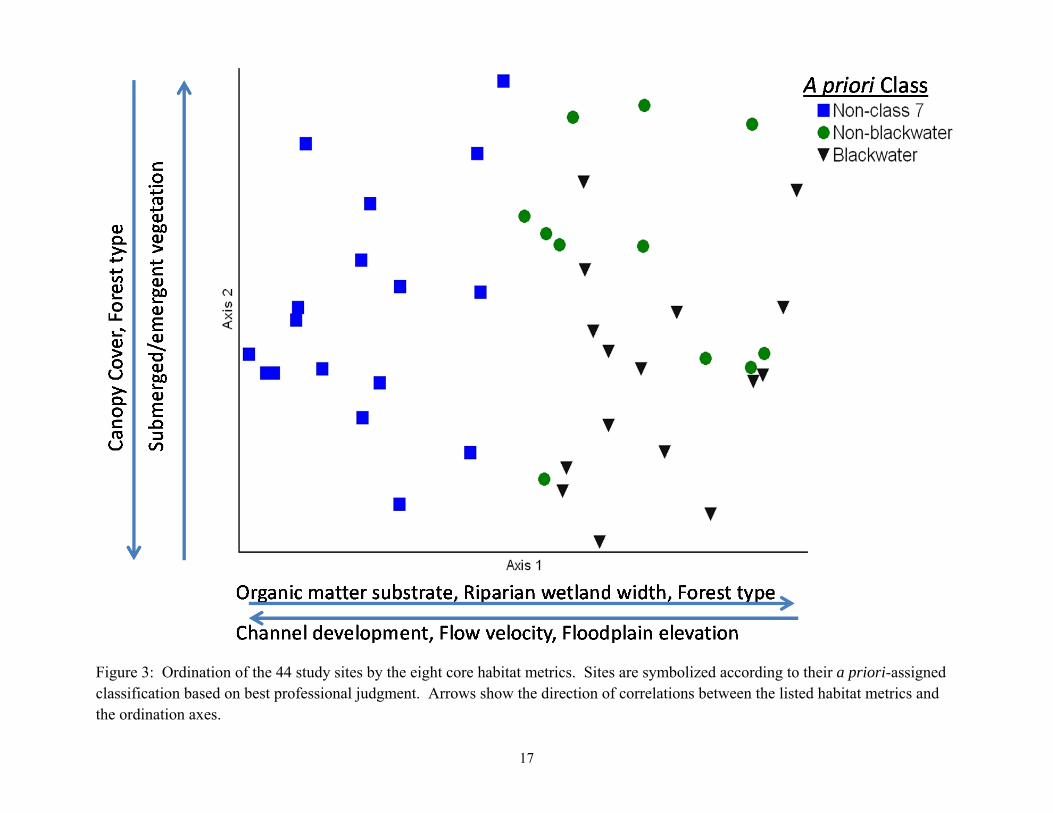
The PCA ordination using only the eight core metrics after removing highly correlated metrics also showed relatively strong agreement with the a priori site designations (Fig. 3). Again, sites assigned to the non-Class VII group were completely separated from sites that were likely Class VII. Also, there was some overlap between the non-blackwater Class VII sites and the blackwater Class VII sites, although the latter group was mostly clustered together on the ordination plot. Three habitat metrics showed strong positive correlations with axis 1, including Forest Type (r=0.63), Benthic OM (r=0.69), and Wetland Width (r=0.76). Because the majority of the blackwater sites were clustered on the right side of the plot, this positive correlation indicates a positive association with blackwater conditions. Three metrics were negatively correlated with axis 1, indicating a negative association with blackwater conditions. These metrics included Floodplain Elevation (elevation of the floodplain, r=-0.86), Channel Development (r=-0.85), and Flow Velocity (r=-0.72). The Submerged/Emergent Vegetation metric was positively correlated with axis 2 (r=0.59), indicating a negative association with blackwater conditions, as likely blackwater sites were positioned low on the axis. Forest Type and Canopy were negatively correlated with axis 2 (r-values of -0.53 and -0.85, respectively; Fig, 3), indicating a positive association with blackwater conditions. The likely blackwater sites clustered in the lower right corner of the plot occurred primarily in the Chowan watershed (see Fig. 4). The best two dimensions of the PCA using the eight core metrics collectively explained
13
80 percent of the variation in the original Euclidean distance matrix (r2 values of 0.60 for axis 1 and 0.20 for axis 2, respectively), indicating that the PCA provided a good representation of the sites in habitat space.
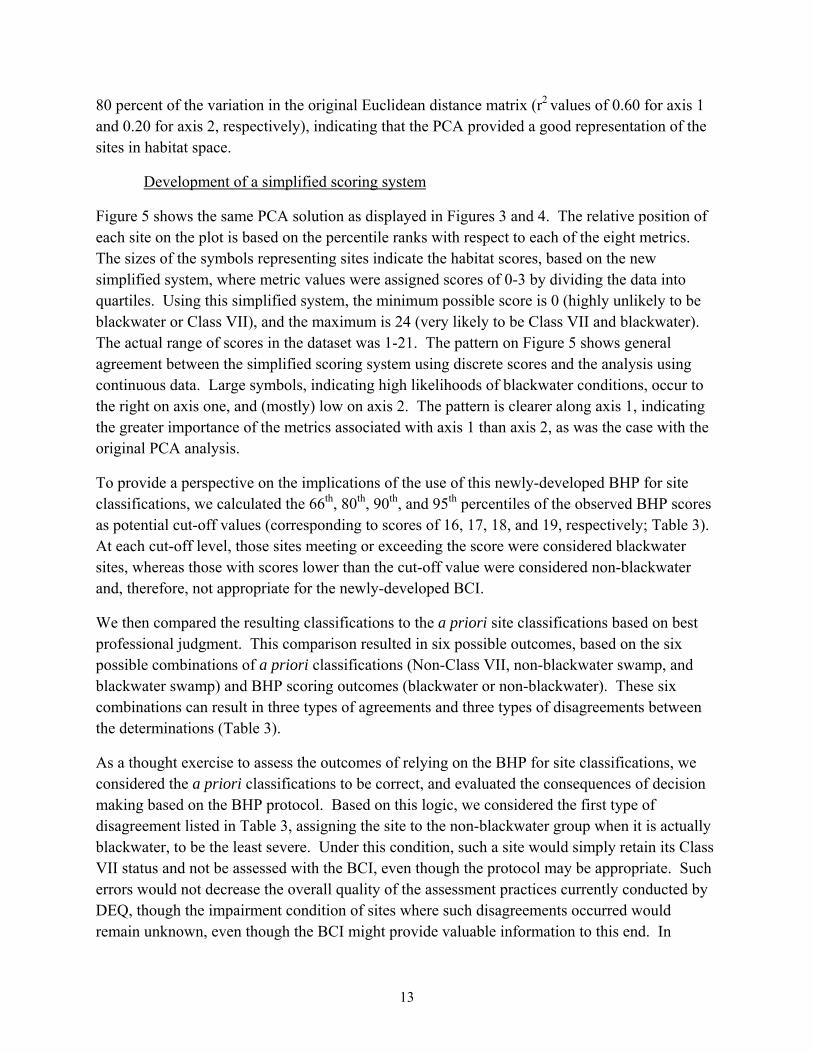
Development of a simplified scoring system
Figure 5 shows the same PCA solution as displayed in Figures 3 and 4. The relative position of each site on the plot is based on the percentile ranks with respect to each of the eight metrics. The sizes of the symbols representing sites indicate the habitat scores, based on the new simplified system, where metric values were assigned scores of 0-3 by dividing the data into quartiles. Using this simplified system, the minimum possible score is 0 (highly unlikely to be blackwater or Class VII), and the maximum is 24 (very likely to be Class VII and blackwater). The actual range of scores in the dataset was 1-21. The pattern on Figure 5 shows general agreement between the simplified scoring system using discrete scores and the analysis using continuous data. Large symbols, indicating high likelihoods of blackwater conditions, occur to the right on axis one, and (mostly) low on axis 2. The pattern is clearer along axis 1, indicating the greater importance of the metrics associated with axis 1 than axis 2, as was the case with the original PCA analysis.
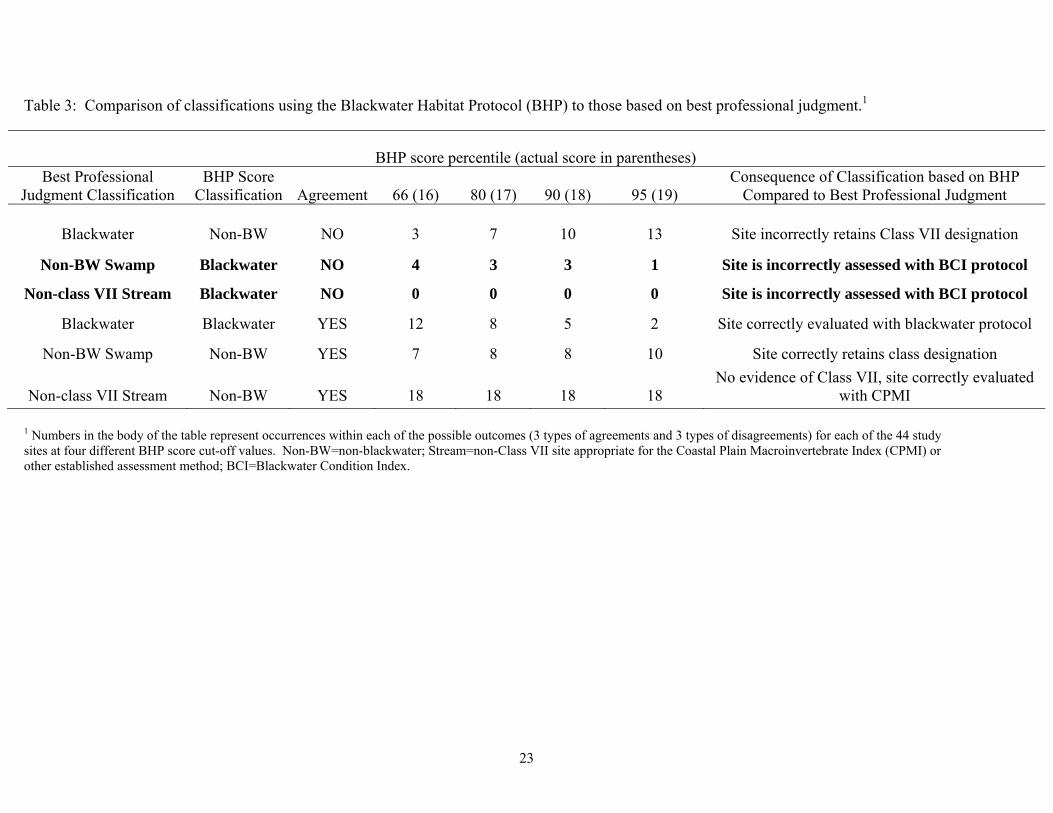
To provide a perspective on the implications of the use of this newly-developed BHP for site classifications, we calculated the 66th, 80th, 90th, and 95th percentiles of the observed BHP scores as potential cut-off values (corresponding to scores of 16, 17, 18, and 19, respectively; Table 3). At each cut-off level, those sites meeting or exceeding the score were considered blackwater sites, whereas those with scores lower than the cut-off value were considered non-blackwater and, therefore, not appropriate for the newly-developed BCI.
We then compared the resulting classifications to the a priori site classifications based on best professional judgment. This comparison resulted in six possible outcomes, based on the six possible combinations of a priori classifications (Non-Class VII, non-blackwater swamp, and blackwater swamp) and BHP scoring outcomes (blackwater or non-blackwater). These six combinations can result in three types of agreements and three types of disagreements between the determinations (Table 3).
As a thought exercise to assess the outcomes of relying on the BHP for site classifications, we considered the a priori classifications to be correct, and evaluated the consequences of decision making based on the BHP protocol. Based on this logic, we considered the first type of disagreement listed in Table 3, assigning the site to the non-blackwater group when it is actually blackwater, to be the least severe. Under this condition, such a site would simply retain its Class VII status and not be assessed with the BCI, even though the protocol may be appropriate. Such errors would not decrease the overall quality of the assessment practices currently conducted by DEQ, though the impairment condition of sites where such disagreements occurred would remain unknown, even though the BCI might provide valuable information to this end. In
14
contrast, the two remaining types of disagreement—assigning non-Class VII sites or non-blackwater sites to the blackwater class—would result in the use of an inappropriate biological assessment technique to evaluate the site if the decision maker relied solely on the BHP for classification.
At all four cut-off levels, the BHP and a priori, best-professional judgment classifications agreed 100 percent of the time when the sites were considered non-Class VII systems. This result is important because it indicates that the BHP is not likely to provide information that suggests sites that may otherwise be assessed with established protocols should instead be assigned to the Class VII designation. At the 66th percentile cut-off (BHP score of 16), 12 sites were assigned to the blackwater category using both best professional judgment and the BHP score; however, four sites were assigned to the blackwater category using the BHP score, whereas best professional judgment indicated that they should be classified as non-blackwater. The number of disagreements where the BHP score indicated blackwater conditions was reduced to three for the 80th and 90th percentile cut-offs and to one at the 95th, but at a cost of only eight sites being assigned to the blackwater group in agreement with the a priori classifications at the 80th percentile, five sites at the 90th percentile, and only two (out of a total of 16 initially considered blackwater) at the 95th percentile. If the cutoff value is reduced below a score of 16 index, performance is poor. At a score of 15 the single site attaining this score would be misclassified, and at 14, two of four sites would be misclassified.
Figure 6 shows the PCA solution with the site classifications derived from the BHP 66th percentile cut-off (score of 16/24) and highlights the four sites where the classification indicated blackwater conditions, but the field biologists classified the sites as non-blackwater. Of these sites where disagreements occurred, the three sites located centrally on axis 2 of the plot were sites located in the Chowan River watershed. Whereas the field biologists chose the designation of non-blackwater swamp for these three sites, it was noted that conditions were marginal between the blackwater and non-blackwater classifications. In contrast, the site located at the upper right corner of the plot (upper Dragon Run, in the Piankatank River watershed) represents a more egregious disagreement. This site was classified as blackwater by the BHP even at the highest cutoff value, as the BHP score was 19, placing it at the 95th percentile of score values. Whereas the overall site score indicates blackwater conditions, water at the site was only very slightly stained with tannins, and the blackwater-characteristic tree species water tupelo (Nyssa aquatica) and baldcypress (Taxodium distichum) were completely absent from the site, with the dominant tree species being smooth alder (Alnus serrulata). The riparian forest around the stream system appeared intact and undisturbed, with no obvious sources of impairment for at least 500m from the wetted channel. Therefore, we would have expected at least one of the two blackwater-characteristic tree species to be present, and for the stream water to be more darkly stained if the site were a true blackwater system. Like the other blackwater sites, the Dragon Run site was located to the far right on axis 1 of the PCA plot, but unlike the other sites, it was located very high on axis 2, though it was still assigned to the blackwater classification using the

15
BHP. This position on the ordination plot again indicates the greater relative importance of the habitat metrics associated with axis 1 in the overall classifications.
Preliminary GIS analysis
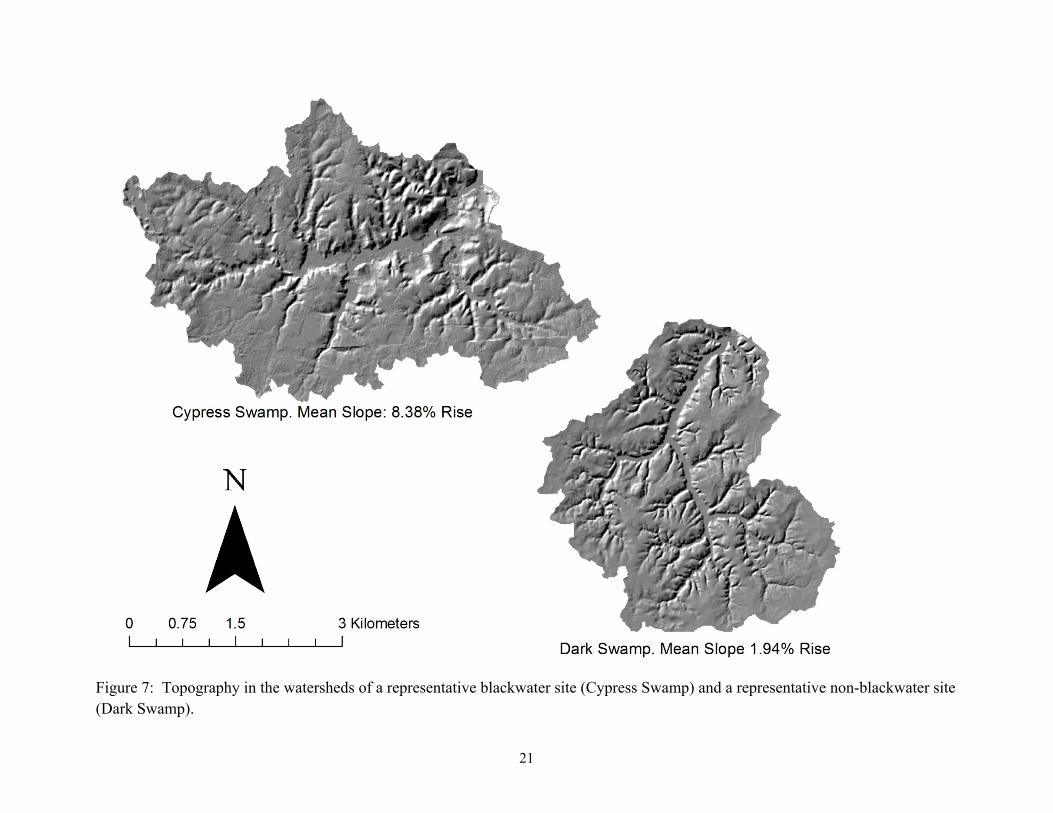
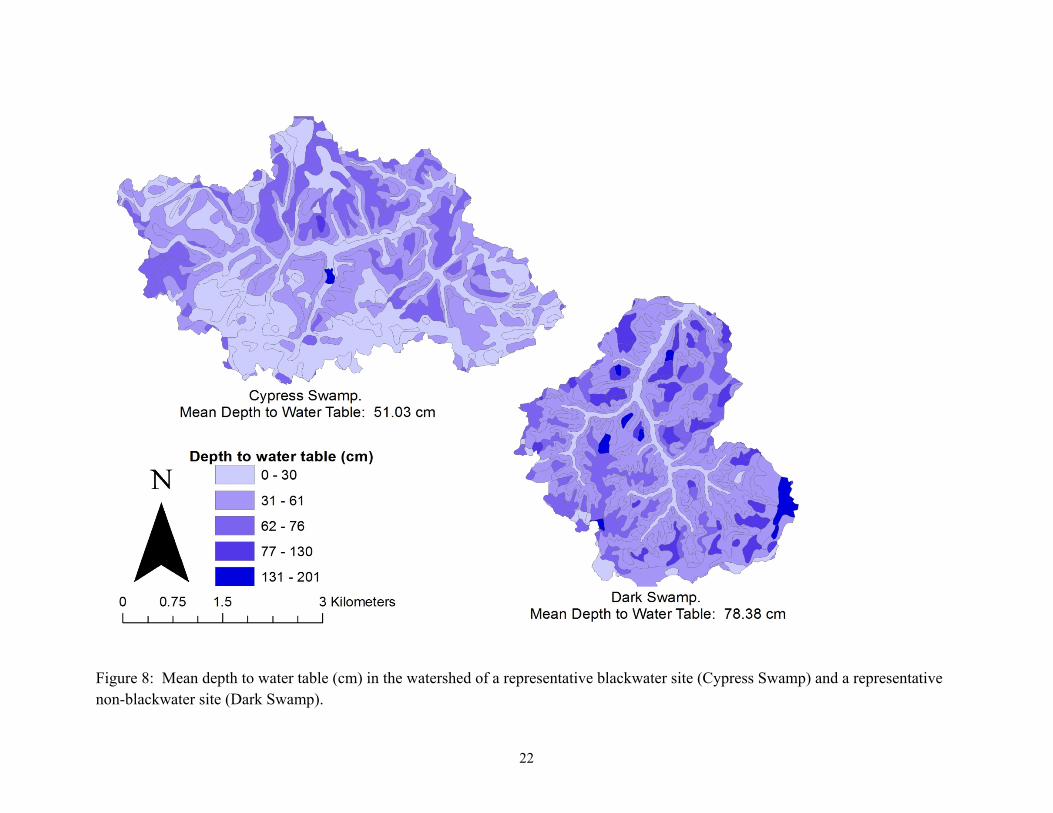
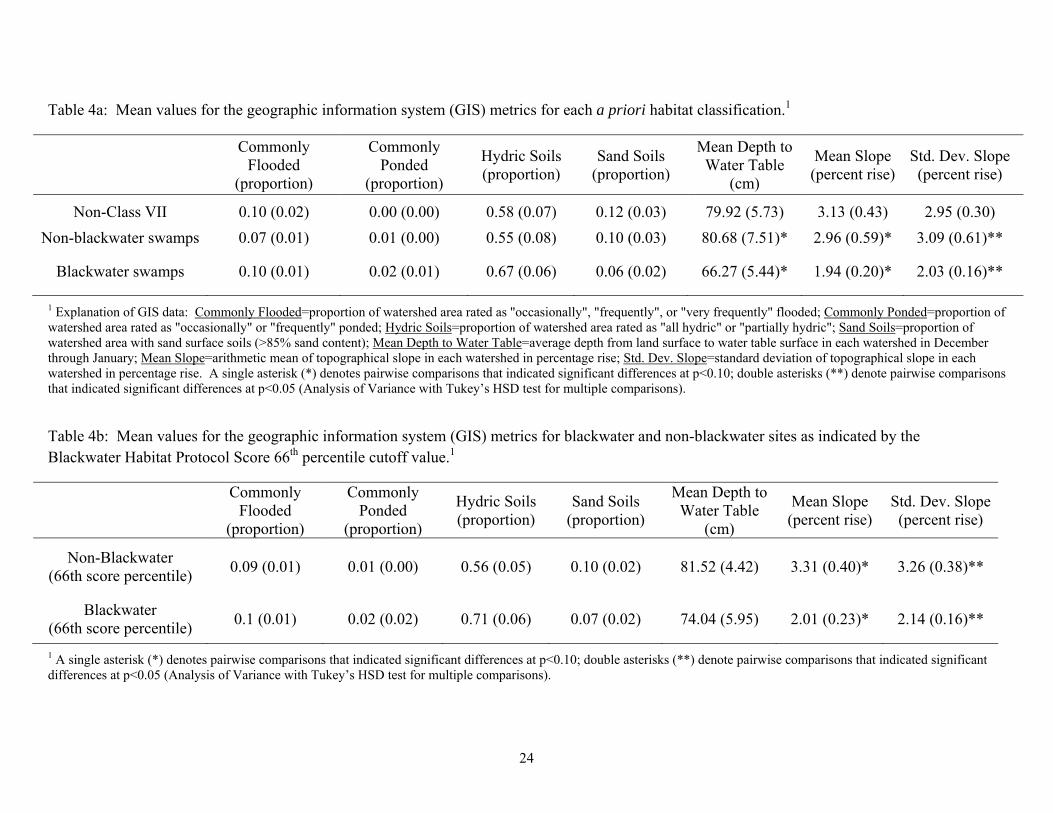
We analyzed seven GIS-derived metrics associated with watershed topography, soil texture, and soil hydrology (see Table 4a and Appendix A for explanations of each GIS metric). Of these, the standard deviation of slope (a measure of slope variability or basin roughness) appeared to be the most effective for site classification. Significant differences for the metric occurred among site classification groups, both in the case of the a priori classification and when the BHP was employed (ANOVA, p<0.05, Tables 4a and 4b). In the case of the a priori classifications, multiple comparisons via Tukey’s Honestly Significant Difference (HSD) test indicated a significantly higher standard deviation of slope in the non-blackwater swamp watersheds than in the blackwater swamp watersheds at p<0.05, but no significant differences between swamp watersheds and non-Class VII watersheds occurred (Table 4a, Fig. 7). Mean watershed slope and mean depth to the water table (expected depths in December – January) showed a similar pattern—mean values were lower in blackwater swamps than in non-blackwater swamps, but no difference occurred between the swamp watersheds and non-Class VII watersheds. The differences with respect to mean slope and mean depth to water table were only significant at p=0.07 (Tables 4a and 4b, Figs. 7 and 8). The remaining metrics observed (proportions of watersheds that were commonly flooded or ponded, occupied by hydric soils or by sandy soils) showed no significant differences among the site classifications (p>0.10, Tables 4a and 4b).
16
Figure 2: Ordination of the 44 study sites by 18 habitat metrics. Sites are symbolized according to their a priori-assigned classification based on best professional judgment.
17
Figure 3: Ordination of the 44 study sites by the eight core habitat metrics. Sites are symbolized according to their a priori-assigned classification based on best professional judgment. Arrows show the direction of correlations between the listed habitat metrics and the ordination axes.
18
Figure 4: Ordination of the 44 study sites by the eight core habitat metrics. Sites are symbolized according to the major river watershed within which each occurs. Arrows show the direction of correlations between the listed habitat metrics and the ordination axes.

19
Figure 5: Ordination of the 44 study sites by the eight core habitat metrics. The size of the site symbols represents their score, based on the discrete, quartile-based scoring system. Larger symbols exhibit a greater potential of blackwater conditions.

20
Figure 6: Ordination of the 44 study sites by the eight core habitat metrics. Sites are symbolized based on their classification according to the Blackwater Habitat Protocol (BHP) at the 66th percentile cut-off value. Ovals indicate sites where the BHP classification indicated blackwater conditions, but the a priori site classification did not.
21
Figure 7: Topography in the watersheds of a representative blackwater site (Cypress Swamp) and a representative non-blackwater site (Dark Swamp).
22
Figure 8: Mean depth to water table (cm) in the watershed of a representative blackwater site (Cypress Swamp) and a representative non-blackwater site (Dark Swamp).
23
Table 3: Comparison of classifications using the Blackwater Habitat Protocol (BHP) to those based on best professional judgment.1
1 Numbers in the body of the table represent occurrences within each of the possible outcomes (3 types of agreements and 3 types of disagreements) for each of the 44 study sites at four different BHP score cut-off values. Non-BW=non-blackwater; Stream=non-Class VII site appropriate for the Coastal Plain Macroinvertebrate Index (CPMI) or other established assessment method; BCI=Blackwater Condition Index.
BHP score percentile (actual score in parentheses) Best Professional
Judgment Classification BHP Score
Classification Agreement 66 (16) 80 (17) 90 (18) 95 (19) Consequence of Classification based on BHP
Compared to Best Professional Judgment
Blackwater Non-BW NO 3 7 10 13 Site incorrectly retains Class VII designation
Non-BW Swamp Blackwater NO 4 3 3 1 Site is incorrectly assessed with BCI protocol
Non-class VII Stream Blackwater NO 0 0 0 0 Site is incorrectly assessed with BCI protocol
Blackwater Blackwater YES 12 8 5 2 Site correctly evaluated with blackwater protocol
Non-BW Swamp Non-BW YES 7 8 8 10 Site correctly retains class designation
Non-class VII Stream Non-BW YES 18 18 18 18 No evidence of Class VII, site correctly evaluated
with CPMI
24
Table 4a: Mean values for the geographic information system (GIS) metrics for each a priori habitat classification.1
Commonly
Flooded (proportion)
Commonly Ponded
(proportion)
Hydric Soils (proportion)
Sand Soils (proportion)
Mean Depth to Water Table
(cm)
Mean Slope (percent rise)
Std. Dev. Slope (percent rise)
Non-Class VII 0.10 (0.02) 0.00 (0.00) 0.58 (0.07) 0.12 (0.03) 79.92 (5.73) 3.13 (0.43) 2.95 (0.30)
Non-blackwater swamps 0.07 (0.01) 0.01 (0.00) 0.55 (0.08) 0.10 (0.03) 80.68 (7.51)* 2.96 (0.59)* 3.09 (0.61)**
Blackwater swamps 0.10 (0.01) 0.02 (0.01) 0.67 (0.06) 0.06 (0.02) 66.27 (5.44)* 1.94 (0.20)* 2.03 (0.16)**
1 Explanation of GIS data: Commonly Flooded=proportion of watershed area rated as "occasionally", "frequently", or "very frequently" flooded; Commonly Ponded=proportion of watershed area rated as "occasionally" or "frequently" ponded; Hydric Soils=proportion of watershed area rated as "all hydric" or "partially hydric"; Sand Soils=proportion of watershed area with sand surface soils (>85% sand content); Mean Depth to Water Table=average depth from land surface to water table surface in each watershed in December through January; Mean Slope=arithmetic mean of topographical slope in each watershed in percentage rise; Std. Dev. Slope=standard deviation of topographical slope in each watershed in percentage rise. A single asterisk (*) denotes pairwise comparisons that indicated significant differences at p<0.10; double asterisks (**) denote pairwise comparisons that indicated significant differences at p<0.05 (Analysis of Variance with Tukey’s HSD test for multiple comparisons).
Table 4b: Mean values for the geographic information system (GIS) metrics for blackwater and non-blackwater sites as indicated by the Blackwater Habitat Protocol Score 66th percentile cutoff value.1
Commonly
Flooded (proportion)
Commonly Ponded
(proportion)
Hydric Soils (proportion)
Sand Soils (proportion)
Mean Depth to Water Table
(cm)
Mean Slope (percent rise)
Std. Dev. Slope (percent rise)
Non-Blackwater (66th score percentile)
0.09 (0.01) 0.01 (0.00) 0.56 (0.05) 0.10 (0.02) 81.52 (4.42) 3.31 (0.40)* 3.26 (0.38)**
Blackwater (66th score percentile)
0.1 (0.01) 0.02 (0.02) 0.71 (0.06) 0.07 (0.02) 74.04 (5.95) 2.01 (0.23)* 2.14 (0.16)**
1 A single asterisk (*) denotes pairwise comparisons that indicated significant differences at p<0.10; double asterisks (**) denote pairwise comparisons that indicated significant differences at p<0.05 (Analysis of Variance with Tukey’s HSD test for multiple comparisons).
25
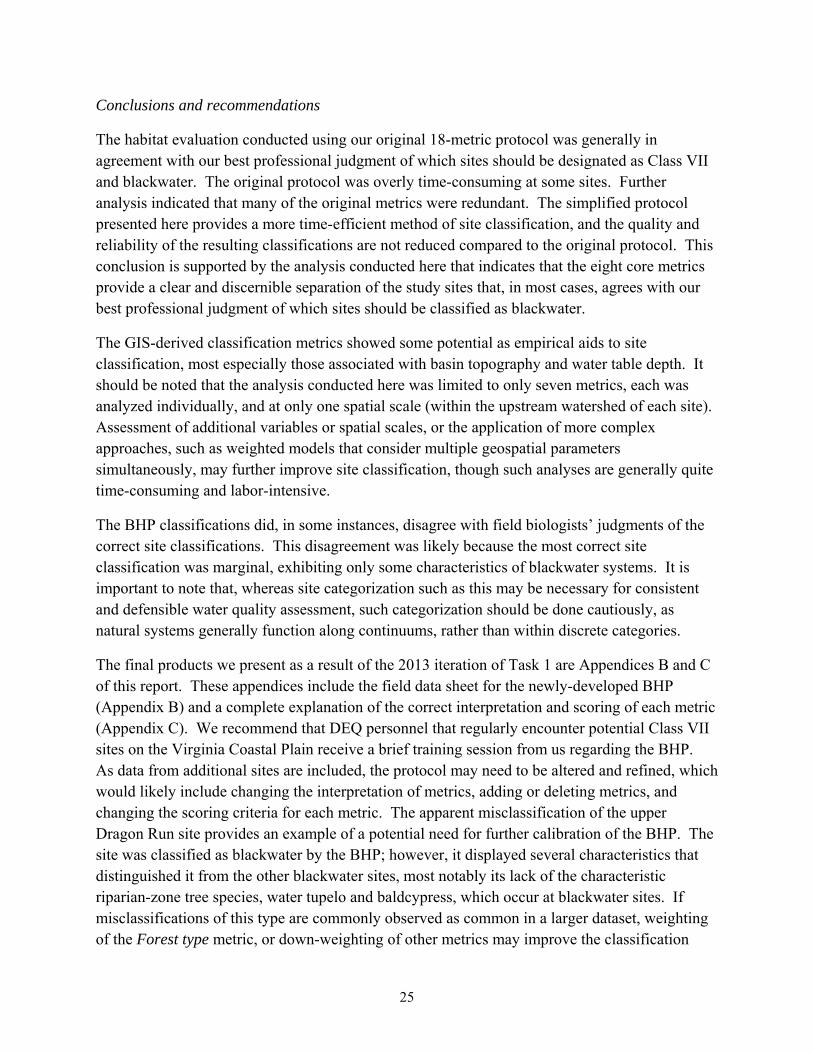
Conclusions and recommendations
The habitat evaluation conducted using our original 18-metric protocol was generally in agreement with our best professional judgment of which sites should be designated as Class VII and blackwater. The original protocol was overly time-consuming at some sites. Further analysis indicated that many of the original metrics were redundant. The simplified protocol presented here provides a more time-efficient method of site classification, and the quality and reliability of the resulting classifications are not reduced compared to the original protocol. This conclusion is supported by the analysis conducted here that indicates that the eight core metrics provide a clear and discernible separation of the study sites that, in most cases, agrees with our best professional judgment of which sites should be classified as blackwater.
The GIS-derived classification metrics showed some potential as empirical aids to site classification, most especially those associated with basin topography and water table depth. It should be noted that the analysis conducted here was limited to only seven metrics, each was analyzed individually, and at only one spatial scale (within the upstream watershed of each site). Assessment of additional variables or spatial scales, or the application of more complex approaches, such as weighted models that consider multiple geospatial parameters simultaneously, may further improve site classification, though such analyses are generally quite time-consuming and labor-intensive.
The BHP classifications did, in some instances, disagree with field biologists’ judgments of the correct site classifications. This disagreement was likely because the most correct site classification was marginal, exhibiting only some characteristics of blackwater systems. It is important to note that, whereas site categorization such as this may be necessary for consistent and defensible water quality assessment, such categorization should be done cautiously, as natural systems generally function along continuums, rather than within discrete categories.
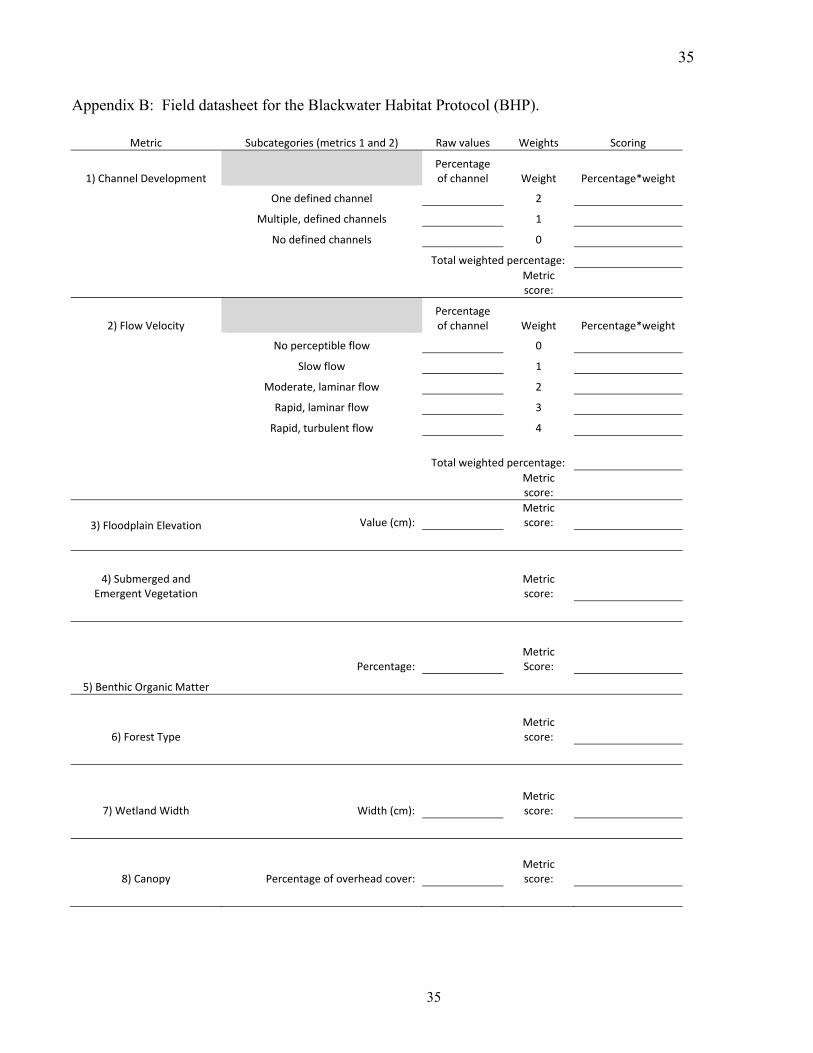
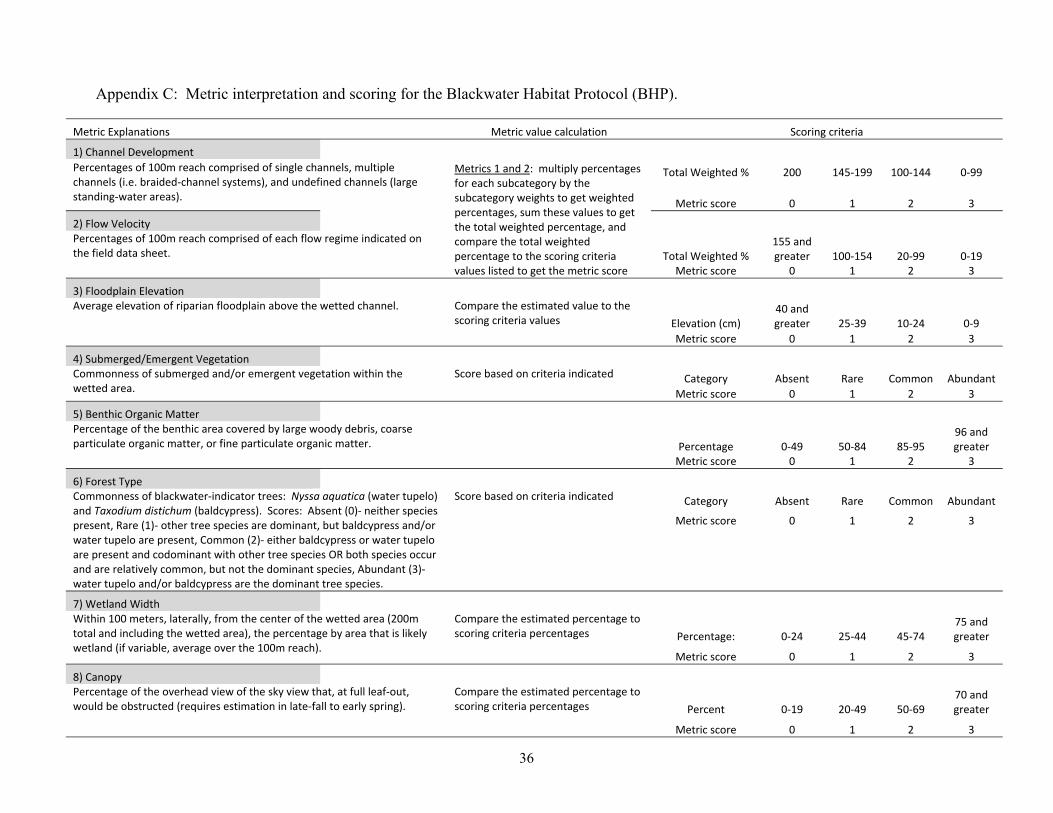
The final products we present as a result of the 2013 iteration of Task 1 are Appendices B and C of this report. These appendices include the field data sheet for the newly-developed BHP (Appendix B) and a complete explanation of the correct interpretation and scoring of each metric (Appendix C). We recommend that DEQ personnel that regularly encounter potential Class VII sites on the Virginia Coastal Plain receive a brief training session from us regarding the BHP. As data from additional sites are included, the protocol may need to be altered and refined, which would likely include changing the interpretation of metrics, adding or deleting metrics, and changing the scoring criteria for each metric. The apparent misclassification of the upper Dragon Run site provides an example of a potential need for further calibration of the BHP. The site was classified as blackwater by the BHP; however, it displayed several characteristics that distinguished it from the other blackwater sites, most notably its lack of the characteristic riparian-zone tree species, water tupelo and baldcypress, which occur at blackwater sites. If misclassifications of this type are commonly observed as common in a larger dataset, weighting of the Forest type metric, or down-weighting of other metrics may improve the classification

26
scheme. Further analysis should also focus on the biological relevance of the habitat metrics considered here: that is, those characteristics of Coastal Plain systems that can most reliably predict the structure and functioning of faunal communities, and therefore be most reliably used as natural covariates in the choice and application of biological assessment protocols.
Most importantly, the limitations of this protocol highlight the importance of best professional judgment in the classification process. The judgment of experienced biologists should be considered the primary tool for classification, with structured protocols such as this used as decision support tools used to supplement site classification and selection of the most appropriate methods for assessment.
27
Task 2 Blackwater Condition Index
Methods and Results
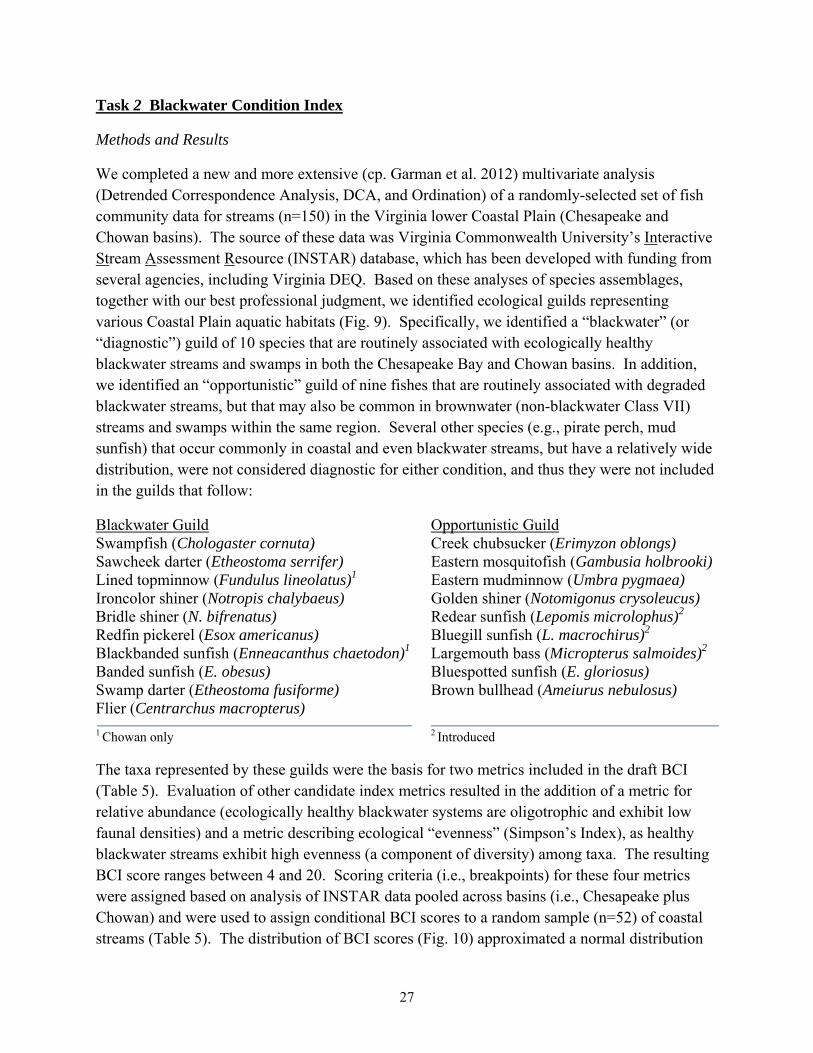
We completed a new and more extensive (cp. Garman et al. 2012) multivariate analysis (Detrended Correspondence Analysis, DCA, and Ordination) of a randomly-selected set of fish community data for streams (n=150) in the Virginia lower Coastal Plain (Chesapeake and Chowan basins). The source of these data was Virginia Commonwealth University’s Interactive Stream Assessment Resource (INSTAR) database, which has been developed with funding from several agencies, including Virginia DEQ. Based on these analyses of species assemblages, together with our best professional judgment, we identified ecological guilds representing various Coastal Plain aquatic habitats (Fig. 9). Specifically, we identified a “blackwater” (or “diagnostic”) guild of 10 species that are routinely associated with ecologically healthy blackwater streams and swamps in both the Chesapeake Bay and Chowan basins. In addition, we identified an “opportunistic” guild of nine fishes that are routinely associated with degraded blackwater streams, but that may also be common in brownwater (non-blackwater Class VII) streams and swamps within the same region. Several other species (e.g., pirate perch, mud sunfish) that occur commonly in coastal and even blackwater streams, but have a relatively wide distribution, were not considered diagnostic for either condition, and thus they were not included in the guilds that follow:
Blackwater Guild Opportunistic Guild Swampfish (Chologaster cornuta) Creek chubsucker (Erimyzon oblongs) Sawcheek darter (Etheostoma serrifer) Eastern mosquitofish (Gambusia holbrooki) Lined topminnow (Fundulus lineolatus)1 Eastern mudminnow (Umbra pygmaea) Ironcolor shiner (Notropis chalybaeus) Golden shiner (Notomigonus crysoleucus) Bridle shiner (N. bifrenatus) Redear sunfish (Lepomis microlophus)2
Redfin pickerel (Esox americanus) Bluegill sunfish (L. macrochirus)2
Blackbanded sunfish (Enneacanthus chaetodon)1 Largemouth bass (Micropterus salmoides)2
Banded sunfish (E. obesus) Bluespotted sunfish (E. gloriosus) Swamp darter (Etheostoma fusiforme) Brown bullhead (Ameiurus nebulosus) Flier (Centrarchus macropterus) 1 Chowan only 2 Introduced
The taxa represented by these guilds were the basis for two metrics included in the draft BCI (Table 5). Evaluation of other candidate index metrics resulted in the addition of a metric for relative abundance (ecologically healthy blackwater systems are oligotrophic and exhibit low faunal densities) and a metric describing ecological “evenness” (Simpson’s Index), as healthy blackwater streams exhibit high evenness (a component of diversity) among taxa. The resulting BCI score ranges between 4 and 20. Scoring criteria (i.e., breakpoints) for these four metrics were assigned based on analysis of INSTAR data pooled across basins (i.e., Chesapeake plus Chowan) and were used to assign conditional BCI scores to a random sample (n=52) of coastal streams (Table 5). The distribution of BCI scores (Fig. 10) approximated a normal distribution
28
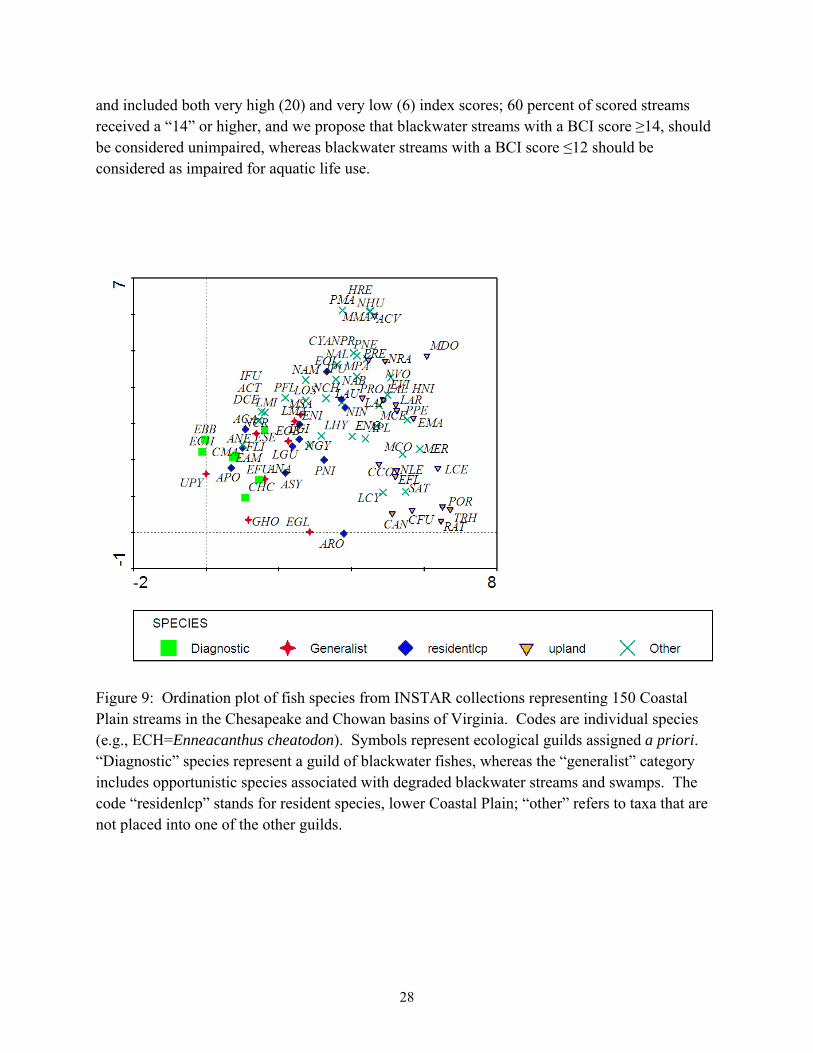
and included both very high (20) and very low (6) index scores; 60 percent of scored streams received a “14” or higher, and we propose that blackwater streams with a BCI score ≥14, should be considered unimpaired, whereas blackwater streams with a BCI score ≤12 should be considered as impaired for aquatic life use.
Figure 9: Ordination plot of fish species from INSTAR collections representing 150 Coastal Plain streams in the Chesapeake and Chowan basins of Virginia. Codes are individual species (e.g., ECH=Enneacanthus cheatodon). Symbols represent ecological guilds assigned a priori. “Diagnostic” species represent a guild of blackwater fishes, whereas the “generalist” category includes opportunistic species associated with degraded blackwater streams and swamps. The code “residenlcp” stands for resident species, lower Coastal Plain; “other” refers to taxa that are not placed into one of the other guilds.
29
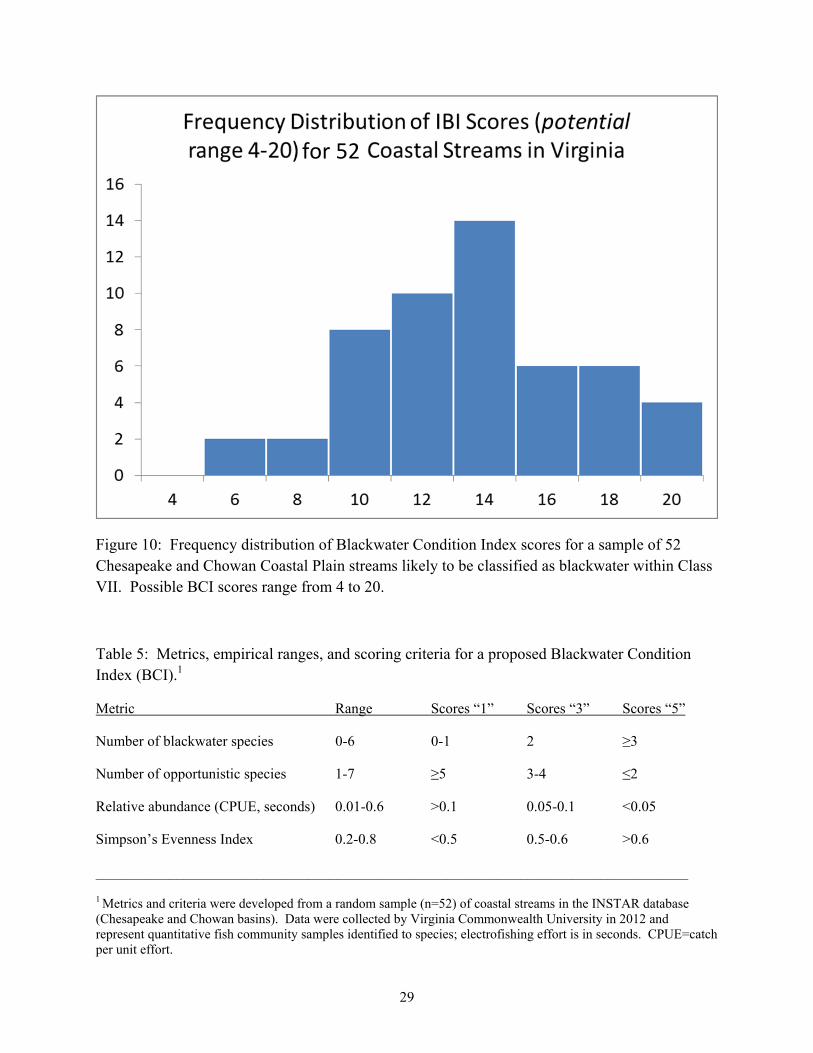
Figure 10: Frequency distribution of Blackwater Condition Index scores for a sample of 52 Chesapeake and Chowan Coastal Plain streams likely to be classified as blackwater within Class VII. Possible BCI scores range from 4 to 20.
Table 5: Metrics, empirical ranges, and scoring criteria for a proposed Blackwater Condition Index (BCI).1
Metric Range Scores “1” Scores “3” Scores “5”
Number of blackwater species 0-6 0-1 2 ≥3
Number of opportunistic species 1-7 ≥5 3-4 ≤2
Relative abundance (CPUE, seconds) 0.01-0.6 >0.1 0.05-0.1 <0.05
Simpson’s Evenness Index 0.2-0.8 <0.5 0.5-0.6 >0.6
_________________________________________________________________________________
1 Metrics and criteria were developed from a random sample (n=52) of coastal streams in the INSTAR database (Chesapeake and Chowan basins). Data were collected by Virginia Commonwealth University in 2012 and represent quantitative fish community samples identified to species; electrofishing effort is in seconds. CPUE=catch per unit effort.
for 52

30
Conclusions and Recommendations
The analyses presented in this report suggest that a simple Blackwater Condition Index (BCI), based on analysis of fish community guilds, is able to accurately determine impairment of blackwater (Class VII) streams and swamps in Virginia. Furthermore, a rapid field protocol, based on non-biological measures, was successful in separating blackwater and non-blackwater streams within the Virginia Coastal Zone. We believe that a combination of both analyses should be validated as a potential assessment protocol for Class VII waters, and for blackwater streams specifically. We believe that such an approach has several advantages, including the ability to leverage extensive and expanding biological databases (INSTAR, DEQ ProbMon) for the region and the ability to conduct real-time stream assessments by appropriately trained DEQ personnel. Our recommendations for next steps include:
1.) Presentations of the proposed blackwater indices to DEQ biologists at their annual meeting on June 21, 2013 (on the agenda) and revisions to both assessment tools based on those discussions;
2.) Test the relative performance of the Habitat (Task 1) and BCI (Task 2) tools on the same dataset of coastal streams;
3.) Validate the blackwater models with an independent set of non-biological variables (cp. Virginia Stream Condition Index).
References
Garman, G.C., L.A. Smock, and A.L. Garey. 2012. Development of Aquatic Life Use Assessment Protocols for Class VII Waters in Virginia. Report of the Academic Advisory Committee for Virginia Department of Environmental Quality. SR52-2012. Virginia Water Resources Research Center, Blacksburg, Va., U.S.A. http://vwrrc.vt.edu/special_reports.html (accessed 9/5/2013). McCune, B. and M. J. Mefford. 2006. PC-ORD. Multivariate Analysis of Ecological Data. Version 6. MjM Software, Gleneden Beach, Ore., U.S.A. Pont, D., R. Hughes, T. Whittier, and S. Stephan. 2009. A predictive index of biotic integrity model for aquatic vertebrate assemblages of western U.S. streams. Transactions of the American Fisheries Society 138: 292-305. R Core Team. 2012. R: A language and environment for statistical computing. R Foundation for Statistical Computing, Vienna, Austria. ISBN 3-900051-07-0, URL http://www.R-project.org/ (accessed 9/5/2013).
31
Appendices
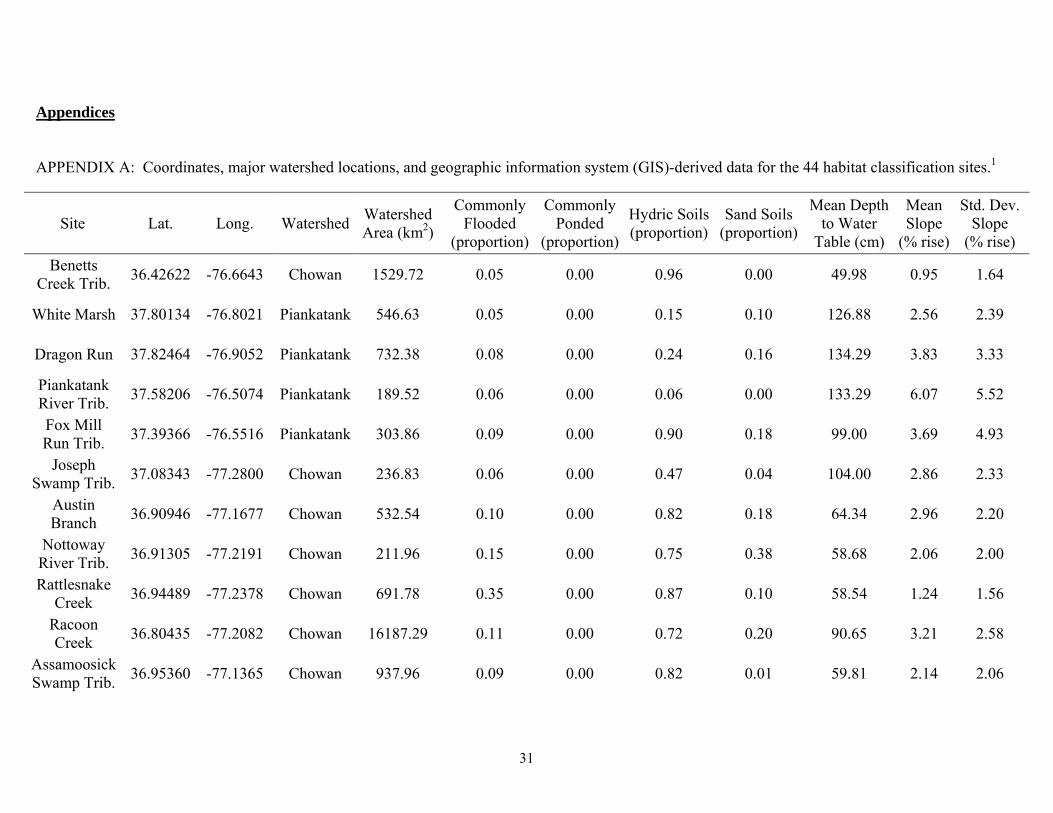
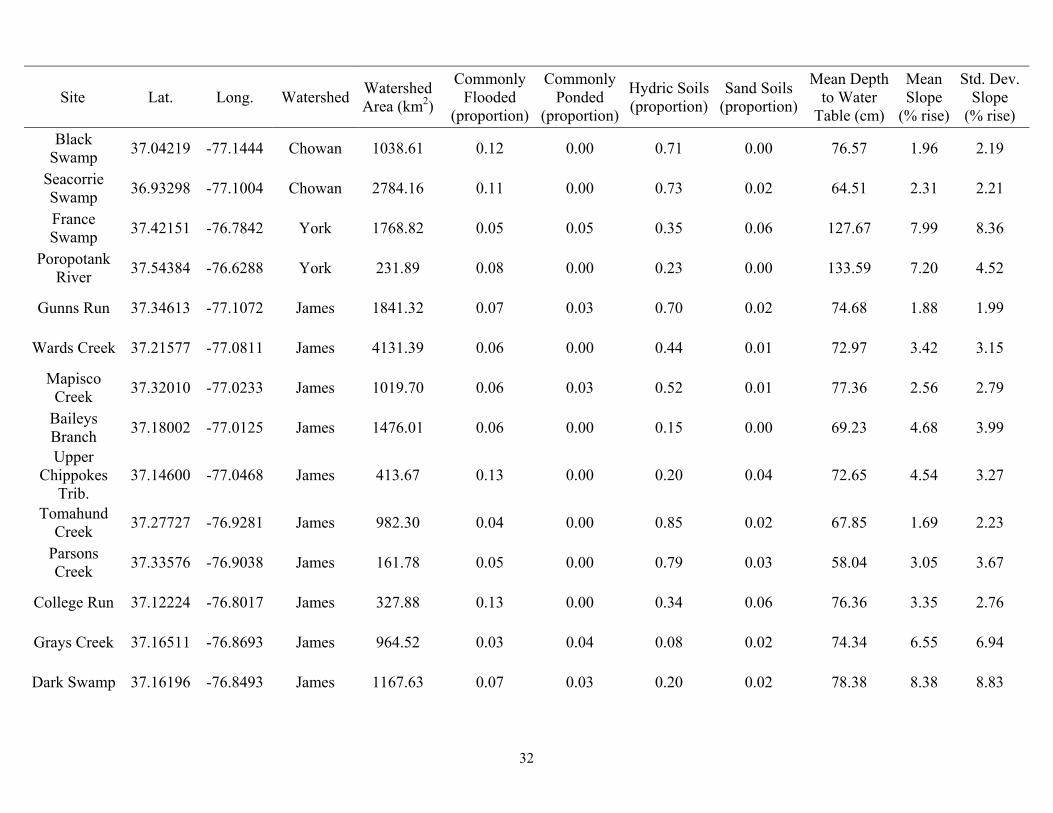
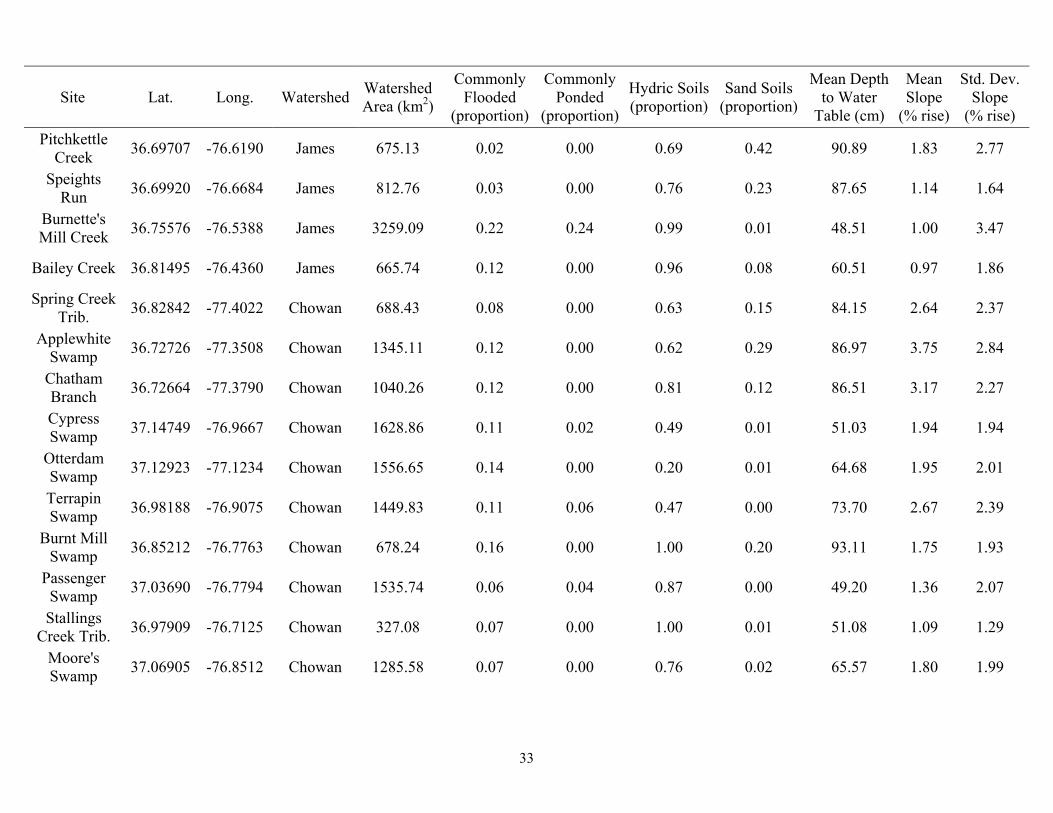
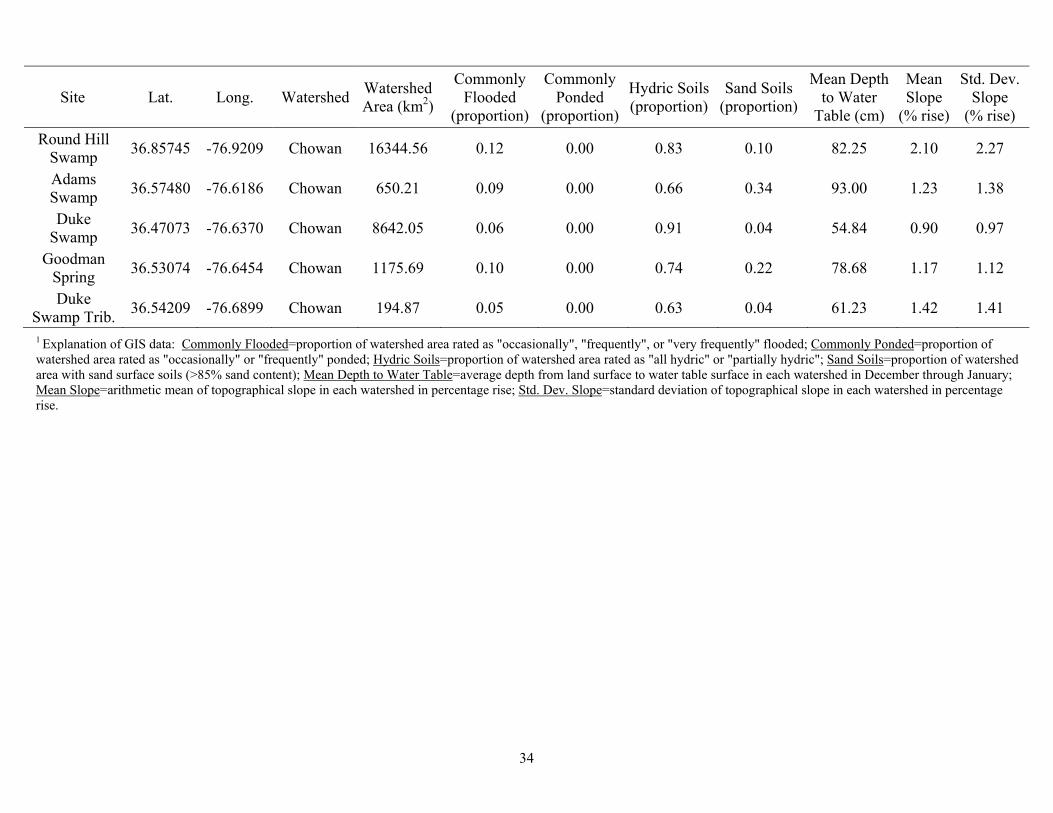
APPENDIX A: Coordinates, major watershed locations, and geographic information system (GIS)-derived data for the 44 habitat classification sites.1
Site Lat. Long. Watershed Watershed Area (km2)
Commonly Flooded
(proportion)
Commonly Ponded
(proportion)
Hydric Soils (proportion)
Sand Soils (proportion)
Mean Depth to Water
Table (cm)
Mean Slope
(% rise)
Std. Dev. Slope
(% rise)
Benetts Creek Trib.
36.42622 -76.6643 Chowan 1529.72 0.05 0.00 0.96 0.00 49.98 0.95 1.64
White Marsh 37.80134 -76.8021 Piankatank 546.63 0.05 0.00 0.15 0.10 126.88 2.56 2.39
Dragon Run 37.82464 -76.9052 Piankatank 732.38 0.08 0.00 0.24 0.16 134.29 3.83 3.33
Piankatank River Trib.
37.58206 -76.5074 Piankatank 189.52 0.06 0.00 0.06 0.00 133.29 6.07 5.52
Fox Mill Run Trib.
37.39366 -76.5516 Piankatank 303.86 0.09 0.00 0.90 0.18 99.00 3.69 4.93
Joseph Swamp Trib.
37.08343 -77.2800 Chowan 236.83 0.06 0.00 0.47 0.04 104.00 2.86 2.33
Austin Branch
36.90946 -77.1677 Chowan 532.54 0.10 0.00 0.82 0.18 64.34 2.96 2.20
Nottoway River Trib.
36.91305 -77.2191 Chowan 211.96 0.15 0.00 0.75 0.38 58.68 2.06 2.00
Rattlesnake Creek
36.94489 -77.2378 Chowan 691.78 0.35 0.00 0.87 0.10 58.54 1.24 1.56
Racoon Creek
36.80435 -77.2082 Chowan 16187.29 0.11 0.00 0.72 0.20 90.65 3.21 2.58
Assamoosick Swamp Trib.
36.95360 -77.1365 Chowan 937.96 0.09 0.00 0.82 0.01 59.81 2.14 2.06
32
Site Lat. Long. Watershed Watershed Area (km2)
Commonly Flooded
(proportion)
Commonly Ponded
(proportion)
Hydric Soils (proportion)
Sand Soils (proportion)
Mean Depth to Water
Table (cm)
Mean Slope
(% rise)
Std. Dev. Slope
(% rise)
Black Swamp
37.04219 -77.1444 Chowan 1038.61 0.12 0.00 0.71 0.00 76.57 1.96 2.19
Seacorrie Swamp
36.93298 -77.1004 Chowan 2784.16 0.11 0.00 0.73 0.02 64.51 2.31 2.21
France Swamp
37.42151 -76.7842 York 1768.82 0.05 0.05 0.35 0.06 127.67 7.99 8.36
Poropotank River
37.54384 -76.6288 York 231.89 0.08 0.00 0.23 0.00 133.59 7.20 4.52
Gunns Run 37.34613 -77.1072 James 1841.32 0.07 0.03 0.70 0.02 74.68 1.88 1.99
Wards Creek 37.21577 -77.0811 James 4131.39 0.06 0.00 0.44 0.01 72.97 3.42 3.15
Mapisco Creek
37.32010 -77.0233 James 1019.70 0.06 0.03 0.52 0.01 77.36 2.56 2.79
Baileys Branch
37.18002 -77.0125 James 1476.01 0.06 0.00 0.15 0.00 69.23 4.68 3.99
Upper Chippokes
Trib. 37.14600 -77.0468 James 413.67 0.13 0.00 0.20 0.04 72.65 4.54 3.27
Tomahund Creek
37.27727 -76.9281 James 982.30 0.04 0.00 0.85 0.02 67.85 1.69 2.23
Parsons Creek
37.33576 -76.9038 James 161.78 0.05 0.00 0.79 0.03 58.04 3.05 3.67
College Run 37.12224 -76.8017 James 327.88 0.13 0.00 0.34 0.06 76.36 3.35 2.76
Grays Creek 37.16511 -76.8693 James 964.52 0.03 0.04 0.08 0.02 74.34 6.55 6.94
Dark Swamp 37.16196 -76.8493 James 1167.63 0.07 0.03 0.20 0.02 78.38 8.38 8.83
33
Site Lat. Long. Watershed Watershed Area (km2)
Commonly Flooded
(proportion)
Commonly Ponded
(proportion)
Hydric Soils (proportion)
Sand Soils (proportion)
Mean Depth to Water
Table (cm)
Mean Slope
(% rise)
Std. Dev. Slope
(% rise)
Pitchkettle Creek
36.69707 -76.6190 James 675.13 0.02 0.00 0.69 0.42 90.89 1.83 2.77
Speights Run
36.69920 -76.6684 James 812.76 0.03 0.00 0.76 0.23 87.65 1.14 1.64
Burnette's Mill Creek
36.75576 -76.5388 James 3259.09 0.22 0.24 0.99 0.01 48.51 1.00 3.47
Bailey Creek 36.81495 -76.4360 James 665.74 0.12 0.00 0.96 0.08 60.51 0.97 1.86
Spring Creek Trib.
36.82842 -77.4022 Chowan 688.43 0.08 0.00 0.63 0.15 84.15 2.64 2.37
Applewhite Swamp
36.72726 -77.3508 Chowan 1345.11 0.12 0.00 0.62 0.29 86.97 3.75 2.84
Chatham Branch
36.72664 -77.3790 Chowan 1040.26 0.12 0.00 0.81 0.12 86.51 3.17 2.27
Cypress Swamp
37.14749 -76.9667 Chowan 1628.86 0.11 0.02 0.49 0.01 51.03 1.94 1.94
Otterdam Swamp
37.12923 -77.1234 Chowan 1556.65 0.14 0.00 0.20 0.01 64.68 1.95 2.01
Terrapin Swamp
36.98188 -76.9075 Chowan 1449.83 0.11 0.06 0.47 0.00 73.70 2.67 2.39
Burnt Mill Swamp
36.85212 -76.7763 Chowan 678.24 0.16 0.00 1.00 0.20 93.11 1.75 1.93
Passenger Swamp
37.03690 -76.7794 Chowan 1535.74 0.06 0.04 0.87 0.00 49.20 1.36 2.07
Stallings Creek Trib.
36.97909 -76.7125 Chowan 327.08 0.07 0.00 1.00 0.01 51.08 1.09 1.29
Moore's Swamp
37.06905 -76.8512 Chowan 1285.58 0.07 0.00 0.76 0.02 65.57 1.80 1.99
34
Site Lat. Long. Watershed Watershed Area (km2)
Commonly Flooded
(proportion)
Commonly Ponded
(proportion)
Hydric Soils (proportion)
Sand Soils (proportion)
Mean Depth to Water
Table (cm)
Mean Slope
(% rise)
Std. Dev. Slope
(% rise)
Round Hill Swamp
36.85745 -76.9209 Chowan 16344.56 0.12 0.00 0.83 0.10 82.25 2.10 2.27
Adams Swamp
36.57480 -76.6186 Chowan 650.21 0.09 0.00 0.66 0.34 93.00 1.23 1.38
Duke Swamp
36.47073 -76.6370 Chowan 8642.05 0.06 0.00 0.91 0.04 54.84 0.90 0.97
Goodman Spring
36.53074 -76.6454 Chowan 1175.69 0.10 0.00 0.74 0.22 78.68 1.17 1.12
Duke Swamp Trib.
36.54209 -76.6899 Chowan 194.87 0.05 0.00 0.63 0.04 61.23 1.42 1.41
1 Explanation of GIS data: Commonly Flooded=proportion of watershed area rated as "occasionally", "frequently", or "very frequently" flooded; Commonly Ponded=proportion of watershed area rated as "occasionally" or "frequently" ponded; Hydric Soils=proportion of watershed area rated as "all hydric" or "partially hydric"; Sand Soils=proportion of watershed area with sand surface soils (>85% sand content); Mean Depth to Water Table=average depth from land surface to water table surface in each watershed in December through January; Mean Slope=arithmetic mean of topographical slope in each watershed in percentage rise; Std. Dev. Slope=standard deviation of topographical slope in each watershed in percentage rise.
35
35
Appendix B: Field datasheet for the Blackwater Habitat Protocol (BHP).
Metric Subcategories (metrics 1 and 2) Raw values Weights Scoring
1) Channel Development Percentage of channel Weight Percentage*weight
One defined channel 2
Multiple, defined channels 1
No defined channels 0
Total weighted percentage:
Metric score:
2) Flow Velocity Percentage of channel Weight Percentage*weight
No perceptible flow 0
Slow flow 1
Moderate, laminar flow 2
Rapid, laminar flow 3
Rapid, turbulent flow 4
Total weighted percentage:
Metric score:
3) Floodplain Elevation Value (cm): Metric score:
4) Submerged and Emergent Vegetation
Metric score:
5) Benthic Organic Matter
Percentage: Metric Score:
6) Forest Type Metric score:
7) Wetland Width Width (cm):
Metric score:
Percentage of overhead cover: 8) Canopy Metric score:
36
Appendix C: Metric interpretation and scoring for the Blackwater Habitat Protocol (BHP).
Metric Explanations Metric value calculation Scoring criteria
1) Channel Development
Metrics 1 and 2: multiply percentages for each subcategory by the subcategory weights to get weighted percentages, sum these values to get the total weighted percentage, and compare the total weighted percentage to the scoring criteria values listed to get the metric score
Percentages of 100m reach comprised of single channels, multiple channels (i.e. braided‐channel systems), and undefined channels (large standing‐water areas).
Total Weighted % 200 145‐199 100‐144 0‐99
Metric score 0 1 2 3
2) Flow Velocity Percentages of 100m reach comprised of each flow regime indicated on the field data sheet. Total Weighted %
155 and greater 100‐154 20‐99 0‐19
Metric score 0 1 2 3
3) Floodplain Elevation Average elevation of riparian floodplain above the wetted channel. Compare the estimated value to the
scoring criteria values Elevation (cm) 40 and greater 25‐39 10‐24 0‐9
Metric score 0 1 2 3
4) Submerged/Emergent Vegetation Commonness of submerged and/or emergent vegetation within the wetted area.
Score based on criteria indicated Category Absent Rare Common Abundant
Metric score 0 1 2 3
5) Benthic Organic Matter Percentage of the benthic area covered by large woody debris, coarse particulate organic matter, or fine particulate organic matter.
Percentage 0‐49 50‐84 85‐95 96 and greater
Metric score 0 1 2 3
6) Forest Type Commonness of blackwater‐indicator trees: Nyssa aquatica (water tupelo) and Taxodium distichum (baldcypress). Scores: Absent (0)‐ neither species present, Rare (1)‐ other tree species are dominant, but baldcypress and/or water tupelo are present, Common (2)‐ either baldcypress or water tupelo are present and codominant with other tree species OR both species occur and are relatively common, but not the dominant species, Abundant (3)‐ water tupelo and/or baldcypress are the dominant tree species.
Score based on criteria indicated Category Absent Rare Common Abundant
Metric score 0 1 2 3
7) Wetland Width Within 100 meters, laterally, from the center of the wetted area (200m total and including the wetted area), the percentage by area that is likely wetland (if variable, average over the 100m reach).
Compare the estimated percentage to scoring criteria percentages Percentage: 0‐24 25‐44 45‐74
75 and greater
Metric score 0 1 2 3
8) Canopy Percentage of the overhead view of the sky view that, at full leaf‐out, would be obstructed (requires estimation in late‐fall to early spring).
Compare the estimated percentage to scoring criteria percentages Percent 0‐19 20‐49 50‐69
70 and greater
Metric score 0 1 2 3

37