Embed Size (px)
Citation preview
Development of Ladder Diagram and Monitoring of Booster Pump in Cross-
Country Transportation of Oil/Gas
1K Shivarama Krishna, 2K. Sathish Kumar, 3S. Venkatesh and 4G.Gokulakrishnan
1,2,3,4SELECT, VIT University, Vellore-632014.
Abstract
This paper describes the development of ladder diagram for a booster pump in which the programs are developed and logics are built in Programmable Logic Controller/Remote Terminal Unit’s using program development software Unity Pro XL V5.0. The ladder logics are developed as per the flow charts given for the Booster Pump and its monitoring sequence is observed in the Supervisory Control and Data Acquisition (SCADA). The SCADA software presents it on the Human Machine Interface (HMI) screens to generate alarms, provides graphical representation in the form of current and historical trends and reports. Individual Programmable Logic Controller/Remote Terminal Unit’s at remote station interface with the field devices like Booster Pumps, Main Pumps, Motor Operated Valves and other instruments like flow computers for flow and density measurement, pressure and temperature transmitters etc.
Key Words— Supervisory Control and Data Acquisition (SCADA), Human Machine Interface (HMI), Booster Pump (BP), Programmable Logic Controller (PLC).
1.INTRODUCTION
RUDE oil is received at refineries present all over the country where it is refined to produce useful material like petroleum, CNG, diesel, kerosene, air fuel and many more. These materials once produced can be transported to a marketing terminal for further distribution through pipelines, transport by road or sea. But the oil and gas sector heavily relies on pipeline mode of transportation for distribution of the petroleum products over long distances because pipeline is an economical, safe, environment friendly, reliable and permanent means of transport in comparison [1-3]. The automation of pipeline is required to function safely and optimally without much use of human presence.
In general, automation inherently changes with technology because it applies the latest advances in different fields to gain industrial efficiencies in the user’s respective industry. Pipeline automation is done to in order to achieve maximum performance with minimum operating cost through leak detection systems, automatic alarming, automatic emergency shutdown of station, predictive maintenance, accurate digital measurement, remote diagnostics, inventory tracking & reporting [4-5].
C
International Journal of Pure and Applied MathematicsVolume 118 No. 18 2018, 3971-3981ISSN: 1311-8080 (printed version); ISSN: 1314-3395 (on-line version)url: http://www.ijpam.euSpecial Issue ijpam.eu
3971
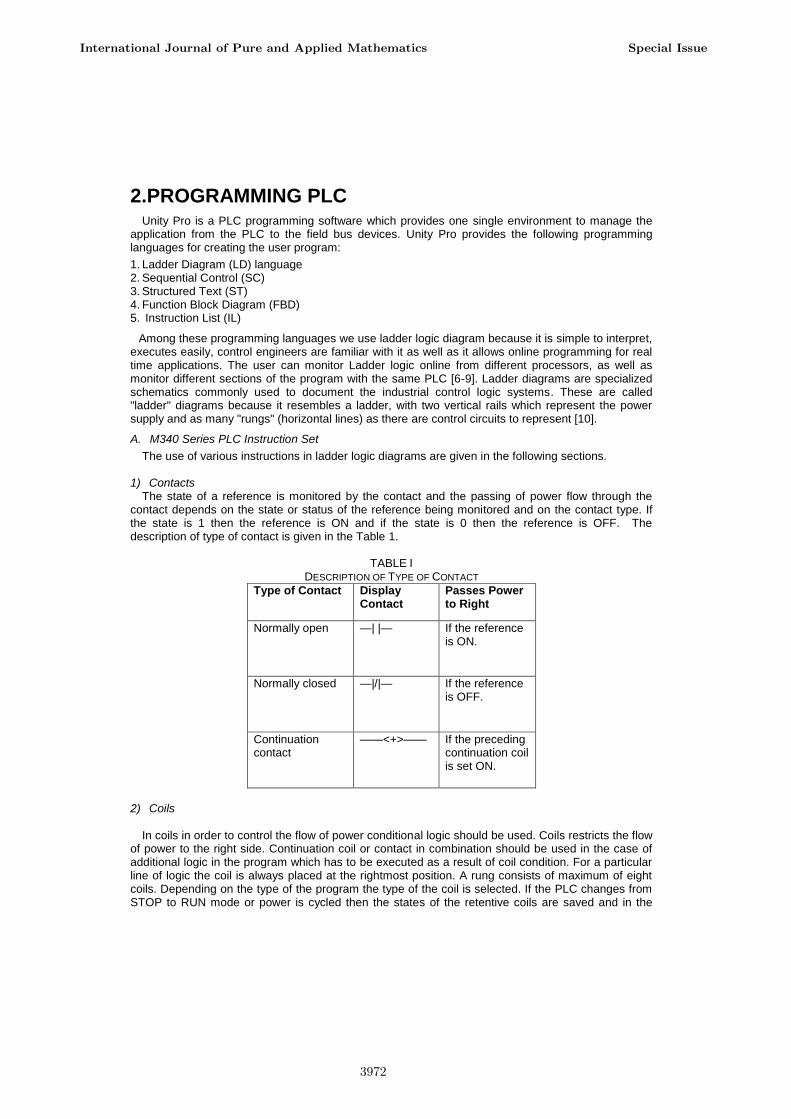
2.PROGRAMMING PLC Unity Pro is a PLC programming software which provides one single environment to manage the
application from the PLC to the field bus devices. Unity Pro provides the following programming languages for creating the user program:
1. Ladder Diagram (LD) language 2. Sequential Control (SC) 3. Structured Text (ST) 4. Function Block Diagram (FBD) 5. Instruction List (IL)
Among these programming languages we use ladder logic diagram because it is simple to interpret, executes easily, control engineers are familiar with it as well as it allows online programming for real time applications. The user can monitor Ladder logic online from different processors, as well as monitor different sections of the program with the same PLC [6-9]. Ladder diagrams are specialized schematics commonly used to document the industrial control logic systems. These are called "ladder" diagrams because it resembles a ladder, with two vertical rails which represent the power supply and as many "rungs" (horizontal lines) as there are control circuits to represent [10].
A. M340 Series PLC Instruction Set
The use of various instructions in ladder logic diagrams are given in the following sections. 1) Contacts
The state of a reference is monitored by the contact and the passing of power flow through the contact depends on the state or status of the reference being monitored and on the contact type. If the state is 1 then the reference is ON and if the state is 0 then the reference is OFF. The description of type of contact is given in the Table 1.
TABLE I
DESCRIPTION OF TYPE OF CONTACT
Type of Contact Display Contact
Passes Power to Right
Normally open —| |— If the reference is ON.
Normally closed —|/|— If the reference is OFF.
Continuation contact
——<+>—— If the preceding continuation coil is set ON.
2) Coils
In coils in order to control the flow of power conditional logic should be used. Coils restricts the flow of power to the right side. Continuation coil or contact in combination should be used in the case of additional logic in the program which has to be executed as a result of coil condition. For a particular line of logic the coil is always placed at the rightmost position. A rung consists of maximum of eight coils. Depending on the type of the program the type of the coil is selected. If the PLC changes from STOP to RUN mode or power is cycled then the states of the retentive coils are saved and in the
International Journal of Pure and Applied Mathematics Special Issue
3972
case of non-retentive coils the states are set to zero. The description of type of coil is given in the Table 2.
TABLE II
DESCRIPTION OF TYPE OF COIL
Type of Coils
Display Coil
Description
Normally open Coil
— ( )— Sets a discrete reference ON
Negated Coil
—(/)— Sets a discrete reference ON
Positive Transition Coil
—(P)— The coil receives power flow it set to ON
Negative Transition Coil
—(N)— The coil stops receiving power flow
SET Coil —(S) — SET coil receives power flow
RESET Coil
—(R)— RESET coil receives power flow
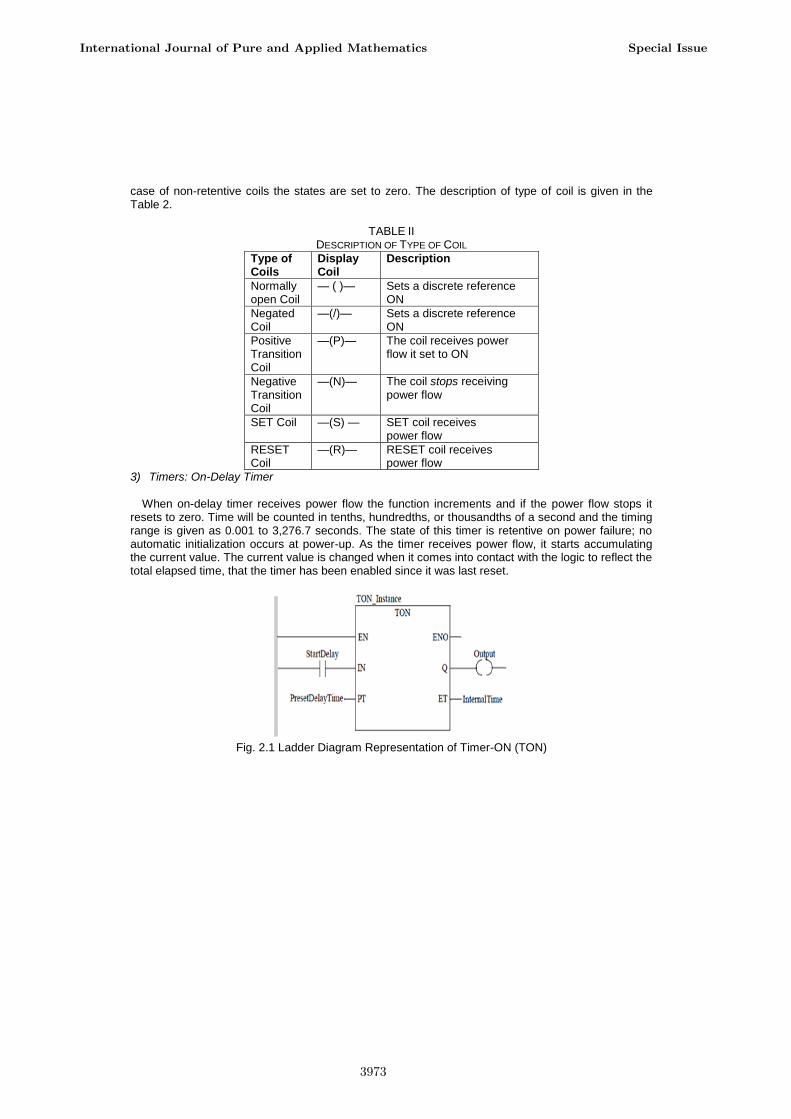
3) Timers: On-Delay Timer
When on-delay timer receives power flow the function increments and if the power flow stops it resets to zero. Time will be counted in tenths, hundredths, or thousandths of a second and the timing range is given as 0.001 to 3,276.7 seconds. The state of this timer is retentive on power failure; no automatic initialization occurs at power-up. As the timer receives power flow, it starts accumulating the current value. The current value is changed when it comes into contact with the logic to reflect the total elapsed time, that the timer has been enabled since it was last reset.
Fig. 2.1 Ladder Diagram Representation of Timer-ON (TON)
International Journal of Pure and Applied Mathematics Special Issue
3973
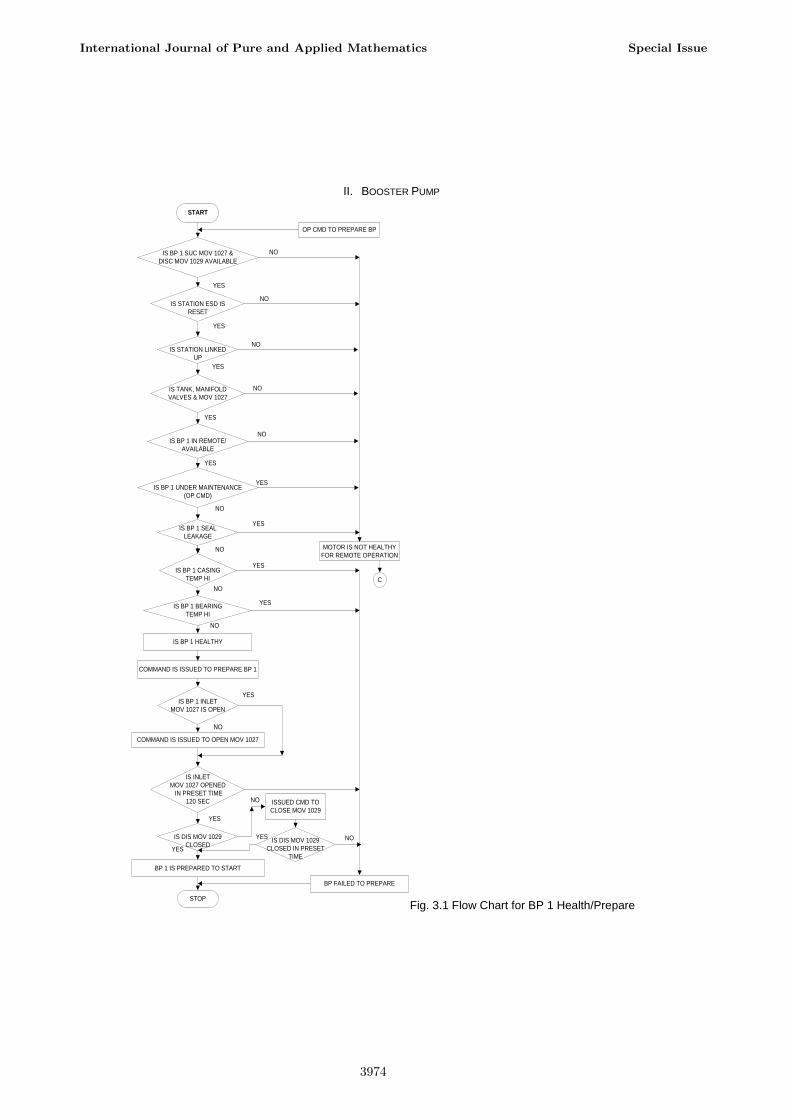
II. BOOSTER PUMP
START
IS BP 1 SUC MOV 1027 &
DISC MOV 1029 AVAILABLE
IS STATION ESD IS
RESET
IS STATION LINKED
UP
IS TANK, MANIFOLD
VALVES & MOV 1027
IS BP 1 IN REMOTE/
AVAILABLE
IS BP 1 UNDER MAINTENANCE
(OP CMD)
IS BP 1 SEAL
LEAKAGE
NO
NO
YES
NO
YES
YES
YES
YES
YES
NO
IS BP 1 CASING
TEMP HI
IS BP 1 BEARING
TEMP HI
IS BP 1 INLET
MOV 1027 IS OPEN
COMMAND IS ISSUED TO OPEN MOV 1027
BP 1 IS PREPARED TO START
STOP
NO
NO
NO
YES
YES
YES
NO
BP FAILED TO PREPARE
ISSUED CMD TO
CLOSE MOV 1029
OP CMD TO PREPARE BP
IS BP 1 HEALTHY
COMMAND IS ISSUED TO PREPARE BP 1
IS INLET
MOV 1027 OPENED
IN PRESET TIME
120 SEC
IS DIS MOV 1029
CLOSEDIS DIS MOV 1029
CLOSED IN PRESET
TIME
MOTOR IS NOT HEALTHY
FOR REMOTE OPERATIONNO
NO
NO
YES
NO
NO
YES
YES
C
YES
Fig. 3.1 Flow Chart for BP 1 Health/Prepare
International Journal of Pure and Applied Mathematics Special Issue
3974
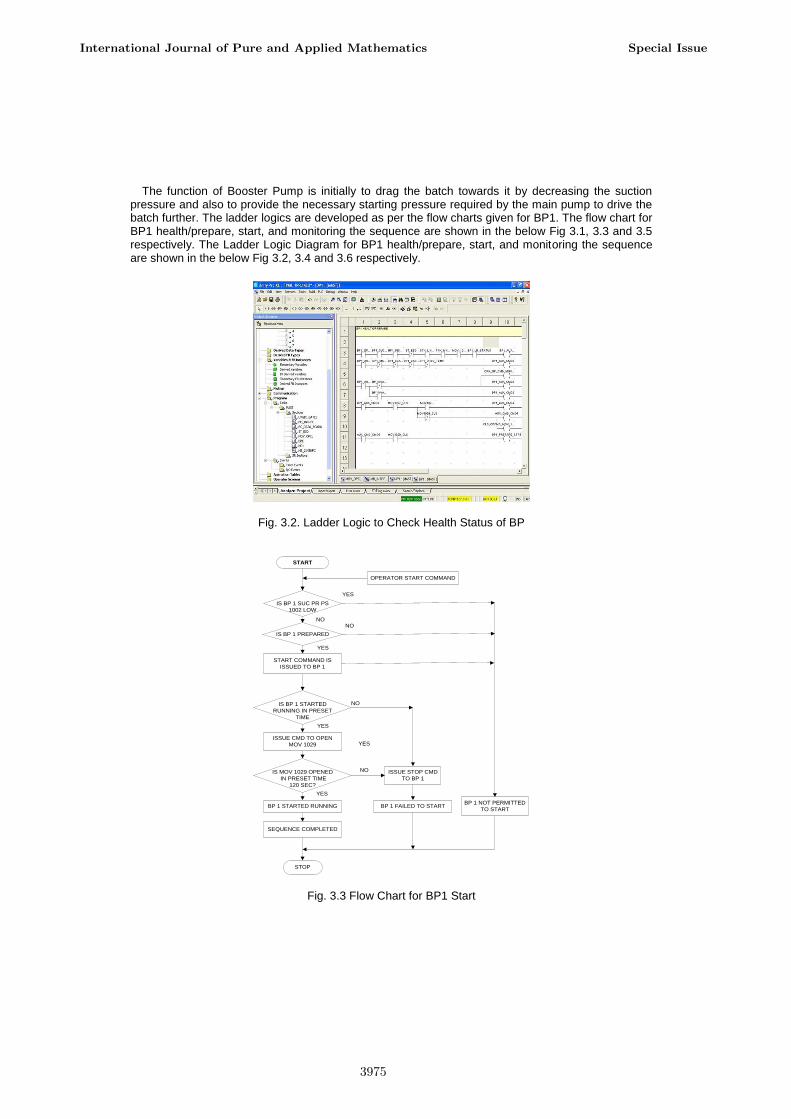
The function of Booster Pump is initially to drag the batch towards it by decreasing the suction pressure and also to provide the necessary starting pressure required by the main pump to drive the batch further. The ladder logics are developed as per the flow charts given for BP1. The flow chart for BP1 health/prepare, start, and monitoring the sequence are shown in the below Fig 3.1, 3.3 and 3.5 respectively. The Ladder Logic Diagram for BP1 health/prepare, start, and monitoring the sequence are shown in the below Fig 3.2, 3.4 and 3.6 respectively.
Fig. 3.2. Ladder Logic to Check Health Status of BP
START
IS BP 1 SUC PR PS
1002 LOW
IS BP 1 PREPARED
NO
YES
YES
NO
NO
NO
NO ISSUE STOP CMD
TO BP 1
YES
YES
YES
START COMMAND IS
ISSUED TO BP 1
IS BP 1 STARTED
RUNNING IN PRESET
TIME
ISSUE CMD TO OPEN
MOV 1029
IS MOV 1029 OPENED
IN PRESET TIME
120 SEC?
OPERATOR START COMMAND
BP 1 STARTED RUNNING BP 1 FAILED TO STARTBP 1 NOT PERMITTED
TO START
NO
SEQUENCE COMPLETED
STOP
Fig. 3.3 Flow Chart for BP1 Start
International Journal of Pure and Applied Mathematics Special Issue
3975
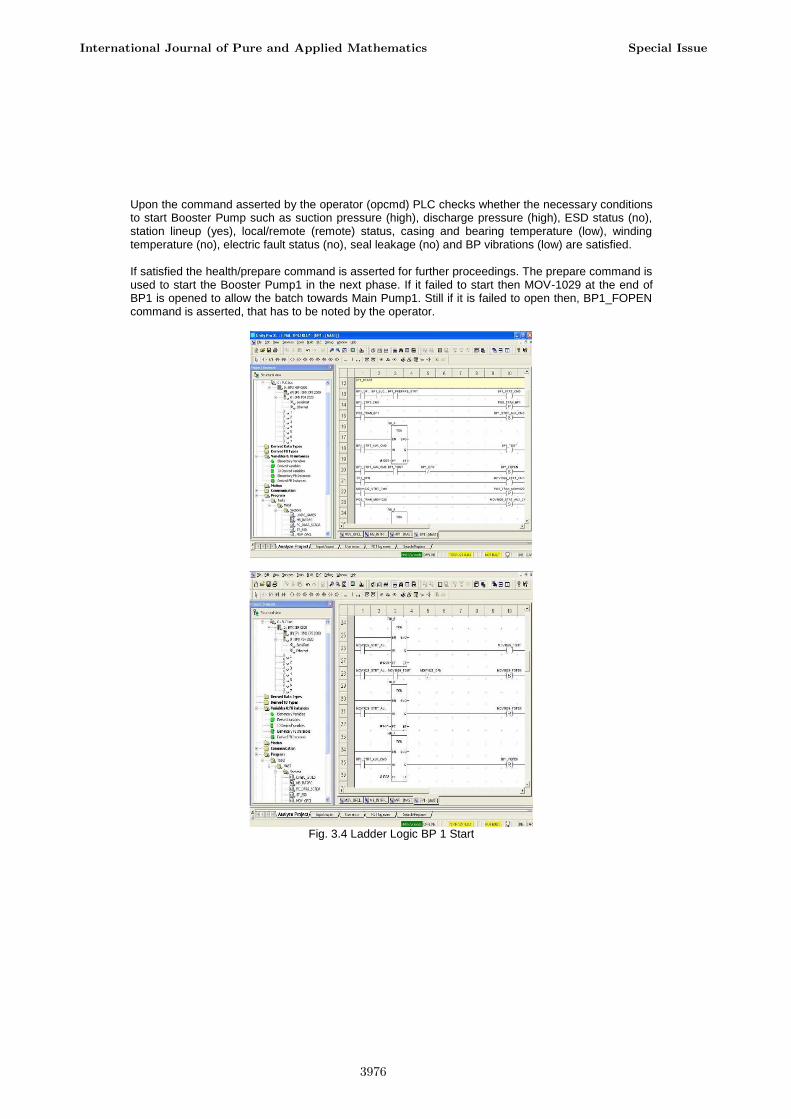
Upon the command asserted by the operator (opcmd) PLC checks whether the necessary conditions to start Booster Pump such as suction pressure (high), discharge pressure (high), ESD status (no), station lineup (yes), local/remote (remote) status, casing and bearing temperature (low), winding temperature (no), electric fault status (no), seal leakage (no) and BP vibrations (low) are satisfied. If satisfied the health/prepare command is asserted for further proceedings. The prepare command is used to start the Booster Pump1 in the next phase. If it failed to start then MOV-1029 at the end of BP1 is opened to allow the batch towards Main Pump1. Still if it is failed to open then, BP1_FOPEN command is asserted, that has to be noted by the operator.
Fig. 3.4 Ladder Logic BP 1 Start
International Journal of Pure and Applied Mathematics Special Issue
3976
START
IS BP 1 RUNNING ?
IS PUMP VIBRATION
HI AFTER 40 SEC
IS THERE ANY
SEAL LEAKAGE
IS SUCTION
PR (1002) LO
IS DISC PR (PS 1004)
HI 102 SEC AFTER
BP START
IS STATION ESD)
IS SUC HDR PR
PT103 LO
STOP COMMAND ISSUED
(INTERNAL) BPSP
NO
YES
YES
NO
YES
YES
NO
NO
NO
NO
NO
IS DIS HDR PR
PT104 HI
IS MOTOR TRIPPED ON
ELECTRICAL SUPPLY
IS 1ST
STAGE
FAULT
IS 2ND
STAGE
FAULT
IS BP 1 STARTED RUNNING &
DISC, MOV 1027 FAILED TO OPEN
IN PRESET TIME 120 SEC
BP 1 RINNING STATUS IS HEALTHY
SEQUENCE COMPLETED
RESET BP SAT1 & BP SAT2
STOP
5
ALARM
5
ALARM
ALARM
ALARM
ALARM
ALARM
ALARM
ALARM
ALARM
ALARM
YES
YES
YES
YES
YES
YES
YES
NO
NO
NO
YES
IS BP1 STOPPED IN
PRESET TIME
CLOSE CMD ISSUED TO MOV
1027 & MOV 1029
FAILED TO
STOP
NO
YES
OP STOP CMD
TO BP2
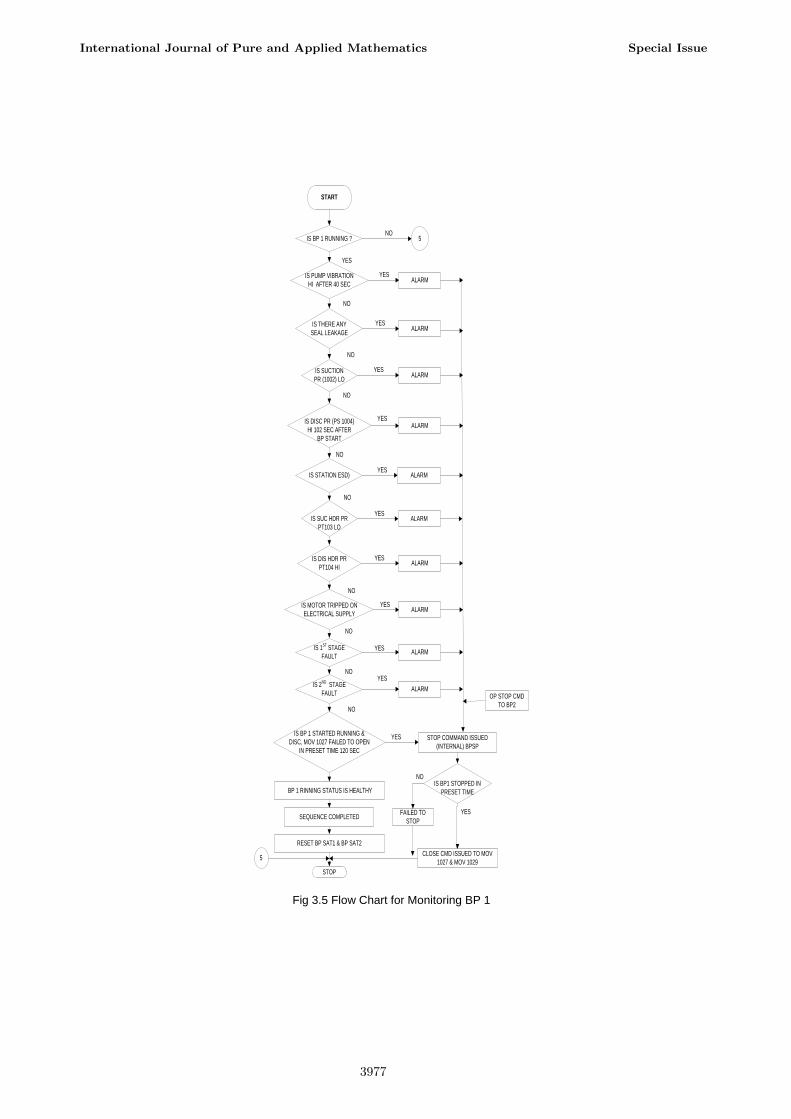
Fig 3.5 Flow Chart for Monitoring BP 1
International Journal of Pure and Applied Mathematics Special Issue
3977
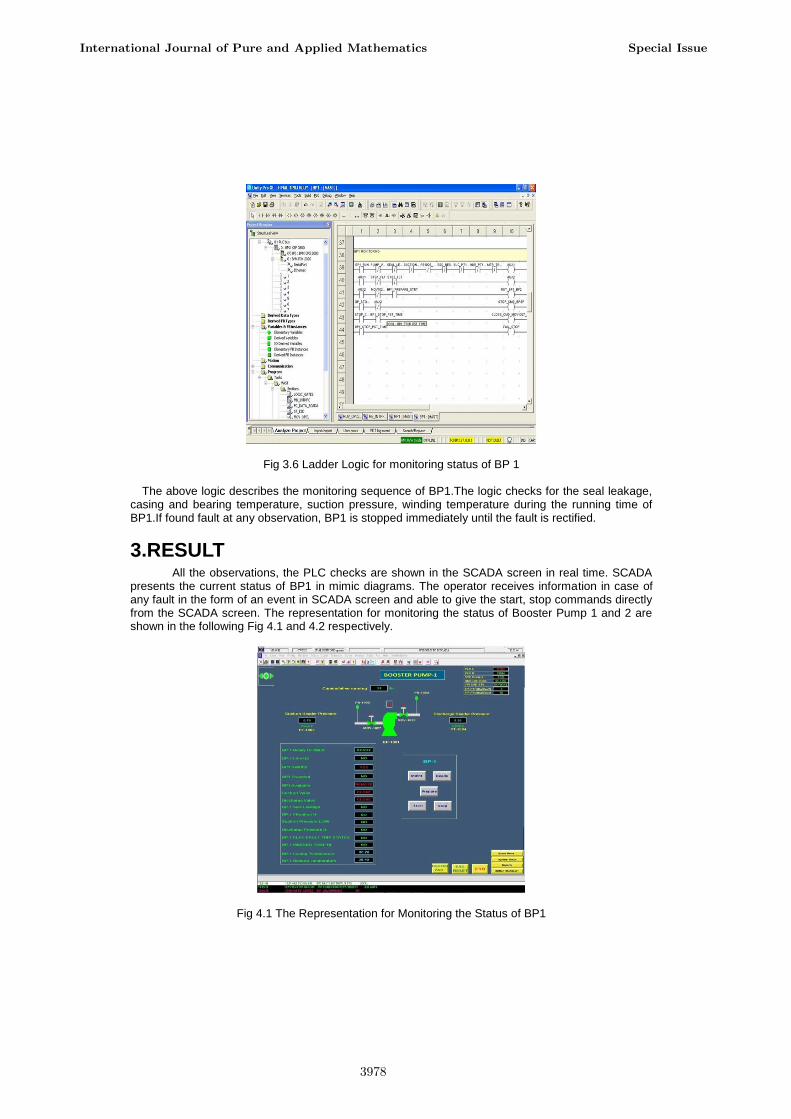
Fig 3.6 Ladder Logic for monitoring status of BP 1 The above logic describes the monitoring sequence of BP1.The logic checks for the seal leakage,
casing and bearing temperature, suction pressure, winding temperature during the running time of BP1.If found fault at any observation, BP1 is stopped immediately until the fault is rectified.
3.RESULT All the observations, the PLC checks are shown in the SCADA screen in real time. SCADA
presents the current status of BP1 in mimic diagrams. The operator receives information in case of any fault in the form of an event in SCADA screen and able to give the start, stop commands directly from the SCADA screen. The representation for monitoring the status of Booster Pump 1 and 2 are shown in the following Fig 4.1 and 4.2 respectively.
Fig 4.1 The Representation for Monitoring the Status of BP1
International Journal of Pure and Applied Mathematics Special Issue
3978
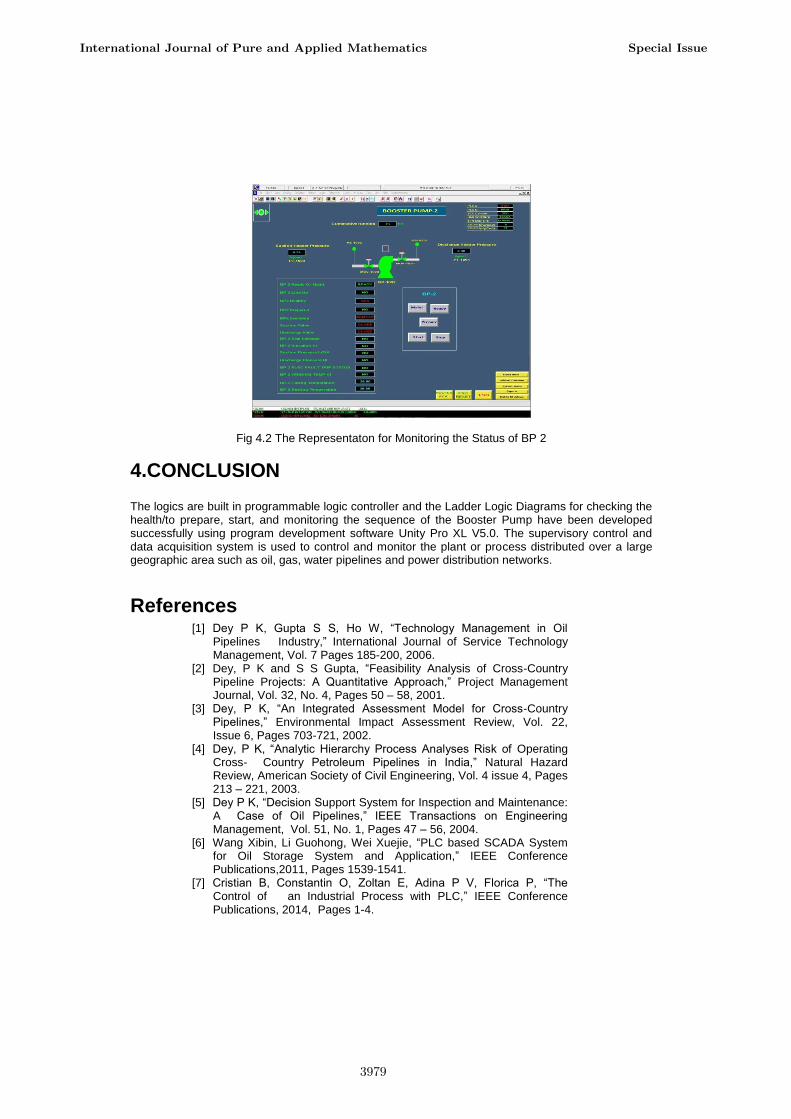
Fig 4.2 The Representaton for Monitoring the Status of BP 2
4.CONCLUSION
The logics are built in programmable logic controller and the Ladder Logic Diagrams for checking the health/to prepare, start, and monitoring the sequence of the Booster Pump have been developed successfully using program development software Unity Pro XL V5.0. The supervisory control and data acquisition system is used to control and monitor the plant or process distributed over a large geographic area such as oil, gas, water pipelines and power distribution networks.
References [1] Dey P K, Gupta S S, Ho W, ―Technology Management in Oil
Pipelines Industry,‖ International Journal of Service Technology Management, Vol. 7 Pages 185-200, 2006.
[2] Dey, P K and S S Gupta, ―Feasibility Analysis of Cross-Country Pipeline Projects: A Quantitative Approach,‖ Project Management Journal, Vol. 32, No. 4, Pages 50 – 58, 2001.
[3] Dey, P K, ―An Integrated Assessment Model for Cross-Country Pipelines,‖ Environmental Impact Assessment Review, Vol. 22, Issue 6, Pages 703-721, 2002.
[4] Dey, P K, ―Analytic Hierarchy Process Analyses Risk of Operating Cross- Country Petroleum Pipelines in India,‖ Natural Hazard Review, American Society of Civil Engineering, Vol. 4 issue 4, Pages 213 – 221, 2003.
[5] Dey P K, ―Decision Support System for Inspection and Maintenance: A Case of Oil Pipelines,‖ IEEE Transactions on Engineering Management, Vol. 51, No. 1, Pages 47 – 56, 2004.
[6] Wang Xibin, Li Guohong, Wei Xuejie, ―PLC based SCADA System for Oil Storage System and Application,‖ IEEE Conference Publications,2011, Pages 1539-1541.
[7] Cristian B, Constantin O, Zoltan E, Adina P V, Florica P, ―The Control of an Industrial Process with PLC,‖ IEEE Conference Publications, 2014, Pages 1-4.
International Journal of Pure and Applied Mathematics Special Issue
3979

[8] Ramanathan R, ―The IEC 61131–3 Programming Languages Features for Industrial Control Systems,‖ World Automation Congress, August, Pages 598-603, 2014.
[9] M. de Sousa, ―Restricting IEC 61131-3 Programming Languages for use on High Integrity Applications,‖ IEEE Conference Publications, 2008, Pages 361-368.
[10] Ahmed M M, ―Electrical Distribution Automation System for Low Voltage (LV) System,‖ IEEE Conference Publications, 2006, Pages 543-548.
International Journal of Pure and Applied Mathematics Special Issue
3980

3981

3982