Embed Size (px)
Citation preview

Journal of Applied School Psychology, 28:133–154, 2012Copyright © Taylor & Francis Group, LLCISSN: 1537-7903 print / 1537-7911 onlineDOI: 10.1080/15377903.2012.669743
Diagnostic Utility of WISC-IV General AbilitiesIndex and Cognitive Proficiency Index
Difference Scores Among Children With ADHD
SARAH E. DEVENAArizona State University, Tempe, Arizona, USA
MARLEY W. WATKINSBaylor University, Waco, Texas, USA
The Wechsler Intelligence Scale for Children-Fourth Edition Gen-eral Abilities Index and Cognitive Proficiency Index have been ad-vanced as possible diagnostic markers of attention deficit hyper-activity disorder. This hypothesis was tested with a hospital samplewith attention deficit hyperactivity disorder (n = 78), a referredbut nondiagnosed hospital sample (n = 66), a school sample withattention deficit hyperactivity disorder (n = 196), a school matchedcomparison sample (n = 196), and a simulated standardizationsample (n = 2,200). On the basis of receiver operating charac-teristic analyses, the General Abilities Index-Cognitive ProficiencyIndex discrepancy method had an area under the curve of (a) .64,95% CI [0.58, 0.71] for the hospital attention deficit hyperactivitydisorder sample compared with the simulated normative sample,(b) .46, 95% CI [0.37, 0.56] for the hospital attention deficit hyper-activity disorder sample compared with the referred but nondiag-nosed hospital sample, (c) .63, 95% CI [0.59, 0.67] for the schoolattention deficit hyperactivity disorder sample compared with thesimulated sample, and (d) .50, 95% CI [0.45, 0.56] for the schoolattention deficit hyperactivity disorder sample compared with thematched comparison sample. These area-under-the-curve valuesindicate that the General Abilities Index-Cognitive ProficiencyIndex discrepancy method has low accuracy in identifying chil-dren with attention deficit hyperactivity disorder.
This article is based on a thesis by the first author (S.E.D.). Preliminary results werepresented at the 2010 meeting of the National Association of School Psychologists. The authorsacknowledge the assistance of Michael S. Lavoie, Ph.D.
Address correspondence to Sarah E. Devena, School Psychology Program, Arizona StateUniversity, P.O. Box 871811, Tempe, AZ 85287, USA. E-mail: [email protected]
133
Dow
nloa
ded
by [M
issi
ssip
pi S
tate
Uni
vers
ity L
ibra
ries]
at 0
6:27
21
June
201
2

134 S. E. Devena and M. W. Watkins
KEYWORDS Attention Deficit Hyperactivity Disorder, generalabilities index, cognitive proficiency index, Wechsler IntelligenceScale for Children-Fourth Edition, diagnostic utility
Attention deficit hyperactivity disorder (ADHD) is a developmental disorderdistinguished by behavioral impulsivity and difficulties with goal-directedthoughts and processes (Schwean & McCrimmon, 2008). According to theCenters for Disease Control and Prevention (2005), ADHD is currently oneof the most common neurobehavioral disorders of children with 3–7% ofschool-aged children diagnosed with the disorder (Adams, Lucas, & Barnes,2008). ADHD can have a profound effect on academic achievement andfuture career success (Frazier, Youngstrom, Glutting, & Watkins, 2007) so anaccurate diagnosis is crucial to ensure appropriate help for students in needand to remove the risk of misdiagnoses for nondisabled students (Skounti,Philalithis, & Galanakis, 2007).
Various methods are used to diagnose ADHD and can include the fol-lowing: (a) direct observations (DuPaul, 1992), (b) structured interviews(Power & Ikeda, 1996), (c) behavior rating scales (Barkley, 1991), (d) mul-tiple stage evaluation (DuPaul, 1992), and (e) cognitive profiles (Prifitera &Dersh, 1993). Although structured interviews and behavior rating scales areconsidered best practice for the identification of ADHD (American Academyof Child and Adolescent Psychiatry, 2007), analysis of cognitive profileshas also been recommended (Prifitera & Dersh, 1993) because cognitivetests measure abilities, such as working memory, which are consideredto be theoretical underpinnings of ADHD (Schwean & McCrimmon, 2008).Some researchers suggest that cognitive profiles are useful in understandingthe cognitive strengths and weaknesses of children that can, therefore,contribute to treatment planning (Kaufman, 1994). For example, cliniciansmight use processing speed interventions for children with ADHD profiles(Schwean & McCrimmon). Because cognitive test use is widespread in schoolassessments (Wilson & Reschly, 1996), and profiles can provide additionalinformation for assessment (Schwean & McCrimmon), they warrant furtherinvestigation.
Of all the available cognitive tests for children, the Wechsler series isthe most popular with clinicians (Kaufman & Lichtenberger, 2000) and theWechsler Intelligence Scale for Children–Fourth Edition (WISC-IV; Wechsler,2003a) is the most widely used measure of children’s intelligence. Many clin-icians believe that the Wechsler tests, beyond their popularity, are valuableinstruments for the diagnostic assessment of children (Weiss, Beal, Saklofske,Alloway, & Prifitera, 2008). Accordingly, clinicians sometimes use the Wech-sler tests to detect ADHD in children by examining specific score patternsthat have been identified through research as markers of ADHD (Sattler,2008).
Dow
nloa
ded
by [M
issi
ssip
pi S
tate
Uni
vers
ity L
ibra
ries]
at 0
6:27
21
June
201
2

Diagnostic Utility of WISC-IV 135
Past research has shown three main cognitive subtest score patternslinked to ADHD. First, Kaufman (1994) found a profile of low scores onthe arithmetic, coding, and digit span subtests on the Wechsler IntelligenceScale for Children–Revised (WISC-R; Wechsler, 1974) which was labeledthe Freedom from Distractibility (FD) factor. With the introduction of theWechsler Intelligence Scale for Children–Third Edition (WISC-III; Wechsler,1991), the FD index was created which included just the arithmetic and digitspan subtests. When children scored high on this FD index it was thoughtto indicate the ability to sustain attention and when they scored low on thisFD index it was thought to indicate distractibility (Kaufman). Because of thishypothesis, low scores on the FD index were considered a possible indicatorof ADHD.
Research on the WISC-III standardization sample subsequently showedthat children with ADHD scored lower on the FD index subtests than on theother subtests (Wechsler, 1991). For instance, Mayes, Calhoun, and Crow-ell (1998) reported that 23% of children with ADHD (n = 87) had digitspan and arithmetic as two of their three lowest scores whereas none ofthe non-ADHD children (n = 32) showed this pattern. Moreover, the FDindex was significantly lower than the children’s full-scale IQ (FSIQ) for theADHD sample. Additional research with groups of children with and with-out ADHD found that, on average, scores of the ADHD groups on thosetwo subtests were significantly lower than the scores for non-ADHD groups(Anastopoulos, Spisto, & Maher, 1994; Wielkiewicz, 1990).
The coding and symbol search subtests of the WISC-III were added tothe two subtests of the FD index to yield the second major Wechsler scorepattern associated with ADHD. This score pattern included lower scores onthe symbol search, coding, arithmetic, and digit (SCAD) Span subtests; theacronym SCAD was coined for this profile (Kaufman, 1994). Research withthe WISC-III standardization sample indicated that children with learningdisabilities had lower scores on this profile (Prifitera & Dersh, 1993). Mayeset al. (1998) supported the validity of this cognitive pattern by finding theSCAD profile in the majority of their sample of children with ADHD. In theiranalysis, 87% of children were correctly identified as having ADHD if theirSCAD scores were lower than their other core subtest scores compared with47% in the non-ADHD group.
The third and final Wechsler score pattern associated with ADHD in-cluded lower scores on the arithmetic, coding, information, and digit span(ACID) subtests (Joschko & Rourke, 1985; Snow & Sapp, 2000). The ACIDprofile incorporated the Information subtest along with the original threesubtests in the FD factor to enhance diagnostic accuracy. Research on clin-ical versus nonclinical groups indicated that the ACID profile occurred in12% of children with ADHD compared with only 1% of children from thenon-ADHD group (Prifitera & Dersh, 1993). These findings led Prifitera andDersh (1993) to propose that the ACID profile could be useful for diagnostic
Dow
nloa
ded
by [M
issi
ssip
pi S
tate
Uni
vers
ity L
ibra
ries]
at 0
6:27
21
June
201
2
136 S. E. Devena and M. W. Watkins
purposes. In a later study, 6% of children with ADHD also exhibited theACID profile (Swartz, Gfeller, Hughes, & Searight, 1998). However, Swartzet al. (1998) found no significant difference between the ADHD and LDsamples in the frequency of ACID profiles.
Although the FD, SCAD, and ACID profiles initially appeared to be validmarkers of ADHD, there are two substantial limitations to this research. Thefirst limitation is the focus on subtest scores. Subtest scores have relativelyweak internal consistency, especially when compared with index scores,which are composites of multiple subtests that measure the same underly-ing cognitive construct. For example, in the WISC-IV normative sample themedian internal consistency for subtests is .86, compared with .88 to .94 forthe composite scores (Wechsler, 2003b). Furthermore, the stability of subtestscores is weak. For example, the median stability coefficients of WISC-IVsubtest and composite scores for a small sample (n = 43) of elementary andmiddle school students across an 11-month interval were .51 and .73, re-spectively (Ryan, Glass, & Bartels, 2010). Likewise, the long term stability ofWISC-III subtest scores among a large clinical sample was found to be con-siderably weaker than the composite scores derived from multiple subtestswith median coefficients of .68 versus .87, respectively (Canivez & Watkins,1998). Moreover, subtest score analysis necessitates the comparison of differ-ence scores. However, the reliability of the difference between two scores issmaller than the reliability of the individual scores, which introduces furthererror into subtest comparisons (Feldt & Brennan, 1993).
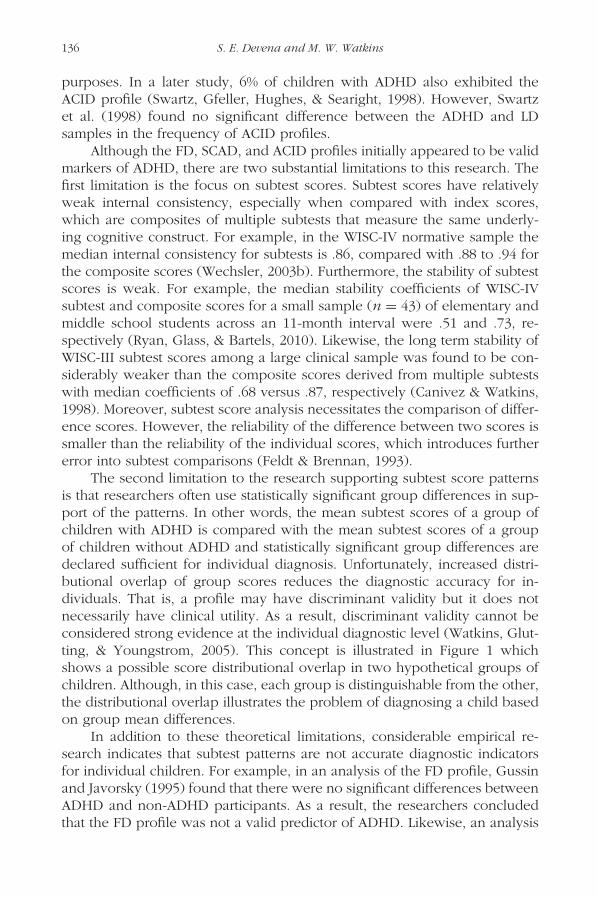
The second limitation to the research supporting subtest score patternsis that researchers often use statistically significant group differences in sup-port of the patterns. In other words, the mean subtest scores of a group ofchildren with ADHD is compared with the mean subtest scores of a groupof children without ADHD and statistically significant group differences aredeclared sufficient for individual diagnosis. Unfortunately, increased distri-butional overlap of group scores reduces the diagnostic accuracy for in-dividuals. That is, a profile may have discriminant validity but it does notnecessarily have clinical utility. As a result, discriminant validity cannot beconsidered strong evidence at the individual diagnostic level (Watkins, Glut-ting, & Youngstrom, 2005). This concept is illustrated in Figure 1 whichshows a possible score distributional overlap in two hypothetical groups ofchildren. Although, in this case, each group is distinguishable from the other,the distributional overlap illustrates the problem of diagnosing a child basedon group mean differences.
In addition to these theoretical limitations, considerable empirical re-search indicates that subtest patterns are not accurate diagnostic indicatorsfor individual children. For example, in an analysis of the FD profile, Gussinand Javorsky (1995) found that there were no significant differences betweenADHD and non-ADHD participants. As a result, the researchers concludedthat the FD profile was not a valid predictor of ADHD. Likewise, an analysis
Dow
nloa
ded
by [M
issi
ssip
pi S
tate
Uni
vers
ity L
ibra
ries]
at 0
6:27
21
June
201
2

Diagnostic Utility of WISC-IV 137
FIGURE 1 Hypothetical mean differences between attention deficit hyperactivity disorderand non–attention deficit hyperactivity disorder groups showing the distributional overlap ofthe groups in the shaded region.
of the diagnostic accuracy of the SCAD profile among children with disabil-ities revealed that a randomly selected child with a disability would exhibita SCAD profile only 59% of the time (Watkins, Kush, & Glutting, 1997a). Inaddition, in a study to distinguish between children with and without learn-ing disabilities, the ACID profile indicated that a randomly selected childwith a learning disability would display an ACID profile only 60% of thetime (Watkins, Kush, & Glutting, 1997b). In addition to individual studies,reviews of multiple studies also support the conclusion that subtest patternsare not accurate diagnostic indicators for individual children. For instance,Bray, Kehle, and Hintze (1998) reported that there is overwhelming evidenceagainst using subtest analysis. Another review addressing subtest analysis in-dicated that subtest profiles did not show an acceptable level of accuracy fordiagnostic purposes (Watkins, 2003). Consequently, Sattler (2008) concludedthat subtest analysis is not appropriate for clinical diagnoses.
In recognition of the problems with subtest patterns, most current ap-proaches for using cognitive assessments to assist in the diagnosis of ADHDhave shifted focus to factor index score patterns. Because the WISC-IV hasbeen shown to have greater sensitivity to ADHD symptoms than the WISC-III and the intended focus of this study is on current approaches, onlystudies based on the WISC-IV will be addressed. The WISC-IV factor indexcomposites include processing speed (PSI), working memory (WMI), verbal
Dow
nloa
ded
by [M
issi
ssip
pi S
tate
Uni
vers
ity L
ibra
ries]
at 0
6:27
21
June
201
2

138 S. E. Devena and M. W. Watkins
comprehension (VCI), and perceptual reasoning (PRI). According to Weiss etal. (2008), “differences among the four-factor-based WISC-IV index scores areclinically meaningful and worthy of study within the context of the completeindividual” (p. 9).
Following the trend of addressing composite scores, the WISC-IV wasadministered to 89 children aged from 8 to 13 years who were identified ashaving ADHD based on the Diagnostic and Statistical Manual for MentalDisorders (4th edition; American Psychiatric Association, 2000) diagnosticcriteria. The children were selected, on the basis of their availability, from avariety of educational and clinical settings. On average, children with ADHDperformed worse on PSI and WMI indexes compared with VCI and PRI in-dexes (Wechsler, 2003b). The effect size for PSI was moderate (.59) andthe effect sizes for VCI, WMI, and FSIQ were small (.26, .38, and .38, re-spectively). Wechsler indicated that this discrepancy showed that childrenwith ADHD may have typical intelligence levels but they differ from non-ADHD children in their special abilities. However, this study had three majorlimitations. First, the effect sizes were only small to moderate. This reflectsconsiderable overlap of score distributions and consequently the probabilityof correctly distinguishing between individuals in the two groups is onlyslightly higher than chance. Second, FSIQ scores were different between thetwo groups (children with ADHD average FSIQ was 97.6 versus childrenwithout ADHD average FSIQ of 102.7), which may have confounded theresults. Third, the sample size was relatively small (n = 89) and did notcover the entire age range of the WISC-IV. This restricted age range makesit difficult to determine if children outside of 8 to 13 years of age woulddisplay the same score patterns.
Additional research that included 118 children with ADHD whose agesranged from 6 to 16 years of age was conducted on the WISC-IV indexscores to identify ADHD profiles (Mayes & Calhoun, 2006). The VCI and PRIscores, on average, were significantly higher than the WMI and PSI scoresfor the children with ADHD (d = 1.6 to 1.9).WMI and PSI scores were lowerthan the VCI and PRI scores in 88% of the ADHD cases. Furthermore, all thechildren with ADHD either had the WMI (55%) or PSI (45%) as their lowestindex score. Based upon these results, Mayes and Calhoun concluded that,“If future studies support the enhanced distinctiveness of the low WMI andPSI and high VCI and PRI WISC-IV profile in children with ADHD, this maybe diagnostically and clinically useful” (p. 490). However, there are twonotable drawbacks to the methods used in this study. First, the sample onlyincluded children referred to the researchers’ psychiatric clinic, which mayhave introduced sample or testing bias. A second drawback was that themean standard scores for the FSIQ, VCI, and PRI in the ADHD sample were
Dow
nloa
ded
by [M
issi
ssip
pi S
tate
Uni
vers
ity L
ibra
ries]
at 0
6:27
21
June
201
2
Diagnostic Utility of WISC-IV 139
considerably higher than the national average scores (108, 114, and 117,respectively).
Subsequently, the four WISC-IV factor indexes were collapsed into twoindex scores to better reflect two hypothetical underlying clinical constructs.The four WMI and PSI subtests were combined to form the Cognitive Pro-ficiency Index (CPI; Weiss & Gable, 2007) and the six VCI and PRI sub-tests were merged to form the General Abilities Index (GAI; Raiford, Weiss,Rolfhus, & Coalson, 2005). The CPI is thought to correspond to how profi-ciently children process specific types of cognitive information, which in turnfacilitates learning and problem solving. In contrast, the GAI is thought tomeasure intellectual functioning without the influence of working memoryand processing speed.
To investigate CPI and GAI differences, clinical and nonclinical groupswere selected during the WISC-IV standardization project (Weiss & Gable,2007). By comparing children’s CPI with their GAI, Weiss and Gable at-tempted to identify a cutoff score that would distinguish between clinicaland nonclinical groups with a true positive rate (TPR) and a true negativerate (TNR) of at least 60%. The TPR is the positives that are correctly identifieddivided by the total positives. On the other hand, the TNR is the negativesthat are correctly identified divided by all negatives. In addition, one minusthe TNR gives the false positive rate (FPR), which is the negatives that areincorrectly classified divided by the total negatives (Fawcett, 2006). Of the 12clinical groups analyzed by Weiss and Gable (2007), 4 had high enough TPRand TNR to be considered noteworthy. The learning disabilities group wasidentified with a TPR of 66% and a TNR of 63% when CPI was lower thanGAI by at least 5 points. The closed head traumatic brain injury group wasidentified with a TPR of 65% and TNR of 61% when CPI was at least 4 pointslower than GAI. The open head traumatic brain injury group was identifiedwith a TPR of 67% and TNR of 62% when CPI was at least 4 points lower thanGAI. Last, the Asperger’s group was identified with a TPR of 68% and TNRof 63% when CPI was at least 11 points lower than GAI. Weiss and Gable(2007) concluded that CPI < GAI discrepancies alone cannot be considereddiagnostic markers of most specific disorders but they are implicated in a va-riety of disorders. Subsequently, Weiss et al. (2008) concluded that GAI-CPIdifferences that occur in 10% or less of the population (which is equivalentto approximately a 16 point discrepancy) are rare and interpretable.
One problem with Weiss and Gable’s (2007) study was that only 4 outof the 12 clinical groups were identified with 60% accuracy, with the highestgroup only reaching a TPR of 68% and TNR of 63%. This reveals a lack ofaccurate results for most individuals in the clinical groups. Another problemis that the analysis used the TPR and TNR to identify a specific cutoff score.TPR and TNR values would have differed if other cutoff scores had been
Dow
nloa
ded
by [M
issi
ssip
pi S
tate
Uni
vers
ity L
ibra
ries]
at 0
6:27
21
June
201
2

140 S. E. Devena and M. W. Watkins
selected. In addition, the TPR and TNR depend on base rates (Elwood, 1993),which means that the TPR and TNR will vary depending on the populationor subgroup (i.e., boys vs. girls). Overall, these problems make the analysisunsuitable for accurate estimation of the diagnostic utility of WISC-IV indexprofiles.
A suitable measure of diagnostic utility should not be dependent uponbase rate or cutoff score (Swets, 1988). A receiver operating characteristic(ROC) analysis avoids these issues by using proportions of TPR and FPR thatignore base rates and by looking at all possible scores instead of a singlecutoff score (Pintea & Moldovan, 2009). A ROC curve is drawn by plottingindividual points for all possible cutoff scores. In other words, plotting thebalance between the TPR and the FPR for the test while moving the cutoffscore across the full range of values (Fawcett, 2006). The more accurate a testis, the farther the ROC curve will move to the upper left corner of the graph(see Figure 2). Overall, the ROC curve will allow for a complete descriptionof diagnostic performance of a test (Pepe, 2003).
Although WISC-IV factor index scores possess theoretical coherencelacking in subtest scores and are more reliable then subtest scores, researchconducted by Mayes and Calhoun (2006) as well as Wechsler (2003b) hasnot addressed the issue of using group averages to diagnose individuals.In addition, in the research conducted by Weiss and Gable (2007) onlythe TPR and TNR for one cutoff score were calculated when consideringthe diagnostic accuracy of CPI < GAI discrepancies. For these reasons, this
FIGURE 2 Hypothetical receiver operating characteristic curve with diagonal chance lineshowing that as the curve moves farther toward the left corner of the graph, the moreaccurate a test is.
Dow
nloa
ded
by [M
issi
ssip
pi S
tate
Uni
vers
ity L
ibra
ries]
at 0
6:27
21
June
201
2
Diagnostic Utility of WISC-IV 141
study will apply diagnostic utility statistics, including a ROC analysis, to testthe ability of WISC-IV GAI-CPI difference scores to identify children withADHD.
METHOD
Participants
The hospital ADHD sample included 78 children (56 boys, 22 girls) aged6 to 16 years (M = 10.1 years, SD = 2.7 years) from a major children’shospital who had received an ADHD diagnosis and who had been admin-istered all 10 core subtests of the WISC-IV. Of the 78 children with ADHD,21 were classified as primarily inattentive, 3 were classified as primarily hy-peractive, 33 were classified as combined, and 21 were classified as nototherwise specified (NOS). Children are diagnosed as ADHD-NOS if theyhave the prominent aspects of inattention or hyperactivity-impulsivity butdo not meet all diagnostic criteria for ADHD listed in the Diagnostic andStatistical Manual for Mental Disorders (4th edition; American PsychiatricAssociation, 2000). The WISC-IV scores for the sample were in the averagerange (FSIQ, M = 91; VCI, M = 93; PRI, M = 94; WMI, M = 91; PSI, M =90). The referred but nondiagnosed hospital comparison sample included 66children (29 boys, 35 girls, and 2 unreported) aged 6 to16 years (M = 10.3,SD = 2.8) from the same children’s hospital who had not received a diagno-sis, and who had also been administered all 10 core subtests of the WISC-IV.The WISC-IV scores for the referred but nondiagnosed hospital comparisonsample were in the average range (FSIQ, M = 98; VCI, M = 100; PRI, M =100; WMI, M = 97; PSI, M = 93).
The school ADHD sample included 196 children (139 boys, 57 girls)aged 6 to 16 years (M = 10.3 years, SD = 2.6 years) from two southeasternschool districts who had received an ADHD diagnosis and had been ad-ministered all 10 core subtests of the WISC-IV. The WISC-IV scores for theschool ADHD sample were in the average range (FSIQ, M = 94; VCI, M =96; PRI, M = 98; WMI, M = 92; PSI, M = 93). The school children with-out ADHD matched comparison sample included 196 children (140 boys, 56girls) aged 6 to16 years (M = 10.1 years, SD = 2.5 years) from the sameschool districts who had not received an ADHD diagnosis, and who hadalso been administered all 10 core subtests of the WISC-IV. The comparisonsample was matched to the ADHD sample based on FSIQ, age, and genderfor each participant. Of the 196 children from the school comparison sample,128 were classified as learning disabled, 27 were classified as emotionallydisabled, 8 were classified as autistic, 6 were classified as speech and lan-guage impaired, 1 was classified as mentally retarded, and 26 were givenno diagnosis. The WISC-IV scores for the school comparison sample werein the average range (FSIQ, M = 94; VCI, M = 97; PRI, M = 99; WMI, M =92; PSI, M = 92). For the nondisabled comparison group a virtual sample
Dow
nloa
ded
by [M
issi
ssip
pi S
tate
Uni
vers
ity L
ibra
ries]
at 0
6:27
21
June
201
2

142 S. E. Devena and M. W. Watkins
was created using EQS for Windows version 6.1 with virtually identical psy-chometric characteristics as reported for the standardization sample from theWISC-IV (Wechsler, 2003b). The WISC-IV normative sample was requestedfor this analysis but was denied by the publishing company.
Instrument
The WISC-IV is an individually administered cognitive test composed of 10mandatory subtests (M = 10; SD = 3) that form a FSIQ score and fourindexes (M = 100; SD = 15) including the VCI, PRI, WMI, and PSI. The coresubtests for VCI include Similarities, vocabulary, and comprehension. Thecore subtests for PRI include Block Design, Picture Concepts, and MatrixReasoning. The core subtests for WMI include digit span and letter-numbersequencing, whereas the core subtests for PSI include coding and symbolsearch (Wechsler, 2003b).
The WISC-IV was standardized on 2,200 children ages 6 years and zeromonths to 16 years and 11 months who were selected to be representativeof children in the United States based on the 2000 census. This sample wasstratified on age, sex, race, ethnicity, parent education level, and geographicregion. The average internal consistency coefficients were .97 for the FSIQ,.94 for VCI, .92 for PRI, .92 for WMI, and .88 for PSI. The median internalconsistency coefficients for individual subtests ranged from .79 for symbolsearch and Cancellation to .90 for letter-number sequencing. A sample of243 children were administered the WISC-IV twice at intervals ranging from13 to 63 days, which yielded a test-retest stability coefficient of .89 for FSIQ,.89 for VCI, .85 for PRI, .85 for WMI, and .79 for PSI. An exploratory factoranalysis found the factor loadings of the core subtests matched the predictedfactor structure of VCI, PRI, WMI, and PSI. In addition, a confirmatory factoranalysis supported this same structure (Wechsler, 2003b).
Procedure
After we received institutional review board approval, we collected childrens’WISC-IV scores and diagnoses from 322 hospital files by hospital volunteers.Participants’ data were collected systematically for all active referrals from thechildren’s hospital outpatient practice that treats neurological and behavioralconditions in children. In addition, childrens’ WISC-IV scores and diagnoseswere collected from 3,086 special education files of two southwestern schooldistricts by volunteers. The participant data were collected systematically forall special education referrals, but children who were not administered theWISC-IV were excluded. The data collected included demographic infor-mation, WISC-IV scores, and diagnoses. After data collection, each child’sinformation was reviewed and excluded if he or she was missing scoresfrom any of the 10 core subtests.
Dow
nloa
ded
by [M
issi
ssip
pi S
tate
Uni
vers
ity L
ibra
ries]
at 0
6:27
21
June
201
2

Diagnostic Utility of WISC-IV 143
The CPI score for each child was computed by summing the four coresubtest scaled scores that comprise the working memory and processingspeed indexes. After this, the child’s CPI standard score was found by ref-erencing norm tables (Weiss et al., 2008). The GAI of each child was com-puted by summing the six core subtest scaled scores that comprise the verbalcomprehension and perceptual reasoning indexes. The GAI standard scorewas also found by referencing norm tables (Weiss et al., 2008). The differ-ence between the GAI and CPI scores were then calculated for each child.These computations were repeated for all children in the simulated WISC-IVstandardization sample.
Analyses
The GAI-CPI difference scores were used to compute true positive and falsepositive rates for each case for every possible cutoff score that then formedthe ROC graphs. The resulting ROC curves are graphical representation ofthe accuracy of the GAI and CPI difference scores. The area under the curve(AUC) quantifies the ROC curve by producing an overall index of accuracy(Fawcett, 2006). The AUC is equal to the likelihood that test results from arandomly selected pair of affected and nonaffected participants are correctlyordered (Pepe, 2003). The AUC will always fall from 0.00 to 1.00 but randomguessing equals a diagonal line that has an area of 0.50 (Fawcett, 2006).According to Swets (1988), an AUC of .50 to .70 indicates low accuracy, .70to .90 indicates moderate accuracy, and .90 to 1.00 indicates high accuracy.
The AUC can be computed with either nonparametric (Bamber, 1975;Hanley & McNeil, 1982) or parametric (Metz, 1978) methods. The paramet-ric approach produces a smooth ROC curve based on normal distributionalassumptions. The nonparametric approach does not rely on distributional as-sumptions and an AUC can be obtained for a small sample size (Hajian-Tilaki,Hanley, Joseph, & Collet, 1997). Nonparametric and parametric approachesusually yield similar results but “the nonparametric method yields lowerarea estimates than the maximum-likelihood-estimation technique. However,these differences generally were small, particularly with ROC curves derivedfrom five or more cutoff points” (Centor & Schwartz, 1985, p. 149). Conse-quently, the nonparametric approach as implemented in PASW version 18was applied so as to remove any distributional assumptions and becausethis approach is more appropriate with smaller samples (Hajian-Tilaki et al.,1997).
RESULTS
Descriptive statistics for the subtest, FSIQ, GAI, CPI, and difference scores forthe hospital participants are included in Table 1 and descriptive statistics for
Dow
nloa
ded
by [M
issi
ssip
pi S
tate
Uni
vers
ity L
ibra
ries]
at 0
6:27
21
June
201
2

TA
BLE
1Tes
tSc
ore
Stat
istic
sfo
rth
eH
osp
ital
Atten
tion
Defi
cit
Hyp
erac
tivity
Dis
ord
er,
Ref
erre
dB
ut
Nondia
gnose
d,
and
Sim
ula
ted
Stan
dar
diz
atio
nSa
mple
s
Atten
tion
defi
cit
Stan
dar
diz
atio
nhyp
erac
tivity
dis
ord
erN
ondia
gnose
d
MSD
MSD
MSD
Blo
ckdes
ign
9.98
3.01
8.73
∗∗2.
739.
273.
44Si
mila
ritie
s9.
973.
029.
213.
3410
.29
3.73
Dig
itSp
an10
.00
3.03
7.95
∗∗2.
988.
80∗∗
2.87
Pic
ture
conce
pts
10.0
23.
029.
173.
2810
.71
3.34
Codin
g9.
982.
976.
99∗∗
3.23
7.59
∗∗3.
53V
oca
bula
ry9.
953.
048.
46∗∗
2.93
9.45
3.85
Letter
-num
ber
sequen
cing
9.96
2.95
8.37
∗∗3.
579.
553.
56M
atrix
reas
onin
g10
.00
3.07
9.08
3.43
9.92
3.61
Com
pre
hen
sion
9.94
2.99
8.78
∗∗2.
829.
823.
61Sy
mbolse
arch
9.85
3.01
7.94
∗∗3.
348.
42∗
3.61
Full-
scal
eIQ
99.6
515
.42
90.6
6∗∗17
.01
97.9
520
.81
Gen
eral
Abili
tyIn
dex
100.
3415
.27
93.0
0∗∗15
.67
99.7
921
.31
Cogn
itive
Pro
fici
ency
Index
99.3
414
.86
85.7
4∗∗16
.21
90.7
7∗∗16
.92
Diffe
rence
bet
wee
nG
ener
alA
bili
tyIn
dex
and
Cogn
itive
Pro
fici
ency
Index
score
1.20
12.1
67.
26∗∗
13.4
09.
02∗∗
12.1
7
∗ p<
.01.
∗∗p
<.0
04.
144
Dow
nloa
ded
by [M
issi
ssip
pi S
tate
Uni
vers
ity L
ibra
ries]
at 0
6:27
21
June
201
2

Diagnostic Utility of WISC-IV 145
the school participants are included in Table 2. The mean subtest, GAI, CPI,and FSIQ scores for the samples were slightly lower and somewhat morevariable than the normative sample. Similar patterns have been found withother clinical samples (Canivez & Watkins, 1998). We conducted a one-wayanalysis of variance to test whether the means differed significantly betweengroups. A Welch approximate F test, which does not assume homogeneityof variance, was used because of unequal group sizes. The Dunnett’s Ctest, which does not assume equal variances, was conducted to evaluatedifferences among the means that proved to be statistically significant (seeTables 1 and 2). However, conducting multiple tests increases the chancethat at least one of them will be statistically significant by chance alone (Type1 error). Thus, the alpha level for each individual test was set at .004 (.05 ÷14) to maintain the experimentwise error rate at .05.
For the hospital sample many of the subtests as well as the GAI, CPI,FSIQ were statistically significant at the .004 level. The tests that were statis-tically significant included block design, F(2, 99.91) = 8.91, p < .001; digitspan, F(2, 100.41) = 22.53, p < .001; coding, F(2, 98.66) = 42.76, p < .001;vocabulary, F(2, 99.07) = 10.06, p < .001; letter-number sequencing, F(2,98.12) = 7.87, p < .001; comprehension, F(2, 99.33) = 6.29, p < .004; symbolsearch, F(2, 98.51) = 17.01, p < .001; GAI, F(2, 98.39) = 8.24, p < .001; CPI,F(2, 98.84) = 33.93, p < .001; and the FSIQ, F(2, 93.66) = 9.75, p < .001.The Dunnett’s C post hoc test indicated that digit span, coding, letter-numbersequencing, symbol search, GAI, and FSIQ scores were significantly differ-ent between the ADHD and normative samples. In addition, the digit span,coding, and CPI scores were significantly different between the normativesample and both the ADHD and nondiagnosed samples.
GAI-CPI difference scores for the ADHD, nondiagnosed, and simulatedsamples were different at a statistically significant level F(2, 99.47) = 20.22,p < .001. The Dunnett’s C test indicated that the ADHD and nondiagnosedhospital samples were both significantly different from the simulated norma-tive sample but not significantly different from each other. The ADHD andnondiagnosed groups each had larger GAI-CPI difference scores than thesimulated normative group.
For the school sample the tests that were statistically significant at the.004 level included digit span, F(2, 292.55) = 43.30, p < .001; coding, F(2,280.17) = 37.73, p < .001; vocabulary, F(2, 298.25) = 9.00, p < .001; letter-number sequencing, F(2, 292.43) = 26.22, p < .001; comprehension, F(2,291.26) = 5.93, p < .004; symbol search, F(2, 283.70) = 12.28, p < .001; GAI,F(2, 295.96) = 5.86, p < .004; CPI, F(2, 295.20) = 59.88, p < .001; and theFSIQ, F(2, 295.91) = 25.49, p < .001. The Dunnett’s C post hoc test indicatedthat block design, vocabulary, letter-number sequencing, comprehension,symbol search, CPI, and FSIQ scores were significantly different betweenthe normative sample and both the ADHD and school comparison samples.In addition, the vocabulary scores were statistically significant between the
Dow
nloa
ded
by [M
issi
ssip
pi S
tate
Uni
vers
ity L
ibra
ries]
at 0
6:27
21
June
201
2

TA
BLE
2Tes
tSco
reSt
atis
tics
forth
eSc
hoolA
tten
tion
Defi
citH
yper
activ
ityD
isord
er,S
choolC
om
par
ison,a
nd
Sim
ula
ted
Stan
dar
diz
atio
nSa
mple
s
Atten
tion
defi
cit
Stan
dar
diz
atio
nhyp
erac
tivity
dis
ord
erSc
hool
MSD
MSD
MSD
Blo
ckdes
ign
9.98
3.01
9.35
+3.
079.
612.
99Si
mila
ritie
s9.
973.
029.
462.
929.
652.
94D
igit
Span
10.0
03.
038.
68∗∗
2.71
8.41
∗∗2.
79Pic
ture
conce
pts
10.0
23.
0210
.11
2.87
9.83
3.16
Codin
g9.
982.
978.
30∗∗
3.01
8.42
∗∗3.
33V
oca
bula
ry9.
953.
049.
39+
2.46
9.24
∗∗2.
75Le
tter
-num
ber
sequen
cing
9.96
2.95
8.78
∗∗2.
628.
95∗∗
2.74
Mat
rix
reas
onin
g10
.00
3.07
9.6
82.9
69.
722.
74Com
pre
hen
sion
9.94
2.99
9.33
+2.
719.
492.
79Sy
mbolse
arch
9.85
3.01
9.10
∗∗3.
028.
92∗∗
3.07
Full-
scal
eIQ
99.6
515
.42
94.1
1∗∗13
.59
94.1
4∗∗13
.37
Gen
eral
Abili
tyIn
dex
100.
3415
.27
97.6
1+12
.86
97.8
513
.87
Cogn
itive
Pro
fici
ency
Index
99.3
414
.86
91.2
9∗∗13
.31
90.9
6∗∗12
.87
Diffe
rence
bet
wee
nG
ener
alA
bili
tyIn
dex
and
Cogn
itive
Pro
fici
ency
Index
score
1.20
12.1
66.
32∗∗
10.8
26.
89∗∗
13.6
5
+ p<
.05.
∗ p<
.01.
∗∗p
<.0
04.
146
Dow
nloa
ded
by [M
issi
ssip
pi S
tate
Uni
vers
ity L
ibra
ries]
at 0
6:27
21
June
201
2

Diagnostic Utility of WISC-IV 147
FIGURE 3 Receiver operating characteristic curve of children with attention deficit hyperac-tivity disorder compared with the simulated Wechsler Intelligence Scale for Children-FourthEdition standardization sample.
normative and school comparison sample. The GAI-CPI difference scoresfor the ADHD, matched comparison, and simulated samples were differentat a statistically significant level F(2, 285.56) = 31.25, p < .001. Similar tothe hospital sample the ADHD and matched comparison groups had largerGAI-CPI difference scores than the simulated normative group.
The result of the ROC analysis comparing hospital children with ADHDto the simulated WISC-IV standardization sample is presented in Figure 3.The AUC of .64, 95% CI [0.58, 0.71] quantifies these visual results. If a childwere randomly selected from the ADHD sample and another child randomlychosen from the standardization sample, the child with ADHD would havea higher GAI-CPI difference score about 64% of the time (Ruttimann, 1994).
The ROC analysis comparing hospital children with ADHD to the nondi-agnosed hospital comparison sample is presented in Figure 4. The resultingAUC was .46, 95% CI [0.37, 0.56]. If one child from each sample was ran-domly selected, the child with ADHD could not be differentiated from thechild who was referred but not diagnosed based on having a higher GAI-CPIdifference score (Ruttimann, 1994).
The ROC analysis comparing school children with ADHD to the simu-lated WISC-IV standardization sample is presented in Figure 5. The resultingAUC of .63, 95% CI [0.59, 0.67] indicates that if a child was randomly selected
Dow
nloa
ded
by [M
issi
ssip
pi S
tate
Uni
vers
ity L
ibra
ries]
at 0
6:27
21
June
201
2

148 S. E. Devena and M. W. Watkins
FIGURE 4 Receiver operating characteristic curve of children with attention deficit hyperac-tivity disorder compared with the referred but nondiagnosed hospital comparison sample.
from the ADHD school sample and another child randomly chosen from thestandardization sample, the child with ADHD would have a higher GAI-CPIdifference score about 63% of the time (Ruttimann, 1994).
Last, the ROC analysis comparing school children with ADHD to thematched school comparison sample is presented in Figure 6. The resultingAUC of .50, 95% CI [0.45, 0.56] indicates that the GAI-CPI discrepancy methodoperated at chance levels for these two groups of children. The AUC scorefor each of the ROC analyses indicate that the GAI-CPI discrepancy methodwould be classified as low accuracy (Swets, 1988).
DISCUSSION
Some researchers have hypothesized that WISC-IV GAI-CPI difference scorescan be used to accurately diagnose children with ADHD. The results of thisstudy indicated that children with ADHD and those without ADHD hadsignificantly different group mean scores on several subtest, CPI, and GAI-CPI discrepancy scores than children in the simulated standardization sample.In contrast, children with ADHD did not perform differently, on average,than non-ADHD children. These group differences mirror past research onchildren with ADHD versus nonclinical children that found children with
Dow
nloa
ded
by [M
issi
ssip
pi S
tate
Uni
vers
ity L
ibra
ries]
at 0
6:27
21
June
201
2

Diagnostic Utility of WISC-IV 149
FIGURE 5 Receiver operating characteristic curve of school children with attention deficithyperactivity disorder compared with the simulated Wechsler Intelligence Scale for Children-Fourth Edition standardization sample.
FIGURE 6 Receiver operating characteristic curve of school children with attention deficithyperactivity disorder compared with the matched special education comparison sample.
Dow
nloa
ded
by [M
issi
ssip
pi S
tate
Uni
vers
ity L
ibra
ries]
at 0
6:27
21
June
201
2

150 S. E. Devena and M. W. Watkins
ADHD to exhibit VCI and PRI scores higher than their PSI and WMI scores(Mayes & Calhoun, 2006; Wechsler, 2003b).
However, group mean differences on GAI-CPI discrepancy scores donot necessarily indicate clinical utility for individual children (Watkins,2009). ROC analyses demonstrated that the GAI-CPI discrepancy method canaccurately distinguish a randomly chosen child with ADHD from a randomlychosen nonclinical child 64% of the time for the hospital sample and 63% ofthe time for the school sample compared with 84% of the time when childbehavior checklists are employed (Chen, Faraone, Biederman, & Tsuang,1994). ROC analyses also revealed that GAI-CPI difference scores cannotdistinguish between children with ADHD versus those with other clinicaldisorders from the same hospital and schools at greater than chance lev-els. Thus, using the GAI-CPI cognitive profile to distinguish children withADHD is less accurate than the methods already used by many cliniciansand considered best practice for identifying children with ADHD (AmericanAcademy of Child and Adolescent Psychiatry, 2007).
Limitations
As with all research, this study was marked by several limitations. The firstlimitation was the diagnoses given to participants. The examining psychol-ogists used a variety of methods to diagnose ADHD. Although each childin these samples was given a psychological evaluation, his or her diagno-sis was based on a variety of tests, interviews, behavioral checklists, andclinical judgments not necessarily consistent with the Diagnostic and Sta-tistical Manual for Mental Disorders (4th edition; American Psychiatric As-sociation, 2000) criteria. In addition, many of the children with ADHD hadco-morbid diagnoses. Comorbidity, however, is a common occurrence forchildren with ADHD (Acosta, Arcos-Burgos, & Muenke, 2004; Faraone &Biederman, 1998). Furthermore, children included in this study had a mix-ture of ADHD subtypes including primarily inattentive, primarily hyperac-tive, combined, and NOS. Differences have been found in the cognitiveprocesses of children with primarily hyperactive and combined types ofADHD compared with children with the primarily inattentive type of ADHD(Schwean & McCrimmon, 2008). In addition, children that are diagnosed withADHD-NOS do not meet the necessary criteria for ADHD (American Psychi-atric Association, 2000). However, when children with ADHD-NOS were re-moved from the hospital sample the result of the ROC analyses were almostidentical.
A second limitation is that medication use of participants was not known.The effect of medication on children with ADHD has not shown to changecognitive impairments but has been shown to normalize deficits in executivefunctioning including working memory (Schwean & McCrimmon, 2008). As
Dow
nloa
ded
by [M
issi
ssip
pi S
tate
Uni
vers
ity L
ibra
ries]
at 0
6:27
21
June
201
2

Diagnostic Utility of WISC-IV 151
a result, children with ADHD who were on medication may have achievedhigher CPI scores than children with ADHD not on medication.
A final limitation is the generalizability of these results to other children.The samples were not collected from random hospitals and school districts.This resulted in the samples being demographically and regionally limited.In addition, simulated data were used instead of actual participants from theWISC-IV standardization sample. As a result, caution should be used whenapplying these study results to other groups of children.
Future Research
Future research should continue to address GAI-CPI difference scores aspossible indicators of ADHD. Method of diagnosis, co-morbidity, medicationusage, and ADHD subtypes should be controlled in order to allow unam-biguous diagnostic utility results to emerge. Additional research should alsobe conducted on GAI-CPI discrepancy scores for other specialized groups ofchildren. Specifically, groups of children with learning disabilities, traumaticbrain injury, and Asperger’s syndrome who have been hypothesized to havenoteworthy GAI-CPI difference scores (Weiss & Gable, 2007). This researchshould assess GAI-CPI difference scores without depending on cutoff scoresor base rates (Swets, 1988).
Implications
Although the study results should be considered preliminary because of itslimitations, clinicians should be cautious about interpreting WISC-IV GAI-CPIdifference scores as evidence of ADHD. GAI-CPI difference scores, althoughstatistically significant between groups, have little to no individual diagnosticaccuracy (Swets, 1988). As with past research, GAI-CPI difference scoresalone should not be considered diagnostic markers of ADHD (Weiss & Gable,2007). Unless additional research indicates that there is higher diagnosticaccuracy of GAI-CPI difference scores to differentiate children with ADHDfrom those without ADHD this method should not be used by clinicians.
REFERENCES
Acosta, M. T., Arcos-Burgos, M., & Muenke, M. (2004). Attention deficit/hyperactivitydisorder (ADHD): Complex phenotype, simple genotype? Genetics in Medicine,6, 1–15.
Adams, P. F., Lucas, J. W., & Barnes, P. M. (2008). Summary health statistics forU.S. children: National Health Interview Survey 2006. Vital Health Statistics, 10,1–104.
American Academy of Child and Adolescent Psychiatry. (2007). Practice param-eter for the assessment and treatment of children and adolescents with
Dow
nloa
ded
by [M
issi
ssip
pi S
tate
Uni
vers
ity L
ibra
ries]
at 0
6:27
21
June
201
2
152 S. E. Devena and M. W. Watkins
attention-deficit/hyperactivity disorder. Journal of the American Academy ofChild and Adolescent Psychiatry, 46, 894–921.
American Psychiatric Association. (2000). Diagnostic and statistical manual of men-tal disorders (4th ed., text rev.). Washington, DC: Author.
Anastopoulos, A. D., Spisto, M. A., & Maher, M. C. (1994). The WISC-III Freedomfrom Distractibility factor: Its utility in identifying children with attention deficithyperactivity disorder. Psychological Assessment, 6, 368–371.
Bamber, D. (1975). The area above the ordinal dominance graph and the area belowthe receiver operating characteristic graph. Journal of Mathematical Psychology,12, 387–415.
Barkley, R. A. (1991). The ecological validity of laboratory and analogue assess-ment methods of ADHD symptoms. Journal of Abnormal Child Psychology, 19,149–178.
Bray, M. A., Kehle, T. J., & Hintze, J. M. (1998). Profile analysis with the Wechslertest: Why does it persist? School Psychology International, 19, 209–220.
Canivez, G. L., & Watkins, M. W. (1998). Long-term stability of the Wechsler In-telligence Scale for Children–Third Edition. Psychological Assessment, 10, 285–291.
Centers for Disease Control and Prevention. (2005). Mental health in the UnitedStates: Prevalence of diagnosis and medication treatment for attention-deficithyperactivity disorder—United States, 2003. Morbidity and Mortality WeeklyReport, 54, 842–847.
Centor, R. M., & Schwartz, J. S. (1985). An evaluation of methods for estimating thearea under the receiver operating characteristic (ROC) curve. Medical DecisionMaking, 5, 149–156.
Chen, W. J., Faraone, S. V., Biederman, J., & Tsuang, M. T. (1994). Diagnosticaccuracy of the Child Behavior Checklist Scales for attention-deficit hyperactivitydisorder: A receiver-operating characteristic analysis. Journal of Consulting andClinical Psychology, 62, 1017–1025.
DuPaul, G. J. (1992). How to assess attention-deficit hyperactivity disorder withinschool settings. School Psychology Quarterly, 7, 60–74.
Elwood, R. W. (1993). Psychological tests and clinical discriminations: Begin-ning to address the base rate problem. Clinical Psychology Review, 13, 409–419.
Faraone, S. V., & Biederman, J. (1998). Neurobiology of attention-deficit hyperactivitydisorder. Biological Psychiatry, 44, 951–958.
Fawcett, T. (2006). An introduction to ROC analysis. Pattern Recognition Letters, 2,861–874.
Feldt, L. S., & Brennan, R. L. (1993). Reliability. In R. L. Linn (Ed.), Educationalmeasurement (3rd ed., pp. 105–146). Phoenix, AZ: Oryx Press.
Frazier, T. W., Youngstrom, E. A., Glutting, J. J., & Watkins, M. W. (2007). ADHDand achievement: Meta-analysis of the child, adolescent, and adult literaturesand a concomitant study with college students. Journal of Learning Disabilities,40, 49–65.
Gussin, B., & Javorsky, J. (1995). The utility of the WISC–III freedom from distractibil-ity in the diagnosis of youth with attention deficit hyperactivity disorder in apsychiatric sample. Diagnostique, 21, 29–40.
Dow
nloa
ded
by [M
issi
ssip
pi S
tate
Uni
vers
ity L
ibra
ries]
at 0
6:27
21
June
201
2

Diagnostic Utility of WISC-IV 153
Hajian-Tilaki, K. O., Hanley, J. A., Joseph, L., & Collet, J. P. (1997). A comparisonof parametric and nonparametric approaches to ROC analysis of quantitativediagnostic tests. Decision Making, 17, 94–102.
Hanley, J. A., & McNeil, B. J. (1982). The meaning and use of the area under anROC curve. Radiology, 143, 29–36.
Joschko, M., & Rourke, B. P. (1985). Neuropsychological subtypes of learning-disabled children who exhibit the ACID pattern on the WISC. In B. P. Rourke(Ed.), Neuropsychology of learning disabilities (pp. 65–88). New York, NY: Guil-ford Press.
Kaufman, A. S. (1994). Intelligent testing with the WISC-III. New York, NY: Wiley.Kaufman, A. S., & Lichtenberger, E. O. (2000). Essentials of WISC-III and WPPSI-R
assessment. New York, NY: Wiley.Mayes, S. D., & Calhoun, S. L. (2006). WISC-IV and WISC-III profiles in children with
ADHD. Journal of Attention Disorders, 9, 486–493.Mayes, S. D., Calhoun, S. L., & Crowell, E. W. (1998). WISC-III freedom from dis-
tractibility as a measure of attention in children with and without attentiondeficit hyperactivity disorder. Journal of Attention Disorders, 2, 217–227.
Metz, C. E. (1978). Basic principles of ROC analysis. Seminars in Nuclear Medicine,8, 283–298.
Pepe, M. S. (2003). Statistical evaluation of medical tests for classification and pre-diction. New York, NY: Oxford University Press.
Pintea, S., & Moldovan, R. (2009). The receiver-operating characteristics (ROC) anal-ysis: Fundamentals and applications in clinical psychology. Journal of Cognitive& Behavioral Psychotherapies, 9, 49–66.
Power, T. J., & Ikeda, M. J. (1996). The clinical utility of behavior rating scales:Comments on the diagnostic assessment of ADHD. Journal of School Psychology,34, 379–385.
Prifitera, A., & Dersh, J. (1993). Base rates of WISC-III diagnostic subtest patternsamong normal, learning-disabled, and ADHD samples. Journal of Psychoedu-cational Assessment, WISC-III Monograph, 43–55.
Raiford, S. E., Weiss, L. G., Rolfhus, E. L., & Coalson, D. (2005). Wechsler IntelligenceScale for Children-Fourth Edition, General Ability Index (Technical Report No.4). San Antonio, TX: Harcourt Assessment.
Ruttimann, U. E. (1994). Statistical approaches to development and validation ofpredictive instruments. Critical Care Clinics, 10, 19–35.
Ryan, J. J., Glass, L. A., & Bartels, J. M. (2010). Stability of the WISC-IV in a sampleof elementary and middle school children. Applied Neuropsychology, 17, 68–72.
Sattler, J. M. (2008). Assessment of children: Cognitive foundations (5th ed.). SanDiego, CA: Jerome M. Sattler.
Schwean, V. L., & McCrimmon, A. (2008). Attention-deficit/hyperactivity disorder:Using the WISC-IV to inform intervention planning. In A. Prifitera, D. H.Saklofske, & L. G. Weiss (Eds.), WISC-IV clinical assessment and intervention(pp. 193–215). San Diego, CA: Academic Press.
Skounti, M., Philalithis, A., & Galanakis, E. (2007). Variations in prevalence of atten-tion deficit hyperactivity disorder worldwide. European Journal of Pediatrics,166, 117–123.
Dow
nloa
ded
by [M
issi
ssip
pi S
tate
Uni
vers
ity L
ibra
ries]
at 0
6:27
21
June
201
2

154 S. E. Devena and M. W. Watkins
Snow, J. B., & Sapp, G. L. (2000). WISC-III subtest patterns of ADHD and normalsamples. Psychological Reports, 87, 759–765.
Swartz, C. L., Gfeller, J. D., Hughes, H. M., & Searight, H. R. (1998). The prevalenceof WISC–III profiles in children with attention deficit hyperactivity disorder andlearning disabilities. Archives of Clinical Neuropsychology, 13, 85.
Swets, J. A. (1988). Measuring the accuracy of diagnostic systems. Science, 240,1285–1293.
Watkins, M. W. (2003). IQ subtest analysis: Clinical acumen or clinical illusion.Scientific Review of Mental Health Practice, 2, 118–141.
Watkins, M. W. (2009). Errors in diagnostic decision making and clinical judgment.In T. B. Gutkin & C. R. Reynolds (Eds.), Handbook of school psychology (4thed., pp. 210–229). New York, NY: Wiley.
Watkins, M. W., Glutting, J. J., & Youngstrom, E. A. (2005). Issues in subtest profileanalysis. In D. P. Flanagan & P. L. Harrison (Eds.), Contemporary intellectualassessment: Theories, tests, and issues (2nd ed., pp. 251–268). New York, NY:Guilford Press.
Watkins, M. W., Kush, J. C., & Glutting, J. J. (1997a). Prevalence and diagnosticutility of the WISC–III SCAD profile among children with disabilities. SchoolPsychology Quarterly, 12, 235–248.
Watkins, M. W., Kush, J. C., & Glutting, J. J. (1997b). Discriminant and predictivevalidity of the WISC–III ACID profile among children with learning disabilities.Psychology in the Schools, 34, 309–319.
Wechsler, D. (1974). Wechsler Intelligence Scale for Children—Revised. San Antonio,TX: Psychological Corporation.
Wechsler, D. (1991). Wechsler Intelligence Scale for Children-Third Edition. SanAntonio, TX: Psychological Corporation.
Wechsler, D. (2003a). Wechsler Intelligence Scale for Children-Fourth Edition. SanAntonio, TX: Psychological Corporation.
Wechsler, D. (2003b). WISC-IV technical and interpretive manual. San Antonio, TX:Psychological Corporation.
Weiss, L. G., Beal, A. L., Saklofske, D. H., Alloway, T. P., & Prifitera, A. (2008).Interpretation and intervention with the WISC-IV in the clinical assessmentcontext. In A. Prifitera, D. H. Saklofske, & L. G. Weiss (Eds.), WISC-IV clinicalassessment and intervention (pp. 3–66). San Diego, CA: Academic Press.
Weiss, L. G., & Gabel, A. D. (2007). Using the cognitive proficiency index in psychoe-ducational assessment (Technical Report No. 6). San Antonio, TX: HarcourtAssessment.
Wielkiewicz, R. M. (1990). Interpreting low scores on the WISC-R third factor: It’smore than distractibility. Psychological Assessment: A Journal of Consulting andClinical Psychology, 2, 91–97.
Wilson, M. S., & Reschly, D. J. (1996). Assessment in school psychology training andpractice. School Psychology Review, 25, 9–23.
Dow
nloa
ded
by [M
issi
ssip
pi S
tate
Uni
vers
ity L
ibra
ries]
at 0
6:27
21
June
201
2