Embed Size (px)
Citation preview
IZA DP No. 1584
Differences in Desired and Actual Fertility:An Economic Analysis of the Spanish Case
Alicia Adsera
DI
SC
US
SI
ON
P
AP
ER
S
ER
IE
S
Forschungsinstitut
zur Zukunft der Arbeit
Institute for the Study
of Labor
May 2005
Differences in Desired and
Actual Fertility: An Economic Analysis of the Spanish Case
Alicia Adsera University of Illinois at Chicago, University of Chicago
and IZA Bonn
Discussion Paper No. 1584 May 2005
IZA
P.O. Box 7240 53072 Bonn
Germany
Phone: +49-228-3894-0 Fax: +49-228-3894-180
Email: [email protected]
Any opinions expressed here are those of the author(s) and not those of the institute. Research disseminated by IZA may include views on policy, but the institute itself takes no institutional policy positions. The Institute for the Study of Labor (IZA) in Bonn is a local and virtual international research center and a place of communication between science, politics and business. IZA is an independent nonprofit company supported by Deutsche Post World Net. The center is associated with the University of Bonn and offers a stimulating research environment through its research networks, research support, and visitors and doctoral programs. IZA engages in (i) original and internationally competitive research in all fields of labor economics, (ii) development of policy concepts, and (iii) dissemination of research results and concepts to the interested public. IZA Discussion Papers often represent preliminary work and are circulated to encourage discussion. Citation of such a paper should account for its provisional character. A revised version may be available directly from the author.
IZA Discussion Paper No. 1584 May 2005
ABSTRACT
Differences in Desired and Actual Fertility: An Economic Analysis of the Spanish Case∗
Family size is the outcome of sequential decisions influenced both by preferences and by ongoing changes in the environment where a family lives. During the last two decades the gap between the number of children women prefer and their actual fertility has widened in Spain. The paper uses the 1985 and 1999 Spanish Fertility Surveys to study whether the tightening of the labor market and worsening of economic conditions in Spain during the last twenty years are important determinants of this change. I find that women facing high unemployment rates in their mid-twenties tend to restrict their fertility below their ideal level. Among working-women, the stability of a public sector job lessens the difficulties of balancing work and family and of achieving preferred fertility. Temporary contracts work in the opposite direction. Findings are robust to the inclusion of controls for the use of family planning as well as within-couple discrepancies in either preferences or religious affiliation. JEL Classification: J13, J2, J6, Z13 Keywords: fertility, desired number of children, unemployment, family planning, religion Corresponding author: Alicia Adsera Department of Economics University of Illinois at Chicago 601 S. Morgan St. Chicago, IL 60607 USA Email: [email protected]
∗ This paper was made possible by Grant Numbers P30-HD18288 and T32-HD007302 from the NICHD. Its contents are solely the responsibility of the author and do not necessarily represent the official views of the NIH.
3
INTRODUCTION
Fertility behavior has undergone major changes in Europe in general and in Spain in
particular during the last decades. Within a general trend of declining fertility rates in Europe,
Spain has experienced the most dramatic fall in birth rates. The Spanish fertility rate dropped from
2.8 in 1975 to 1.15 in 1997, only to recover very lightly to 1.2 in recent years. Although desired
fertility also went down in Spain and across Europe generally, it fell at a slower pace than fertility
rates (John Bongaarts 2001, Joshua R. Goldstein, Wolfgang Lutz and Maria Rita Testa 2003). As a
result, the gap between ideal and achieved fertility increased in Spain in the last two decades. This
paper employs the 1985 and 1999 Spanish Fertility Surveys to determine the nature and the
determinants of this growing gap. Amending current research, which has emphasized the
availability of contraceptives, heterogeneity of preferences within the couple and the religious
make-up of the family, I show that economic conditions, and, more specifically, unemployment,
are powerful determinants of the gap between preferred and actual fertility.
Although individual childbearing preferences are known to be reasonable predictors of
future births (Ronald Freedman, Deborah Freedman and Arland Thornton 1980, Elizabeth
Thomson, Elaine McDonald, and Larry L Bumpass 1990, Elizabeth Thomson 1997), they do not
fully explain the observed level of fertility (Norman Ryder 1973, Charles Westoff and Norman
Ryder 1977). To account for the gap between individual reproductive desires and fertility
outcomes, scholars have traditionally resorted to the factors that characterize the individual and the
union she forms such as religious practice, or certainty of initial preferences among other things
(Evelyn Lehrer 1996, Robert Schoen et al. 1999). [footnote 1]
4
However, the broad economic environment in which individuals make both work and
fertility choices must also be a key factor in explaining any mismatch between women’s (and
men’s) desires and their final realization.
During the last two decades, the high level of unemployment and its persistence have
probably been the most important changes that have affected the lives of young Spaniards. The
failure of young couples to obtain stable employment has notably restricted their ability to leave
their parents home, obtain mortgages and, as I argue in this paper, make childbearing choices. The
aim of the paper is to study whether the tightening of the labor market and worsening of economic
conditions in Spain during the last two decades are important determinants of the widening of the
mismatch between the number of children women consider ideal and their actual fertility. Further,
the paper tests whether these findings are robust to the inclusion of additional relevant factors.
The paper is organized as follows. The first section explores the set of factors that may
explain that mismatch between preferred and realized fertility. I first focus on how aggrega te and
individual economic and labor conditions affect individual fertility choices. I then discuss two
alternative/complementary stories: use of family planning, and the effect on family- investments of
within-couple differences in family-size preferences or in religious orientation. The second section
describes the covariates as well as the methodology employed to test the different hypotheses. The
third section presents the results both for the 1985 and 1999 Spanish Fertility Surveys (SFS). The
fourth section concludes.
5
THE ANALYTICAL FRAMEWORK
Aggregate and Individual Economic Conditions
Employment uncertainty since the mid 1980s has played a central role in the sharp fall of
fertility rates and in the postponement of childbearing in all Western Europe (Alicia Adsera 2004
a, 2005). Unemployment rates for young women in Spain were close to 40% at several points
during the last two decades. The long-term unemployment rate, the proportion of those who had
been unemployed for more than a year among jobless, stayed over 50% throughout the same
period.
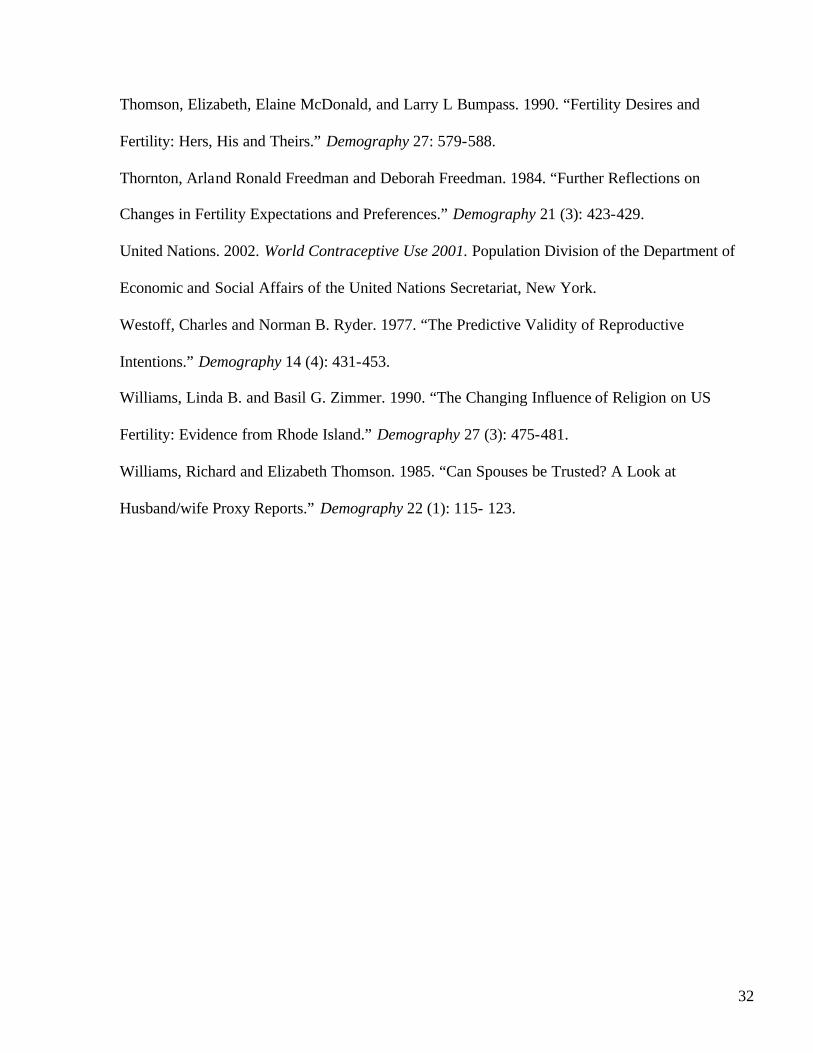
Both the 1985 and the 1999 SFS ask individuals about their reasons for either restricting
their fertility or for the presence of a mismatch between their desired family size and their actual
offspring. In the 1985 SFS women were asked whether they intended to have more children
beyond their actual number and if not, why and under what conditions they would change their
minds. Table 1.1 includes the responses among women in the sample of analysis. Less than half of
those not intending to have more children had achieved their ideal number. Among those who had
not attained the desired family size, the most cited reasons for restricting fertility were advanced
age, concerns about the economy and health problems. Among those in the younger cohorts,
economic constraints and economic pessimism about the future of their children were ranked at the
top. An increase in the spouse’s income and an improvement in economic conditions were the
most cited basis that would encourage women to have more children.
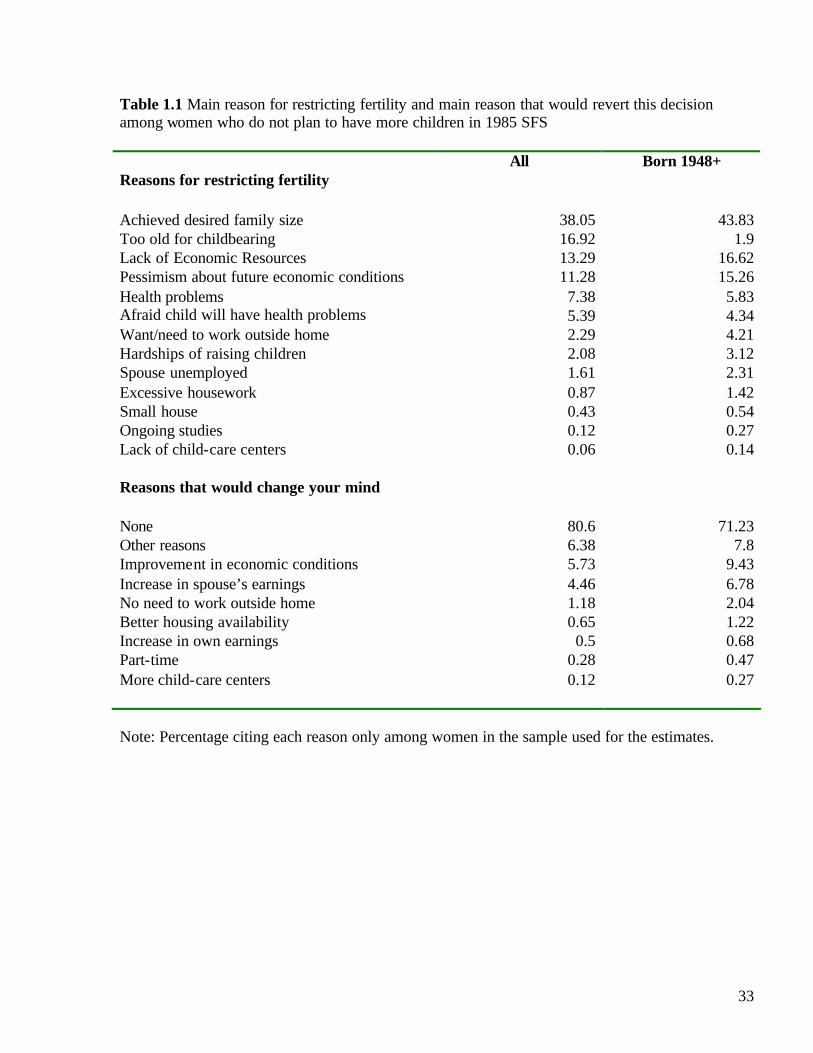
Since unemployment rose sharply starting in the mid 1980s, economic conditions played an
even more relevant role in the 1999 SFS. Table 1.2 tabulates the proportion of individuals that
stated that there was a difference between their preferred fertility and their actual number of
children and the reason for that mismatch. Over a third of women report the existence of a gap
6
between their preferences and their actual fertility (36.6%). Of those, around a third are still open
to having more children as they consider their childbearing not finished. Among the rest, again,
age and health problems are prominent on the list. But, most importantly, economic constraints are
ranked at the top (26% of all respondents). Necessity to work outside of the home and
unemployment of either the woman or her spouse are also widely cited.
As unemployment became more persistent over recent decades, I expect to observe an
increasing relevance of adverse economic conditions on childbearing choices from the 1985 SFS to
the 1999 SFS. Cyclical and short-term unemployment may lead to a countercyclical fertility
behavior. Women adjust their childbearing plans along the cycle to attain their preferred family
size. However, in the presence of persistent unemployment, a withdrawal of the labor force to bear
children likely carries long-term negative income effects. Women are likely to postpone
childbearing until they achieve either a stable position or sufficient experience to easily land a job
after childbearing. This results in a reduction of overall family size since women who become
mothers late are expected to bear fewer children by the end of their fertile life (John Boongarts
2001). In addition to harsh aggregate economic conditions, unforeseen individual shocks such as
the personal experience of a long-term unemployment spell may further discourage the already
belated childbearing plans as families intensify their precautionary behavior.
Rampant unemployment in Spain was accompanied by a segmentation of the labor market
by age. During the last two decades, mature workers in Spain held protected jobs while younger
cohorts experienced high turnover rates across precarious jobs in the lower end of a dual market.
Young women faced a choice of sticking to their unstable job trading off childbearing for the hope
of employment security or struggling to re-enter the labor force after childbirth (Paula Adam
1996). Lack of employment stability among young men contributed further to depressing fertility
7
(Namkee Ahn and Pedro Mira 2001, Maria Gutierrez-Domenech 2002). As a result, besides
aggregate economic conditions, the particular type of employment that each woman (and her
spouse) secures for herself is likely to have differential effects in her ability to fulfill her
childbearing plans (Adsera 2004 a). Positions that shelter individuals from the uncertainty of job
turnover, such as tenured jobs, should lessen the negative impact of aggregate conditions on
achieved fertility and allow couples to move closer to the ir preferred family size. Among those,
public sector jobs constitute the most stable type of labor contracts in European countries. I expect
public employees to exhibit narrower mismatch in their fertility behavior than those working in
more precarious positions in the private sector.
Family Planning
The health literature emphasizes the costs and the lack of access to contraceptives as key factors
restricting the ability of a couple to control their family size. In our analysis, however, absence of
family planning may operate in both directions. On the one hand, women with a stable partner who
do not regularly use contraceptive methods are clearly more likely to exceed their preferred
number of children. On the other hand, if the absence of family planning is due either to known
infertility or to uncompleted fertility, women not using contraceptives should likely have smaller
families than their preferred size.
The literature on interdenominational differences of fertility has noted the more pronatalist
orientation of certain churches such as Conservative Protestants, Catholics, and especially
Mormons (Evelyn Lehrer 1996). Among Catholics, a possible source of those differences may lie
on Church teachings, which impose a restrictive use of contraception. Accordingly if Spain were
considered mostly a Catholic country, the absence of family planning would lead to a high
8
incidence of overshooting in the number of children. However, two observations conflict with this
expectation. First, religious practice among Spanish Catholics has sharply decreased since the
onset of democracy in 1975. Pablo Branas and Shoshana Neuman (2004) show how, even though
the majority of Spaniards still define themselves as Catholics, only a minority attends Mass
regularly and adheres to the main teachings of the Catholic Church. Further, it is widely
acknowledged that adherence to Church recommendations among Catholics worldwide has
weakened (Calvin Goldscheider and William D. Mosher 1991) and this seems to have happened at
a relatively faster pace in Spain. The most recent data on the use of modern methods of
contraception place Spain, where 67.5% of all married women of reproductive age use them (and
81% use some contraceptive method), at a level similar to that of Northern European countries or
United States, and well above other traditionally Catholic countries such as Italy or Austria (with,
respectively, a 39% and 46.8% prevalence of modern contraceptive use) (United Nations 2002).
Further, among those who report a mismatch between actual and desired family size in the 1999
SFS, only less than 2% report to lack of familiarity with the use of contraceptives (see Table 1.2).
Preference Differences within the Couple
Researchers find that the predictive validity of reported preferences increases after an adjustment
occurs early in the marriage and that within-couple discrepancy in desires also affects final parity
(Robert Freedman, Deborah Freedman and Arland Thornton 1980, Arland Thornton, Robert
Freedman and Deborah Freedman 1984). Within an economic framework, discrepancy among
spouses on preferred family size should have a downward effect on fertility as children represent
long-term financial commitments specific to the couple. Preference differences may indicate an
increased frailty or lower quality of the union, and rational individuals may be less likely to incur
9
in union-specific investments. Elizabeth Thomson’s (1997) findings for the US confirm this
hypothesis: couples disagreements about birth desires result in smaller families.
Still, given that some adjustment occurs along the marriage and that preferences reported
later in a relationship may already embody the result of a bargaining process within the couple
(Elizabeth Thomson, Elaine McDonald and Larry L. Bumpass 1990), an analysis of the
discrepancy in desires at different points in time should bring important insights. Preference
differences would likely be larger at time of marriage than when the couple has already lived
together some time. [footnote 2] As a result, we may expect that a preference mismatch within a
couple at the time of the marriage would explain better the gap between women’s desires at the
time of marriage and actual fertility than the gap with respect to preferences expressed later in the
marriage.
Religious Composition of the Couple
Even if family size has been shown to vary across religious denominations and to be relatively
larger among those with more frequent church attendance (William D. Mosher and Gerry E.
Hendershot 1984, Linda B. Williams and Basil G. Zimmer 1990, William Sander 1992, Evelyn
Lehrer 1996, Alicia Adsera 2004 b), its variation across religious groups should be explained by
differences in preferences once other relevant factors are accounted for. Thus, we should not
expect to observe any regularity across religious denominations and the gap between ideal and
actual family size. As a matter of fact, researchers do not find any systematic discrepancy between
the desired number of children and final parity across religions in the United States (Freedman et
al. 1980).
10
Nonetheless, religious differences within the couple may affect the gap between ideal and
actual fertility as follows. Gary S. Becker, Elisabeth M. Landes and Robert T. Michael (1977)
suggest that the religious composition of unions, whether inter-faith (heterogamous unions) or
homogamous unions, should influence their fertility. Children represent “spouse-specific” human
capital, capital that decreases in value following marriage dissolution. The lower stability of inter-
faith marriages should thus reduce the number of births within those marriages (“the marital
stability effect”). Lehrer (1996 2004) notes a second pathway linking inter- faith marriage to low
fertility. Spouses’ religious denominations may have conflicting views with regard to family size.
How spouses settle those differences (“the bargaining effect”) depending on the particular
religious composition of the couple may reinforce the first effect. Evelyn Lehrer and Carmel
Chiswick (1993) find strong evidence of a larger fragility of intermarriages. Using U.S. data
Lehrer (1996) finds support for the hypothesis that inter- faith couples restrict their fertility, even
while the marriage is in place and that the extent of the effect depends on the particular
composition of the marriage. Similarly, Adsera (2004 b) finds a slower transition to births among
Spanish heterogamous couples, particularly among those with a non-Catholic spouse.
If, on average, interfaith couples invest less in spouse-specific capital, they are expected to
restrict their fertility down from their preferred size. Thus this should result in a higher degree of
mismatch between women’s preferred and achieved fertility among inter-faith couples than among
homogamous unions.
DATA AND METHODOLOGY
To explore the determinants of the gap between preferred and actual fertility I use the 1985 and
1999 Spanish Fertility Surveys (SFS), which were addressed to women aged 15 to 49 living in
11
Spain. The surveys follow the guidelines of the Fertility Surveys from the United Nations. One
woman was interviewed in each household. The total number of interviews available in the 1985
Survey was 8,782 and, for the purpose of this paper, we have complete information on 5,043
married women. In the 1999 Survey, a total of 7,749 respondents were interviewed and the sample
used in the paper comprises 4,346 married women.
The analyses in this paper are restricted to marital fertility. Consensual unions were rare
until recently. Though their prevalence is much higher among the youngest generation, first births
within a consensual union only constitute 2.5% of total first births reported in the 1999 SFS.
Both the 1985 and 1999 SFS report the preferred family size of each woman at the time of
the interview. The 1985 SFS also measured the preferred size at time of marriage for a small
sample of women as well as that of their husbands as reported by the wives. [footnote 3]
The dependent variables of the paper are (1) the gap between currently desired and
achieved fertility; and (2) the same gap with respect to the preferred number at the time of
marriage. I construct two different dependent variables to see whether results are robust to the
particular measure of desires employed or whether some type of adjustment in the preferences
occurs over time, as that found by previous research (Akinrinola Bankole and Charles F. Westoff
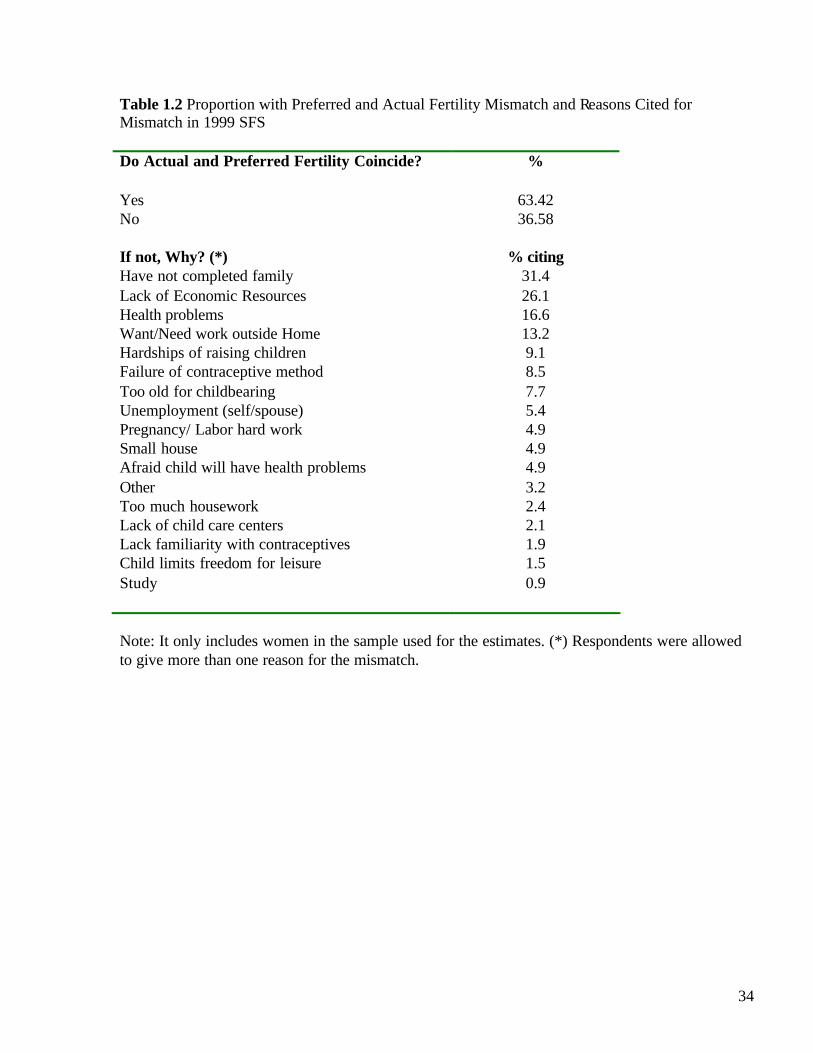
1998, Freedman et al. 1980). Table 2.1 reports the means of the dependent variables across birth
cohorts as well as the size of the sample, in brackets, when information about preference at time of
marriage is used. I have divided the sample of each survey in two age groups: those who are closer
to or at the end of their fertile life, women aged 38 to 49 and those who are under 38 years of age.
The mean of the dependent variable is negative for the 1985 SFS and positive for the 1999
SFS. A negative sign implies that the final family size has overshoot initial preferences whereas a
positive number points to unattained ideal family size.
12
In addition, Table 2.1 includes the actual number of children in the marriage. Family size
went down from 3.84 children, among married women born before 1948, to 2.11 children among
those aged over 38 in the 1999 SFS. The ideal number of children, however, only suffered a
moderate decline from 2.86 to 2.44 for those same cohorts.
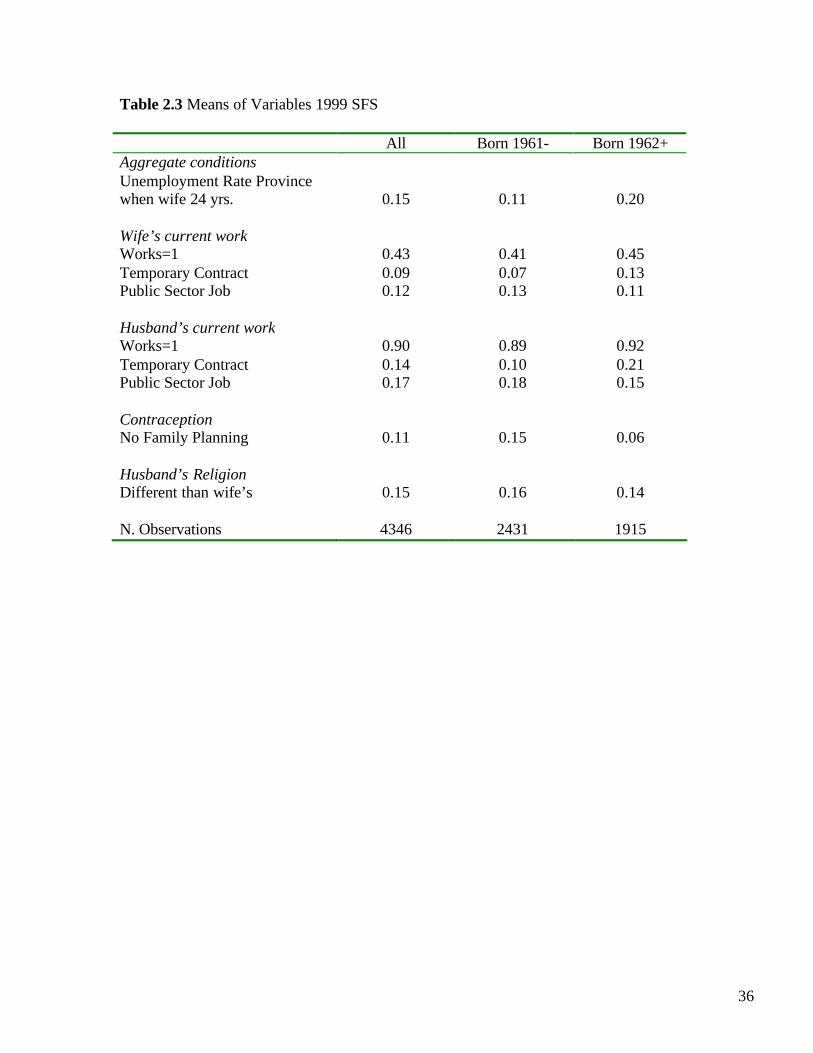
To examine what accounts for the mismatch, I consider the following variables (whose
means are reported in Tables 2.2 and 2.3):
(1) Aggregate Labor Market Conditions. The provincial unemployment rate prevalent at
the time the woman was 24 years old is used as a proxy of the early labor market opportunities for
the wife (and, to some extent, her spouse). The mean unemployment rate sharply moves up from
6% in the 1985 SFS to 15% in the 1999 SFS and reaches 20% for those born after 1961.
(2) Individual Employment. Neither survey includes a complete retrospective labor market
history of the woman or her spouse but both provide general information on labor market activity.
In the 1985 SFS I take into account whether the wife worked after getting married and for how
many years as well as some characteristics of the last (or current) job held. The categories are
white collar, blue collar, family help and businesswoman. [footnote 4]
The 1999 SFS contains information on the current work of both the wife and her husband.
A set of dummies indicates, first, whether they work and, then, whether their contract is temporary
and whether they work for the public sector. Around 43% of the women and 90% of the men in the
sample currently work. Of those, around 28% of the women and 19% of the men work in the
public sector and 21% of the women and 15% of the men have a temporary contract. Among those
born after 1961, the proportion of women and men working under temporary contracts stands,
respectively, at 29% and 23%. As already noted, in the context of European markets a public
sector job is in general a tenured position whereas temporary contracts are relatively fragile jobs.
13
(3) Family Planning. Contraceptive use is available in both surveys. I code it as a dummy
variable with a value of 1 if the respondent has never used family planning. The proportions are
noticeable low, around 13% and 11% in each Survey respectively.
(4) Preference Differences. The 1985 survey provides informa tion on the desired family
size at the time of marriage for both the wife and her spouse for a small sub-sample of individuals
(sample size in included in Table 2.2). I construct a dummy variable to record the presence of a
difference in the desired number of children of both spouses as reported by the woman.
Discrepancy in fertility desires among spouses occurs in 20% of those couples. Women desired
either one or two more children than their spouses in 7% and 2.7% of all couples respectively.
Conversely, men desired either one or two more children than their wife’s in 5.4% and 1.56% of
those couples. Since women tend to have a higher preferred fertility, the mean difference between
women and men’s desires is positive and equal to 0.057.
(5) Religious Composition of the Couple. Only the 1999 SFS provides information on the
religious affiliation of both spouses. The question is posed about current religious beliefs and no
information is available on the religious family background. Since the majority of Spaniards have a
Catholic upbringing, the main distinction between individuals is religious practice. Practicing and
non-practicing Catholics are considered to belong to different groups. Adsera (2004 b) finds both
groups to have distinctively different fertility patterns in Spain. The alternative categories include
those with no affiliation, Muslims and Protestants. Inter- faith unions amount to 15% of the couples
in the 1999 SFS.
(6) Control Variables. Duration of the marriage, age at marriage, children out-of-wedlock,
religion, wife and husband’s education at the time of the survey, region of residence as well as size
of the city of residence are included in the analyses of both samples. City sizes for the 1985 SFS

14
are rural, small (under 100,000 inhabitants) or large (over 100,000). Categories in the 1999 SFS
are: rural (less 10,000), small (10,000-50,000), medium (50,000-500,000) or large (over 500,000).
In the 1985 SFS four categories for religious affiliation of the woman are included:
practicing Catholic, non-practicing Catholic, no religion and other religion (a small mixed group
that contains mainly Muslims and Conservative Protestants). As shown in Appendix A, the
majority of women (61 %) consider themselves practicing Catholics in the 1985 SFS but their
share is only 51% among those born after 1947. The 1999 Survey provides five distinct categories:
practicing Catholic, non-practicing Catholic, no beliefs, other religion (mainly Muslims and
Conservative Protestants) and own beliefs. In the 1999 SFS non-practicing Catholics (49%) are
already the major group.
Educational groups include those with primary or less, low secondary (the omitted
category), completed high school, vocational school and two-year and four-year college degrees.
[footnote 5] Additiona lly, in the 1985 estimates I control whether either the wife or the husband
had more than 2 siblings and in the 1999 SFS whether the woman was a student and/or born
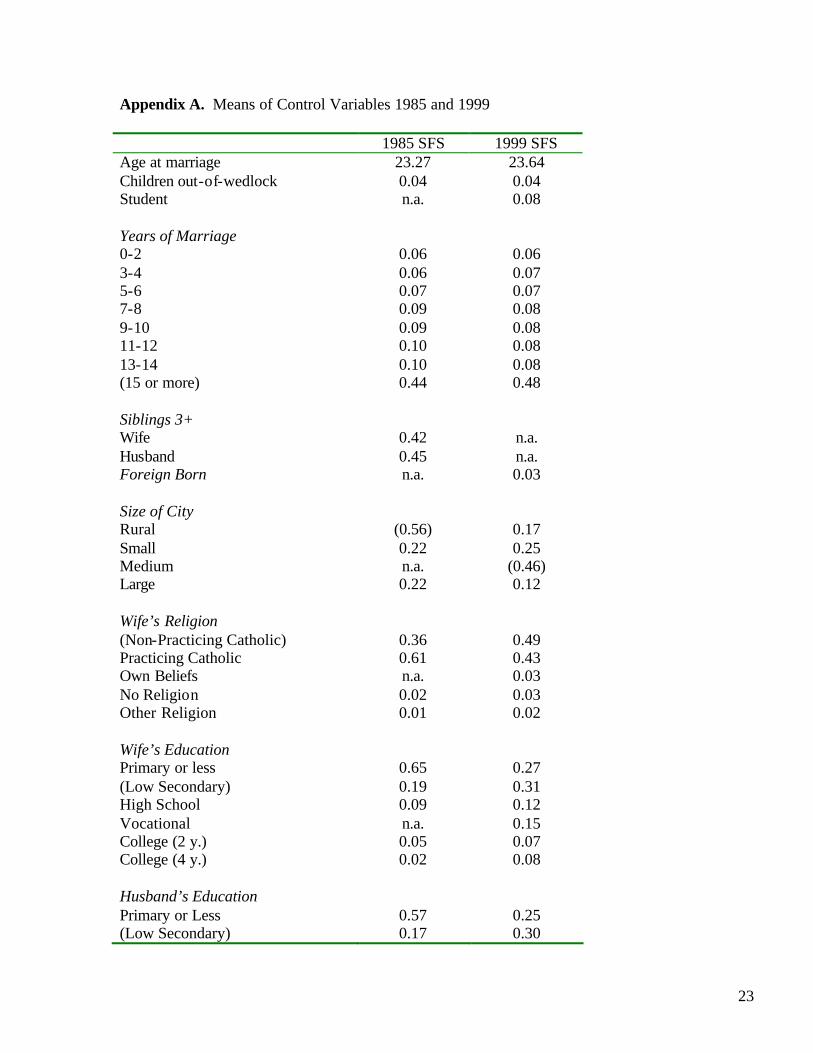
abroad. Appendix A includes the means of the control variables in the estimates. Benchmark
values are reported in brackets. Coefficients of the control variables are not reported in the Tables.
However, at the end of next section I comment on the results for these controls and estimates can
be obtained from the author.
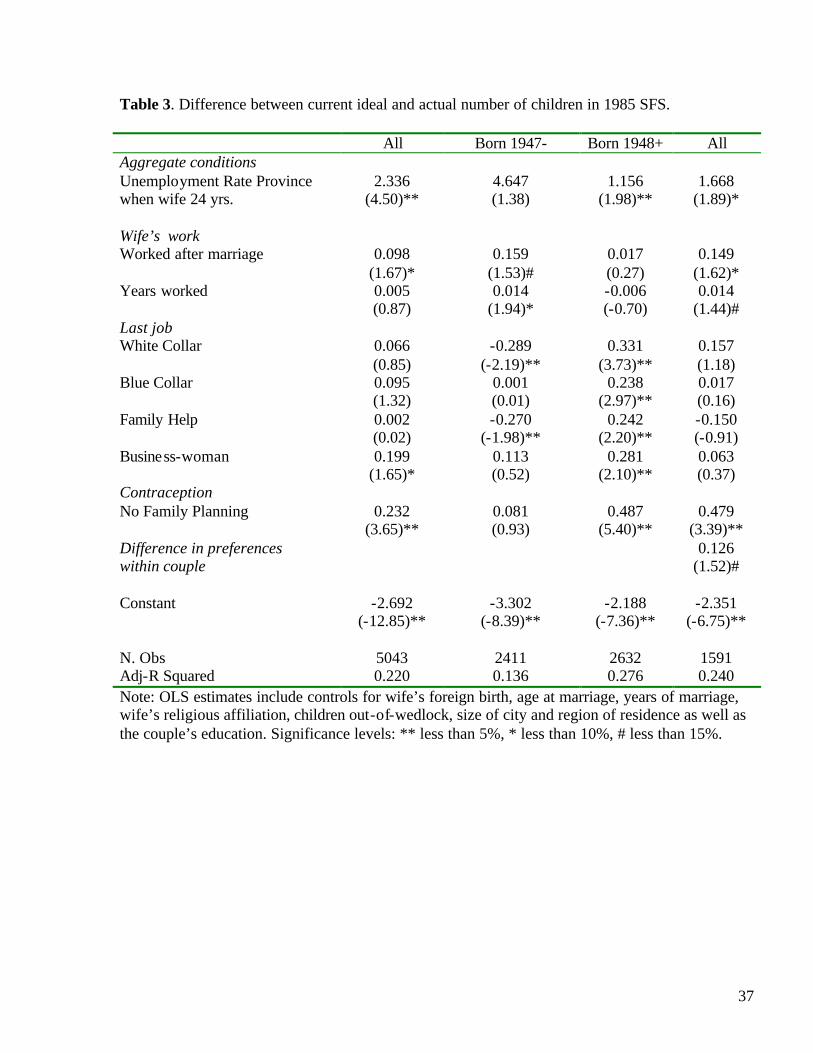
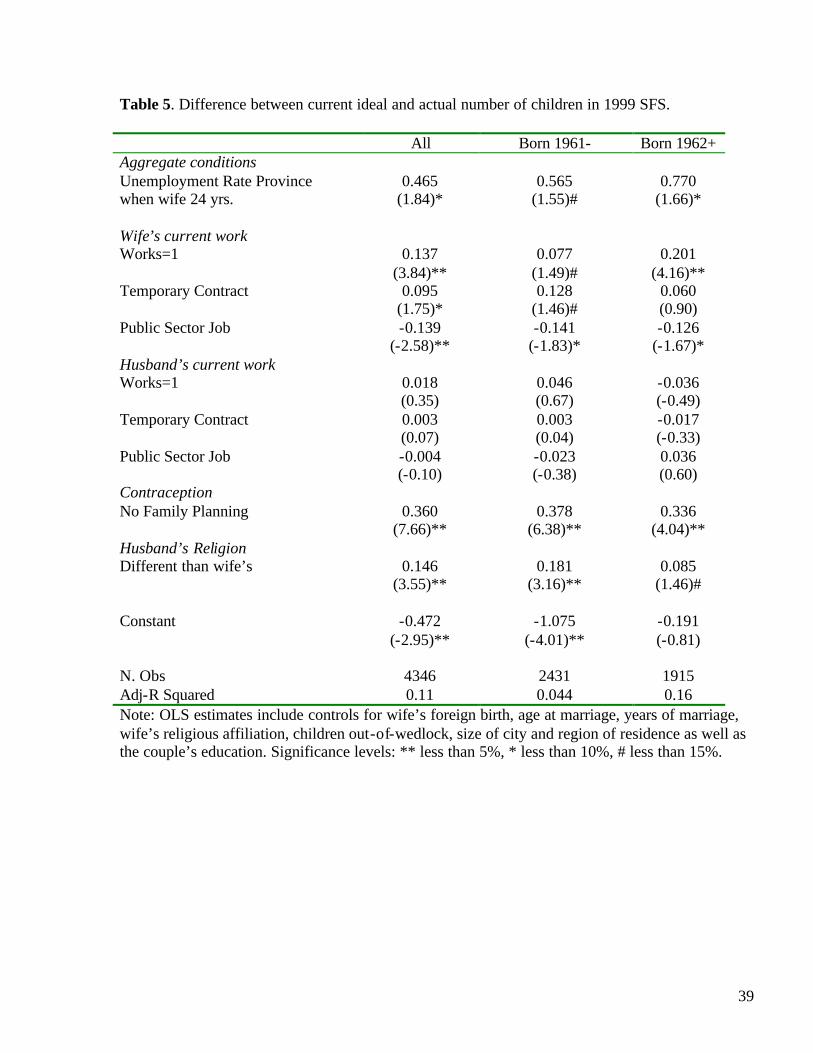
RESULTS
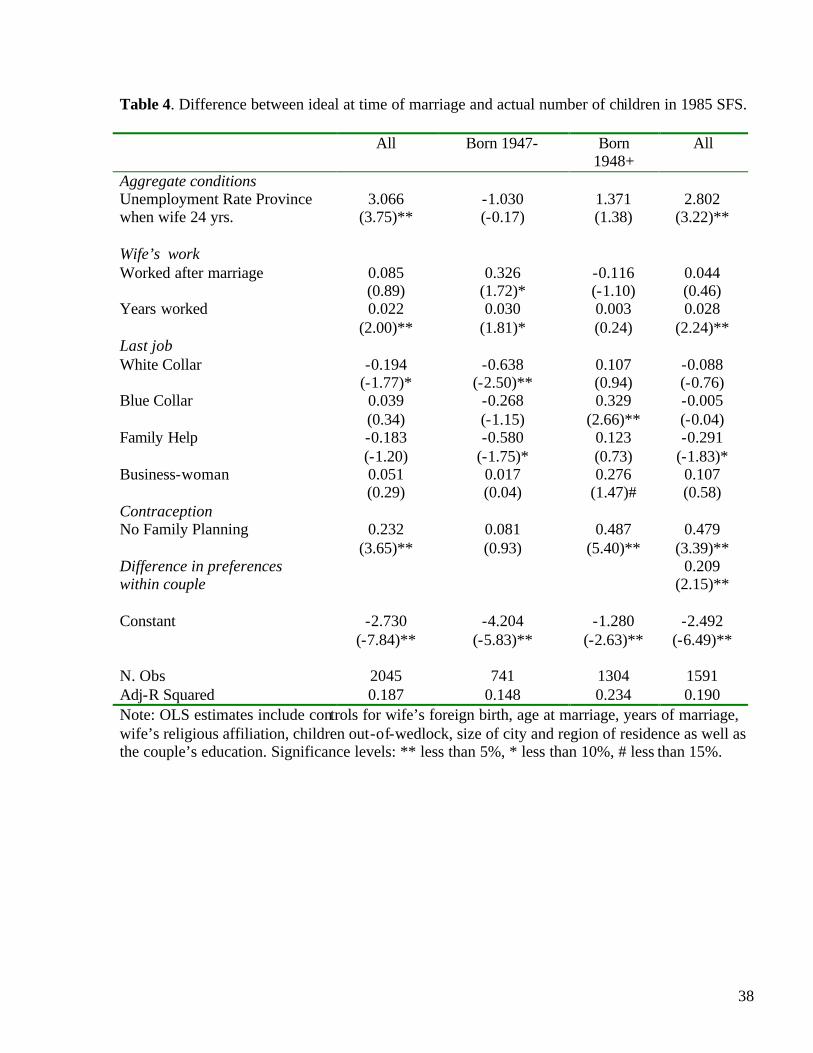
Estimates are presented in Tables 3 and 4 for the 1985 SFS and in Table 5 for the 1999 SFS. The
dependent variable in Tables 3 and 5 is the difference between a woman’s ideal number of children
at the time of the interview and her actual family size. In Table 4 the ideal family size is measured

15
at the time of marriage. Results are presented for the complete sample in each survey and for two
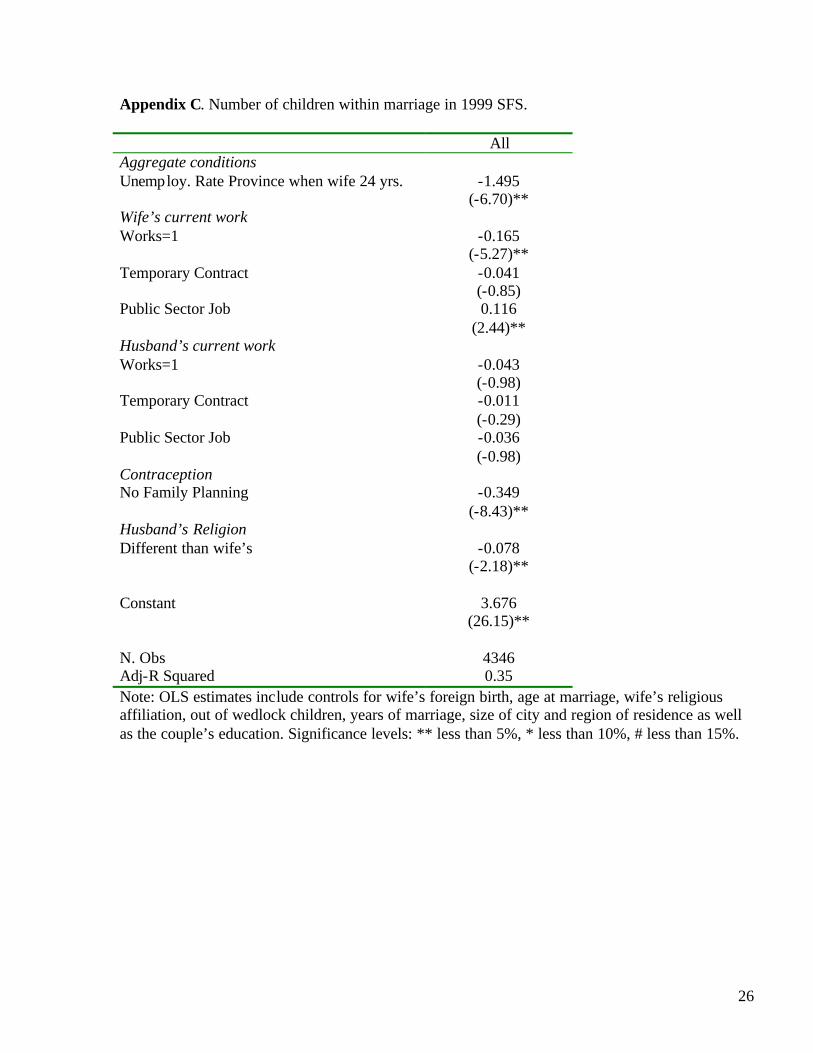
major age groups. Appendix B and C include the estimated number of children within a marriage
as a function of the same covariates in Tables 3 to 5. They serve as useful reference to better
interpret the results in the paper.
Aggregate and Individual Economic Conditions. The unemployment rate in the province of
residence at the time the woman was 24 years of age enters positively and significantly in all
estimates except for the oldest cohort in the 1985 SFS. It indicates that the higher the prevailing
unemployment rate when the wife was in her mid-twenties, the wider the gap between desired and
attained fertility. This confirms previous research that finds Spaniards to have postponed and
restricted their fertility as a response to a negative income effect arising from the high and
persistent unemployment rate in the country since the 1980s (Adsera 2004 a, 2005, Ahn and Mira
2001, Gutierrez-Domenech 2002). The coefficient for those born before 1948 is not significant.
They faced an average unemployment rate around 2% during their early working years and did not
still confront harsh economic constraints.
The coefficient for aggregate unemployment is somewhat smaller in Table 5. However,
given that the unemployment rates these younger cohorts face are high and that their overall
fertility is low, the implied effect of unemployment is large for individuals born after 1961. For
workers that experience an unemployment rate of 20% in their mid-twenties (the average for the
sample), the effect amounts to an increase of 0.154 in the gap between preferred and actual
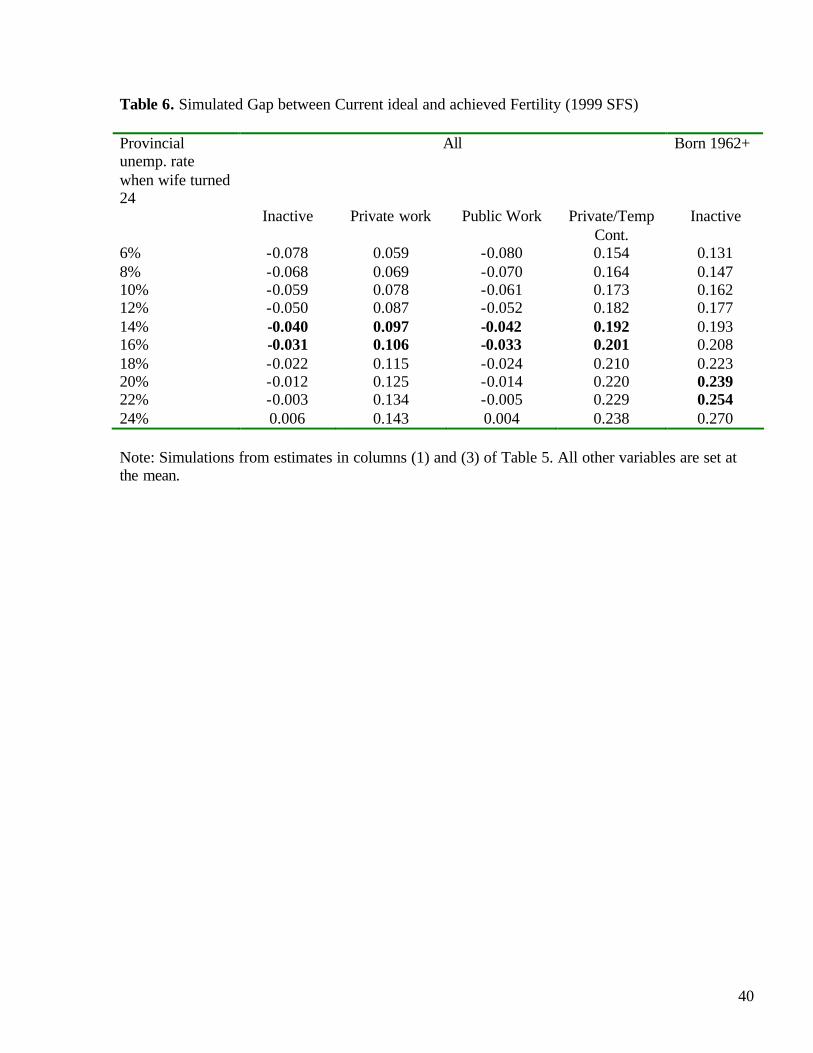
fertility. Table 6 includes simulations of the predicted gap in the 1999 SFS for different
unemployment rates.
16
With regard to individual labor market conditions I include a different set of variables for
each survey based on the available questionnaire. For the 1985 SFS, having worked after marriage
increases the gap for the older cohort in Tables 3 and 4. Still the coefficient is only half as large
and marginally significant at 15% level in Table 3 when the current ideal number of children is
used. Working women born before 1948 are further away from their preferred family size than
those inactive. However, the difference in size between the coefficients in Tables 3 and 4 hints a
lifetime adjustment of individual preferences to the work reality. The number of years worked after
marriage also enters with a significant positive coefficient for the old cohort. Among those born
after 1947, neither of the coefficients is significant in Tables 3 and 4. These women may have
probably learnt from the difficulties of balancing work and family from the previous generation,
one of the first to enter the labor market more extensively, and adjusted their desires ex-ante. Still,
when the type of job is excluded from the estimates, the coefficient for work after marriage for
women born after 1947 is 0.143 and significant at 1%.
The type of position a woman holds (or held as her last job) matters differently for each age
cohort in the 1985 SFS. Again, these are not perfect measures of the job category since the omitted
group includes those for which no type is specified. Still, it is interesting to see that family help
enters significantly with a negative coefficient for those born before 1948. Women working as
family help attain their preferred family size more often than those in other types of employment.
This may also indicate a reverse causality problem of those women being selected into those types
of jobs because of their conditions as mothers. This dataset does not provide complete labor
histories that could help to disentangle this problem. In Appendix B, women who work in family
help positions have significantly larger family sizes that other working-women. Similarly, white-
collar positions also enter negatively for the same cohort to imply fertility closer to (or beyond)

17
desires than for either blue collar or businesswomen. All categories are significantly positive for
the young group in Table 3 though with coefficients of different size and, when they are omitted,
working after marriage becomes positive and significant. [footnote 6]
The 1999 SFS includes information on the current employment of both spouses but not on
the overall labor market history. Still, since I control for age, education and place of residence of
each individual, current employment is a good proxy of the labor activity over their fertile life.
None of the coefficients for the characteristics of the husband’s job is significant in Table 5 (and
Appendix C). Workingwomen of both age groups are more likely to fail to achieve their desired
family size than those who are inactive. The coefficient, though, is only marginally significant at
15% for those born before 1962. The coefficient of working status is relatively smaller in column 1
of Table 5 when the fertility gap is estimated than in Appendix C when family size is analyzed.
This indicates that, even if workingwomen have significantly lower family sizes than inactive
women, their preferences conform, at least partially, to this reality. Table 6 simulates the gap
between preferred and achieved fertility for different groups of women: inactive, working in the
private sector with a permanent or a short-term contract as well as those employed by the public
sector.
As noted, the number of fragile contractual relationships has increased during the last
decades in Spain. Almost a third of working women born after 1961 are covered by short-term
contracts that do not carry the same benefits and severance payments as the traditional permanent
contracts (Juan J. Dolado, Carlos Garcia-Serrano and Juan F. Jimeno 2002). Furthermore the
instability of those positions constitutes a barrier to long-term financial planning (mortgages,
children). The positive and significant coefficient in column (1) indicates that the gap on fertility is
18
wider for women with short-term contracts as opposed to those with tenured or permanent
positions.
Finally, public sector employment constitutes a unique form of tenured job that protects the
worker from the uncertainty of unemployment, is accompanied with generous leave programs and
is the key to obtaining good financial treatment. The coefficient of women’s public sector
employment is negative, highly significant and about the same absolute size as the coefficient for
working status in column (1) of Table 5. As a result, the gap between achieved and ideal fertility
for non-working women or for those employed in the public sector is of similar size and smaller
than that of women working in the private sector. Still, non-working women have the largest
families and those employed in the private sector the smallest (Appendix C). The relative stability
of a public sector position as compared to a private sector one allows women to more easily adjust
her fertility plans to her preferences.
Family Planning. Lack of family planning enters significantly with a positive coefficient across all
estimates in both surveys. On average those families that have never used any contraceptive
method are still far from their desired family size. They are probably not using family planning
either because they are certain of their infertility or because they are trying to conceive. [footnote
7] Remember that descriptive statistics indicate a widespread use of contraceptive methods among
Spaniards. As a result, it is not surprising to find that lack of family planning does not lead to
overshooting but, on the contrary, may be an indication of unfulfilled wants. The negative, highly
significant and somewhat smaller coefficient of lack of family planning on the number of children
within a marriage (Appendix B and C) supports this explanation.
19
Preference Differences within the Couple. Column (4) in Tables 3 and 4 includes a dummy for
inter-union differences in the desired number of children. This information is only available for a
sub-sample of the 1985 SFS individuals. In Table 3, when the gap is measured in reference to the
current ideal for the wife, the coefficient on within-couple preference mismatch is positive but only
marginally significant at a 15% level. However, in Table 4, when the ideal number of children at
the time of marriage is used to construct the dependent variable, the coefficient is much larger and
highly significant.
The positive coefficient in both tables indicates that, on average, when there is
disagreement on preferred family size, a woman’s offspring is smaller than her ideal. Further, the
smaller coefficient in Table 3 indicates that initial discrepancy between spouses involves smaller
gaps in fertility as reported later in the marriage. This finding is supported by results in the
literature that indicate, first, that an adjustment of fertility preferences occurs early after marriage
and, second, that preferences later in marriage may already embody inter-union disagreements
(Freedman et al. 1980, Thomson et al. 1990). Unfortunately the survey does not provide
information on current preferences for the men to pursue this line of inquiry any further.
As an additional exercise, I estimate the same model in column (4) of Table 4 by using the
gap between the husband’s ideal family size at the time of the marriage and the actual fertility of
the couple as the dependent variable. The dummy for preference discrepancy among spouses is not
significant. Thus, inter-union disagreement does not lead to any mismatch between the husband’s
desires and his ultimate family size as it happens for women’s desires. [footnote 8] This could be
the product of either a difference in the bargaining power within the couple in favor of the husband
or a higher flexibility in the desires of women surveyed in 1985 as their marriage progresses. In
any event, if within-couple conflict depresses couple-specific investments and brings down family
20
size, the ultimate number of children is more likely to be closer to the husband’s preferred size,
which is, on average, lower. [footnote 9]
Religious composition of the couple. In Table 5 I use the information on the religious background
of the spouse available in the 1999 SFS. As expected, differences in the religious composition of
the couple affect the gap between desired and actual fertility. When the husband’s religious
denomination is different from the wife’s, the actual number of children in the union is
significantly lower than the one the women’s prefers. Both a higher expected frailty of those
unions and internal bargaining problems are likely pathways to a small family size. Results in
Appendix C show that family size is indeed significantly smaller in inter-faith unions than in
homogamous couples. Yet the coefficient in Table 5 is twice as large as that in Appendix C. Thus,
the deviation from the ideal size is larger than the deviation from the average family size.
Control Variables. Finally I briefly comment on the main control variables. The latter the wife
entered marriage, the most likely she will not achieve her desired family size. Delayed marriage
and transitions to first birth have already been found to reduce fertility relative to desired family
size. Older first-time mothers have lower complete fertility at the end of their fertile life
(Bongaarts 2001). Similarly, the coefficient for student status is positive and significant. The
number of children out-of-wedlock significantly increases the likelihood of overshooting preferred
family size. Coefficients on years of marriage decrease in size as the number of years into marriage
increases and the gap between desires and actual fertility closes. The number of siblings from
either the wife or the husband enters negatively and with a significant coefficient in the 1985 SFS
sample, particularly for those born before 1947. Spouses coming from larger families have a lesser
21
tendency to fall short from their preferences. The size of the city of residence is not relevant for the
1985 SFS. However, in the 1999 SFS, the gap between desired and achieved fertility of individuals
born before 1962 and living in large cities is higher than the rest. These families may be relatively
more constrained in economic terms given the rapidly rising housing costs in main Spanish cities
during the last fifteen years (Maria Consuelo Colom, Rosario Martinez and Maria Cruz Moles
2002).
As expected, the religious denomination of the wife does not have a major role in
explaining disparity between preferred and actual number of children in either survey. Only
Catholic practicing women born before 1948 are short of attaining their preferred family size –
even if they do not show any significant difference in family size with respect to non-practicing-
and those without religion born after 1961 exceed their preferences.
Finally, there are not important differences in the gap between ideal and actual fertility
among educational groups, even if their fertility behavior is different. In the 1999 SFS, women
married to men with intermediate levels of education, either high-school or vocational school, tend
to display lower fertility than preferred.
CONCLUSIONS
Family size is the outcome of sequential decisions influenced both by preferences and by
ongoing changes in the environment where a family lives. In this paper I use the 1985 and 1999
Spanish Fertility Surveys to study what are the determinants of the mismatch between desired and
actual fertility and whether some of these factors have become more or less relevant in between
surveys. While the mean of the gap between preferred and achieved fertility was negative in the
22
1985 Survey, it is positive in the 1999 Survey. More women fell short of their initial preferred size
in the last survey.
The economic conditions under which childbearing decisions are made affect the ultimate
parity of a couple. High and stubborn unemployment in Spain during the last two decades has
greatly increased economic uncertainty of young cohorts and resulted in extensive childbearing
postponement. Late mothers are less likely to attain their intended family size, even if it is already
lower than their desired. As a proxy for labor market conditions at the onset of a career, I have
shown that fertility of women facing high unemployment rates in their mid-twenties is below their
preferred level.
Further, I explore what job characteristics may shelter individuals from labor market
uncertainty and facilitate the dual role of mother-worker. I find that the stability of public sector
jobs lessens the difficulties women face of balancing work and family and of achieving preferred
fertility. The gap between desired and actual fertility for those employed in the public sector is of
similar size as for those inactive and smaller than for women in the private sector. Further results
indicate that temporary contracts intensify women’s uncertainty and add up to the obstacles of
work to widen the fertility mismatch.
In addition, results confirm that widespread availability and use of family planning has
contributed to the widening of the gap between desires and achieved fertility in the European
Union where fewer women are overshooting their preferred size (Fahey and Speder 2004). Finally,
within couple discrepancy in either preferences or religious affiliation is shown to depress family-
specific investments such as children.
23
Appendix A. Means of Control Variables 1985 and 1999
1985 SFS 1999 SFS Age at marriage 23.27 23.64 Children out-of-wedlock 0.04 0.04 Student n.a. 0.08 Years of Marriage 0-2 0.06 0.06 3-4 0.06 0.07 5-6 0.07 0.07 7-8 0.09 0.08 9-10 0.09 0.08 11-12 0.10 0.08 13-14 0.10 0.08 (15 or more) 0.44 0.48 Siblings 3+ Wife 0.42 n.a. Husband 0.45 n.a. Foreign Born n.a. 0.03 Size of City Rural (0.56) 0.17 Small 0.22 0.25 Medium n.a. (0.46) Large 0.22 0.12 Wife’s Religion (Non-Practicing Catholic) 0.36 0.49 Practicing Catholic 0.61 0.43 Own Beliefs n.a. 0.03 No Religion 0.02 0.03 Other Religion 0.01 0.02 Wife’s Education Primary or less 0.65 0.27 (Low Secondary) 0.19 0.31 High School 0.09 0.12 Vocational n.a. 0.15 College (2 y.) 0.05 0.07 College (4 y.) 0.02 0.08 Husband’s Education Primary or Less 0.57 0.25 (Low Secondary) 0.17 0.30
24
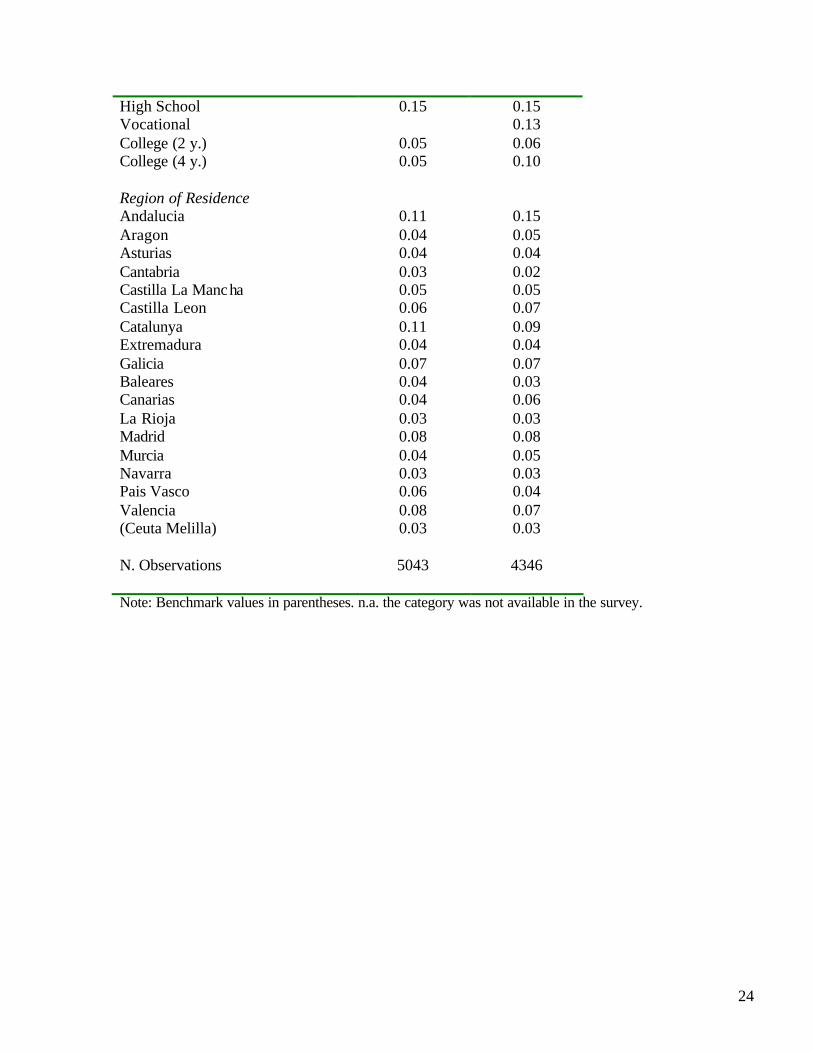
High School 0.15 0.15 Vocational 0.13 College (2 y.) 0.05 0.06 College (4 y.) 0.05 0.10 Region of Residence Andalucia 0.11 0.15 Aragon 0.04 0.05 Asturias 0.04 0.04 Cantabria 0.03 0.02 Castilla La Mancha 0.05 0.05 Castilla Leon 0.06 0.07 Catalunya 0.11 0.09 Extremadura 0.04 0.04 Galicia 0.07 0.07 Baleares 0.04 0.03 Canarias 0.04 0.06 La Rioja 0.03 0.03 Madrid 0.08 0.08 Murcia 0.04 0.05 Navarra 0.03 0.03 Pais Vasco 0.06 0.04 Valencia 0.08 0.07 (Ceuta Melilla) 0.03 0.03 N. Observations 5043 4346 Note: Benchmark values in parentheses. n.a. the category was not available in the survey.
25
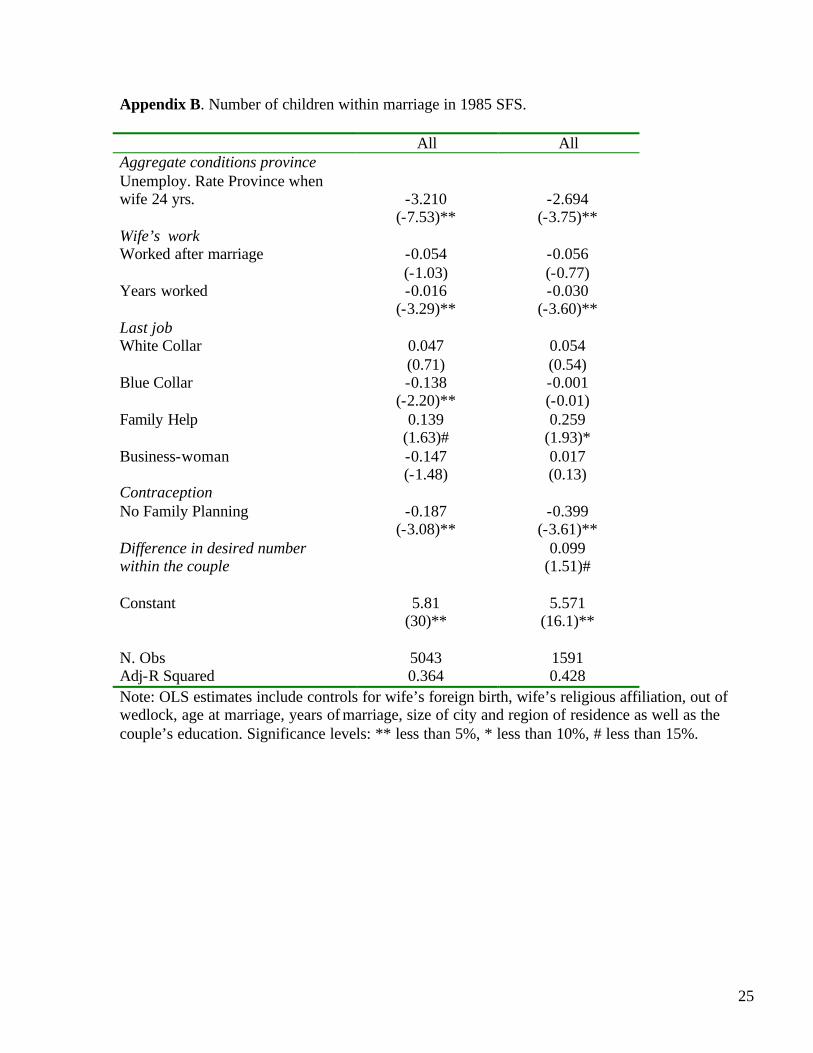
Appendix B. Number of children within marriage in 1985 SFS. All All Aggregate conditions province Unemploy. Rate Province when wife 24 yrs. -3.210 -2.694 (-7.53)** (-3.75)** Wife’s work Worked after marriage -0.054 -0.056 (-1.03) (-0.77) Years worked -0.016 -0.030 (-3.29)** (-3.60)** Last job White Collar 0.047 0.054 (0.71) (0.54) Blue Collar -0.138 -0.001 (-2.20)** (-0.01) Family Help 0.139 0.259 (1.63)# (1.93)* Business-woman -0.147 0.017 (-1.48) (0.13) Contraception No Family Planning -0.187 -0.399 (-3.08)** (-3.61)** Difference in desired number 0.099 within the couple (1.51)# Constant 5.81 5.571 (30)** (16.1)** N. Obs 5043 1591 Adj-R Squared 0.364 0.428 Note: OLS estimates include controls for wife’s foreign birth, wife’s religious affiliation, out of wedlock, age at marriage, years of marriage, size of city and region of residence as well as the couple’s education. Significance levels: ** less than 5%, * less than 10%, # less than 15%.
26
Appendix C. Number of children within marriage in 1999 SFS. All Aggregate conditions Unemploy. Rate Province when wife 24 yrs. -1.495 (-6.70)** Wife’s current work Works=1 -0.165 (-5.27)** Temporary Contract -0.041 (-0.85) Public Sector Job 0.116 (2.44)** Husband’s current work Works=1 -0.043 (-0.98) Temporary Contract -0.011 (-0.29) Public Sector Job -0.036 (-0.98) Contraception No Family Planning -0.349 (-8.43)** Husband’s Religion Different than wife’s -0.078 (-2.18)** Constant 3.676 (26.15)** N. Obs 4346 Adj-R Squared 0.35 Note: OLS estimates include controls for wife’s foreign birth, age at marriage, wife’s religious affiliation, out of wedlock children, years of marriage, size of city and region of residence as well as the couple’s education. Significance levels: ** less than 5%, * less than 10%, # less than 15%.

27
NOTES: (1) Bongaarts (1990) offers a review of some of the potential biases in measures of desired
fertility.
(2) Adjustment of intentions about a child increases with time since childbirth occurs (Akinrinola
Bankole and Charles F. Westoff. 1998).
(3) Previous research supports the accuracy of wife’s reports of husband’s fertility preferences (S.
Phillip Morgan 1985, Williams and Thomson 1985, Frances K. Goldscheider and Gayle Kaufman
1996).
(4) Unfortunately, the omitted category refers to those without information about the job (around
13% of all individuals). Estimates are robust to the exclusion of variables that describe the type of
job and results can be obtained from the author. Still I choose to include them because some
coefficients provide interesting variations across job categories.
(5) In Spain vocational schools are offered as a parallel track to high school and community
colleges.
(6) In separate estimates, available from the author, current unemployment status of the husband
enters negatively and significantly in some of the specifications. Families burdened by difficult
economic conditions may revise their preferred number of children downward.
(7) In separate estimates that exclude women who are known to be infertile, coefficients on lack of
family planning are still positive and significant.
(8) Results are available from the author.
(9) Freedman et al. (1980) find that women’s preferences tend to adjust to reduce inter-couple
difference but that final parity is more likely to adjust downward than upward to meet spouse’s
ideal. Interestingly, Elizabeth Thomson and Jan M. Hoem (1998) found that Swedish couples with

28
preference differences had lower childbearing, but both the woman and her spouse were equally
likely to prevail in the face of a disagreement.
29
REFERENCES
Adsera, Alicia 2004 a. “Changing Fertility Rates in Developed Markets. The Impact of Labor
Market Institutions.” Journal of Population Economics 17: 17-43.
_________. 2004 b. “Marital Fertility and Religion: Recent Changes in Spain.” Discussion Paper,
Population Research Center 2004-02, University of Chicago.
_________. 2005. “Vanishing Children: From High Unemployment to Low Fertility in Developed
Countries.” American Economic Review Papers and Proceedings, forthcoming.
Adam, Paula 1996. “Mothers in an insider-outsider economy: The puzzle of Spain.” Journal of
Population Economics 9:301-323.
Ahn, Namkee and Pedro Mira. 2001. “Job bust, baby bust? Evidence from Spain.” Journal of
Population Economics 14:505-521.
Becker, Gary S., Elisabeth M. Landes and Robert T. Michael. 1977. “An Economic Analysis of
Marital Instability.” Journal of Political Economy 85 (6): 1141-1187.
Bankole, Akinrinola and Charles F. Westoff. 1998. “The consistency and Validity of Reproductive
Attitudes: Evidence from Morocco.” Journal of Biosocial Science 30 (4): 438-455.
Bongaarts, John 1990. “The Measurement of Wanted Fertility.” Population and Development
Review 16: 487-506.
_________. 2001. “Fertility and Reproductive Preferences in Post-Transitional Societies.”
Population and Development Review 27: 260-281.
Branas, Pablo and Shoshana Neuman. 2004. “Analyzing Religiosity Within an economic
Framework: The Case of Spanish Catholics.” Review of Economics of the Household 2 (1): 5-22.
30
Colom, Maria Consuelo, Rosario Martinez and Maria Cruz Moles. 2002 “Un analisis de las
decisions de formacion de hogar, tenencia y demanda de servicios de viviendas de los
jovenes espanoles.” Moneda y Credito 215: 199-223.
Dolado, Juan J., Carlos García-Serrano and Juan F. Jimeno, 2002. “Drawing Lessons from the
Boom of Temporary Jobs in Spain.” The Economic Journal, 112: 270-295.
Fahey, Tony and Zsolt Speder. 2004. Fertility and family issues in an enlarged Europe. European
Foundation for the Improvement of Living and Working Conditions, Dublin.
Freedman, Ronald, Deborah Freedman and Arland Thornton. 1980. “Changes in Fertility
Expectations and Preferences between 1962 and 1977: Their Relation to Final Parity.”
Demography 17 (4): 365-378.
Goldscheider, Frances K. and Gayle Kaufman. 1996. “Fertility and Commitment: Bringing Men
Back in.” Population and Development Review 22 (Suppl.): 87-99.
Goldscheider, Calvin and William D. Mosher. 1991. “Patterns of contraceptive use in the
United States: The importance of religious factors.” Studies in Family Planning 22 (2):
102-115.
Goldstein, Joshua R., Wolfgang Lutz and Maria Rita Testa. 2003. “The emergence of Sub-
replacement Family Size Ideals in Europe.” Population Research and Policy Review 22:
479-496.
Gutierrez-Domenech, Maria. 2002. “The Impact of the Labor Market on the Timing of
Marriage and Births in Spain.” CEP working paper.
Instituto Nacional de Estadistica (INE) 1985. Encuesta de Fecundidad 1985, Madrid.
_________. 1999. Encuesta de Fecundidad 1999, Madrid.
31
Lehrer, Evelyn L. 1996. “Religion as a determinant of marital fertility.” Journal of Population
Economics 9: 173-196.
_________. 2004. “Religion as a Determinant of Economic and Demographic Behavior in the
United States.” Population and Development Review 30 (4): 707-726.
Lehrer, Evelyn L. and Carmel U. Chiswick. 1993. “Religion as a Determinant of Marital
Stability.” Demography 30 (3): 385-404.
Morgan, S. Philip 1985. “Individual and Couple Intentions for More Children: A Research Note.”
Demography 22 (1): 125-132.
Mosher, William D. and Gerry E. Hendershot. 1984. “Religion and Fertility: A Replication.”
Demography 21 (2): 185-191.
Ryder, Norman B. 1973. A Critique of the National Fertility Study, Demography 10 (4): 495-506.
Sacerdote, Bruce and Edward Glaeser. 2001. “Education and Religion.” NBER working paper N.
8080.
Sander, William. 1992. “Catholicism and the Economics of Fertility.” Population Studies 46: 477-
489.
Schoen, Robert, Nan Marie Astone, Young J. Kim, Constance Nathanson and Jason M. Fields.
1999 “Do Fertility Intentions affect Fertility Behavior?” Journal of Marriage and the Family 1999
(3): 790-799.
Thomson, Elizabeth 1997. “Couple Childbearing Desires, Intentions and Births.” Demography 34
(3): 343-354.
Thomson, Elizabeth and Jan M. Hoem. 1998. “Couple Childbearing Plans and Births in Sweden.”
Demography 35(3): 315-322.
32
Thomson, Elizabeth, Elaine McDonald, and Larry L Bumpass. 1990. “Fertility Desires and
Fertility: Hers, His and Theirs.” Demography 27: 579-588.
Thornton, Arland Ronald Freedman and Deborah Freedman. 1984. “Further Reflections on
Changes in Fertility Expectations and Preferences.” Demography 21 (3): 423-429.
United Nations. 2002. World Contraceptive Use 2001. Population Division of the Department of
Economic and Social Affairs of the United Nations Secretariat, New York.
Westoff, Charles and Norman B. Ryder. 1977. “The Predictive Validity of Reproductive
Intentions.” Demography 14 (4): 431-453.
Williams, Linda B. and Basil G. Zimmer. 1990. “The Changing Influence of Religion on US
Fertility: Evidence from Rhode Island.” Demography 27 (3): 475-481.
Williams, Richard and Elizabeth Thomson. 1985. “Can Spouses be Trusted? A Look at
Husband/wife Proxy Reports.” Demography 22 (1): 115- 123.
33
Table 1.1 Main reason for restricting fertility and main reason that would revert this decision among women who do not plan to have more children in 1985 SFS All Born 1948+ Reasons for restricting fertility Achieved desired family size 38.05 43.83 Too old for childbearing 16.92 1.9 Lack of Economic Resources 13.29 16.62 Pessimism about future economic conditions 11.28 15.26 Health problems 7.38 5.83 Afraid child will have health problems 5.39 4.34 Want/need to work outside home 2.29 4.21 Hardships of raising children 2.08 3.12 Spouse unemployed 1.61 2.31 Excessive housework 0.87 1.42 Small house 0.43 0.54 Ongoing studies 0.12 0.27 Lack of child-care centers 0.06 0.14 Reasons that would change your mind None 80.6 71.23 Other reasons 6.38 7.8 Improvement in economic conditions 5.73 9.43 Increase in spouse’s earnings 4.46 6.78 No need to work outside home 1.18 2.04 Better housing availability 0.65 1.22 Increase in own earnings 0.5 0.68 Part-time 0.28 0.47 More child-care centers 0.12 0.27 Note: Percentage citing each reason only among women in the sample used for the estimates.
34
Table 1.2 Proportion with Preferred and Actual Fertility Mismatch and Reasons Cited for Mismatch in 1999 SFS Do Actual and Preferred Fertility Coincide? % Yes 63.42 No 36.58 If not, Why? (*) % citing Have not completed family 31.4 Lack of Economic Resources 26.1 Health problems 16.6 Want/Need work outside Home 13.2 Hardships of raising children 9.1 Failure of contraceptive method 8.5 Too old for childbearing 7.7 Unemployment (self/spouse) 5.4 Pregnancy/ Labor hard work 4.9 Small house 4.9 Afraid child will have health problems 4.9 Other 3.2 Too much housework 2.4 Lack of child care centers 2.1 Lack familiarity with contraceptives 1.9 Child limits freedom for leisure 1.5 Study 0.9
Note: It only includes women in the sample used for the estimates. (*) Respondents were allowed to give more than one reason for the mismatch.
35
Table 2.1 Dependent Variables
1985 All Born 1947- Born 1948+
Diff. Ideal at marriage-Achieved -0.53 (2045) -0.87 (741) -0.33 (1304) Diff. Ideal now-Achieved -0.65 -0.98 -0.34 Children in marriage 3.32 3.84 2.85
1999 All Born 1961- Born 1962+
Diff. Ideal-Achieved 0.47 0.33 0.65 Children in marriage 1.81 2.11 1.44 Note: Number of observations for the sample including information on spouse’s preferences in parentheses. Table 2.2 Means of Variables 1985 SFS
All Born 1947- Born 1948+ Aggregate conditions province Unemployment Rate Province when wife 24 yrs. 0.06 0.02 0.09 Wife’s work Worked after marriage 0.46 0.42 0.50 Years worked 3.54 4.47 2.68 Last job White Collar 0.11 0.10 0.13 Blue Collar 0.11 0.08 0.14 Family Help 0.07 0.08 0.06 Business-woman 0.04 0.03 0.05 Contraception No Family Planning 0.13 0.16 0.10 Difference in preferences within couple 0.20 (1591) 0.24 (541) 0.18 (1050) N. Observations 5043 2411 2632 Note: Number of observations for the sample including information on spouse’s preferences in parentheses.
36
Table 2.3 Means of Variables 1999 SFS
All Born 1961- Born 1962+ Aggregate conditions Unemployment Rate Province when wife 24 yrs. 0.15 0.11 0.20 Wife’s current work Works=1 0.43 0.41 0.45 Temporary Contract 0.09 0.07 0.13 Public Sector Job 0.12 0.13 0.11 Husband’s current work Works=1 0.90 0.89 0.92 Temporary Contract 0.14 0.10 0.21 Public Sector Job 0.17 0.18 0.15 Contraception No Family Planning 0.11 0.15 0.06 Husband’s Religion Different than wife’s 0.15 0.16 0.14 N. Observations 4346 2431 1915
37
Table 3. Difference between current ideal and actual number of children in 1985 SFS. All Born 1947- Born 1948+ All Aggregate conditions Unemployment Rate Province 2.336 4.647 1.156 1.668 when wife 24 yrs. (4.50)** (1.38) (1.98)** (1.89)* Wife’s work Worked after marriage 0.098 0.159 0.017 0.149 (1.67)* (1.53)# (0.27) (1.62)* Years worked 0.005 0.014 -0.006 0.014 (0.87) (1.94)* (-0.70) (1.44)# Last job White Collar 0.066 -0.289 0.331 0.157 (0.85) (-2.19)** (3.73)** (1.18) Blue Collar 0.095 0.001 0.238 0.017 (1.32) (0.01) (2.97)** (0.16) Family Help 0.002 -0.270 0.242 -0.150 (0.02) (-1.98)** (2.20)** (-0.91) Business-woman 0.199 0.113 0.281 0.063 (1.65)* (0.52) (2.10)** (0.37) Contraception No Family Planning 0.232 0.081 0.487 0.479 (3.65)** (0.93) (5.40)** (3.39)** Difference in preferences 0.126 within couple (1.52)# Constant -2.692 -3.302 -2.188 -2.351 (-12.85)** (-8.39)** (-7.36)** (-6.75)** N. Obs 5043 2411 2632 1591 Adj-R Squared 0.220 0.136 0.276 0.240 Note: OLS estimates include controls for wife’s foreign birth, age at marriage, years of marriage, wife’s religious affiliation, children out-of-wedlock, size of city and region of residence as well as the couple’s education. Significance levels: ** less than 5%, * less than 10%, # less than 15%.
38
Table 4. Difference between ideal at time of marriage and actual number of children in 1985 SFS. All Born 1947- Born
1948+ All
Aggregate conditions Unemployment Rate Province 3.066 -1.030 1.371 2.802 when wife 24 yrs. (3.75)** (-0.17) (1.38) (3.22)** Wife’s work Worked after marriage 0.085 0.326 -0.116 0.044 (0.89) (1.72)* (-1.10) (0.46) Years worked 0.022 0.030 0.003 0.028 (2.00)** (1.81)* (0.24) (2.24)** Last job White Collar -0.194 -0.638 0.107 -0.088 (-1.77)* (-2.50)** (0.94) (-0.76) Blue Collar 0.039 -0.268 0.329 -0.005 (0.34) (-1.15) (2.66)** (-0.04) Family Help -0.183 -0.580 0.123 -0.291 (-1.20) (-1.75)* (0.73) (-1.83)* Business-woman 0.051 0.017 0.276 0.107 (0.29) (0.04) (1.47)# (0.58) Contraception No Family Planning 0.232 0.081 0.487 0.479 (3.65)** (0.93) (5.40)** (3.39)** Difference in preferences 0.209 within couple (2.15)** Constant -2.730 -4.204 -1.280 -2.492 (-7.84)** (-5.83)** (-2.63)** (-6.49)** N. Obs 2045 741 1304 1591 Adj-R Squared 0.187 0.148 0.234 0.190 Note: OLS estimates include controls for wife’s foreign birth, age at marriage, years of marriage, wife’s religious affiliation, children out-of-wedlock, size of city and region of residence as well as the couple’s education. Significance levels: ** less than 5%, * less than 10%, # less than 15%.
39
Table 5. Difference between current ideal and actual number of children in 1999 SFS. All Born 1961- Born 1962+ Aggregate conditions Unemployment Rate Province 0.465 0.565 0.770 when wife 24 yrs. (1.84)* (1.55)# (1.66)* Wife’s current work Works=1 0.137 0.077 0.201 (3.84)** (1.49)# (4.16)** Temporary Contract 0.095 0.128 0.060 (1.75)* (1.46)# (0.90) Public Sector Job -0.139 -0.141 -0.126 (-2.58)** (-1.83)* (-1.67)* Husband’s current work Works=1 0.018 0.046 -0.036 (0.35) (0.67) (-0.49) Temporary Contract 0.003 0.003 -0.017 (0.07) (0.04) (-0.33) Public Sector Job -0.004 -0.023 0.036 (-0.10) (-0.38) (0.60) Contraception No Family Planning 0.360 0.378 0.336 (7.66)** (6.38)** (4.04)** Husband’s Religion Different than wife’s 0.146 0.181 0.085 (3.55)** (3.16)** (1.46)# Constant -0.472 -1.075 -0.191 (-2.95)** (-4.01)** (-0.81) N. Obs 4346 2431 1915 Adj-R Squared 0.11 0.044 0.16 Note: OLS estimates include controls for wife’s foreign birth, age at marriage, years of marriage, wife’s religious affiliation, children out-of-wedlock, size of city and region of residence as well as the couple’s education. Significance levels: ** less than 5%, * less than 10%, # less than 15%.
40
Table 6. Simulated Gap between Current ideal and achieved Fertility (1999 SFS) Provincial unemp. rate when wife turned 24
All Born 1962+
Inactive Private work Public Work Private/Temp Cont.
Inactive
6% -0.078 0.059 -0.080 0.154 0.131 8% -0.068 0.069 -0.070 0.164 0.147 10% -0.059 0.078 -0.061 0.173 0.162 12% -0.050 0.087 -0.052 0.182 0.177 14% -0.040 0.097 -0.042 0.192 0.193 16% -0.031 0.106 -0.033 0.201 0.208 18% -0.022 0.115 -0.024 0.210 0.223 20% -0.012 0.125 -0.014 0.220 0.239 22% -0.003 0.134 -0.005 0.229 0.254 24% 0.006 0.143 0.004 0.238 0.270 Note: Simulations from estimates in columns (1) and (3) of Table 5. All other variables are set at the mean.