Embed Size (px)
Citation preview
PopulationPopulationDemographic Demographic
transition modeltransition model“fertility and mortality vary over time: Demographic Transition Model — reasons for differences in fertility and mortality in the stages of the model; differences between economically more developed countries (EMDCs) and economically less developed countries (ELDCs) ”
SQA
Demographic transition model
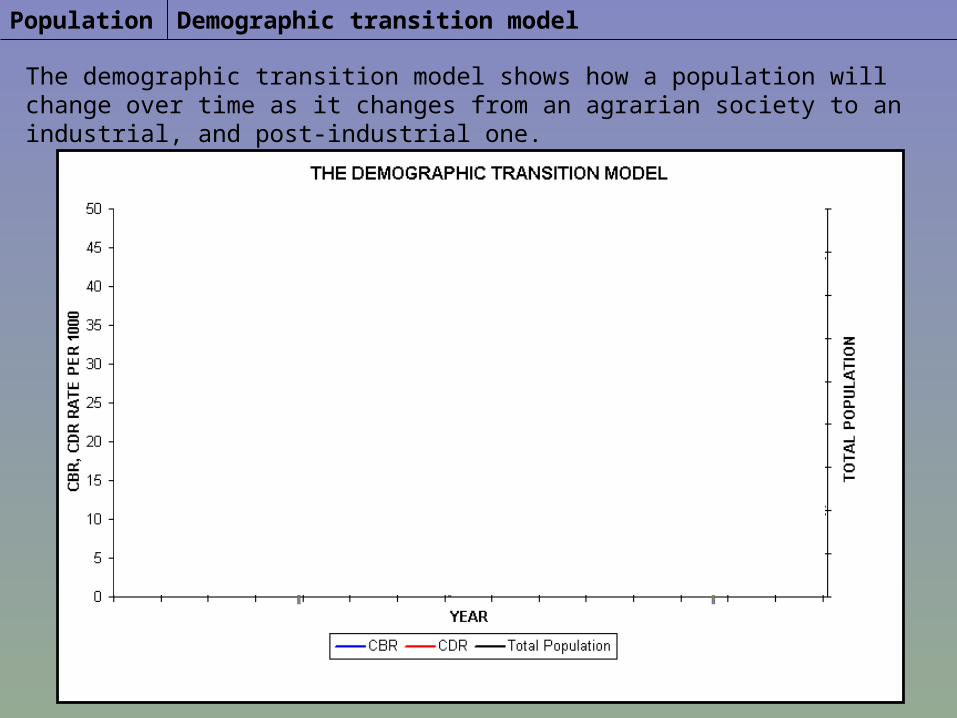
The demographic transition model shows how a population will change over time as it changes from an agrarian society to an industrial, and post-industrial one.
Population
Demographic transition model
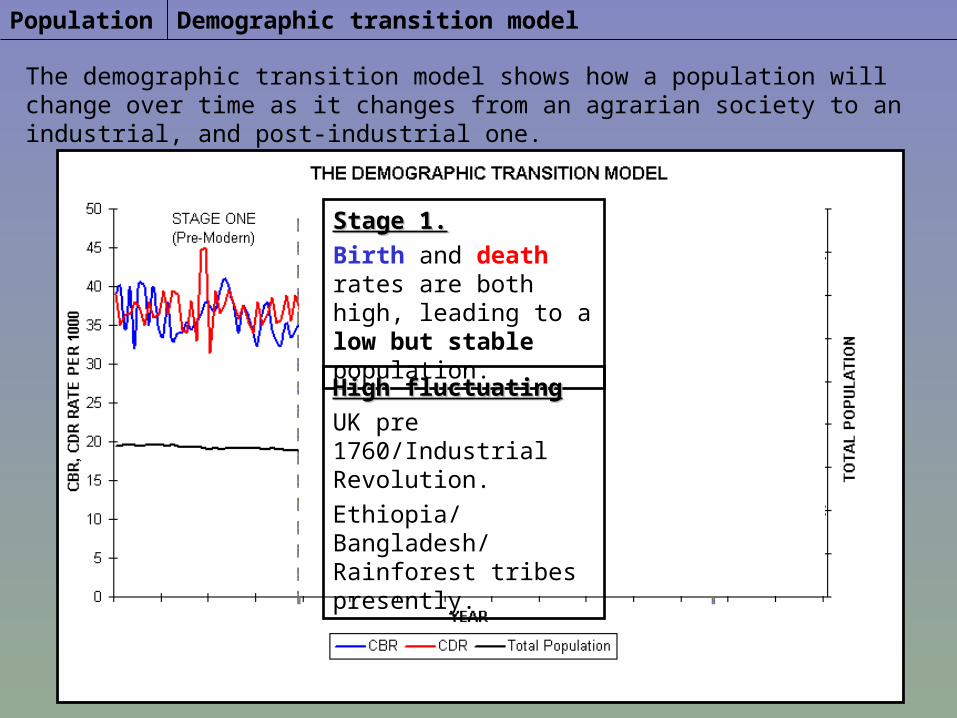
The demographic transition model shows how a population will change over time as it changes from an agrarian society to an industrial, and post-industrial one.
Population
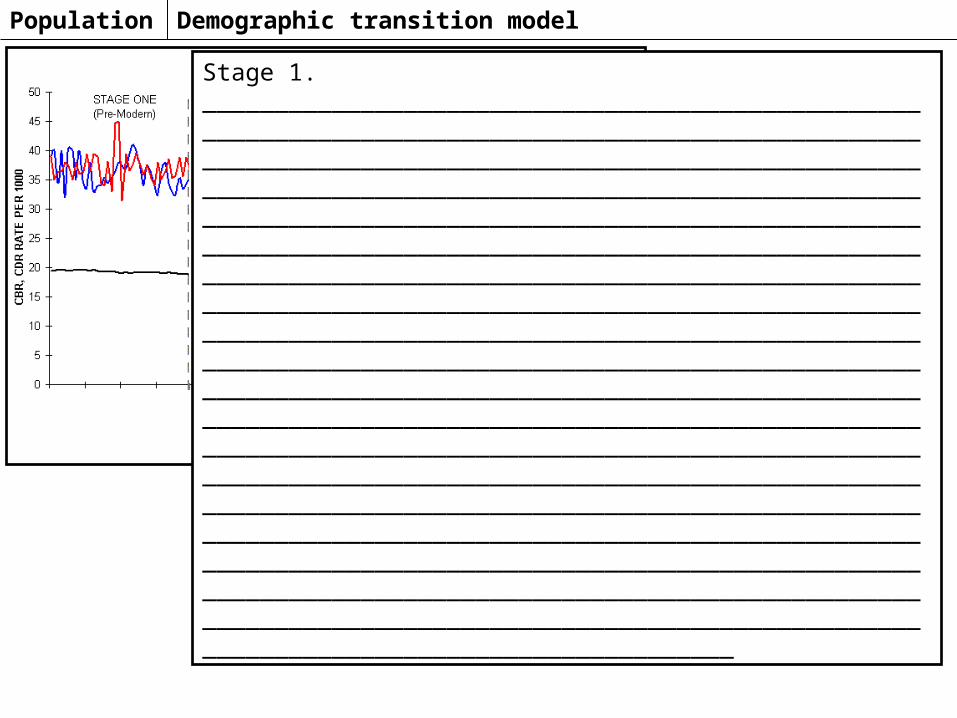
Stage 1.Stage 1.Birth and death rates are both high, leading to a low but stable population.
High fluctuatingHigh fluctuatingUK pre 1760/Industrial Revolution.Ethiopia/Bangladesh/Rainforest tribes presently.
Demographic transition model
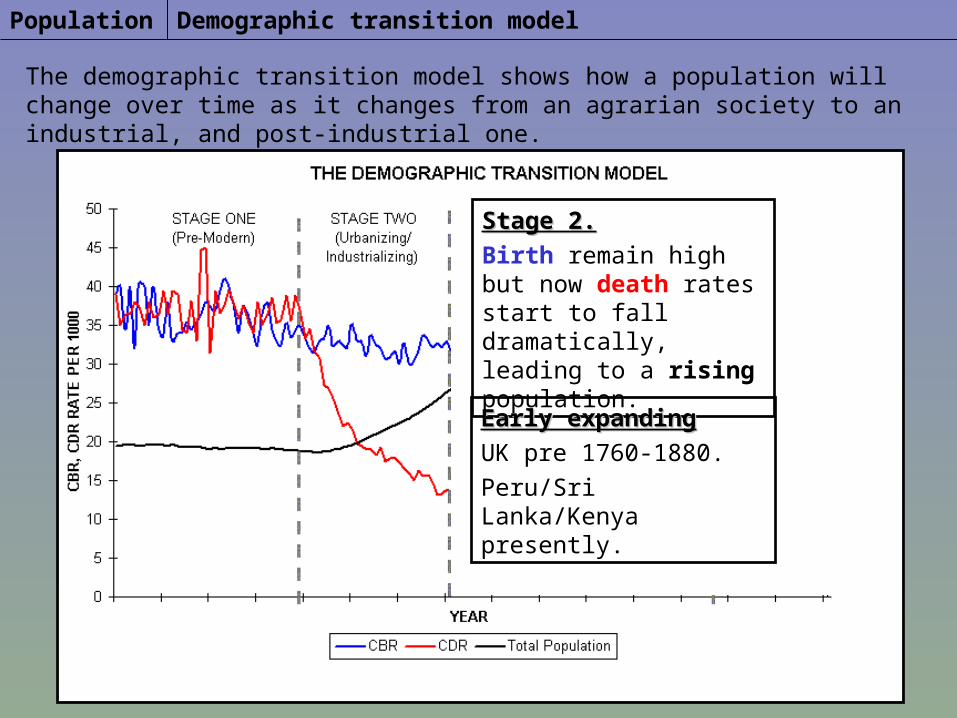
The demographic transition model shows how a population will change over time as it changes from an agrarian society to an industrial, and post-industrial one.
Population
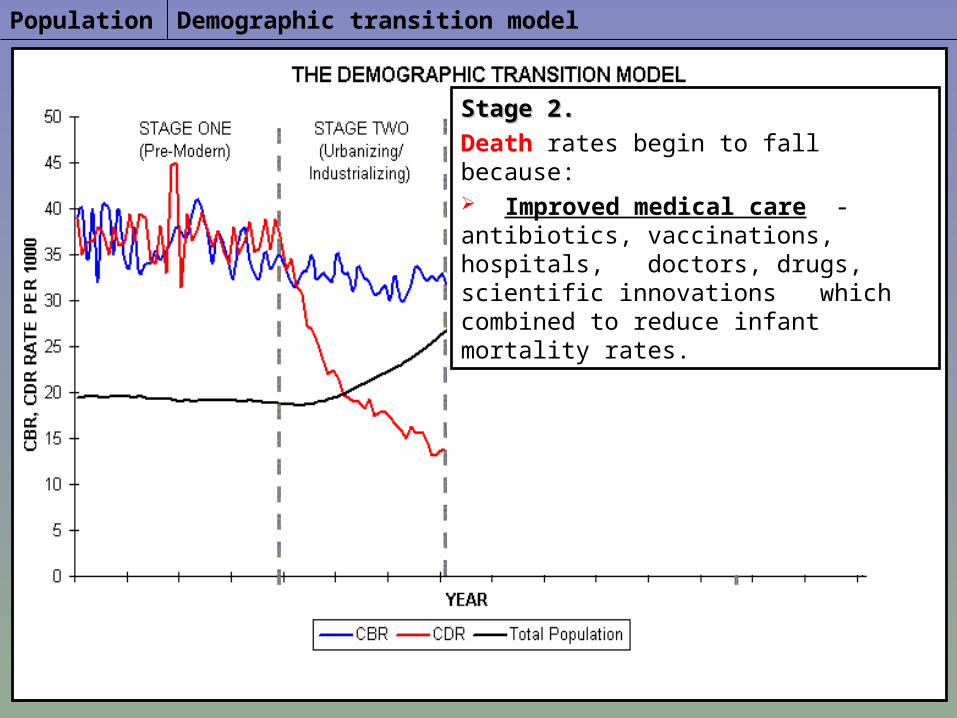
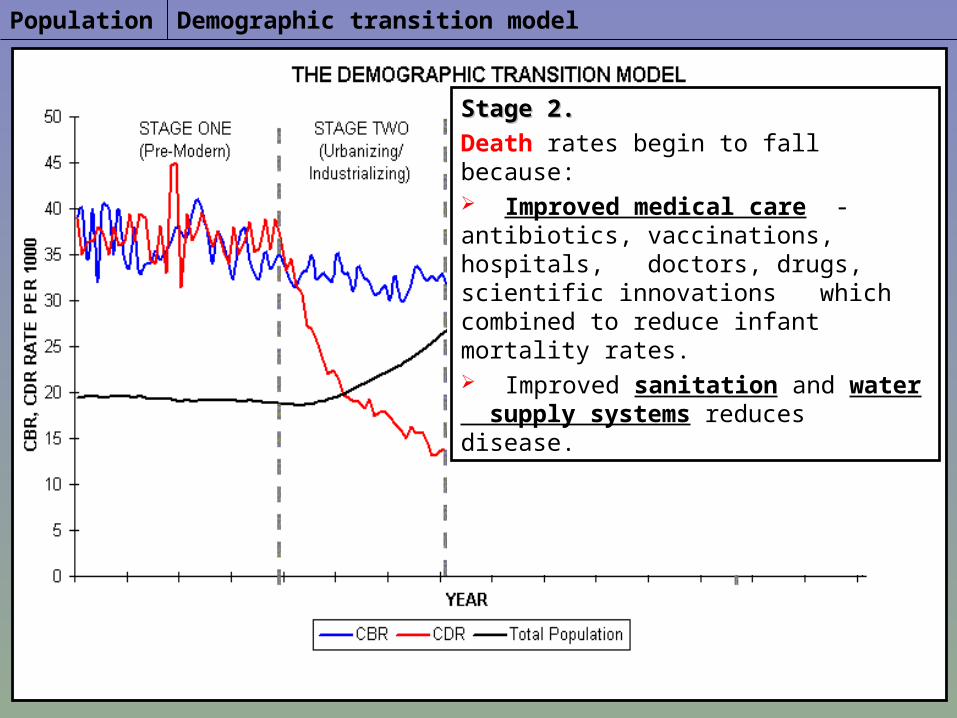
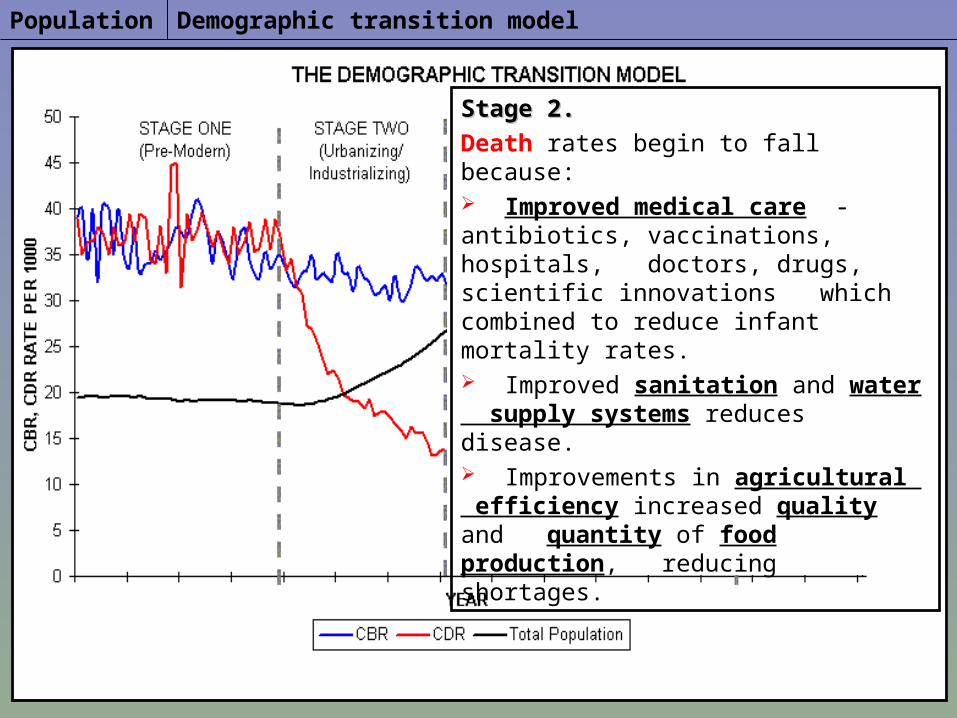
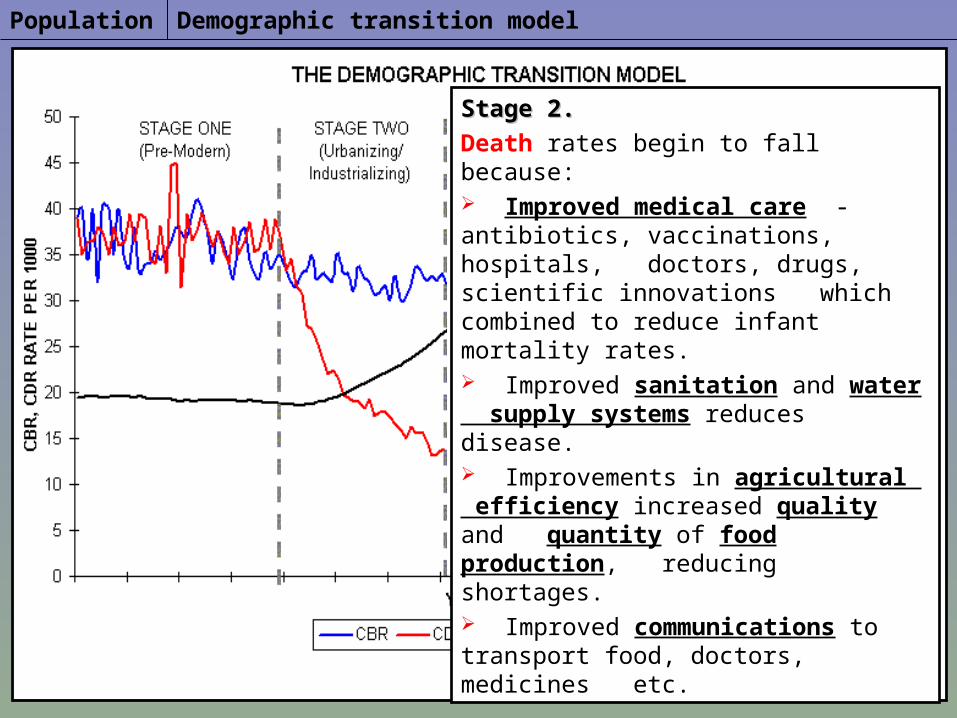
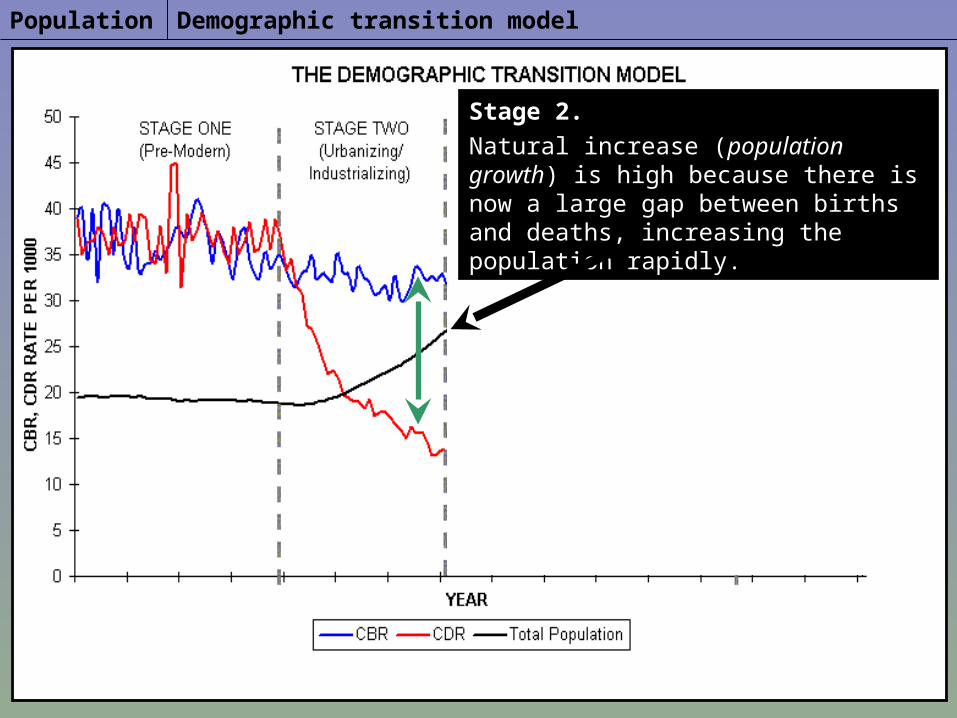
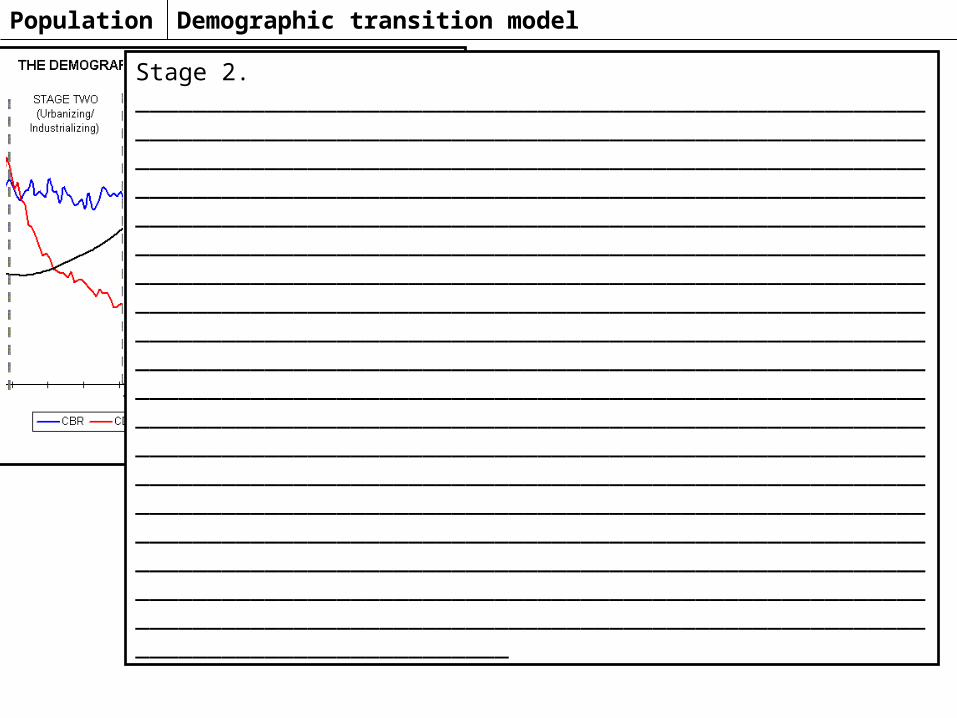
Stage 2.Stage 2.Birth remain high but now death rates start to fall dramatically, leading to a rising population.
Early expandingEarly expandingUK pre 1760-1880.Peru/Sri Lanka/Kenya presently.
Demographic transition model
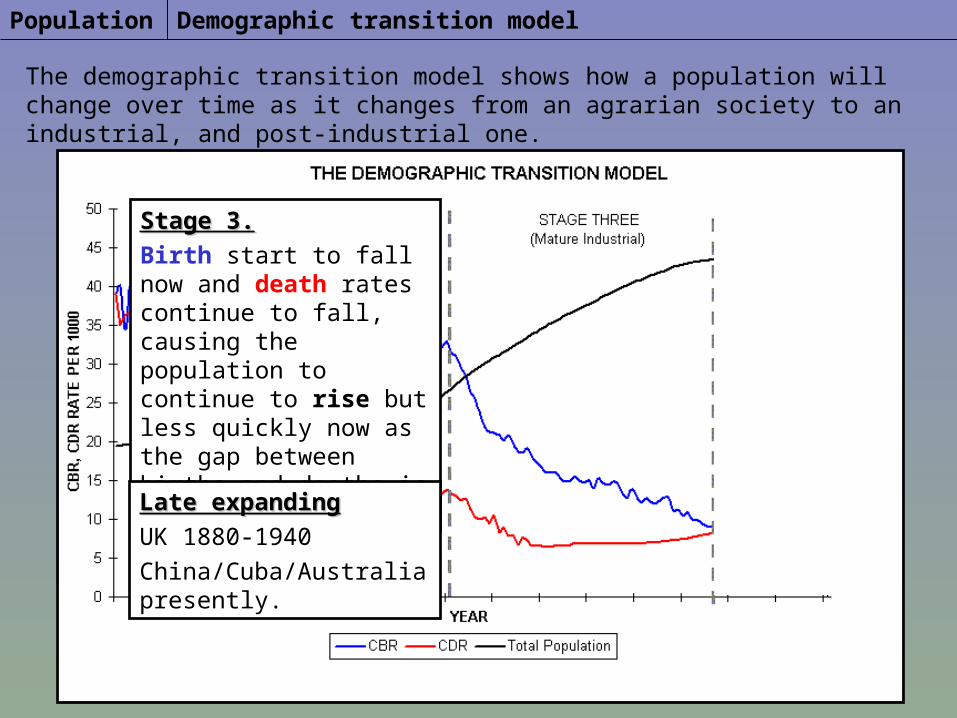
The demographic transition model shows how a population will change over time as it changes from an agrarian society to an industrial, and post-industrial one.
Population
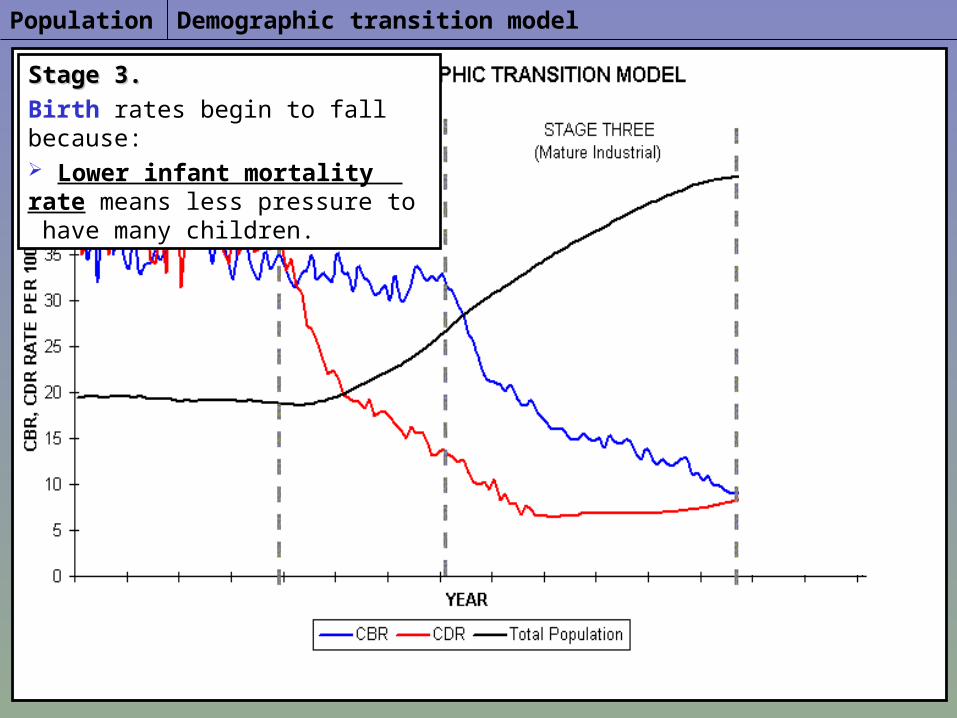
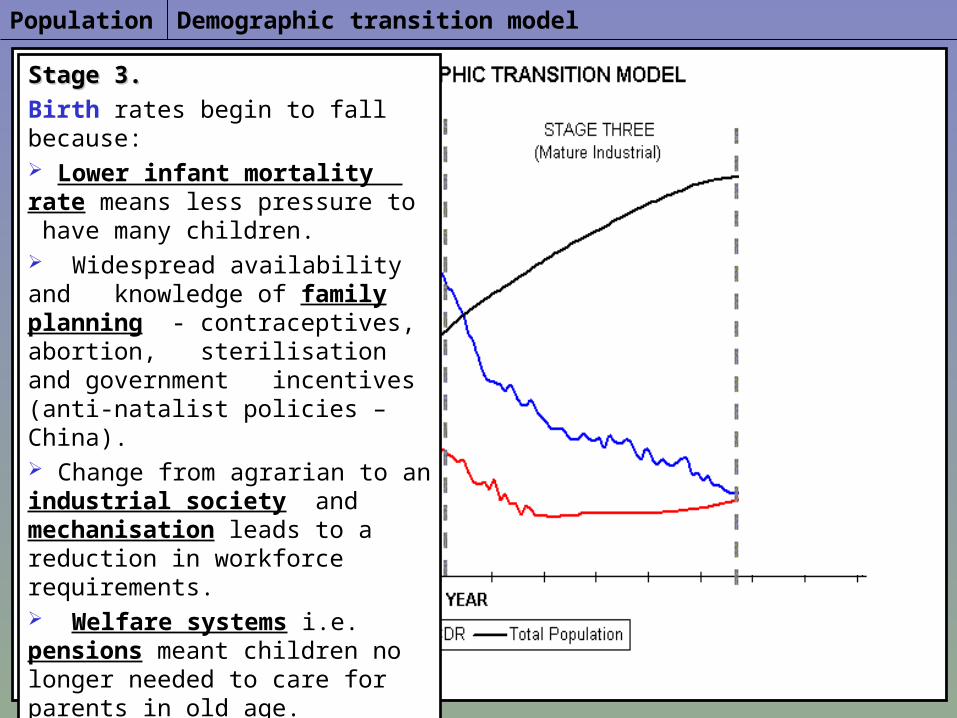
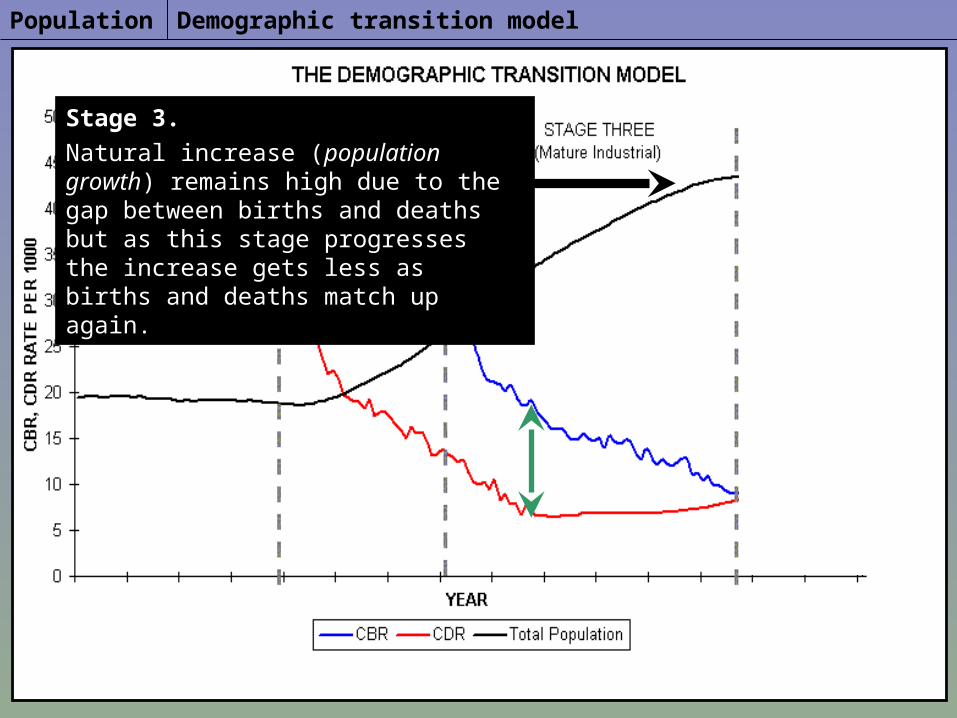
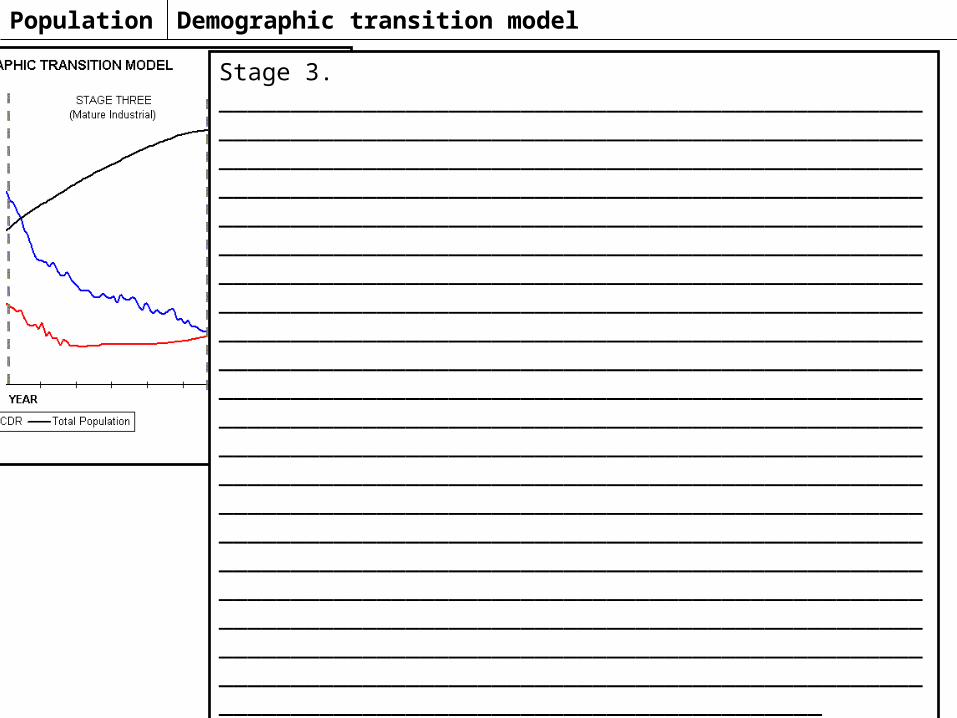
Stage 3.Stage 3.Birth start to fall now and death rates continue to fall, causing the population to continue to rise but less quickly now as the gap between births and deaths is closing.
Late expandingLate expandingUK 1880-1940China/Cuba/Australia presently.
Demographic transition model
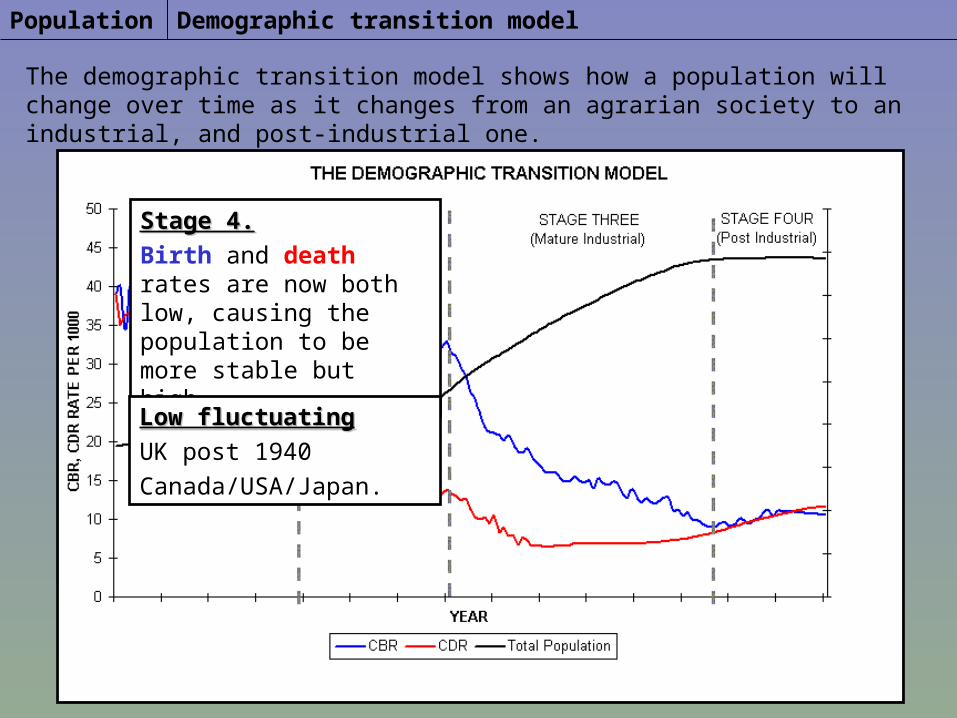
The demographic transition model shows how a population will change over time as it changes from an agrarian society to an industrial, and post-industrial one.
Population
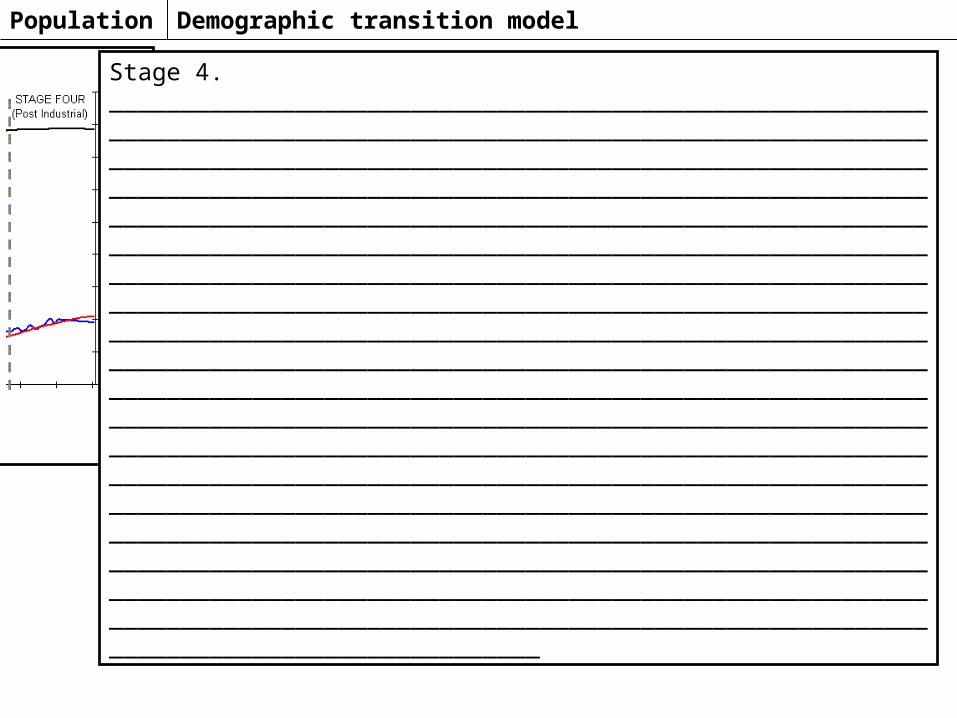
Stage 4.Stage 4.Birth and death rates are now both low, causing the population to be more stable but high.
Low fluctuatingLow fluctuatingUK post 1940Canada/USA/Japan.
Demographic transition modelPopulation
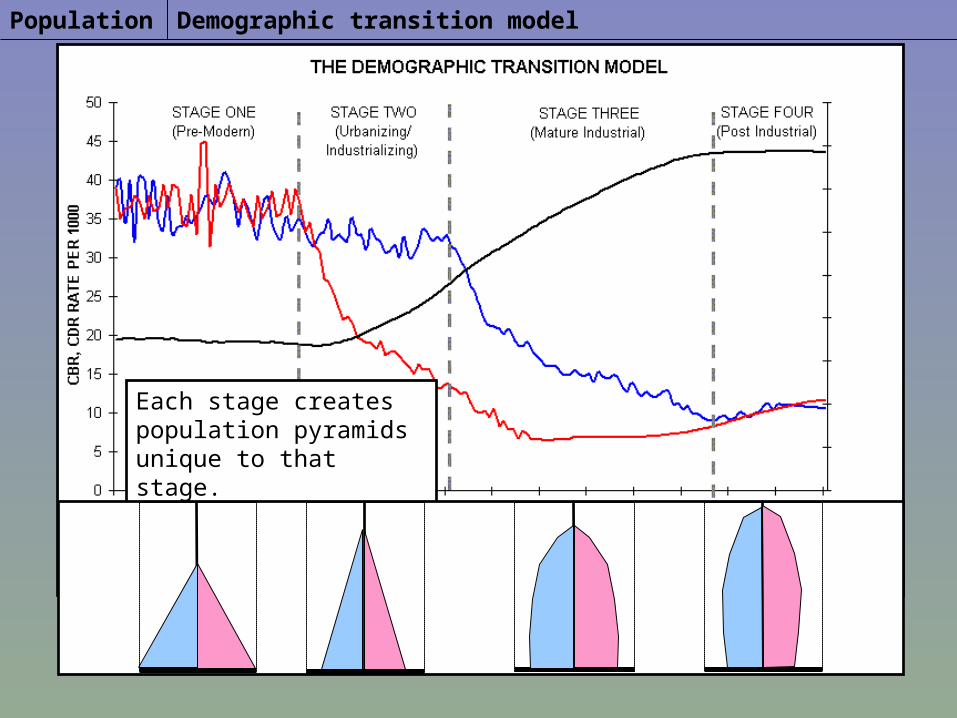
Each stage creates population pyramids unique to that stage.
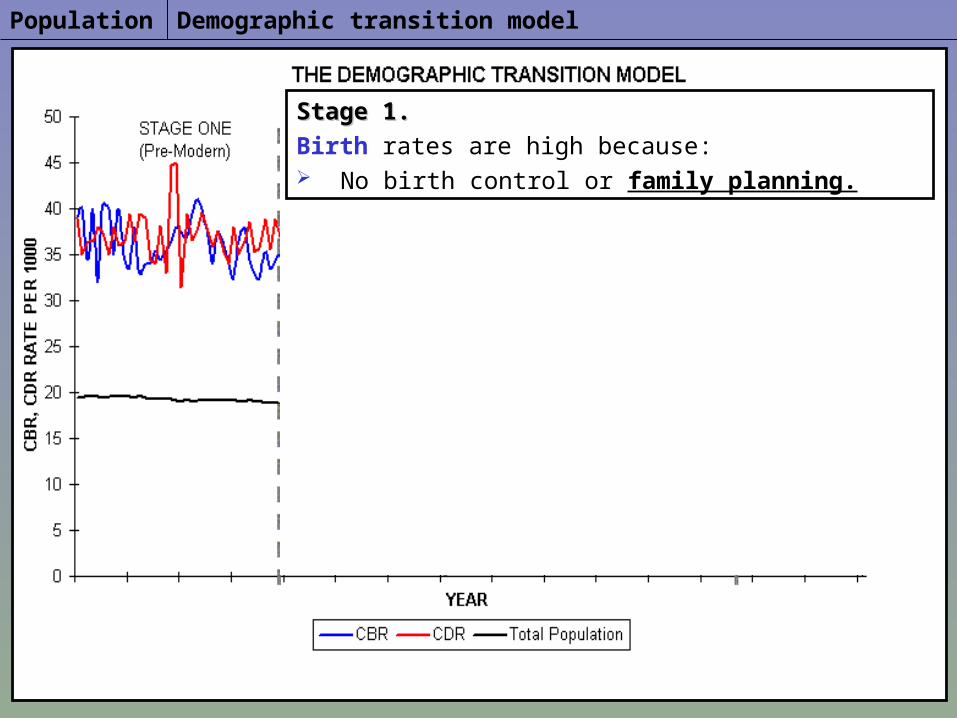
Demographic transition modelPopulation
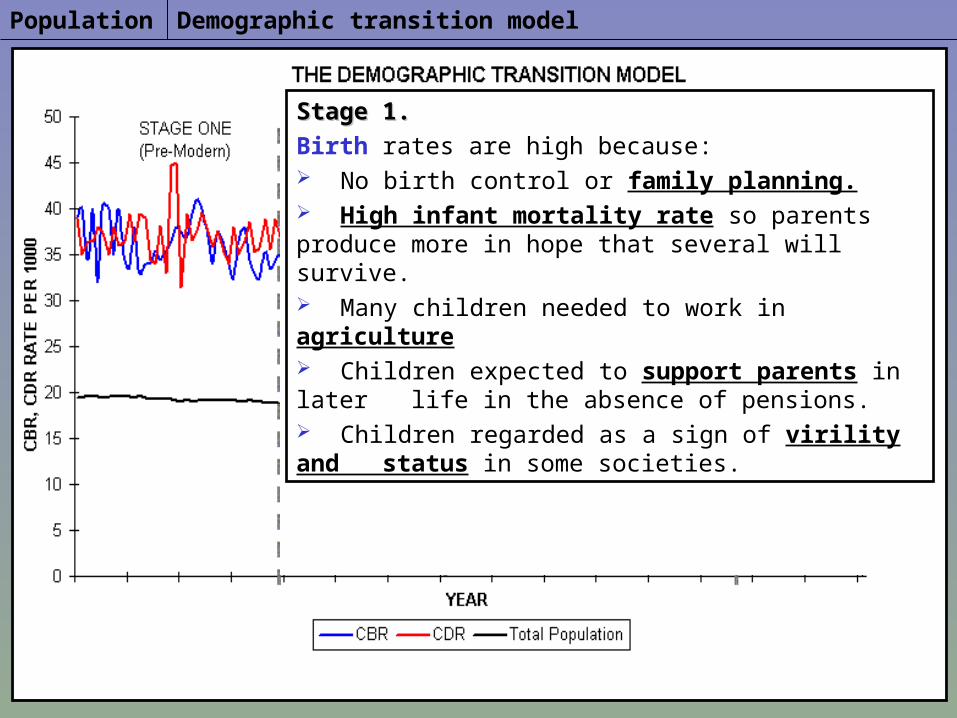
Stage 1.Stage 1.Birth rates are high because: No birth control or family planning.
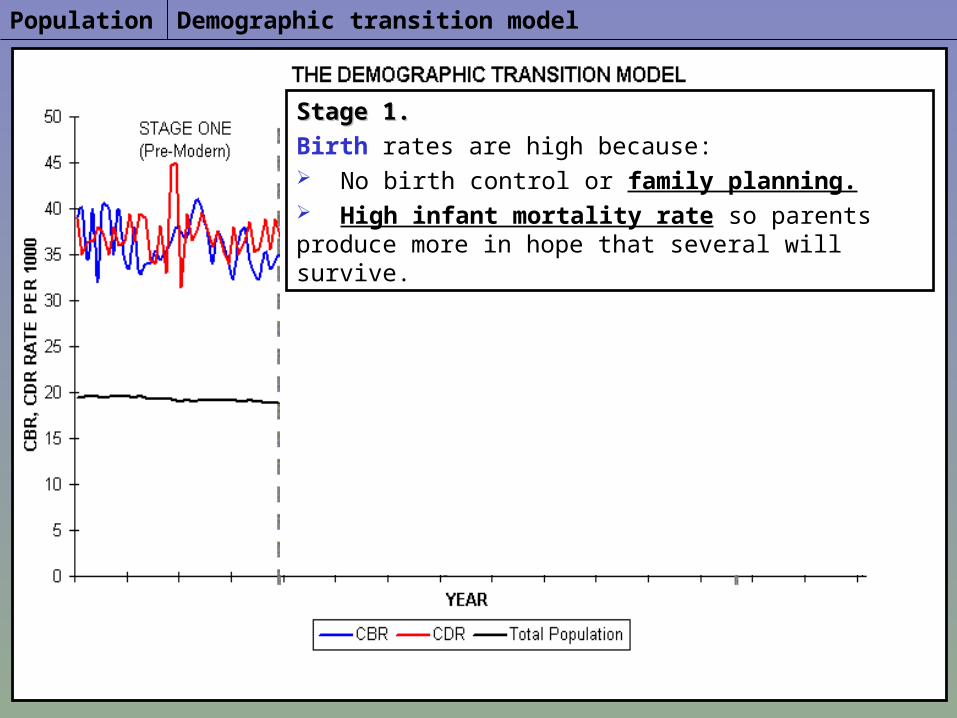
Demographic transition modelPopulation
Stage 1.Stage 1.Birth rates are high because: No birth control or family planning. High infant mortality rate so parents produce more in hope that several will survive.
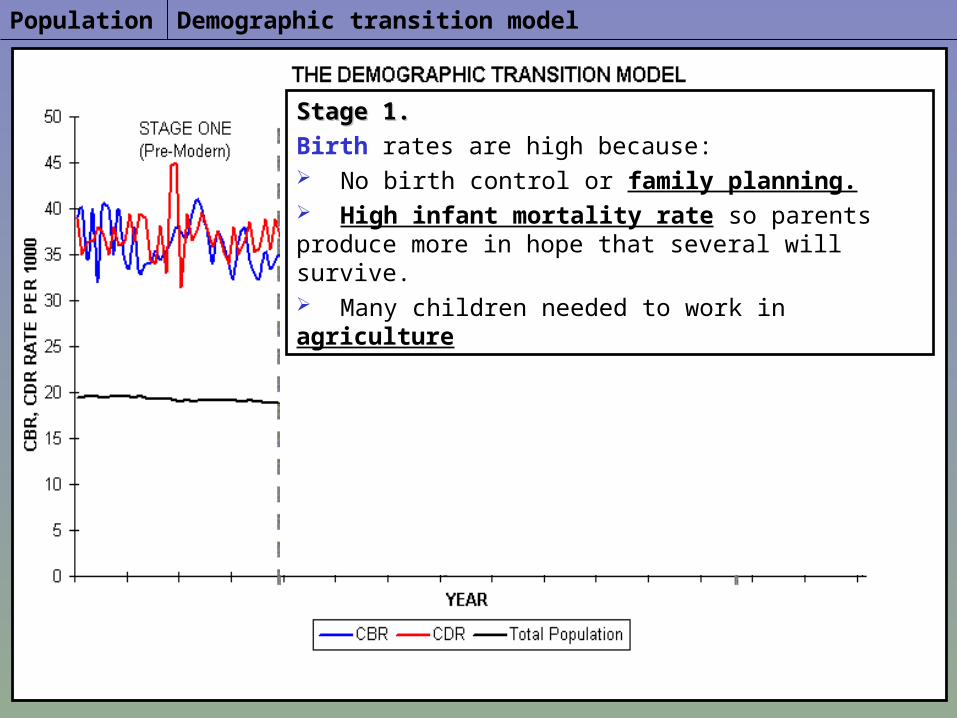
Demographic transition modelPopulation
Stage 1.Stage 1.Birth rates are high because: No birth control or family planning. High infant mortality rate so parents produce more in hope that several will survive. Many children needed to work in agriculture
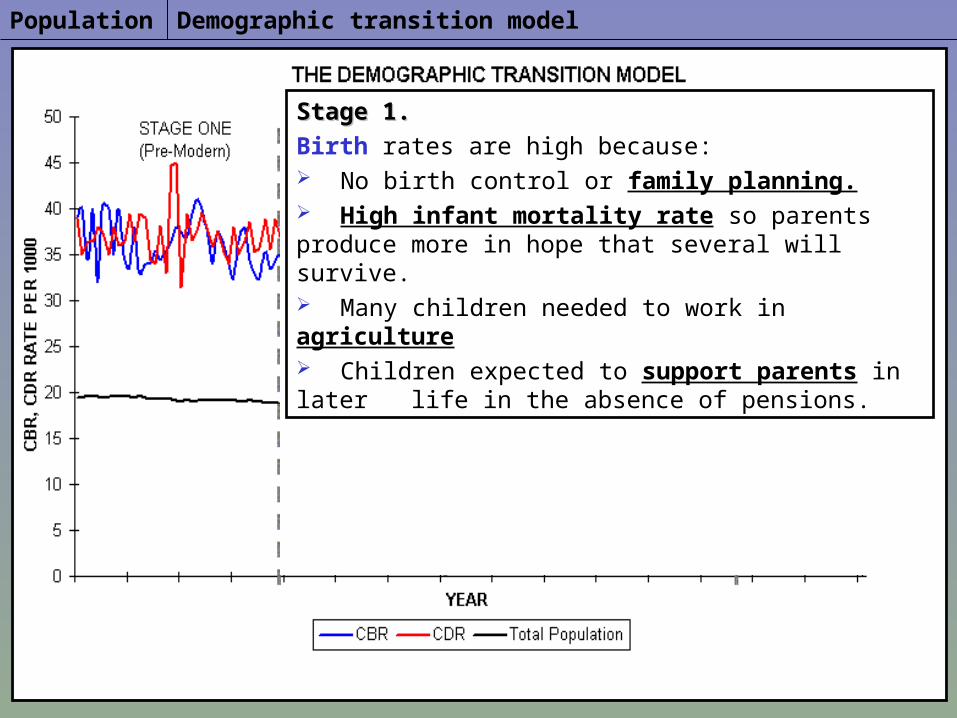
Demographic transition modelPopulation
Stage 1.Stage 1.Birth rates are high because: No birth control or family planning. High infant mortality rate so parents produce more in hope that several will survive. Many children needed to work in agriculture Children expected to support parents in later life in the absence of pensions.
Demographic transition modelPopulation
Stage 1.Stage 1.Birth rates are high because: No birth control or family planning. High infant mortality rate so parents produce more in hope that several will survive. Many children needed to work in agriculture Children expected to support parents in later life in the absence of pensions. Children regarded as a sign of virility and status in some societies.
Demographic transition modelPopulation
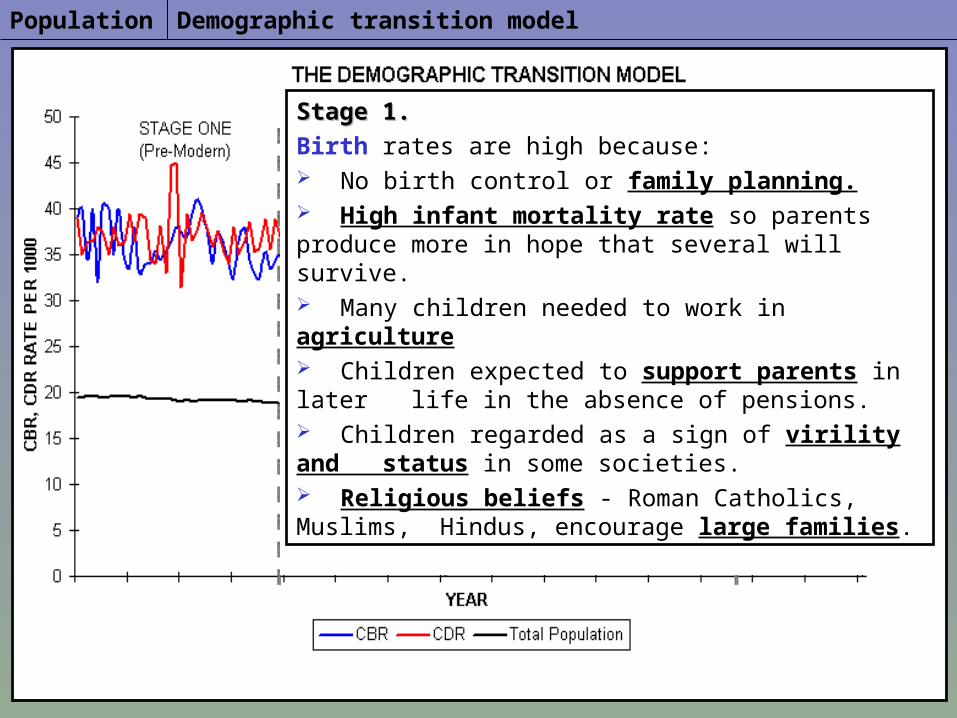
Stage 1.Stage 1.Birth rates are high because: No birth control or family planning. High infant mortality rate so parents produce more in hope that several will survive. Many children needed to work in agriculture Children expected to support parents in later life in the absence of pensions. Children regarded as a sign of virility and status in some societies. Religious beliefs - Roman Catholics, Muslims, Hindus, encourage large families.
Demographic transition modelPopulation
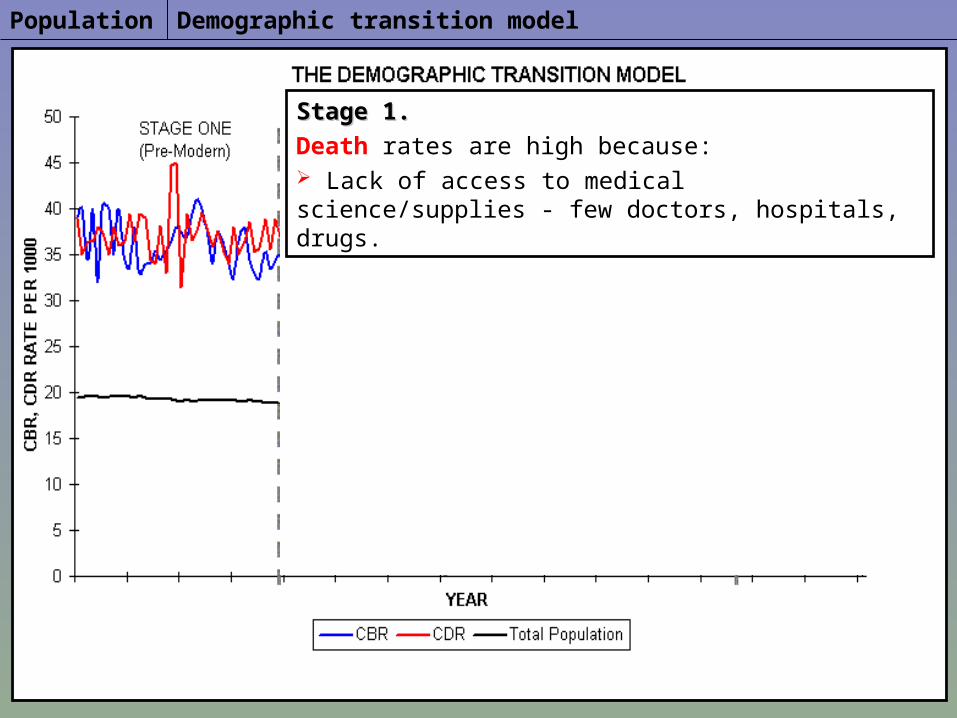
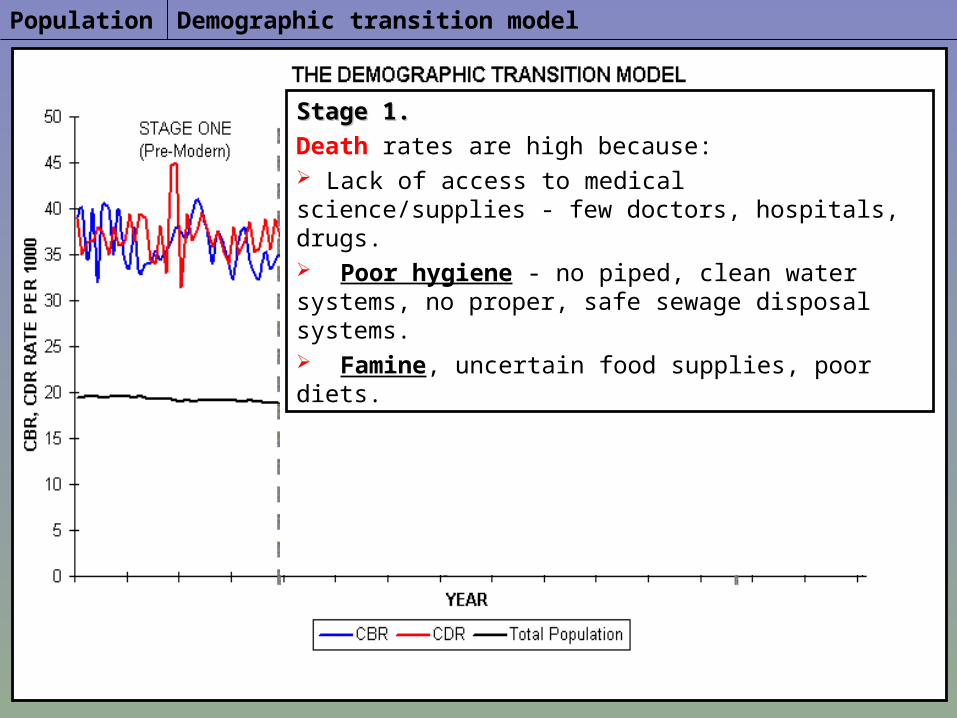
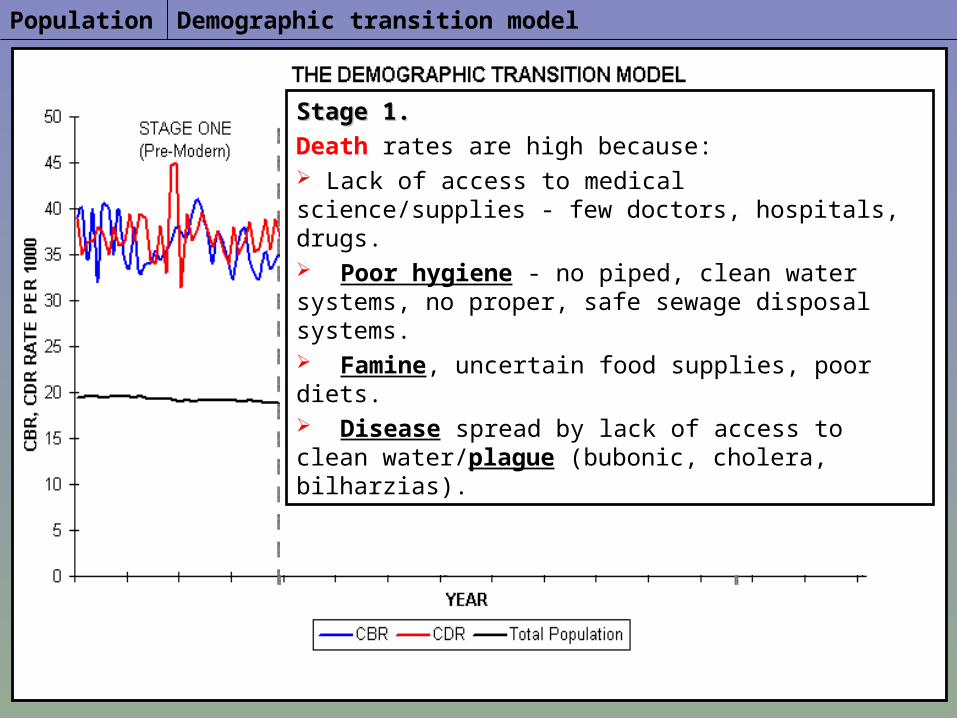
Stage 1.Stage 1.Death rates are high because: Lack of access to medical science/supplies - few doctors, hospitals, drugs.
Demographic transition modelPopulation
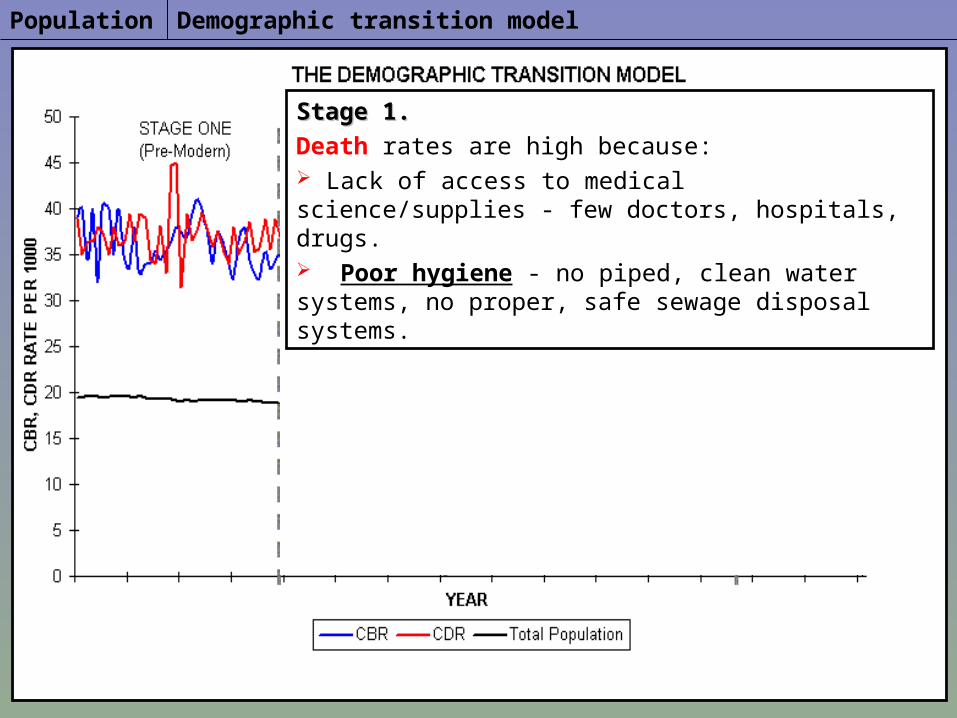
Stage 1.Stage 1.Death rates are high because: Lack of access to medical science/supplies - few doctors, hospitals, drugs. Poor hygiene - no piped, clean water systems, no proper, safe sewage disposal systems.
Demographic transition modelPopulation
Stage 1.Stage 1.Death rates are high because: Lack of access to medical science/supplies - few doctors, hospitals, drugs. Poor hygiene - no piped, clean water systems, no proper, safe sewage disposal systems. Famine, uncertain food supplies, poor diets.
Demographic transition modelPopulation
Stage 1.Stage 1.Death rates are high because: Lack of access to medical science/supplies - few doctors, hospitals, drugs. Poor hygiene - no piped, clean water systems, no proper, safe sewage disposal systems. Famine, uncertain food supplies, poor diets. Disease spread by lack of access to clean water/plague (bubonic, cholera, bilharzias).
Demographic transition modelPopulation
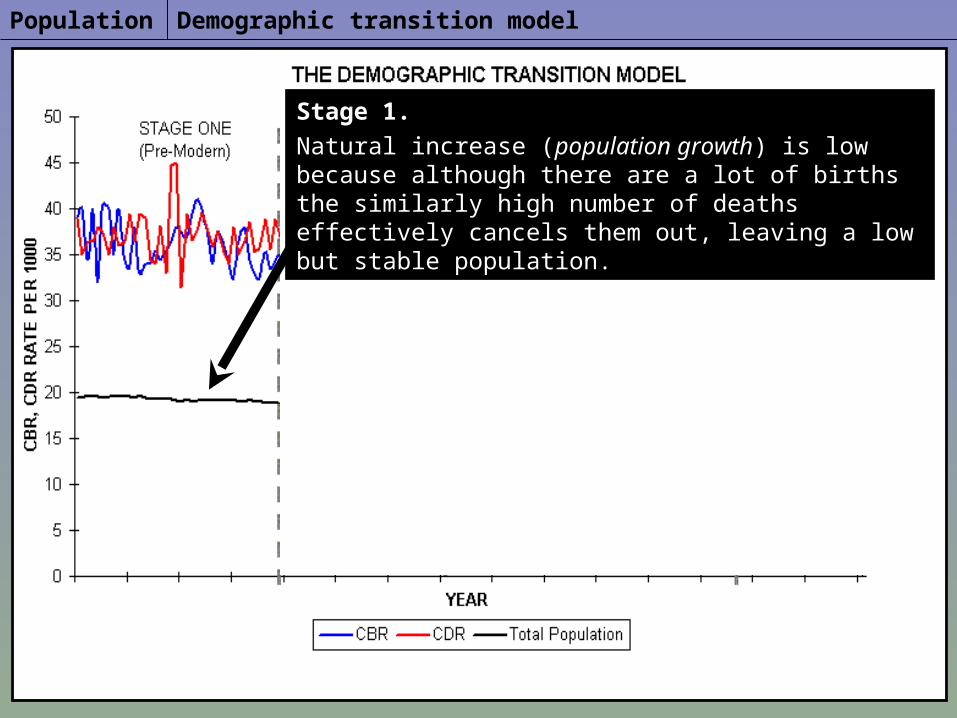
Stage 1.Stage 1.Natural increase (population growth) is low because although there are a lot of births the similarly high number of deaths effectively cancels them out, leaving a low but stable population.
Demographic transition modelPopulation
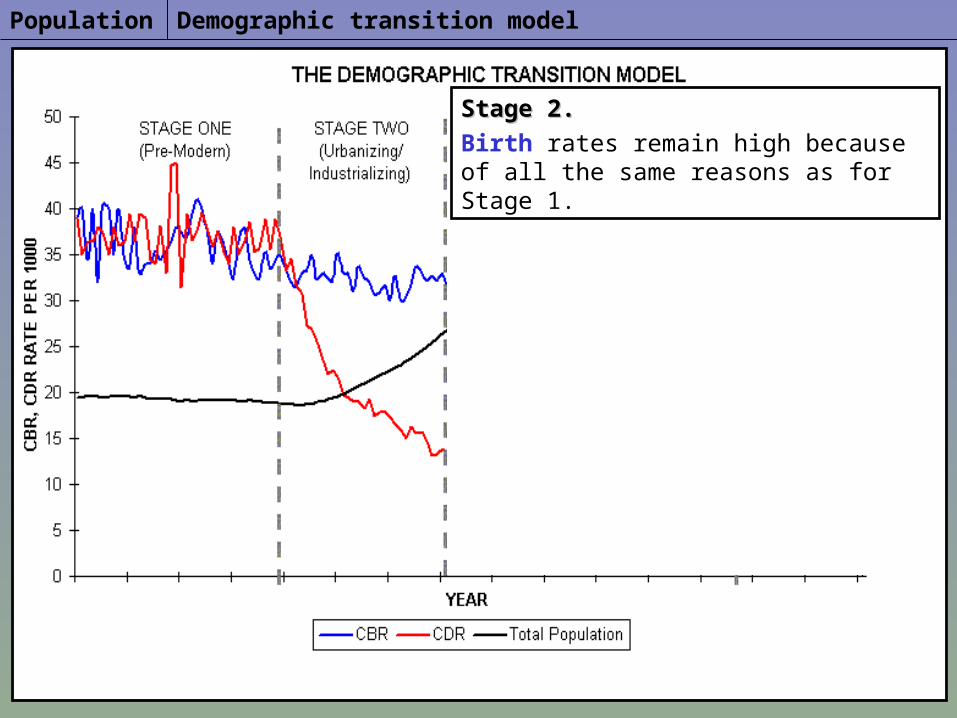
Stage 2.Stage 2.Birth rates remain high because of all the same reasons as for Stage 1.
Demographic transition modelPopulation
Stage 2.Stage 2.Death rates begin to fall because: Improved medical care - antibiotics, vaccinations, hospitals, doctors, drugs, scientific innovations which combined to reduce infant mortality rates.
Demographic transition modelPopulation
Stage 2.Stage 2.Death rates begin to fall because: Improved medical care - antibiotics, vaccinations, hospitals, doctors, drugs, scientific innovations which combined to reduce infant mortality rates. Improved sanitation and water supply systems reduces disease.
Demographic transition modelPopulation
Stage 2.Stage 2.Death rates begin to fall because: Improved medical care - antibiotics, vaccinations, hospitals, doctors, drugs, scientific innovations which combined to reduce infant mortality rates. Improved sanitation and water supply systems reduces disease. Improvements in agricultural efficiency increased quality and quantity of food production, reducing shortages.
Demographic transition modelPopulation
Stage 2.Stage 2.Death rates begin to fall because: Improved medical care - antibiotics, vaccinations, hospitals, doctors, drugs, scientific innovations which combined to reduce infant mortality rates. Improved sanitation and water supply systems reduces disease. Improvements in agricultural efficiency increased quality and quantity of food production, reducing shortages. Improved communications to transport food, doctors, medicines etc.
Demographic transition modelPopulation
Stage 2.Stage 2.Natural increase (population growth) is high because there is now a large gap between births and deaths, increasing the population rapidly.
Demographic transition modelPopulation
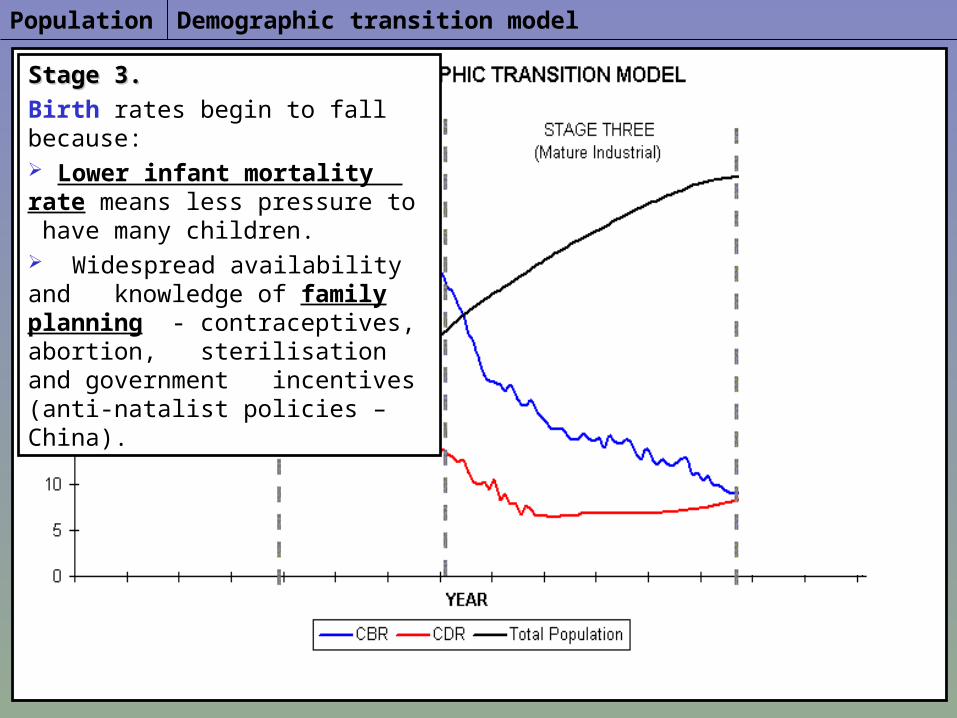
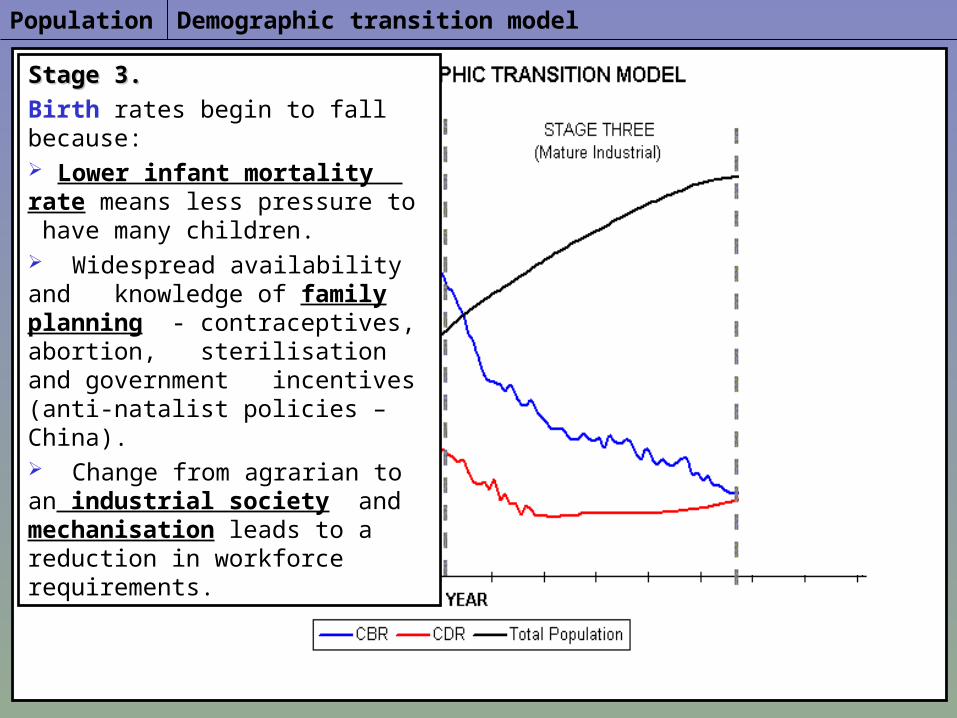
Stage 3.Stage 3.Birth rates begin to fall because: Lower infant mortality rate means less pressure to have many children.
Demographic transition modelPopulation
Stage 3.Stage 3.Birth rates begin to fall because: Lower infant mortality rate means less pressure to have many children. Widespread availability and knowledge of family planning - contraceptives, abortion, sterilisation and government incentives (anti-natalist policies –China).
Demographic transition modelPopulation
Stage 3.Stage 3.Birth rates begin to fall because: Lower infant mortality rate means less pressure to have many children. Widespread availability and knowledge of family planning - contraceptives, abortion, sterilisation and government incentives (anti-natalist policies –China). Change from agrarian to an industrial society and mechanisation leads to a reduction in workforce requirements.
Demographic transition modelPopulation
Stage 3.Stage 3.Birth rates begin to fall because: Lower infant mortality rate means less pressure to have many children. Widespread availability and knowledge of family planning - contraceptives, abortion, sterilisation and government incentives (anti-natalist policies –China). Change from agrarian to an industrial society and mechanisation leads to a reduction in workforce requirements. Welfare systems i.e. pensions meant children no longer needed to care for parents in old age.
Demographic transition modelPopulation
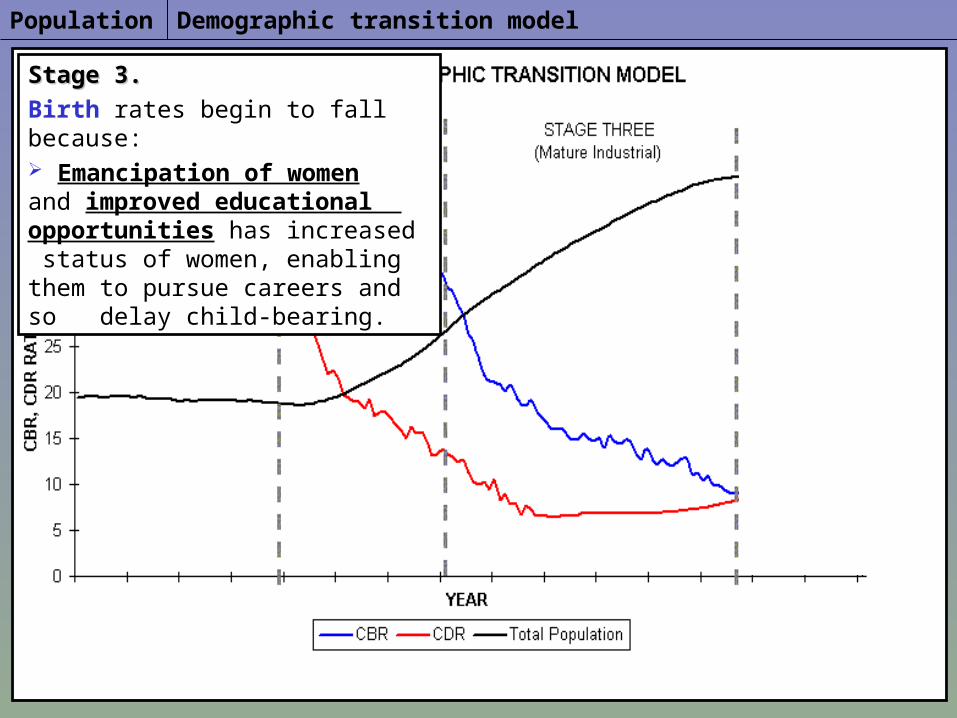
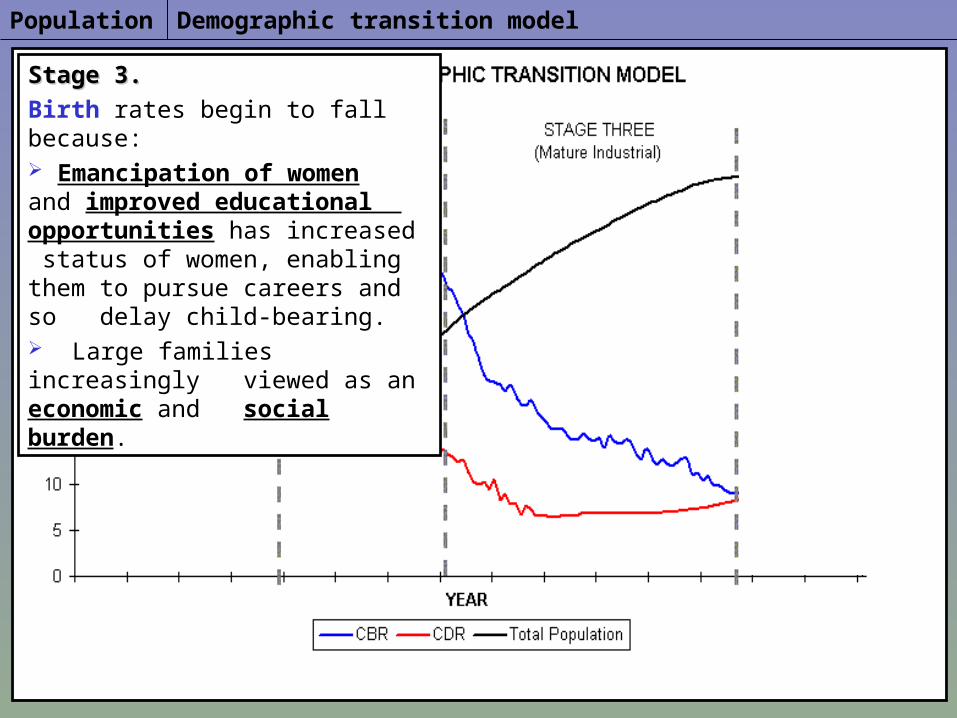
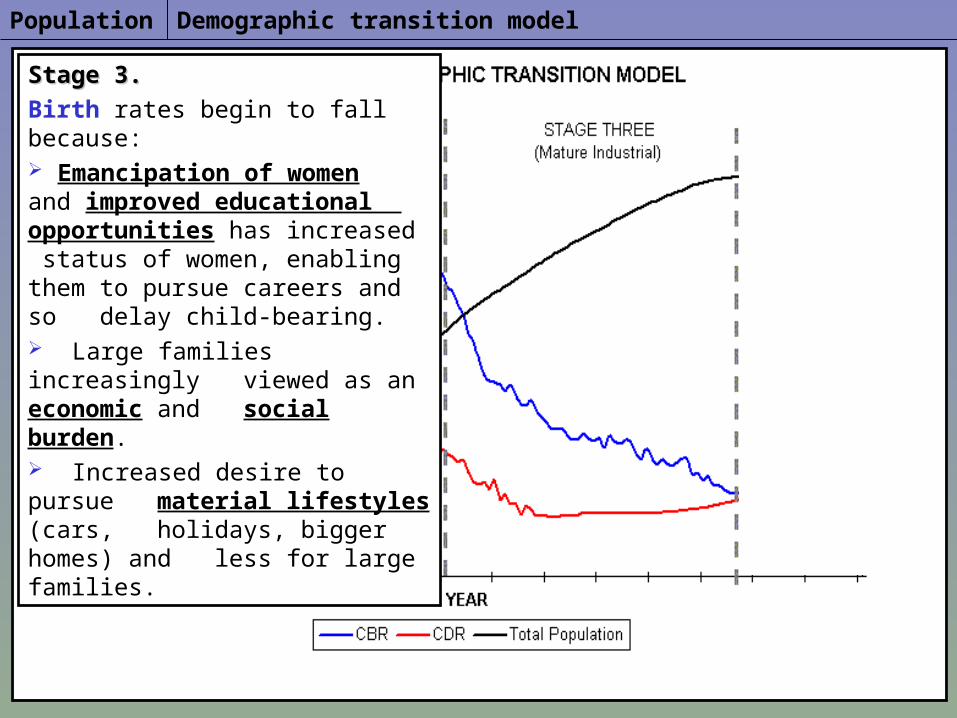
Stage 3.Stage 3.Birth rates begin to fall because: Emancipation of women and improved educational opportunities has increased status of women, enabling them to pursue careers and so delay child-bearing.
Demographic transition modelPopulation
Stage 3.Stage 3.Birth rates begin to fall because: Emancipation of women and improved educational opportunities has increased status of women, enabling them to pursue careers and so delay child-bearing. Large families increasingly viewed as an economic and social burden.
Demographic transition modelPopulation
Stage 3.Stage 3.Birth rates begin to fall because: Emancipation of women and improved educational opportunities has increased status of women, enabling them to pursue careers and so delay child-bearing. Large families increasingly viewed as an economic and social burden. Increased desire to pursue material lifestyles (cars, holidays, bigger homes) and less for large families.
Demographic transition modelPopulation
Stage 3.Stage 3.Natural increase (population growth) remains high due to the gap between births and deaths but as this stage progresses the increase gets less as births and deaths match up again.
Demographic transition modelPopulation
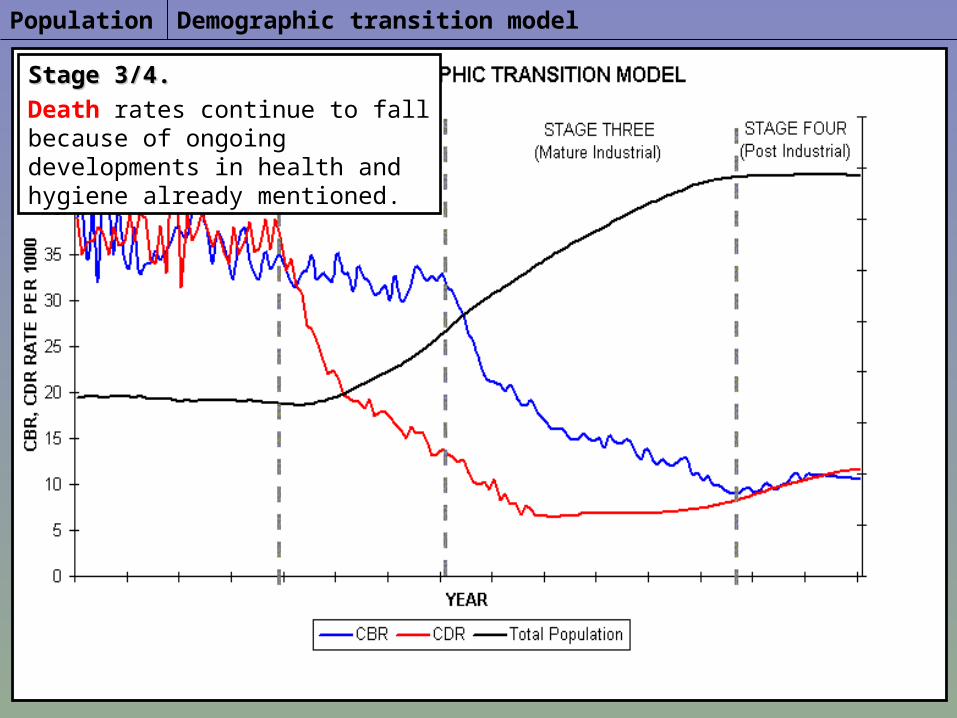
Stage 3/4.Stage 3/4.Death rates continue to fall because of ongoing developments in health and hygiene already mentioned.
Demographic transition modelPopulation
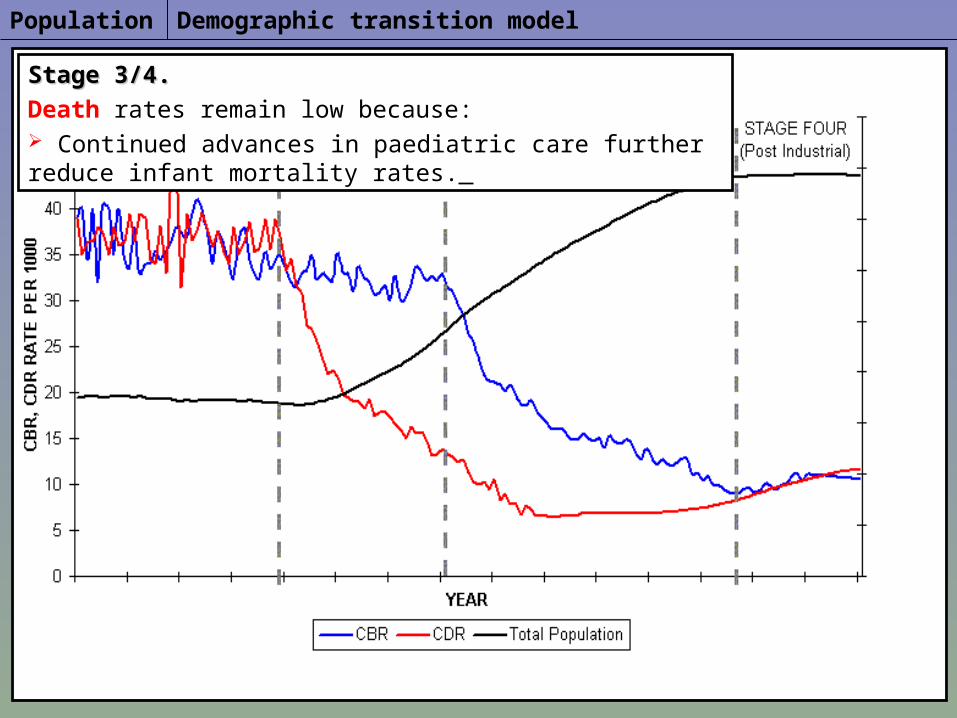
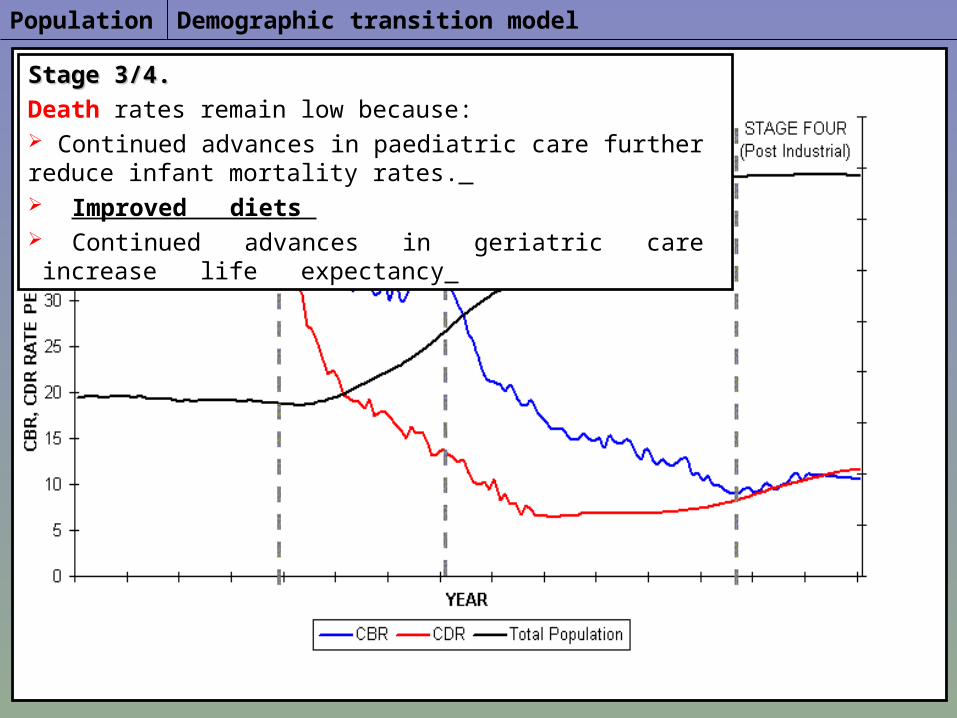
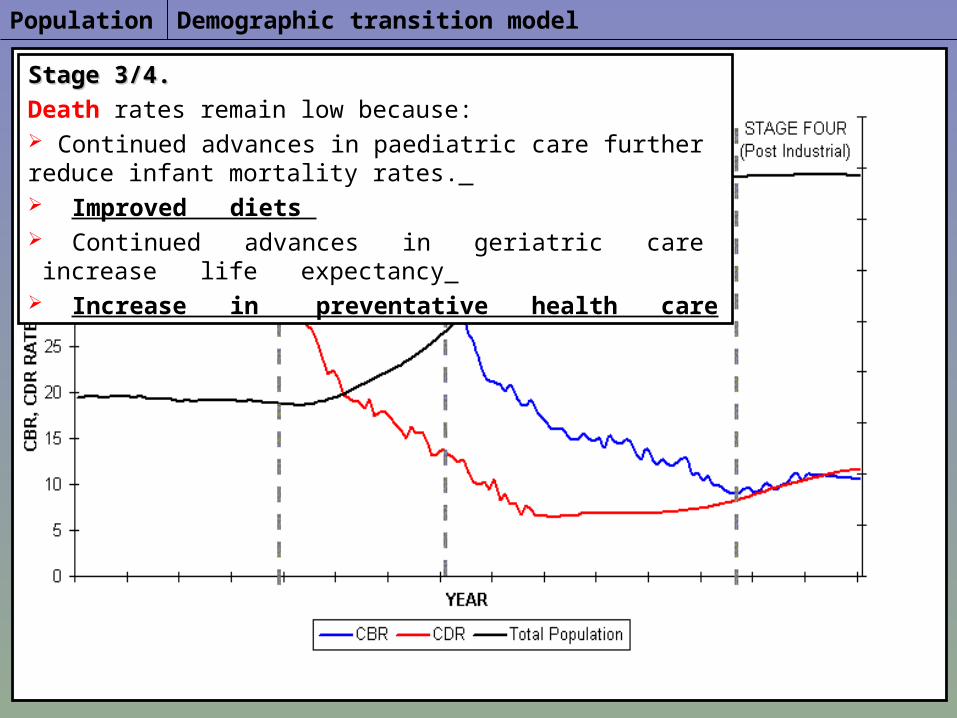
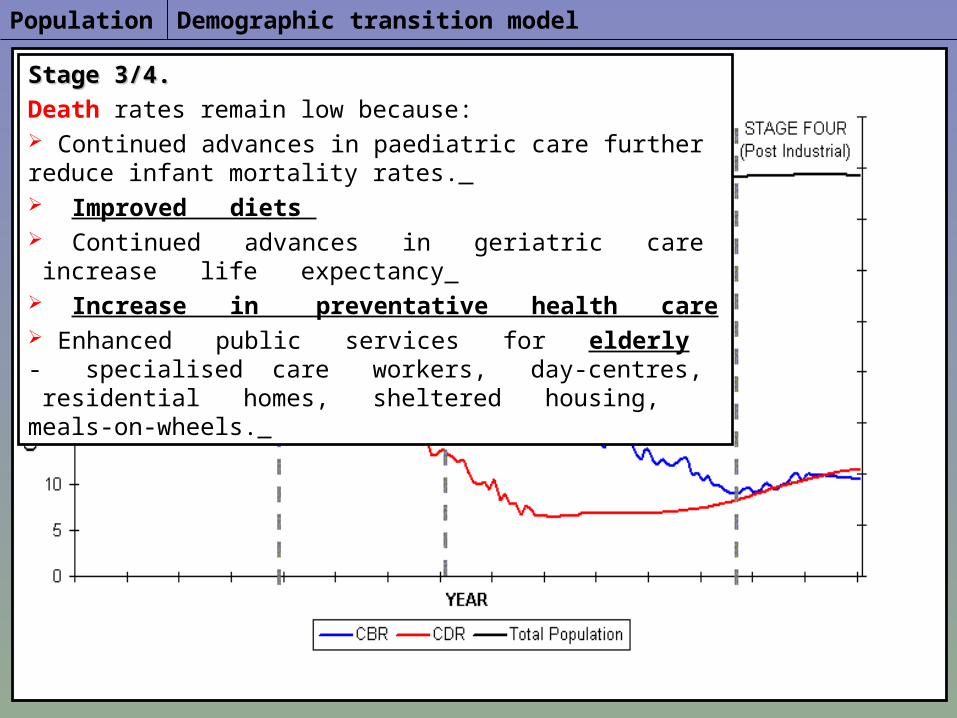
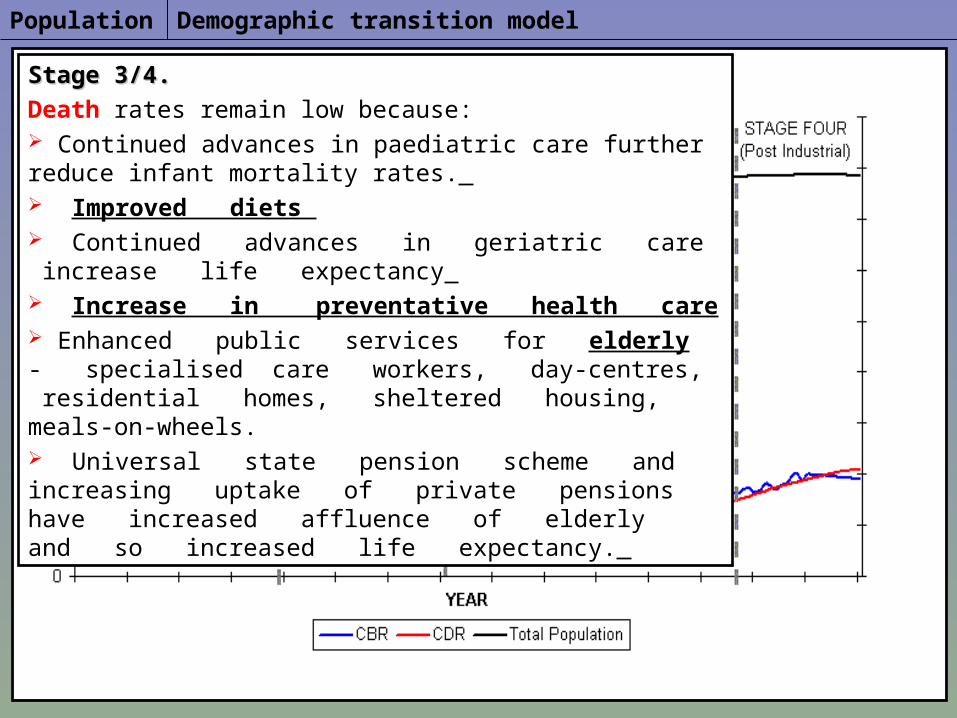
Stage 3/4.Stage 3/4.Death rates remain low because: Continued advances in paediatric care further reduce infant mortality rates.
Demographic transition modelPopulation
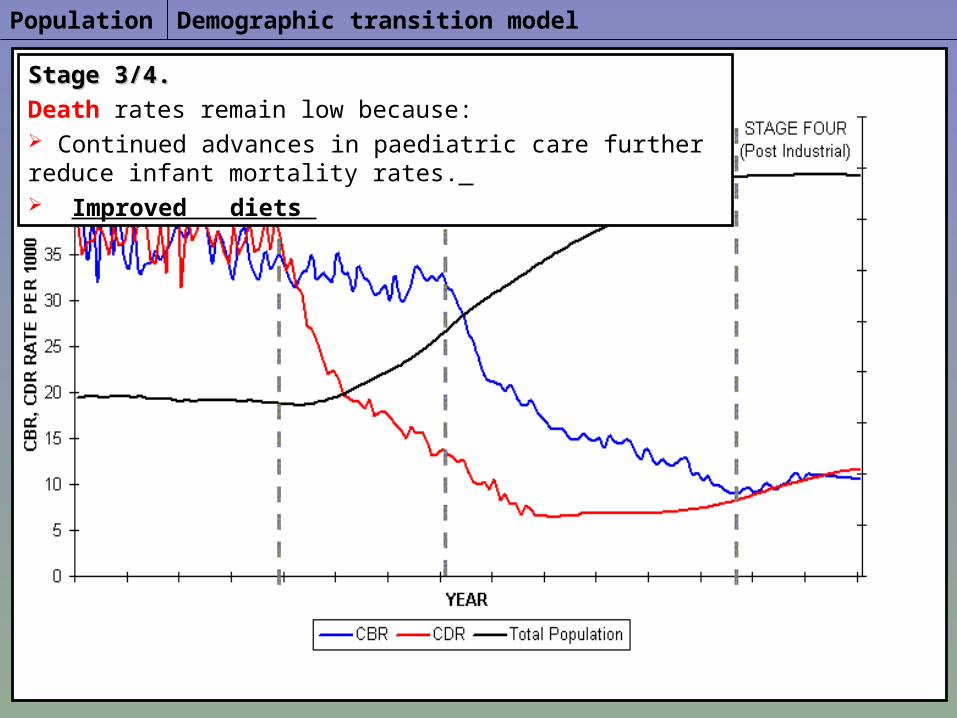
Stage 3/4.Stage 3/4.Death rates remain low because: Continued advances in paediatric care further reduce infant mortality rates. Improved diets
Demographic transition modelPopulation
Stage 3/4.Stage 3/4.Death rates remain low because: Continued advances in paediatric care further reduce infant mortality rates. Improved diets Continued advances in geriatric care increase life expectancy
Demographic transition modelPopulation
Stage 3/4.Stage 3/4.Death rates remain low because: Continued advances in paediatric care further reduce infant mortality rates. Improved diets Continued advances in geriatric care increase life expectancy Increase in preventative health care
Demographic transition modelPopulation
Stage 3/4.Stage 3/4.Death rates remain low because: Continued advances in paediatric care further reduce infant mortality rates. Improved diets Continued advances in geriatric care increase life expectancy Increase in preventative health care Enhanced public services for elderly - specialised care workers, day-centres, residential homes, sheltered housing, meals-on-wheels.
Demographic transition modelPopulation
Stage 3/4.Stage 3/4.Death rates remain low because: Continued advances in paediatric care further reduce infant mortality rates. Improved diets Continued advances in geriatric care increase life expectancy Increase in preventative health care Enhanced public services for elderly - specialised care workers, day-centres, residential homes, sheltered housing, meals-on-wheels. Universal state pension scheme and increasing uptake of private pensions have increased affluence of elderly and so increased life expectancy.
Demographic transition modelPopulation
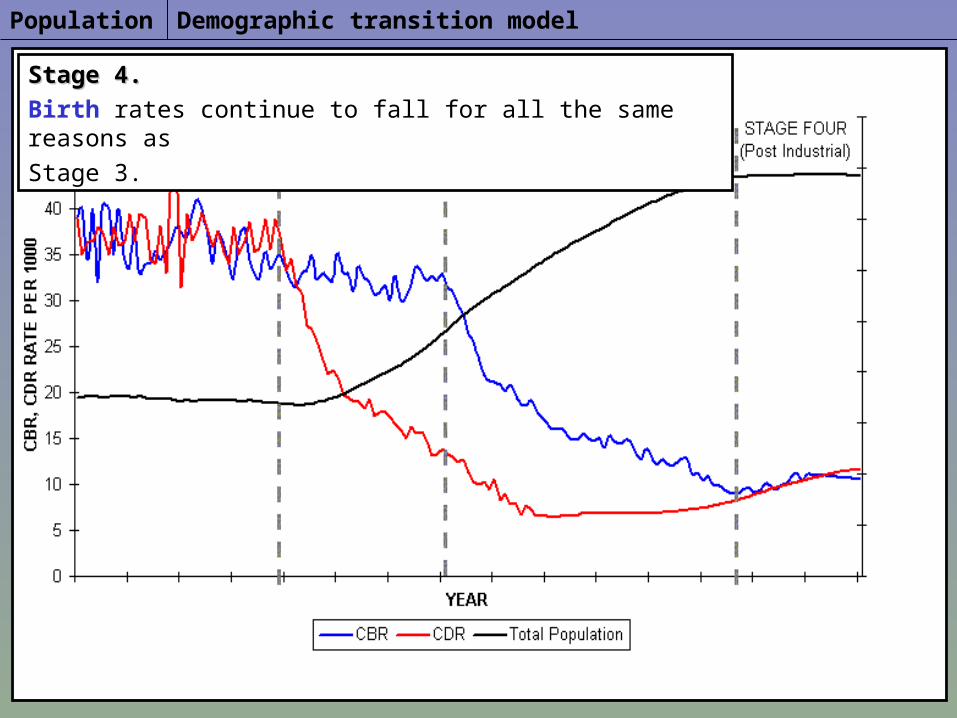
Stage 4.Stage 4.Birth rates continue to fall for all the same reasons as Stage 3.
Demographic transition modelPopulation
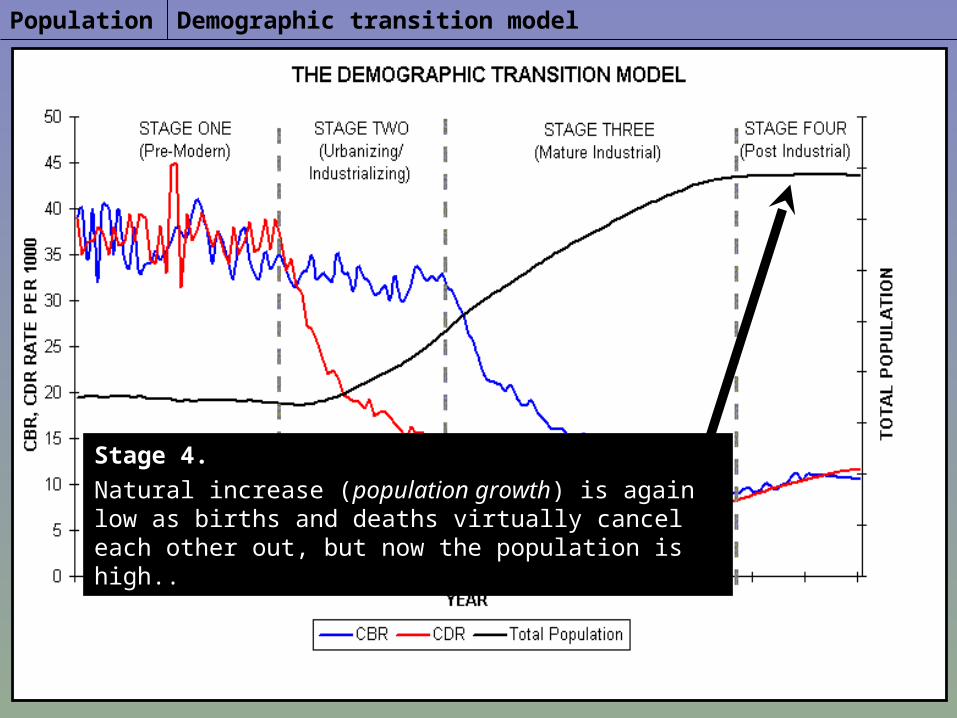
Stage 4.Stage 4.Natural increase (population growth) is again low as births and deaths virtually cancel each other out, but now the population is high..
Demographic transition modelPopulation
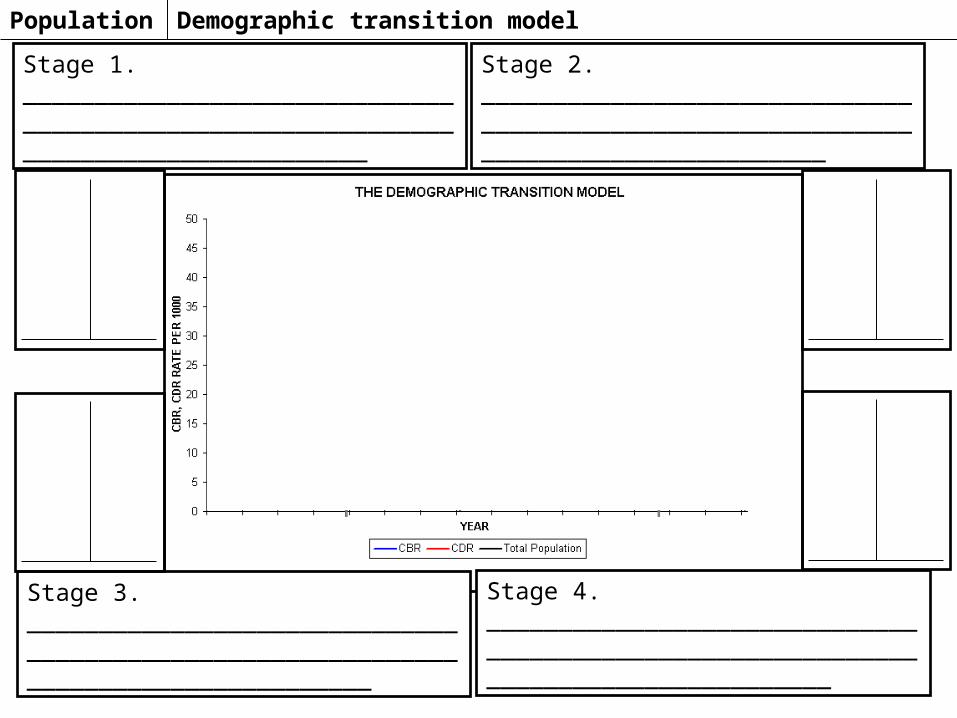
Stage 1. ____________________________________________________________________________________
Stage 2. ____________________________________________________________________________________
Stage 3. ____________________________________________________________________________________
Stage 4. ____________________________________________________________________________________
Demographic transition modelPopulation
Stage 1. ___________________________________________________________________________________________________________________________________________________________________________________________________________________________________________________________________________________________________________________________________________________________________________________________________________________________________________________________________________________________________________________________________________________________________________________________________________________________________________________________________________________________________________________________________________________________________________________________________________________________________________________________________________________________________________________________________________________________________________________________________________________________
Demographic transition modelPopulation
Stage 2. _______________________________________________________________________________________________________________________________________________________________________________________________________________________________________________________________________________________________________________________________________________________________________________________________________________________________________________________________________________________________________________________________________________________________________________________________________________________________________________________________________________________________________________________________________________________________________________________________________________________________________________________________________________________________________________________________________________________________________________________________________________________________________________________________________________________________________________
Demographic transition modelPopulation
Stage 3. _______________________________________________________________________________________________________________________________________________________________________________________________________________________________________________________________________________________________________________________________________________________________________________________________________________________________________________________________________________________________________________________________________________________________________________________________________________________________________________________________________________________________________________________________________________________________________________________________________________________________________________________________________________________________________________________________________________________________________________________________________________________________________________________________________________________________________________
Demographic transition modelPopulation
Stage 4. _________________________________________________________________________________________________________________________________________________________________________________________________________________________________________________________________________________________________________________________________________________________________________________________________________________________________________________________________________________________________________________________________________________________________________________________________________________________________________________________________________________________________________________________________________________________________________________________________________________________________________________________________________________________________________________________________________________________________________________________________________________________________________________________________________________________________________________________________________________________