Embed Size (px)
Citation preview

1
Direct Observation of Markovian Behavior of the Mechanical
Unfolding of Individual Proteins
Yi Cao1, Rachel Kuske2 and Hongbin Li1* 1Department of Chemistry, 2Department of Mathematics
The University of British Columbia
Vancouver, BC, V6T 1Z1
Canada
*To whom correspondence should be addressed ([email protected])

2
Abstract Single molecule force-clamp spectroscopy is a valuable tool to analyze unfolding
kinetics of proteins. Previous force-clamp spectroscopy experiments have demonstrated
that the mechanical unfolding of ubiquitin deviates from the generally assumed
Markovian behavior and involves the features of glassy dynamics. Here we use single
molecule force-clamp spectroscopy to study the unfolding kinetics of a computationally
designed fast-folding mutant of the small protein GB1, which shares a similar β-grasp
fold as ubiquitin. By treating the mechanical unfolding of polyproteins as the
superposition of multiple identical Poisson processes, we developed a simple stochastic
analysis approach to analyze the dwell time distribution of individual unfolding event in
polyprotein unfolding trajectories. Our results unambiguously demonstrate that the
mechanical unfolding of NuG2 fulfills all criteria of a memoryless Markovian process.
This result, in contrasts with the complex mechanical unfolding behaviors observed for
ubiquitin, serves as a direct experimental demonstration of the Markovian behavior for
the mechanical unfolding of a protein and reveals the complexity of the unfolding
dynamics amongst structurally similar proteins. Furthermore, we extended our method
into a robust and efficient pseudo-dwell time analysis method, which allows one to make
full use of all the unfolding events obtained in force-clamp experiment without
categorizing the unfolding events. This method enabled us to measure the key parameters
characterizing the mechanical unfolding energy landscape of NuG2 with improved
precision. We anticipate that the methods demonstrated here will find broad applications
in single molecule force-clamp spectroscopy studies for a wide range of proteins.

3
Introduction Folding and unfolding processes of biomacromolecules, including proteins and
RNAs, are fundamental issues in life science. The folding and unfolding reactions of
RNAs and small single-domain proteins are often described as Markovian processes
(Poisson process)(1), which are memoryless and history-independent. The hallmark of
Poisson processes is that their dwell times ti (inter-arrival time in the classical example of
arrival process in stochastic analysis) are independent and follow identical single
exponential distribution with a rate constant of α: αe-αt, where t is time(2). This behavior
has been directly demonstrated on small RNA systems using single molecule
fluorescence spectroscopy and optical tweezers(3; 4). However, experimental verification
of the Markovian behaviors of proteins folding/unfolding has been challenging(5). The
recently developed single molecule force-clamp spectroscopy offers tremendous
promises to rigorously examine the Markovian nature of the mechanical unfolding of
proteins as well as determine how stretching force affects the mechanical unfolding
kinetics of proteins. In single molecule force-clamp spectroscopy experiments,
polyproteins made of identical tandem repeats of the protein of interest are used. Under a
constant stretching force, individual domains in the polyprotein unfold one by one,
resulting in trajectories of stepwise elongation of the polyprotein. The currently used
method to evaluate the Markovian behavior of protein unfolding is based on averaging
normalized individual unfolding trajectories of polyprotein(6; 7). However, important
information about protein unfolding, such as the correlation between unfolding events as
well as alternative pathways, will be lost during the averaging of individual trajectories.
Hence, analyzing the dwell time distribution of the individual unfolding events will be of
critical importance to the examination of the Markovian nature of the unfolding
processes. Recently, order statistics-based formalism has been developed to analyze the
unfolding kinetics of polyproteins with simple Markovian behavior as well as involving
unfolding intermediate state(6-10). Using order statistical analysis, Fernandez and
colleagues investigated the mechanical unfolding kinetics of ubiquitin(6-9) and
demonstrated that the mechanical unfolding of ubiquitin deviates from the generally
assumed Markovian behavior and involves the features of glassy dynamics(7-9).
However, it remains to be examined whether proteins belonging to the same protein fold

4
family as ubiquitin will share similar unfolding characteristics. Using single molecule
force-clamp spectroscopy, here we examine the unfolding kinetics of the mechanical
unfolding of a small protein NuG2. NuG2, which has a similar β-grasp fold as ubiquitin,
is a computationally designed fast-folding mutant of the small protein GB1(11). It has
been shown that the chemical unfolding of NuG2 follows a simple two-state kinetics
behavior, e. g. Markovian process(11). By treating the mechanical unfolding of
polyproteins as the superposition of multiple identical and independent Poisson
processes, we developed a simple stochastic analysis approach to analyze the dwell time
distribution of individual unfolding event in polyprotein unfolding trajectories and test
the validity of the Markovian assumption of mechanical unfolding of NuG2. Our results
unambiguously demonstrate that the mechanical unfolding of NuG2 fulfills all criteria of
a memoryless Markovian process. This result, in contrast with the complex mechanical
unfolding behaviors observed for ubiquitin, serves as a direct experimental demonstration
of the Markovian behavior for the mechanical unfolding of a protein and reveals the
complexity of the unfolding dynamics amongst structurally similar proteins.
Materials and methods Plasmid containing NuG2 gene was kindly provided by Dr. David Baker. NuG2 is
a computationally designed mutant(11) of protein GB1. DNA encoding NuG2 was
amplified via polymerase chain reaction using forward and reverse primers containing
restriction sites BamHI and BglII followed by KpnI, respectively(12). The sequence of
NuG2 gene was confirmed by direct DNA sequencing. Polyprotein (NuG2)8 was
constructed using a well-established multi-step cloning strategy based on the identity of
the sticky ends generated by BamHI and BglII sites. The polyprotein was overexpressed
in DH5α strain and purified using Co2+-NTA affinity chromatography. The protein
samples were kept in PBS buffer containing 200mM imidazole with 5mM DTT to
prevent air-oxidation of cysteine residues at 4 °C.
Single-molecule force-clamp experiments were carried out on a custom built
atomic force microscope in the constant force mode, which was constructed as described
previously(13). The spring constant of each individual cantilever 1 was calibrated in
solution using the equipartition theorem before and after each experiment(14; 15). All the

5
force-extension measurements were carried out in PBS buffer. 1 µl polyprotein sample
(~500 ng) was added onto a clean glass cover slip covered by PBS buffer and was
allowed to absorb for 5min before proceeding to AFM measurements.
Results and Discussion
Unfolding trajectories of polyprotein of (NuG2)8
To use single molecule force-clamp spectroscopy(8; 9; 13; 16) to directly probe
the unfolding kinetics of NuG2, we constructed a polyprotein of (NuG2)8, which is made
of 8 identical tandem repeats of NuG2. In single molecule force-clamp spectroscopy
studies, polyproteins made of identical tandem repeats of the protein of interest are
required to identify single molecule stretching events unambiguously. Stretching
polyprotein (NuG2)8 results in characteristic stepwise elongation of the polyprotein (Fig.
1B), where the individual step corresponds to the mechanical unfolding of individual
NuG2 domains. Fig. 1B shows a typical extension-time recording of NuG2 in response to
a constant stretching force of 70 pN. The upper trace in Fig. 1B shows the time evolution
of the force, in which spikes, transient relaxation of force to a lower value, were observed
due to the finite response time of our analogue electronic force feedback system in
response to domain unfolding. The unfolding steps are spaced in time and are of equal
sizes of ~15 nm at 70 pN, indicating that NuG2 will elongate by 15 nm upon its
unfolding at 70 pN, in good agreement with the force-extension measurements on the
same protein. The unfolding of NuG2 occurs in sharp steps, indicating the stochastic
nature of the unfolding reaction.
A simple stochastic analysis method to analyze dwell time distribution.
Dwell times ti is usually defined as the inter-arrival time in the classical arrival
process in stochastic analysis(2). For example, in neurophysiology, the time interval
between successive spontaneous miniature end-plate potentials is defined as the dwell
time ti and has been shown to follow single exponential distribution (Fig. 1A) (17).
Although the use of polyproteins in force-clamp spectroscopy studies facilitates the
identification of single molecule stretching events, the dwell times ti (as defined in Fig.

6
1B) are no longer independent and thus cannot be used to directly probe the Markovian
nature of the mechanical unfolding process, due to the finite number of NuG2 domains
present in polyprotein.
To overcome such limitations, different stochastic analysis methods have to be
used or developed. One approach is the order statistics analysis used by Fernandez and
coworkers, in which a binomial distribution of dwell times was used to describe the
stochastic dynamics of the unfolding of ubiquitin(9). Here, we develop a new stochastic
analysis method to use dwell time, ti, to directly evaluate the Markov property of protein
unfolding. This method will have a unique advantage allowing one to pool all the
available dwell time together to significantly improve the statistics and thus the precision
of the measurements.
If the mechanical unfolding of NuG2 can be described as a Poisson process, we
can then treat the unfolding trajectory shown in Fig. 1B as superposition of independent
and identical Poisson processes. As shown in Fig. 1B, we define dwell time ti as the inter-
unfolding time, representing the time from the last unfolding until the time at which any
one of the i folded domains unfolds. If i domains remain folded in the polyprotein, the
process of unfolding any one of these i domains can be considered as the superposition of
i identical Poisson processes when unfoldings of each of the i domains are mutually
independent(2). Therefore, the probability of observing the unfolding of any one of the i
folded domains by time t is:
(1)
where α is the unfolding rate constant of each domain. Hence, the probability density
function for unfolding can be written as:
(2)
where α’=iα. It is evident that the probability distribution (Eq. 1) and probability density
(Eq. 2) for the unfolding of a domain from the polyprotein are not stationary but
dependent on the number of domains that remain folded (i). Thus, we can categorize the
unfolding events with respect to the number of folded domains i in the polyprotein chain
tiiu etP !!""= #1)(
ttiiui
u eeidttdPtf !"!!" !=!!== '')()( ## ##

7
regardless of the total number of domains in a particular trajectory (Fig. 1B and 1C). The
dwell time of each category will follow Eq. (2) with the same apparent rate constant of
α'. This simple relationship allows us to take into account of the non-stationary nature for
polyprotein unfolding and accurately measure the unfolding rate constant, if the
unfolding process of NuG2 is a Poisson process.
Accurately categorizing dwell time ti according to the number of domains that
remain folded in the polyprotein chain.
To use Eq. (2) and (4) in the main text to measure the unfolding rate constant
accurately, it is critical to know the exact number of domains that remain folded (i) for
each individual unfolding event in a given unfolding trajectory. However, since the
polyprotein is picked up by the AFM tip randomly along its contour, it is difficult to have
prior knowledge of the number of domains in the chain being stretched. Because
detachment of polyprotein from either the cantilever and the substrate can happen at any
time and an unfolding event could have occurred beyond the time window for particular
experiment, it is not reliable to determine i directly from the number of steps present in a
given length-time curve (unfolding trajectory). Therefore, we used the following
repetitive stretching-relaxation protocol to determine i accurately without any ambiguity.
In our stretching-relaxation scheme, we first picked up a NuG2 polyprotein
manually and stretched it at constant velocity until all the domains in the polyprotein
chain have unfolded and the force reaches a high value of 300 pN (as the red line in Fig.
2C). The unfolding force histogram of NuG2 at a pulling speed of 400 nm/s is shown in
Fig. 3C. The average unfolding force of NuG2 is 105± 20 pN (average± SD, n= 1,773). It
is clear that the probability for any NuG2 domain to remain folded at a force of 300 pN or
higher is zero. Therefore, stretching the NuG2 polyprotein to 300 pN allowed us to
ensure that all the NuG2 domains have unfolded and the exact number be correctly
counted. From this force-extension curve we also know the resting length (indicated by #)
of the fully folded polyprotein at 70 pN at which we are going to carry out force-clamp
experiment, and the length of the fully unfolded polyprotein (indicated by *). We also
know the total number of domains N in this particular polyprotein (N=6 in this example).
Then we relax the molecule to zero force and wait for a few seconds to allow all the

8
domains to refold. We then carry out our force-clamp experiment, as shown in Fig. 2B.
The green line and cyan line indicate the resting length for a fully folded polyprotein and
the length of the fully unfolded polyprotein at the defined stretching force, respectively.
From the resting length of each individual constant force unfolding trajectory, we
can readily assign ti to each unfolding event (see Curve 1 in Fig. 2B for example). In
curve (2), the resting length of the same polyprotein is ~15 nm longer than the resting
length for a fully folded polyprotein, indicating that one NuG2 domain did not fold and
curve (B) represents the unfolding trajectory of five folded NuG2 domains plus one
unfolded NuG2 domain. Thus, the dwell time of the first event (indicated by the black
arrow) will be assigned as t5. In curve (3), the resting length is the same as that of a fully
folded polyprotein, but the final length is ~15 nm shorter than that for a completely
unfolded polyprotein, indicating that one NuG2 domain did not unfold within the given
time window. Therefore, the dwell time for the first unfolding event (indicated by blue
arrow) will be assigned as t6, while the last event (as indicated by the red arrow) will be
assigned as t2. It is clear that if we do not have knowledge about the number of domains
in the given polyprotein chain, the dwell times of the unfolding events in Curve (3) would
have been assigned incorrectly (as shown by circled ti). Therefore, it is critical to have
the knowledge of the number of domains that remain folded for each individual unfolding
event, and in this letter we only used the data obtained from stretching-relaxing
experiments that we have 100% certainty in ti assignment.
The mechanical unfolding of NuG2 is a Markovian process
To test the Markovian nature of the mechanical unfolding of NuG2
experimentally, we separate dwell time into categories t1, t2 … tn as shown in Fig. 1B.
Using the method described above, we can determine i accurately without any ambiguity
and assign i to each unfolding event with 100% certainty. Fig. 1C shows five typical
trajectories obtained from an experiment using such protocols. We categorized the dwell
times of 1809 unfolding events. Histograms for ti with i ranges from 1 to 5 are shown in
Fig. 3A and for ti (i=6, 7) are shown in Fig. S1 of Supporting Information. Each category
of ti can be well-described by a single exponential decay with the coefficient of
determination R2 ranging from 0.984 to 0.995 (for 1≤i≤5, Table S1 in Supporting

9
Information), strongly indicating that Equ. 2, which is derived based on i mutually
independent and identical Poisson processes, is an excellent description of the mechanical
unfolding of NuG2 polyproteins. Hence, we can come to the conclusion that the
mechanical unfolding of NuG2 is a history independent Markovian process and there is
no correlation between the unfolding events of NuG2 domains.
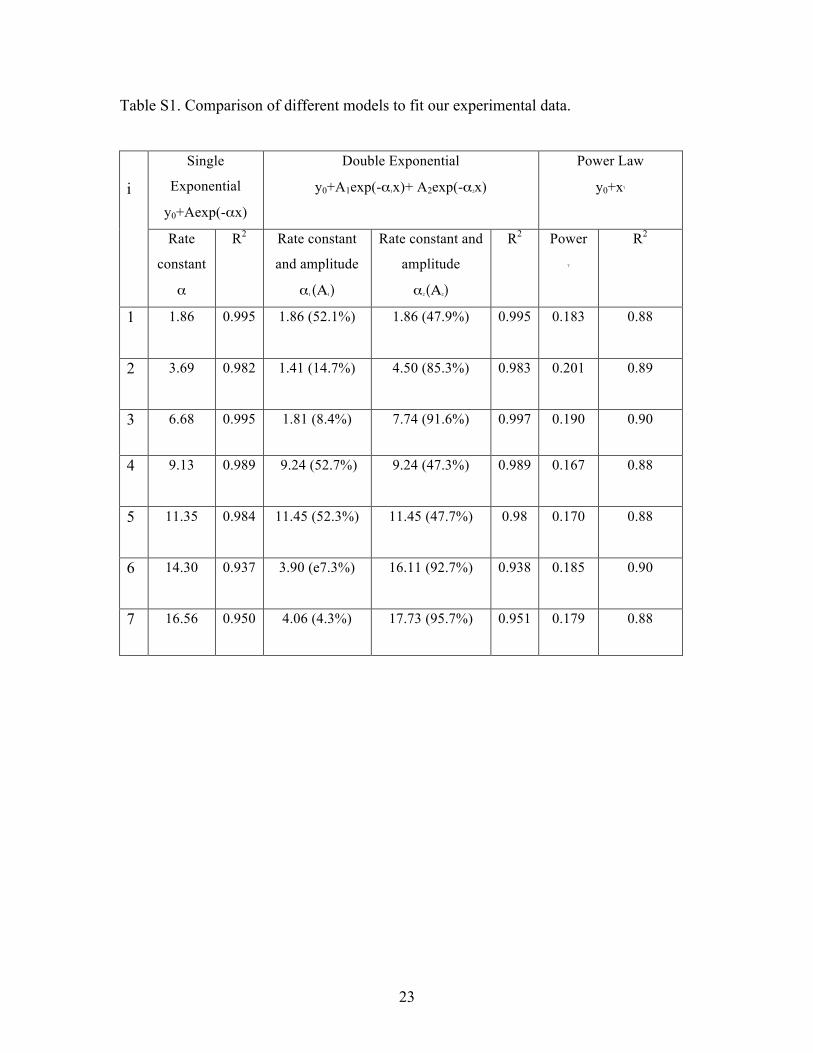
We also tested the appropriateness of other models (power law and double
exponential) in describing the dwell time ti distributions. As shown in Fig. S2 and Table
S1 in Supporting Information, it is evident that power law does not fit our data at all,
excluding the possibility of glassy dynamics in the mechanical unfolding of NuG2.
Double exponential function fits the experimental data with R2 comparable to those of
single exponential fits. However, the double exponential fits are dominated by only one
exponential term (amplitude >90%), which has rate constant very close to that of the
single exponential fits. These results strongly indicate that our measured dwell time
distribution can be genuinely described by a single exponential distribution,
corroborating the Markovian nature of the mechanical unfolding of NuG2.
Fitting each ti histogram to a single exponential function allows us to measure the
apparent rate constant α'(i). Fig. 2B plots α'(i) versus i. As predicted, α'(i) is linearly
proportional to i following the equation of α'(i)=iα. A linear regression measures an α
of 2.33±0.04 s-1 (R2=0.995).
The confirmation that the stochastic model based on superposition of Poisson
processes accurately describes the unfolding behavior of NuG2 polyprotein in force-
clamp experiments presents direct proof that the mechanical unfolding of NuG2 is a
Markovian process, namely, the unfolding of NuG2 is memoryless and does not depend
on history. This result contrasts with the complex unfolding behaviors of ubiquitin, which
has a similar β-grasp fold as NuG2 yet shows glassy dynamics in its unfolding
behaviors(8). Ubiquitin is a highly conserved protein through evolution(18) and it is
likely that ubiquitin is evolved to optimize its function rather than optimize its
folding/unfolding energy landscape. Hence, it is not surprising that the energy landscape
of ubiquitin is not smooth and the frustration in the energy landscape leads to the glassy
dynamics observed in previous single molecule force clamp spectroscopy studies(8; 9). In
contrast, NuG2 is a computationally designed protein(11). Due to the iterative energy

10
minimization during the design, it is likely that frustration in the energy landscape has
been largely removed, leading to a relative smooth energy landscape. Our finding thus
provides an ideal model system for investigating the energy landscape underlying the
unfolding and folding reactions of proteins.
Pseudo-dwell time analysis allows accurate determination of key parameters
characterizing the mechanical unfolding of NuG2.
The mechanical unfolding of NuG2 is characterized by two key parameters:
spontaneous unfolding rate constant α0 at zero force and the distance to the transition
state Δxu. Bell-Evans model(19-21) has been widely used to extract these two parameters
from force-spectroscopy measurements. It was shown that unfolding rate constant α(F)
depends exponentially on the applied stretching force(19)
)exp((F) 0 TkxF
B
!""=##
However, Bell-Evans model implicitly assumes two-state unfolding (Markovian)
behavior, a characteristic that has been rarely tested rigorously. Having rigorously
demonstrated the Markovian behavior of the mechanical unfolding of NuG2, we can now
extract these two key parameters using the dwell time analysis we developed here.
However, in this dwell time analysis, categorizing dwell time ti according to i is a
necessary step, which significantly reduced the sample size hence reduced the precision
of the measurement of unfolding rate constant dramatically (as the precision of the
measurements is inversely proportional to the square root of the number of observations).
For example, the sample size for ti is reduced from a pool of ~1800 events to 301 for i=1
and to 95 for i=7. Due to the technical challenge of force-clamp experiment, it is not
realistic to acquire sufficient data as in Fig. 3 at different stretching force to confer a
high-precision measurement of the unfolding rate constant at different forces. In extreme
cases, it may become impossible to categorize dwell times ti according to i due to the
limited number of unfolding events. It is thus of critical importance to further develop a
more practical method which can make full use of all the available unfolding events by
polling all the dwell time ti together regardless of i.

11
Towards that goal, we now define a pseudo dwell time t’=i·t, hence equation (1)
becomes:
( ) '1' tu etP ⋅−−= α
(3)
It is of note that the new probability distribution (Eq. 3) is independent of i. Accordingly,
the probability density function of unfolding with respect to pseudo dwell time t’ can be
written as:
'
')'()'( tu
u edttdPtf ⋅−⋅== αα (4)
The probability density function of unfolding with respect to t’ now has the form
identical to that of a Poisson process and is independent of i. Thus, we can make full use
of all the t’ from all the unfolding events. Fig. 3C shows the histogram of t’ compiled
from all the 1809 unfolding events obtained in our experiments. We can see that t’ shows
a single exponential distribution with significantly improved statistics. Fitting the
experimental data to Eq. (4) measures an average rate constant α of 2.08±0.08 s-1
(R2=0.995).
Eq. (4) provides a robust and efficient method for analyzing the force-clamp
spectroscopy data. This method provides the possibility to use limited experimental
observations to measure the unfolding rate constant with respectable precision for a
Markovian-type unfolding reaction. We can now use this method to determine α0 and
unfolding distance Δxu by carrying out force-clamp experiments on (NuG2)8 at different
forces. We carried out force-clamp spectroscopy experiments on NuG2 at different
stretching forces (53, 66, 70, 76, 89, 94, 107, 120 pN) and applied the pseudo dwell time
analysis to the measure the unfolding rate constant. Fig. 4 shows the force-dependency
of the unfolding rate constant of NuG2. As predicted by the Bell-Evans model, the
logarithmic of unfolding rate constant α is linearly dependent upon the stretching force:
the higher the force is, the faster the unfolding rate is. Fitting the Bell-Evans model to the
force-dependency of the unfolding rate constant, we directly measured the spontaneous
unfolding rate constant α0 of 0.031 ± 0.001 s-1 for NuG2 at zero force and the unfolding
distance Δxu of 0.25 ± 0.01 nm for NuG2 (R2=0.988). From the spontaneous unfolding

12
rate constant α0, one could estimate the free energy barrier for unfolding. These two
important parameters, free energy barrier and unfolding distance between the native state
and transition state of NuG2, will provide quantitative information about the energy
landscape for the mechanical unfolding of NuG2.
Conclusion In summary, we have developed a simple stochastic analysis method allowing us
to directly analyze the dwell time distribution measured from the unfolding trajectories of
polyproteins made of identical tandem repeats of the protein of interest. Using this
method, we directly demonstrate that the mechanical unfolding of NuG2 is a Markovian
process, which is memoryless and independent of history. This observation contrasts with
the glassy dynamics of the mechanical unfolding of ubiquitin, revealing the complexity
of the unfolding kinetics among the proteins within the same protein fold. The robust
pseudo dwell time analysis method makes it possible to use limited amount of unfolding
trajectories to measure the unfolding rate constant with respectable precision. These new
approaches allow us to determine fundamental parameters characterizing the mechanical
unfolding energy landscape of proteins. We anticipate that the methods demonstrated
here will find broad range of applications in single molecule force-clamp spectroscopy
studies for a wide range of proteins.
Acknowledgements We thank David Baker for providing the plasmid encoding NuG2. This work is
supported by Natural Sciences and Engineering Research Council of Canada, Canada
Research Chairs program and Canada Foundation for Innovation.

13
Figure legends
Figure 1. Mechanical unfolding of (NuG2)8 under constant force. A) Schematic trace of
spontaneous, miniature end-plate potentials (mEPPs). Dwell time ti is the time interval
between successive mEPPs, which follow single exponential distribution. The same
schematic can also describe the Poisson arrival process in classical stochastic analysis.
B) Force-time and length-time curves of (NuG2)8. In force-time curve, the force is
clamped at a constant value of 70 pN. The force trace shows spikes due to the finite
response time of the force feedback system. The length-time curve is marked by ~15nm
stepwise elongation of the end-to-end distance of the protein. Each step corresponds to
the mechanical unfolding event of a protein domain in the polyprotein chain. ti defines
the time by which any one of the i remaining folded domains to unfold. C) Five
representative length-time trajectories of the unfolding of the same (NuG2)8 polyprotein
at 70 pN.
Figure 2. Categorizing dwell time according to the number of folded domains in the chain.
A) Representative force-extension curve of polyprotein (NuG2)8. B) Extension-time
trajectories of the same (NuG2)8 during the force-clamp experiment using repetitive-
stretching protocols. C) The comparison of the unfolding force histogram of NuG2 versus
the high force (~300 pN) used to ensure that all the NuG2 domains have been unfolded
and the number of NuG2 domains in the chain is correctly counted.
Figure 3. Unfolding kinetics of NuG2. A) Dwell time ti follows exponential distribution.
Solid lines are single exponential fits to the experimental data. B) The relationship of
apparent unfolding rate constant α’(i) and the number(i) of domains that remain folded.
α’(i) are proportional to i following the relationship of α'(i)=iα. Linear fit (solid line) to
the data measures an unfolding rate constant α of 2.33 s-1 for NuG2 at 70 pN. The error
bars for all the data points correspond to the fitting error (Fig. 2B) and some of the errors
are so small that the error bars become invisible. The fitting error for each data point is
(from left to right): 0.05, 0.18, 0.16, 0.34, 0.50, 1.27 and 1.30. C) The distribution of
pseudo dwell time (t’) shows single exponential distribution. The pseudo-dwell-times for

14
all i are pooled together, which increase the statistics dramatically. Single exponential fit
(solid line) to the histogram measures an unfolding rate constant of 2.08±0.08 s-1.
Figure 4. The unfolding rate constant depends exponentially on the force. Using pseudo
dwell time analysis, we measured the unfolding rate constants of NuG2 at different
forces. The error bars for all the data points correspond to the fitting error. Some of the
errors are so small that the error bars become invisible. The number of events and fitting
errors for each individual data points, from left to right, are: 298, 0.06; 569, 0.45; 1809,
0.07; 871, 0.06; 959, 0.15 148, 0.82; 278, 0.87; 178, 1.57. Fitting Eq.(5) to the
experimental data measured α0 of 0.031 ± 0.001 s-1 at zero force and unfolding distance
Δxu of 0.25 ± 0.01 nm.

15
References
1. Fersht, A.R. 1992. Structure and Mechanism in Protein Science. Freeman, New York.
2. Cinlar, E. 1975. Introduction to Stochastic Processes. Englewood Cliffs: Prentice-
Hall, Inc. 3. Zhuang, X., L.E. Bartley, H.P. Babcock, R. Russell, T. Ha, D. Herschlag, andS. Chu.
2000. A single-molecule study of RNA catalysis and folding. Science 288:2048-2051.
4. Liphardt, J., B. Onoa, S.B. Smith, I.J. Tinoco, andC. Bustamante. 2001. Reversible
unfolding of single RNA molecules by mechanical force. Science 292:733-737. 5. Rhoades, E., M. Cohen, B. Schuler, andG. Haran. 2004. Two-state folding observed
in individual protein molecules. J Am Chem Soc 126:14686-14687. 6. Schlierf, M., H. Li, andJ.M. Fernandez. 2004. The unfolding kinetics of ubiquitin
captured with single-molecule force-clamp techniques. Proc Natl Acad Sci U S A 101:7299-7304.
7. Garcia-Manyes, S., J. Brujic, C.L. Badilla, andJ.M. Fernandez. 2007. Force-clamp
spectroscopy of single-protein monomers reveals the individual unfolding and folding pathways of I27 and ubiquitin. Biophys J 93:2436-2446.
8. Brujic, J., R.I. Hermans, K.A. Walther, andJ.M. Fernandez. 2006. Single-molecule
force spectroscopy reveals signatures of glassy dynamics in the energy landscape of ubiquitin. Nature Physics 2:282-286.
9. Brujic, J., R.I.Z. Hermans, S. Garcia-Manyes, K.A. Walther, andJ.M. Fernandez.
2007. Dwell-time distribution analysis of polyprotein unfolding using force-clamp spectroscopy. Biophysical Journal 92:2896-2903.
10. Bura, E., D.K. Klimov, andV. Barsegov. 2007. Analyzing forced unfolding of
protein tandems by ordered variates, 1: Independent unfolding times. Biophys J 93:1100-1115.
11. Nauli, S., B. Kuhlman, andD. Baker. 2001. Computer-based redesign of a protein
folding pathway. Nat Struct Biol 8:602-605. 12. Carrion-Vazquez, M., A.F. Oberhauser, S.B. Fowler, P.E. Marszalek, S.E. Broedel,
J. Clarke, andJ.M. Fernandez. 1999. Mechanical and chemical unfolding of a single protein: a comparison. Proc Natl Acad Sci U S A 96:3694-3699.
13. Fernandez, J.M., andH. Li. 2004. Force-clamp spectroscopy monitors the folding
trajectory of a single protein. Science 303:1674-1678.

16
14. Florin, E.L., M. Rief, H. Lehmann, M. Ludwig, C. Dornmair, V.T. Moy, andH.E.
Gaub. 1995. Sensing Specific Molecular-Interactions with the Atomic-Force Microscope. Biosensors & Bioelectronics 10:895-901.
15. Hutter, J.L., andJ. Bechhoefer. 1993. Calibration of Atomic-Force Microscope Tips
(Vol 64, Pg 1868, 1993). Review of Scientific Instruments 64:3342-3342. 16. Oberhauser, A.F., P.K. Hansma, M. Carrion-Vazquez, andJ.M. Fernandez. 2001.
Stepwise unfolding of titin under force-clamp atomic force microscopy. Proc Natl Acad Sci U S A 98:468-472.
17. Johnston, D., andW.S. M.-S. 1995. Foundations of cellular neurophysiology.
Cambridge, Massachchusetts: The MIT Press. 18. Hershko, A., H. Heller, S. Elias, andA. Ciechanover. 1983. Components of
ubiquitin-protein ligase system. Resolution, affinity purification, and role in protein breakdown. J Biol Chem 258:8206-8214.
19. Bell, G.I. 1978. Models for the specific adhesion of cells to cells. Science 200:618-
627. 20. Evans, E. 2001. Probing the relation between force--lifetime--and chemistry in
single molecular bonds. Annu Rev Biophys Biomol Struct 30:105-128. 21. Evans, E., andK. Ritchie. 1997. Dynamic strength of molecular adhesion bonds.
Biophys J 72:1541-1555.

17

18
4003002001000
Unfolding Force (pN)
Freq
uenc
y
C)
Figure 2

19
i =1
i =5
i =4
i =3
i =2
αʹ′ (
s-1)
# of
eve
nts
Dwell time ti (s) Pseudo dwell time t' (s)
A) B)
C)
# of
eve
nts
Figure 3
500
400
300
200
100
06543210
80
60
40
20
0
6543210
80
60
40
20
0
3.02.01.00.0
80604020
0
2.01.51.00.50.0
80604020
0
1.20.80.40.0
80604020
0
1.20.80.40.0
20
15
10
5
0
76543210

20
Figure 4

21
Supporting Online Information
Figure S1. Histograms for dwell time ti with i equals to 6 and 7. Red lines are single
exponential fits to the experimental data.

22
80604020
0
6543210
80604020
0
1.20.80.40.0
80604020
0
1.20.80.40.0
80604020
0
2.01.51.00.50.0
80604020
0
3.02.01.00.0
i=1
i=5
i=4
i=3
i=2
# of
eve
nts
Dwell time (s)
A)
i=1
i=5
i=4
i=3
i=2
Unf
oldi
ng P
roba
bilit
y
Dwell time (s)
B)
6543210
3.02.01.00.0
2.01.51.00.50.0
1.20.80.40.0
1.20.80.40.0
Figure S2. Comparing different fitting models to experimental data. A) Double
exponential fits (red lines) to the dwell time distributions (symbols). B) Power law fits
(blue lines) to the probability distribution (symbols). The probability distribution
(symbols) is calculated from the dwell time distribution (probability density function).
For comparison, single exponential fits to the probability distributions are also shown. It
is evident that the power law (blue line) does not describe the experimentally data.
23
Table S1. Comparison of different models to fit our experimental data.
i
Single
Exponential
y0+Aexp(-αx)
Double Exponential
y0+A1exp(-α1x)+ A2exp(-α2x)
Power Law
y0+xγ
Rate
constant
α
R2 Rate constant
and amplitude
α1 (Α1)
Rate constant and
amplitude
α2 (Α2)
R2 Power γ
R2
1 1.86
0.995
1.86 (52.1%) 1.86 (47.9%) 0.995 0.183 0.88
2 3.69 0.982
1.41 (14.7%) 4.50 (85.3%) 0.983 0.201 0.89
3 6.68 0.995 1.81 (8.4%) 7.74 (91.6%) 0.997 0.190 0.90
4 9.13
0.989
9.24 (52.7%) 9.24 (47.3%) 0.989 0.167 0.88
5 11.35 0.984
11.45 (52.3%) 11.45 (47.7%) 0.98 0.170 0.88
6 14.30
0.937
3.90 (e7.3%) 16.11 (92.7%) 0.938 0.185 0.90
7 16.56 0.950 4.06 (4.3%) 17.73 (95.7%) 0.951 0.179 0.88